Abstract
In this study, the friction factor of a turbulent pipe flow for dried rice malt extract solutions was experimentally reduced to that of a Newtonian fluid. The friction factor was measured for four types of solutions at different culture times and concentrations. The results indicate that the experimental data points of the test solutions diverged from the maximum drag reduction asymptote at and above Re√f ≅ 200~250 and aligned parallel to those of Newtonian fluids. This drag reduction phenomenon differed from that observed in artificial high-molecular-weight polymer solutions, called Type A drag reduction, in which the drag reduction level is dependent on the Reynolds number in the intermediate region. This is classified as a Type B drag reduction phenomenon in biopolymer solutions and fine solid particle suspensions. The order of drag reduction corresponded to approximately 5–50 ppm xanthan gum solutions, as reported previously. Furthermore, the velocity profile in a turbulent pipe flow was predicted using a semi-theoretical equation in which the friction factors were determined using the difference between the experimental results of the tested solutions and Newtonian fluids. The results indicate considerable thickening of the viscous sublayer in the turbulent pipe flow of the test solutions compared with that of Newtonian fluids.
1. Introduction
Some high-molecular-weight polymers reduce drag [1] in turbulent flows in pipes. Consequently, considerable research has been conducted on pipe flow to elucidate the mechanism of the drag reduction phenomenon [2], as well as on the application of polymeric drag-reducing additives to save energy in crude oil pipeline systems [3]. Although polymer additives reduce drag, discarded artificial high-molecular-weight polymers do not decompose naturally. Thus, this drag reduction method is not environmentally friendly for application in open-pipeline systems. Therefore, biopolymers [4], particularly biodegradable ones, have been extensively investigated.
Hoyt [5] clarified that phytoplankton exudates in culture media and extracts from littoral algae contain significant quantities of extracellular materials with molecular weights of over 50,000 and conducted turbulent flow measurements using a special rheometer. Based on the results of phytoplankton cultures, algae are a source of extremely high-molecular-weight substances in the sea. It was shown that the red alga Porphyridium cruentum typically produced friction reductions as high as 60%, and seaweed samples in Chlorophyta, Phaeophyta and Rhodophyta exhibited major changes in the corresponding turbulent friction coefficients. In some cases, the friction was less than 1/2 of that of pure seawater. From the result, it was concluded that algal exudates can be a prominent source of high-molecular-weight compounds in the sea. Therefore, Polysaccharides, constitutive components of biopolymers, have been of research interest.
Wyatt et al. [6] showed that dilute solutions of many polysaccharides have lower frictional resistances in turbulent flows in pipes than they do in pure water. Furthermore, the drag reduction of xanthan gum solutions [7] and the flow characteristics of guar gum solutions [8] have been investigated, considering the application of polysaccharide solutions based on natural biodegradable polymers.
Peterson et al. [9] used yeast to produce polysaccharides as a promising new drag-reducing additive. They studied the relationships among the primary, secondary and tertiary structures of polysaccharides that exhibit the rheological properties of drag reduction in turbulent flows. They found an exopolysaccharide from the yeast Cryptococcus laurentii. The exopolysaccharide possessed a high molecular weight but exhibited lower drag reduction than expected. Earlier correlations by Hoyt showed that beta 1, 3, beta 2, 4 and alpha 1, 3 linkages in polysaccharides favored drag reduction; these were expanded to include correlations with secondary structures. The results showed that drag reduction can be achieved using a substance that can produce polysaccharides. Petersen et al. [10] investigated yeast strains that can be cultured on methanol, ethanol or glucose to produce exopolysaccharides that reduce friction in turbulent liquid flows.
These studies clarified that an aqueous solution of polysaccharide leachate and its products causes drag reduction in turbulent flow regions. However, there is limited experimental data over an extensive Reynolds number (Re) range, including laminar flows. In addition, the friction factors and velocity profiles in these regions have not been extensively investigated.
Therefore, in this study, we experimentally investigated pipe friction characteristics under laminar and turbulent flows using dried malted rice as a drag-reducing additive. Dried malted rice produces polysaccharides in water, similar to yeast. The malt is a type of mold and has two main types: dried malt and raw malt. However, as raw malt is susceptible to bacteria and tends to deteriorate in quality to self-fermentation, it is difficult to preserve. Therefore, dried malt was used to compensate for the shortcomings and is included in the production of soy sauce, miso and other fermented foods in Japan, besides other Asian countries.
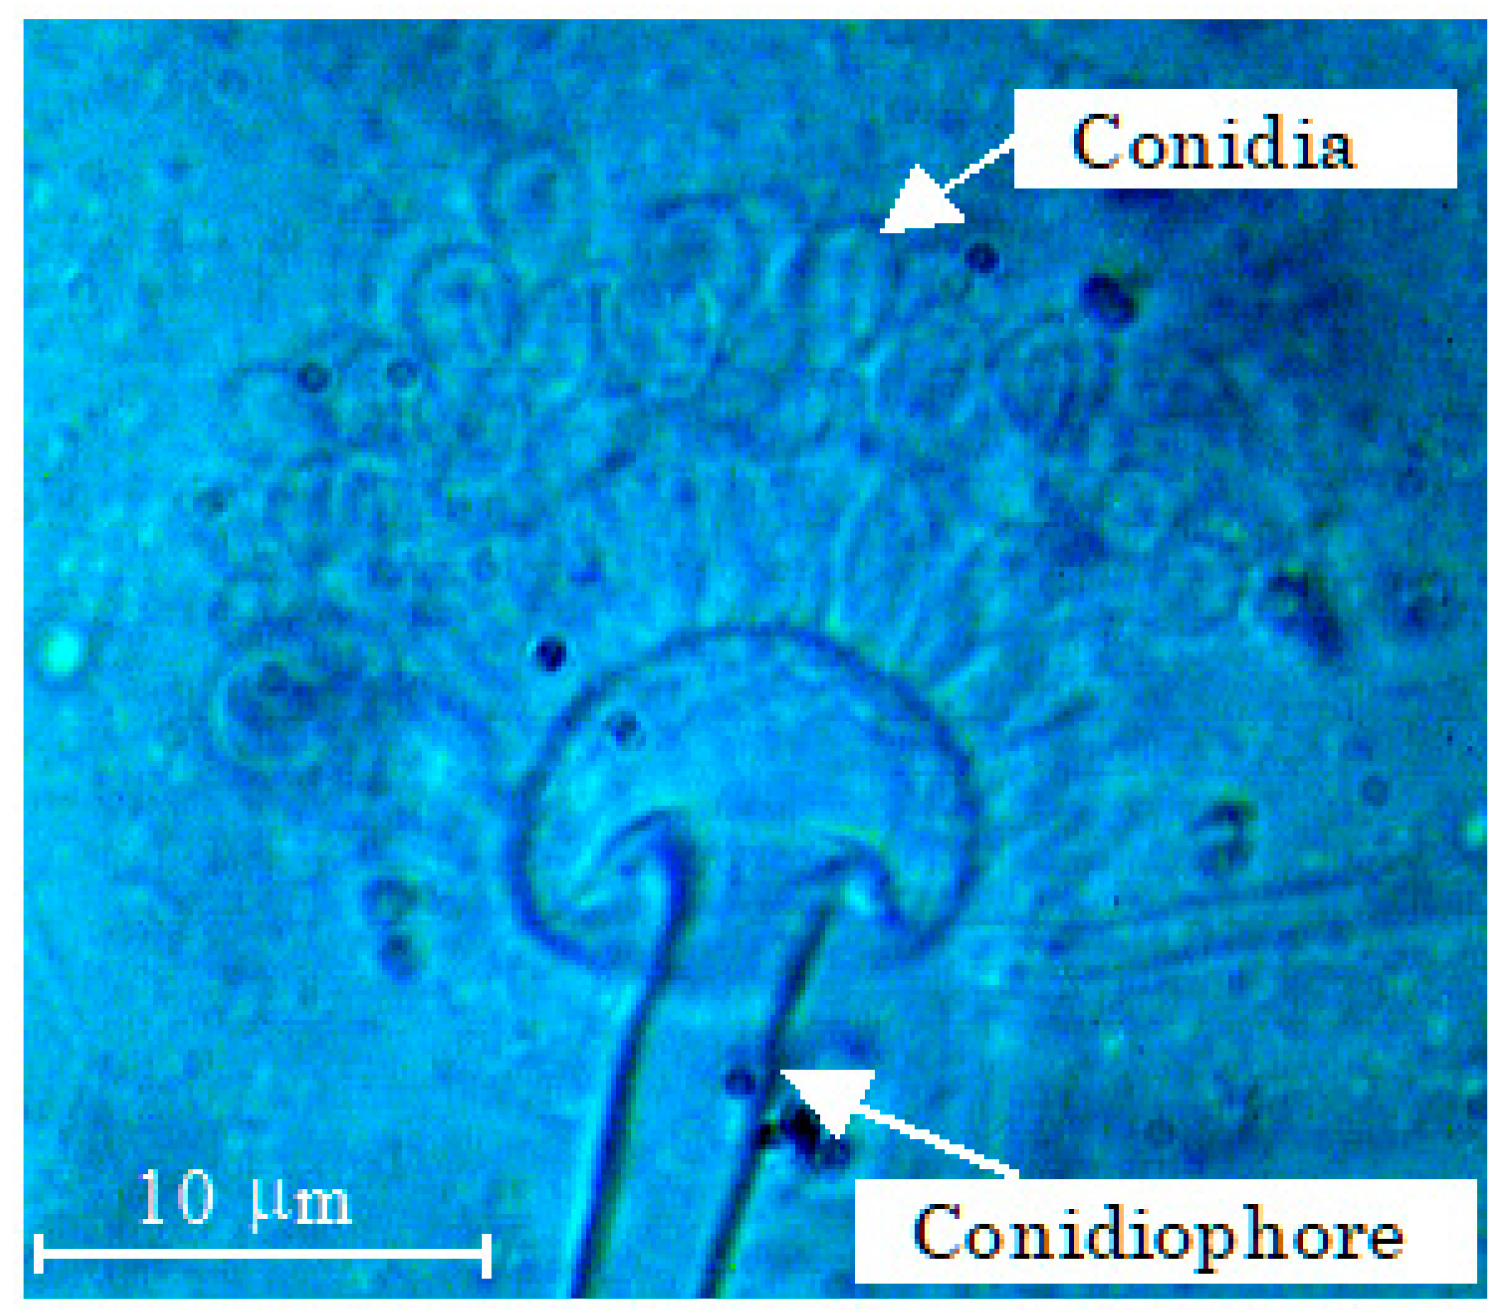
Figure 1 presents Aspergillus oryzae extracted from the dried malted rice used in this study. Aspergillus oryzae is a type of fungus that produces and releases starch and proteins from the tips of its hyphae.

Figure 1.
Micrograph of Aspergillus oryzae extracted from dried malted rice.
Turbulent drag reduction using dried malted rice has not been reported previously. The flow behavior of the biopolymer was described, and the velocity profile was predicted using a semi-theoretical equation in the turbulent flow region in which drag reduction occurs.
2. Experimental Methods
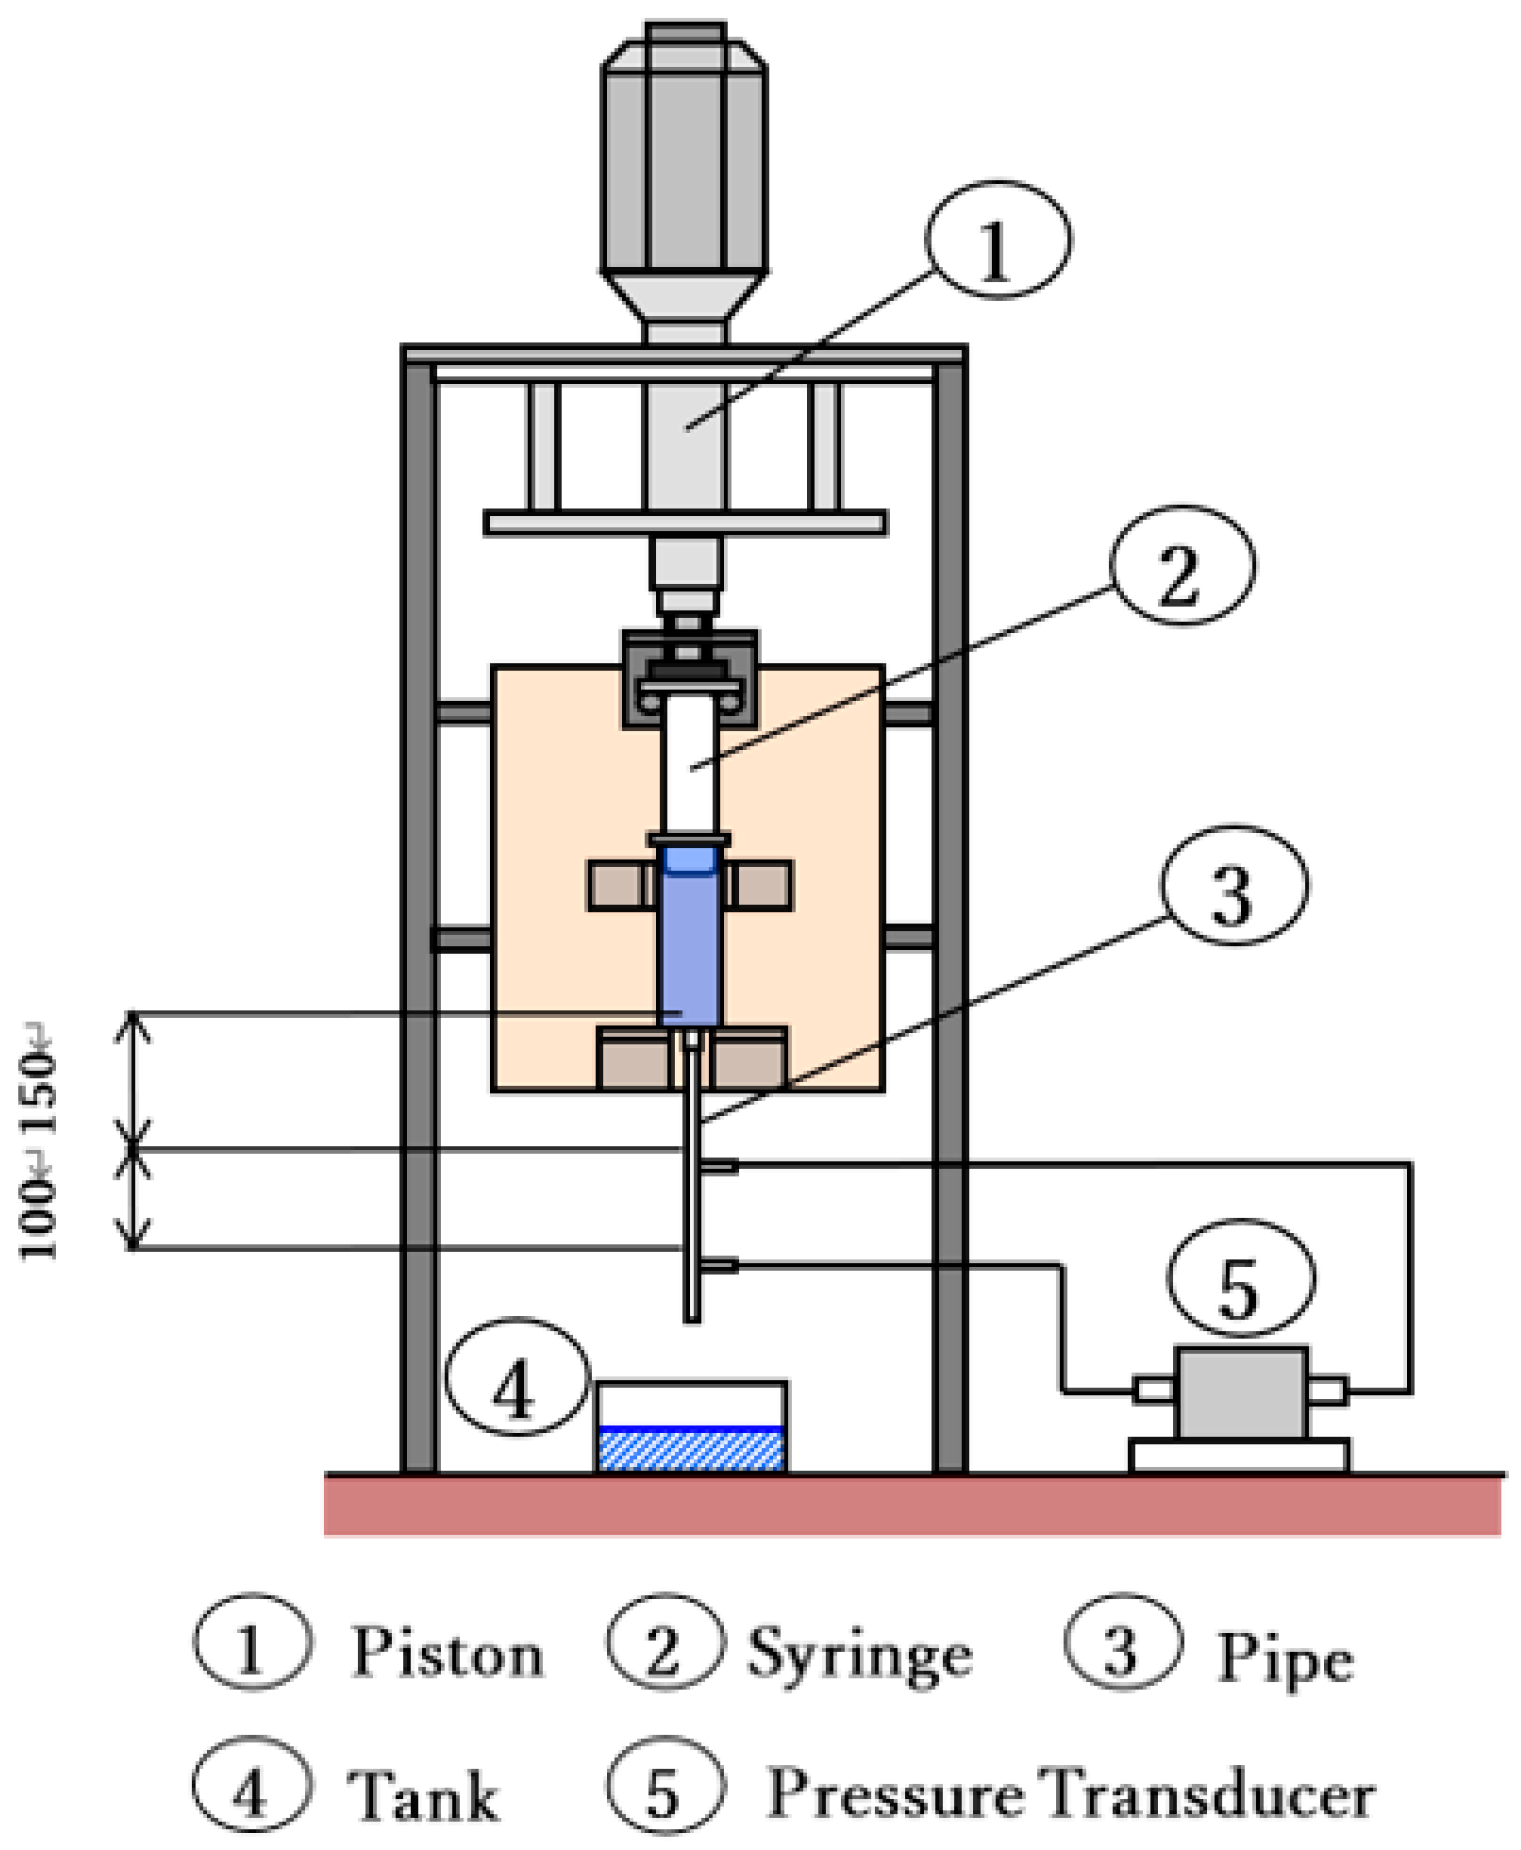
Drag reduction was measured using pressure loss in a circular pipe; the corresponding experimental equipment included a piston, syringe and test pipe, as shown in Figure 2. The syringe was hard heat-resistant glass with a volume of 200 mL.

Figure 2.
Experimental apparatus.
The tip of the syringe was an aluminum locking tip that could be installed with one touch for the measurement pipe. The syringe was 2000 mm in length with a smooth inner wall, the pipe had an outer diameter of 4 mm and an inner diameter of 2.01 mm, and the pipe end was cut off. The inner diameter was measured using an enlarged photograph of the cross section. The fully developed flow was obtained in the measurement section. For the pressure measurement, holes with a diameter of 0.3 mm were drilled at intervals of 100 mm. The pressure loss was determined using a variable pressure transducer with a measurement accuracy of % (Validyne DP15, Los Angels, CA, USA). The flow rate was varied by controlling the speed of the piston (Oriental Motor EZC6-20M, Tokyo, Japan). The piston extrusion speed could be set from 0.015 to 15 mm/s, which was transmitted to the piston via the teaching pendant. The speed was converted to a Reynolds number (Re) range, i.e., when Re < 1500, the range was 500 Pa, and when Re > 1500, the range was 35 kPa.
Aqueous test solutions were prepared using dried malted rice according to the following procedure.
- Dried brown rice with Aspergillus was added to water, and a constant temperature was maintained during the cultivation by using an incubator (TAITEC Bio Shaker BR-13UM, Koshigaya, Japan).
- The resulting hard cake in the liquid was removed, and the Aspergillus in the liquid was cultured for a period at 35 °C.
- Tap water was added to the culture, and these liquid solutions were used as test solutions.
The test solutions are listed in Table 1. The disaccharide contents in the aqueous test solutions were measured using a sugar content meter with a Brix accuracy of ±0.2%. Four solutions (A–D in Table 1) were tested under different preparation conditions. The filter was used to determine the presence of the drag-reducing substance in the test solutions by culturing dried malted rice. Fungi were cultured in water containing malt and photographed under a microscope. Fungal cells were collected from areas where conidia were formed. The size of the fungus, including conidia and conidiophore, was 5–10 μm. The flow curve confirmed that the dried malted rice test solutions were Newtonian fluids.

Table 1.
Composition of the test liquid and preparation conditions.
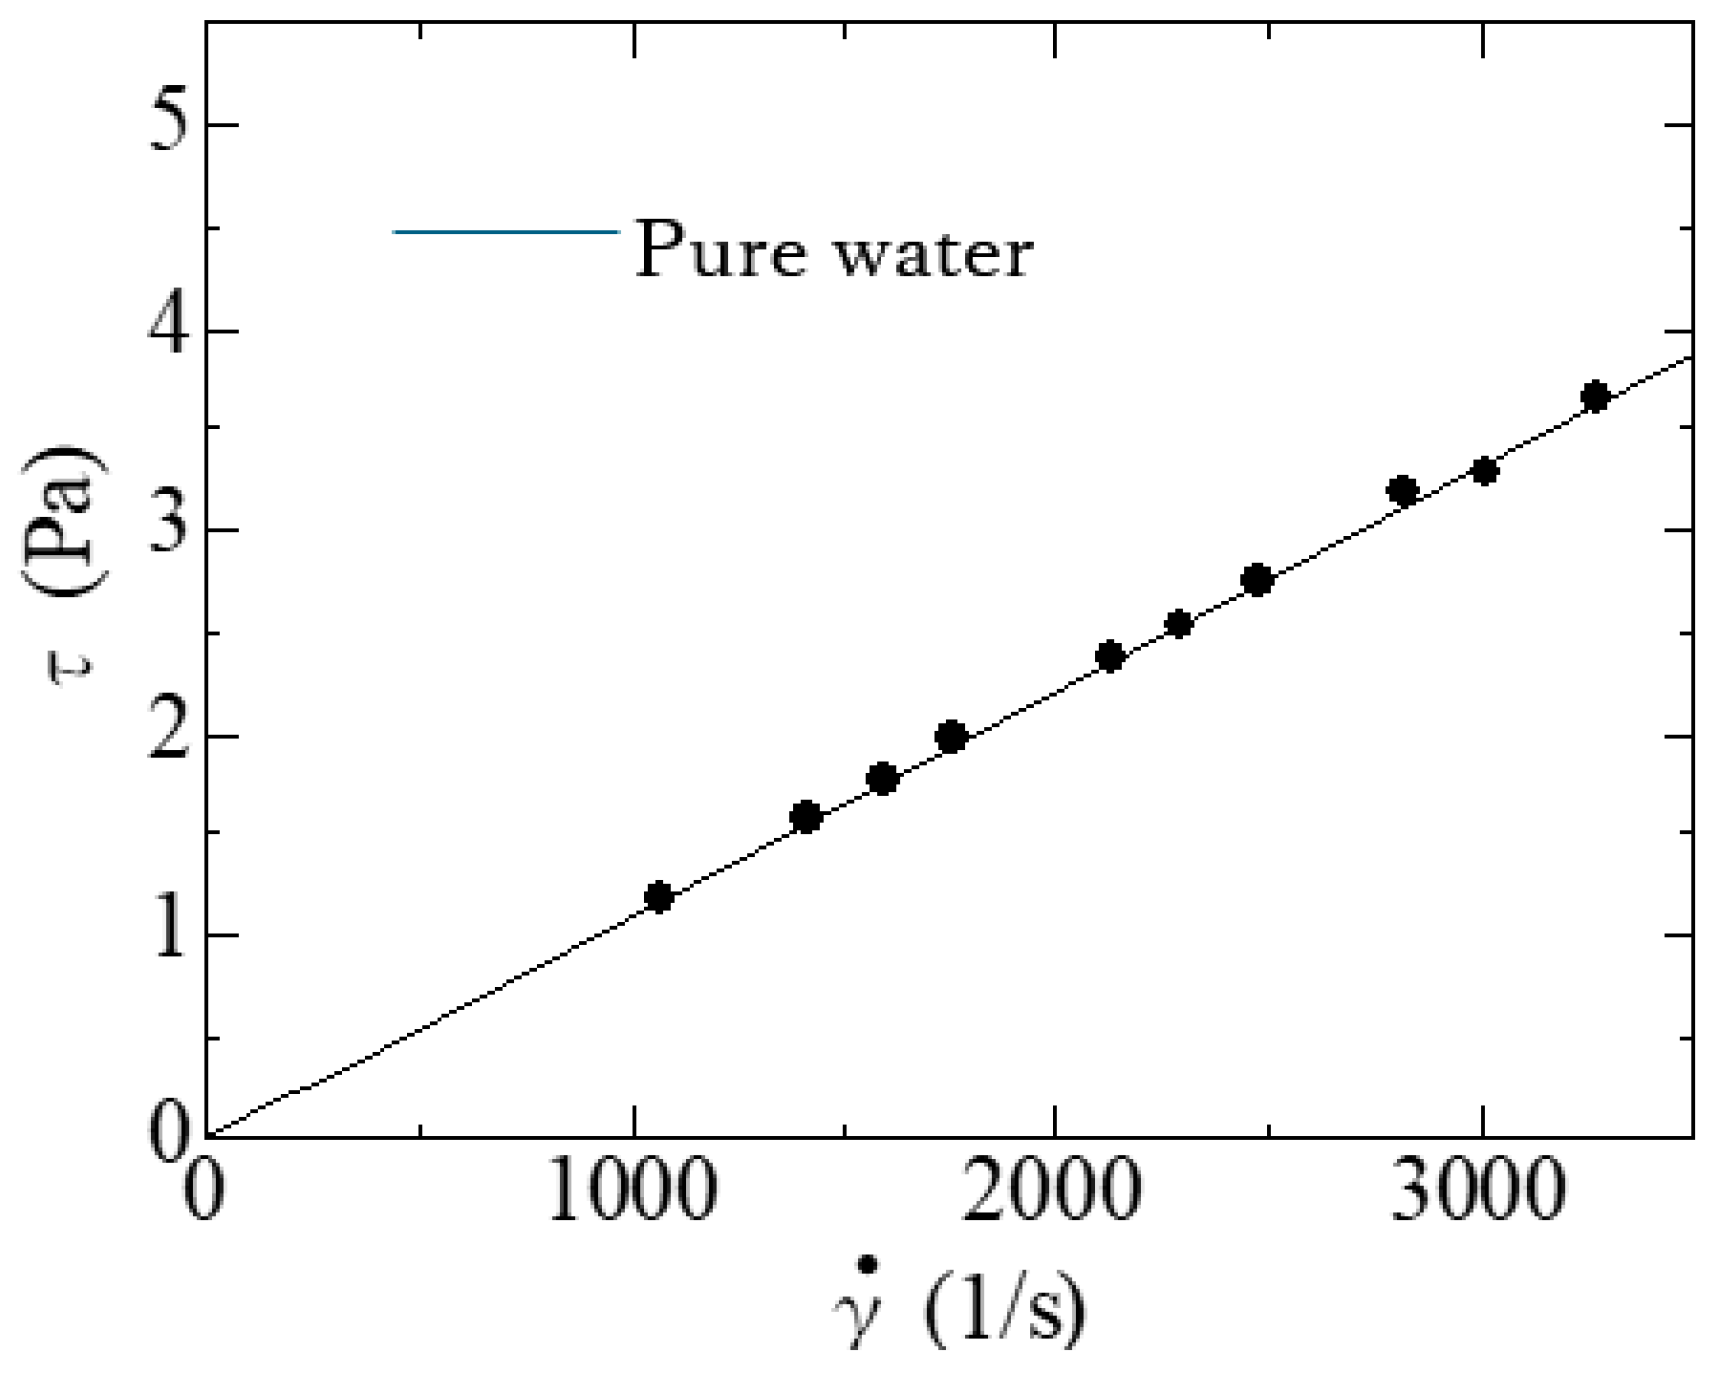
The measured range was 103((s−1)) in the shear rate. Figure 3 shows the experimental result on the flow curve of Solution B. The experimental data show that it can be regarded as a Newtonian fluid.

Figure 3.
Flow curve of Solution B.
3. Results and Discussion
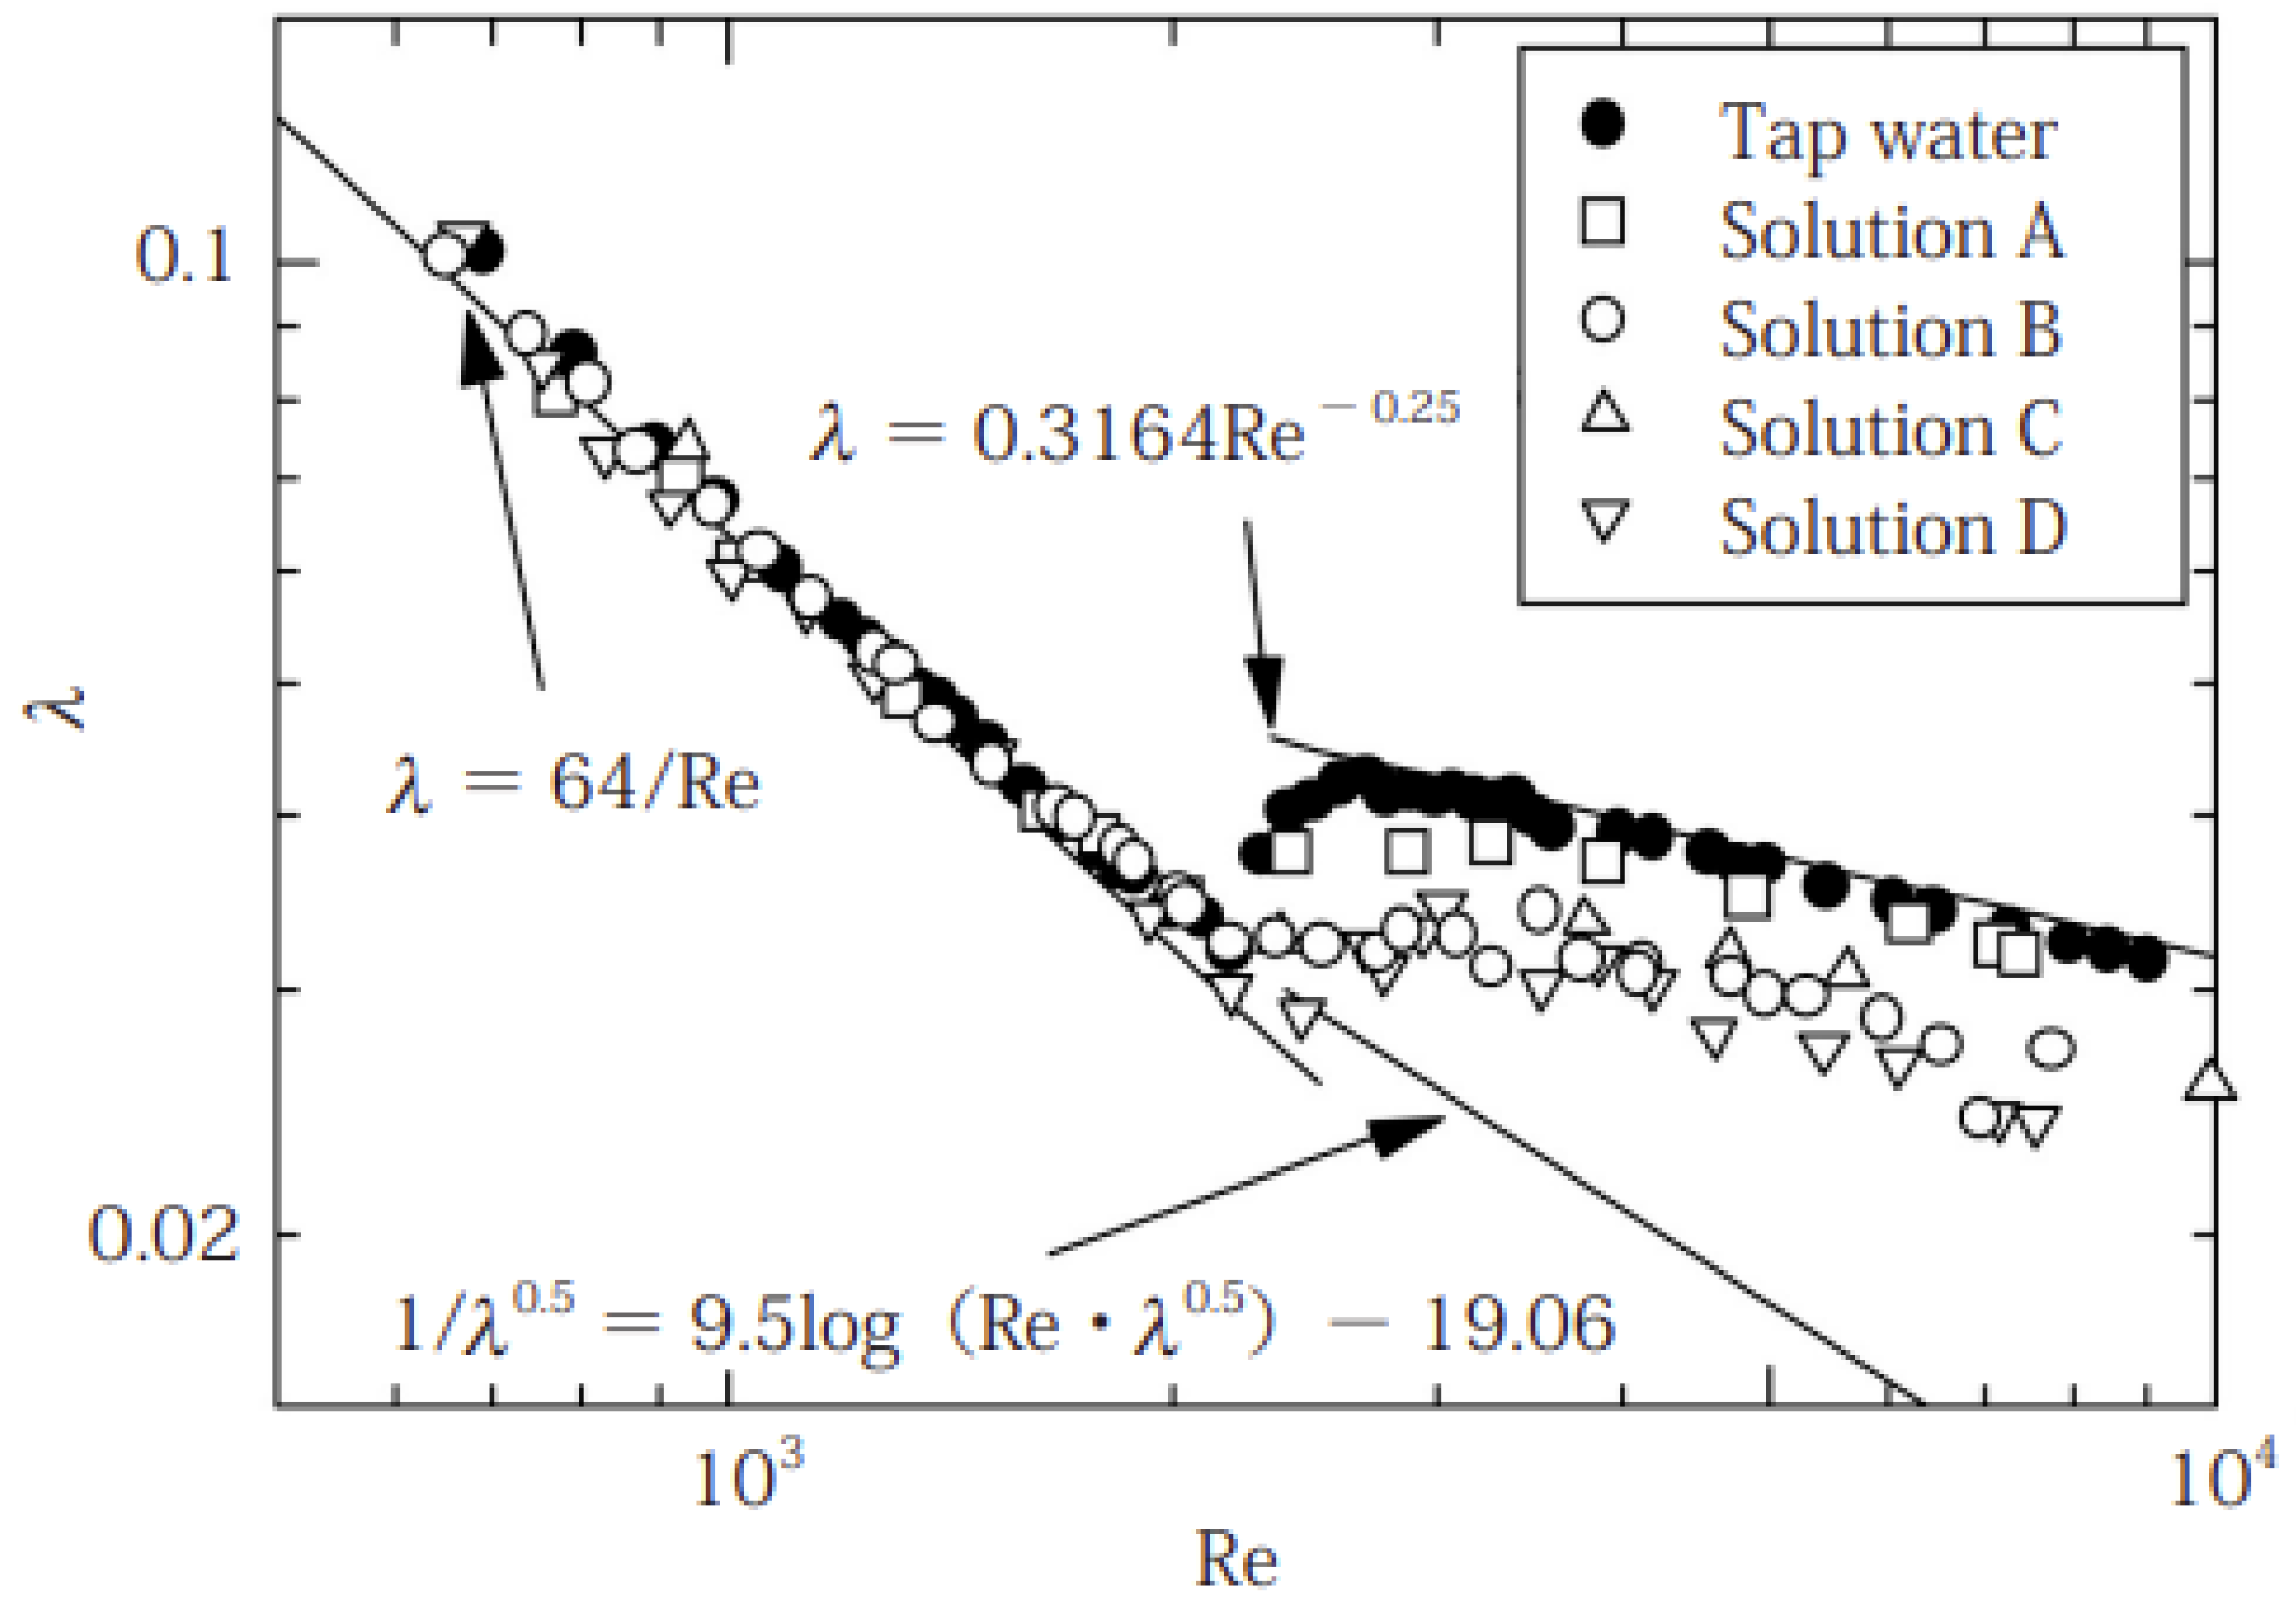
The experimental results for the friction factor λ based on the pressure loss data are shown in Figure 4. It is defined as , where and U are the pressure loss, pipe diameter, density and mean velocity, respectively. The Reynolds number is defined as using the kinematic viscosity ν. The reported value is the best estimate of the result, and with a 95% confidence limit, the value is believed to lie within of the estimated value in the laminar flow range. The friction factor of tap water matches well with that of Newtonian fluids in the laminar and turbulent flow ranges. Drag reduction occurred for all the test solutions. Table 2 lists the drag reductions (%). The maximum drag reduction was approximately 27%. In the friction factor vs. Re plots in Figure 4, the friction factors of these biopolymer solutions are parallel to and below those of water, which indicates Type B drag reduction [11,12]. This phenomenon occurs in partially hydrolyzed polyacrylamide with linear random-coil-structured macromolecules in solution. Because the reduced friction factors of the test solutions were aligned parallel to those of Newtonian fluids, the drag reduction of the malt rice solutions was Type B.
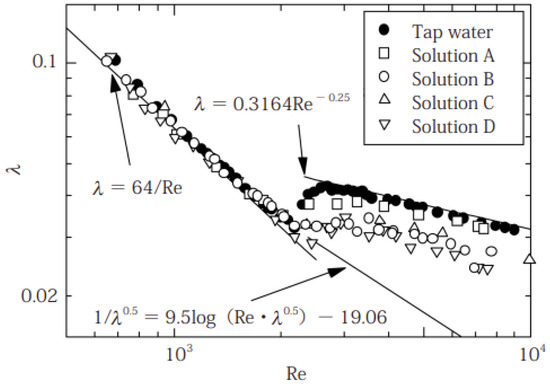
Figure 4.
Relationship between the friction factor and Reynolds number based on pressure loss. The three solid lines represent the results for Newtonian fluids and Virk’s Maximum Drag Reduction Asymptote (MDRA).
Table 2.
Drag reduction ratio at each Reynolds number. The numbers are percentages.
For Solution D, the transition Re increased compared with that of tap water. Drag reduction in Solution B was greater than that in Solution A, although the culture temperature and time remained the same (Table 1). The initial masses of dry malt were 500 g for Solution A. The most divergent solution preparation conditions involved the removal of the solid components after culturing using a filter mesh. The sizes of these meshes were 0.9 and 20 μm for Solution A and B, respectively. Aspergillus (5–10 μm) was removed with an extremely fine 0.9 μm filter. Solution C and D contained reduced amounts of dried malted rice and water compared to Solution A and B, respectively. The aqueous test solution with the largest drag reduction was Solution D, which required a shorter culture time than the other solutions. However, the current experimental data cannot be used to determine the culture conditions for a specific drag reduction %.
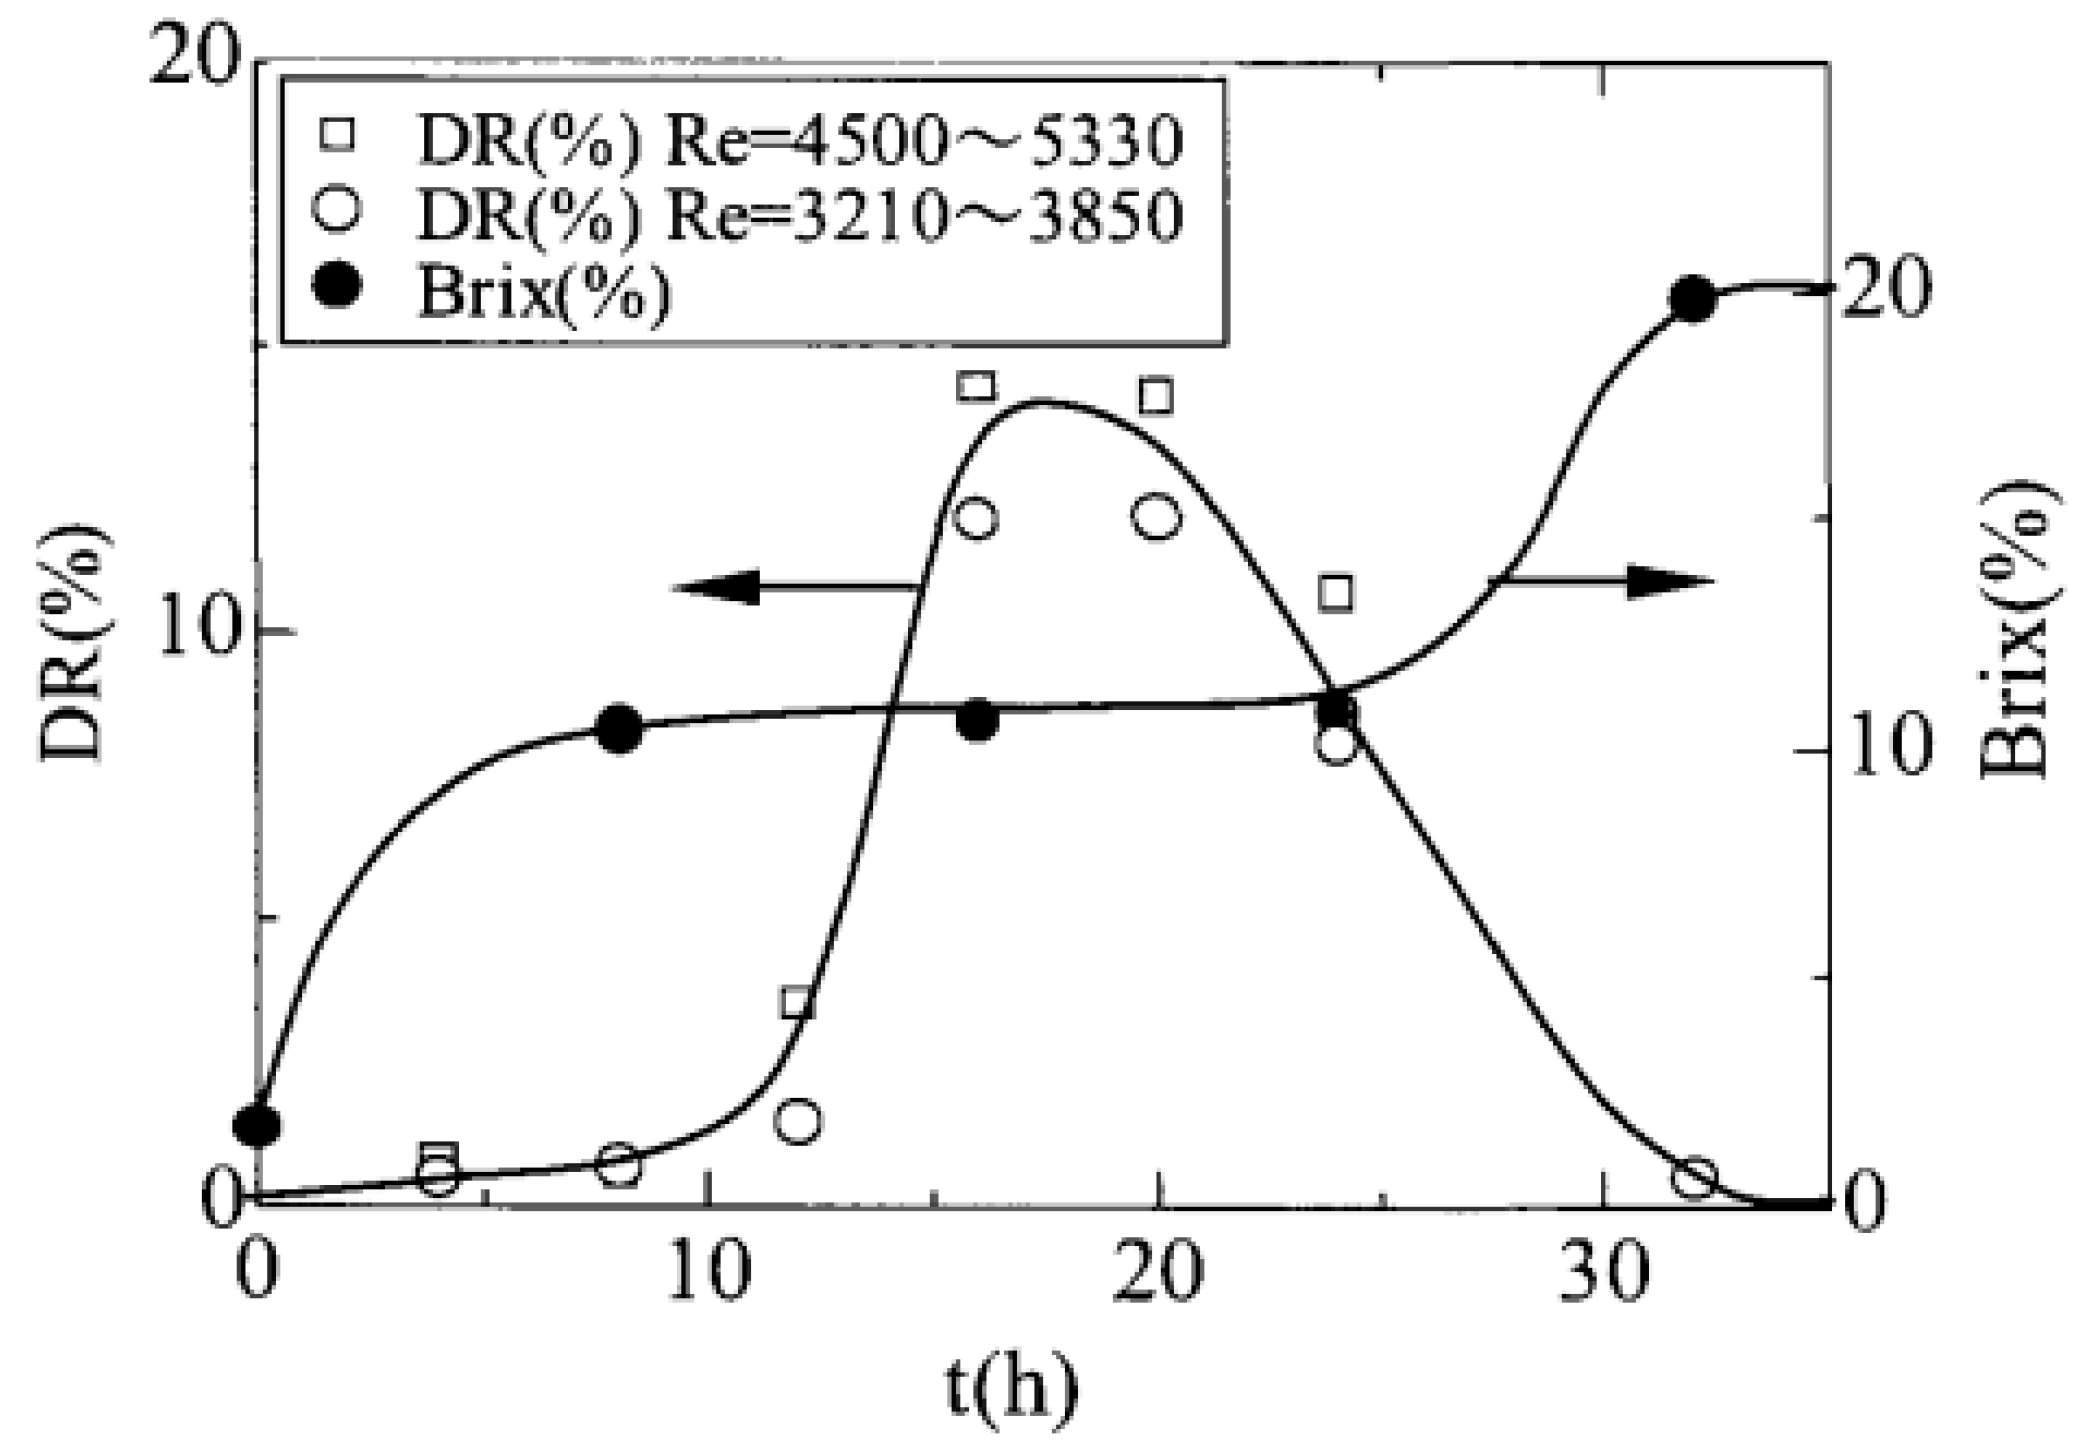
We determined the relationship between the sugar content (degrees Brix) resulting from the culture process and the culture time. Figure 5 shows the variations in drag reduction and sugar content with culture time for solutions with other preparation conditions, similar to those of Solution D. As shown in Figure 5, the number of disaccharides produced initially increased with cultivation time, plateaued with a further increase in cultivation time and then increased again with the cultivation time.

Figure 5.
Effect of cultivation time on drag reduction (DR) and sugar content for a solution with other preparation conditions, the same as those of Solution D.
The drag reduction % was maximized in the region where the sugar content remained constant over time during cultivation. Thus, it can be inferred that polysaccharides were produced by the cultivation of Aspergillus oryzae. However, the quantitative relationship between disaccharide content and drag reduction is unknown. The malt-to-water ratios were identical for Solution C and D. However, the drag reduction in Solution D was significantly higher than that in Solution C. It can be considered that, in Solution C, the cultivation of Aspergillus was in a state of saturation owing to the increased cultivation time.
The friction factor λ, based on the pipe pressure difference (Figure 4), can be used to conveniently calculate the pressure of pipeline systems. However, it is not sufficient for analyzing the flow behavior of a circular pipe. The friction factor f based on the shear stress τw acting on the pipe wall was used to obtain the relationship between the friction factor and velocity profile. This relationship is necessary for explaining the onset and mechanism of the drag reduction phenomenon.
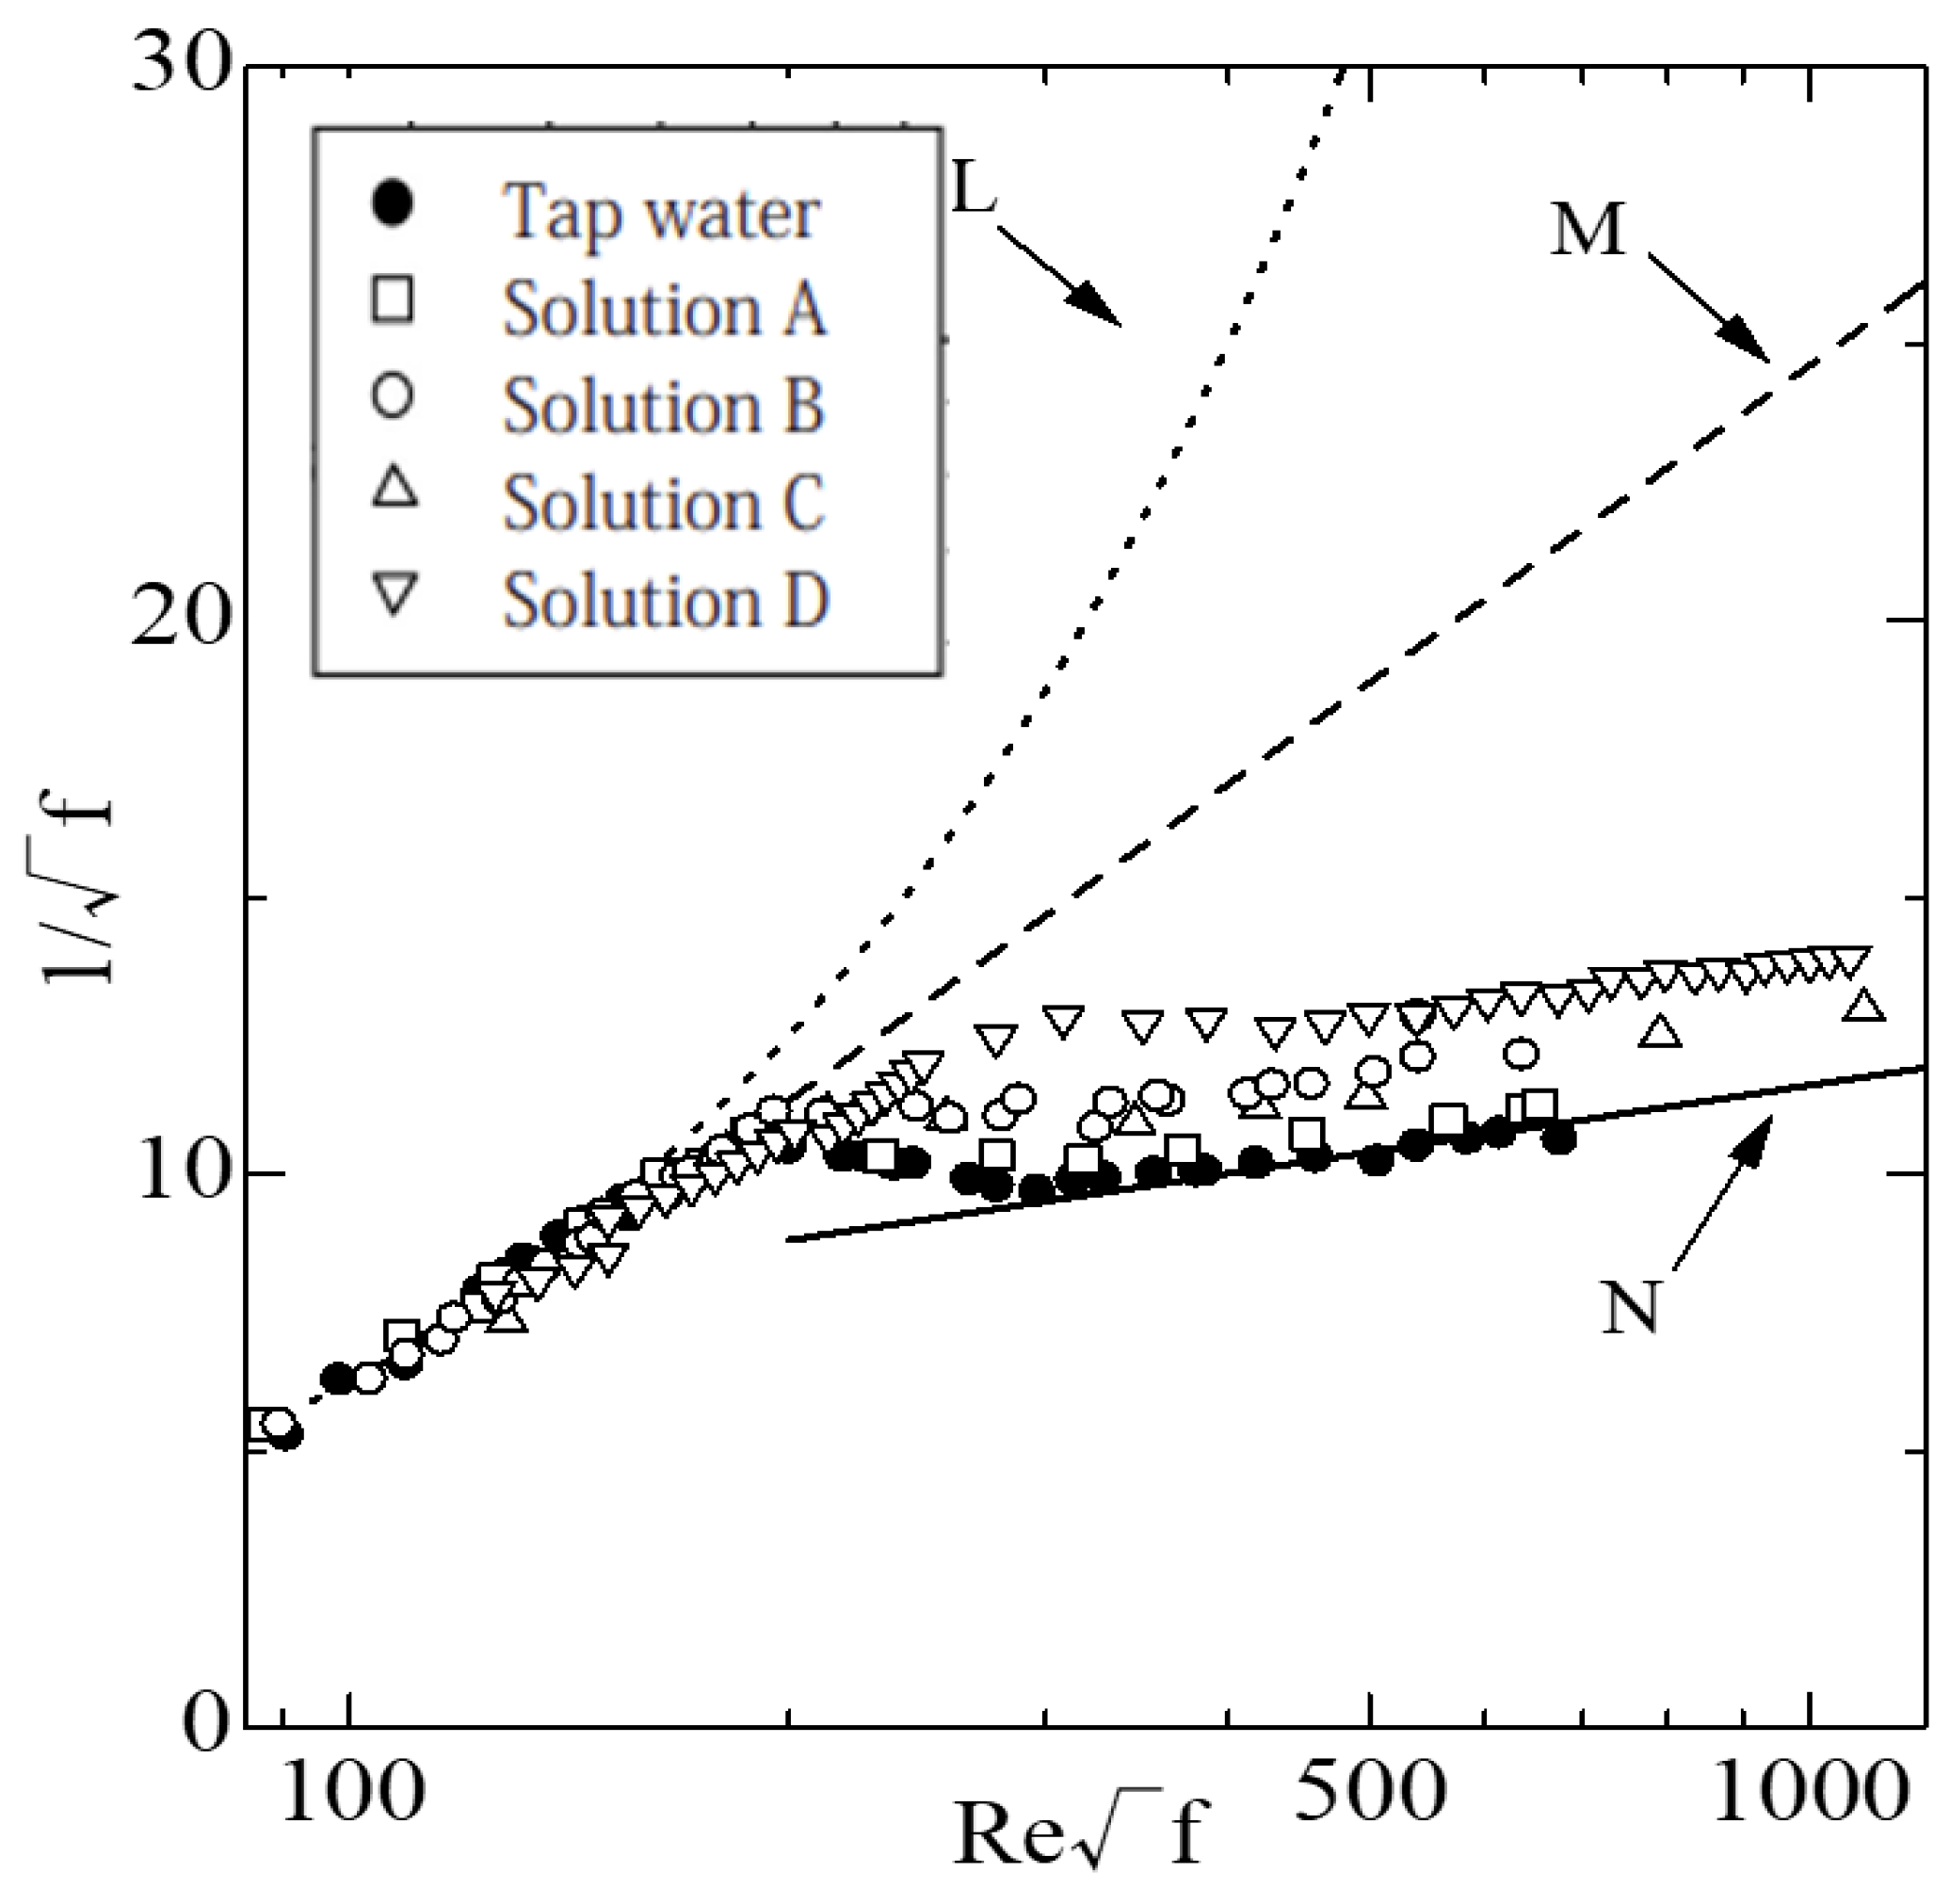
Figure 6 shows the friction factor based on the wall shear stress. As mentioned above, the friction factor f is defined as . In Figure 6, L (dotted line) and N (solid line) represent the results for the laminar and turbulent flows of Newtonian fluids, respectively, and M (dashed line) is the MDRA (Maximum Drag Reduction Asymptote) obtained by Virk [13,14]. The experimental data points diverge from the MDRA at Re√f ≅ 200250 and align above and nearly parallel to N. According to the results, Re√f ≅ 200 marks the onset of the drag reduction phenomenon.
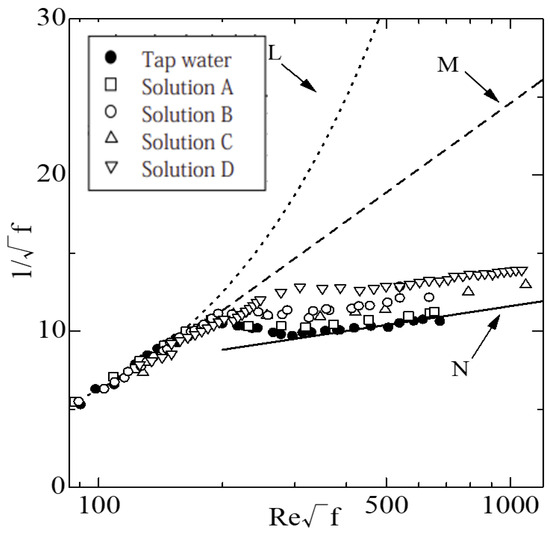
Figure 6.
Relationship between the friction factor and Reynolds number based on the pipe wall shear stress. Lines L and N represent the laminar flow solution and Prandtl–Karman semi-experimental formula, respectively. M represents Virk’s MDRA.
In the turbulent flow range, the experimental data points were aligned parallel to those of Newtonian fluids, which indicated Type B drag reduction. To understand flow behavior, it is necessary to analyze the velocity profile. Because the velocity profile in the pipe was not measured in this study, we predicted it using analytical results considering Type B drag reduction.
Virk [12] defined flow enhancement during Type B drag reduction as
where f and fn are the friction factors of the aqueous test solutions and the Newtonian fluid, respectively. The second term on the right side of Equation (1) represents the Prandtl–Karman equation:
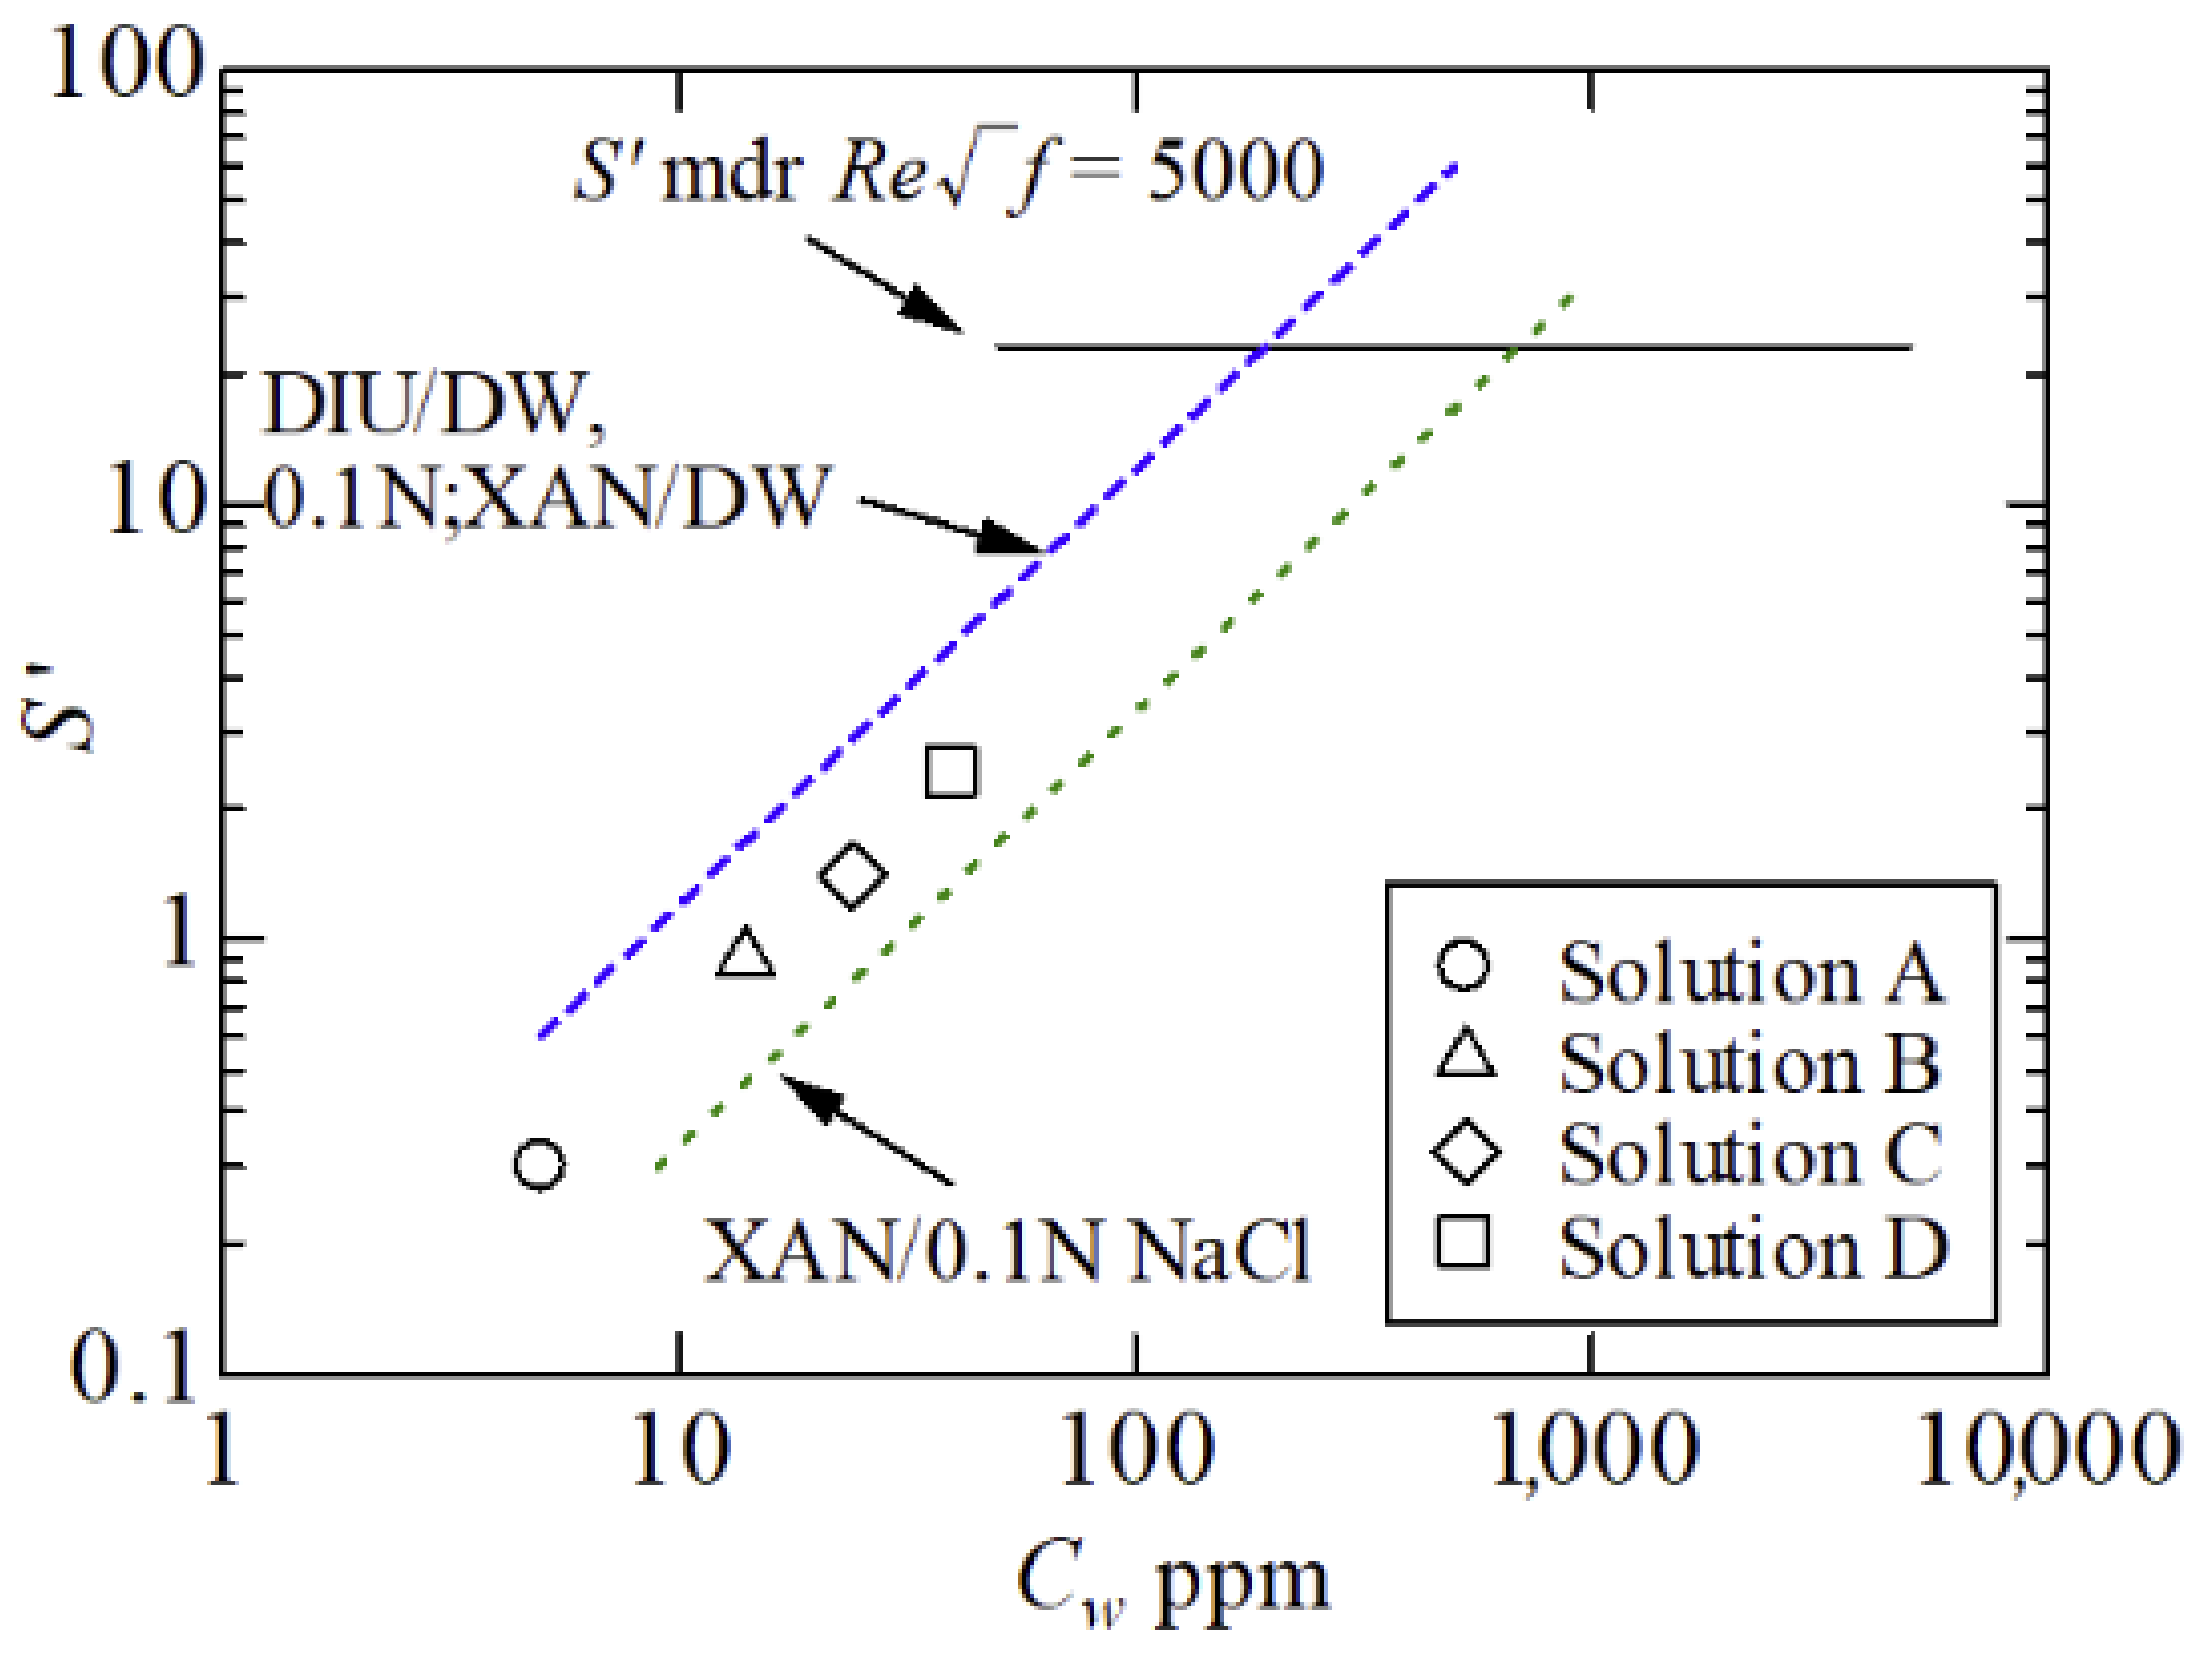
Because the concentrations of the aqueous test solutions could not be measured in this study, we estimated the concentration of the test solution by comparing it with that of the xanthan gum solution. The results of the test solutions were extrapolated from Virk’s data using S′ obtained from Equation (1), as shown in Figure 7. The broken line and solid line in Figure 7 show the results for Equation (1) and the maximum values for Virk’s xanthan gum solution, respectively. The experimental results of this study were extrapolated from the value of S’ using Virk’s result. As a result, Solution D and the Cw = 50 ppm xanthan gum solutions exhibited equivalent drag reduction characteristics.

Figure 7.
Values of S′ for malted rice (this study) and xanthan gum solutions (obtained from Virk [12]) with different concentrations. The solid and dashed lines are, in both cases, given by Virk and represent the value of the maximum drag reduction and the xanthan gum solution results, respectively.
The mean velocity in the pipe flow must be determined to determine the drag reduction mechanism. Watanabe and Ogata [14] derived an equation to predict the mean velocity by S′.
The mean velocity profile for a fully developed turbulent flow through a smooth pipe is
where and . is the mean velocity over time, and is the friction velocity (), where τw and ρ are the shear stress and density, respectively. The parameter y is the distance measured from the wall, y = (ɑ − r), where ɑ is the inner pipe radius.
Using an example from the experimental results for the friction factor of aqueous dried malted rice solutions in regions of turbulent flow, we assumed that the velocity profile is expressed by Equation (2).
The friction factor is calculated by
For Newtonian fluids, we set κ and C equal to 0.4 and 5.5, respectively. Thus, Equation (3) becomes
The constant 0.6 in Equation (4) must be modified so that the flow characteristics agree with the experimental data. Hence, we modified Equation (3) to
If ζ = 2/3, κ = 0.4 and C = 5.5 are substituted into Equation (5), we obtain the Prandtl–Karman formula:
Because the friction factor of the suspensions decreased parallel to those obtained using the Prandtl–Karman formula, as shown in Figure 3, it is reasonable to fix κ as a constant of 0.4. The substitution of Equation (5) into Equation (1) and modifying the constant value to fit that of Newtonian fluids when S′ = 0 yields
Equation (8) enables the prediction of the friction factors of Newtonian fluids. Finally, we estimated the mean velocity profile of the pipe flows of aqueous dried malted rice solutions using C from Equation (6), if the value of S’ was obtained from experimental data using the friction factor.
For example, using experimental values of S’ = 0.3 and S’ = 2.4, for Solution A and D from Figure 7, the velocity profile was estimated as
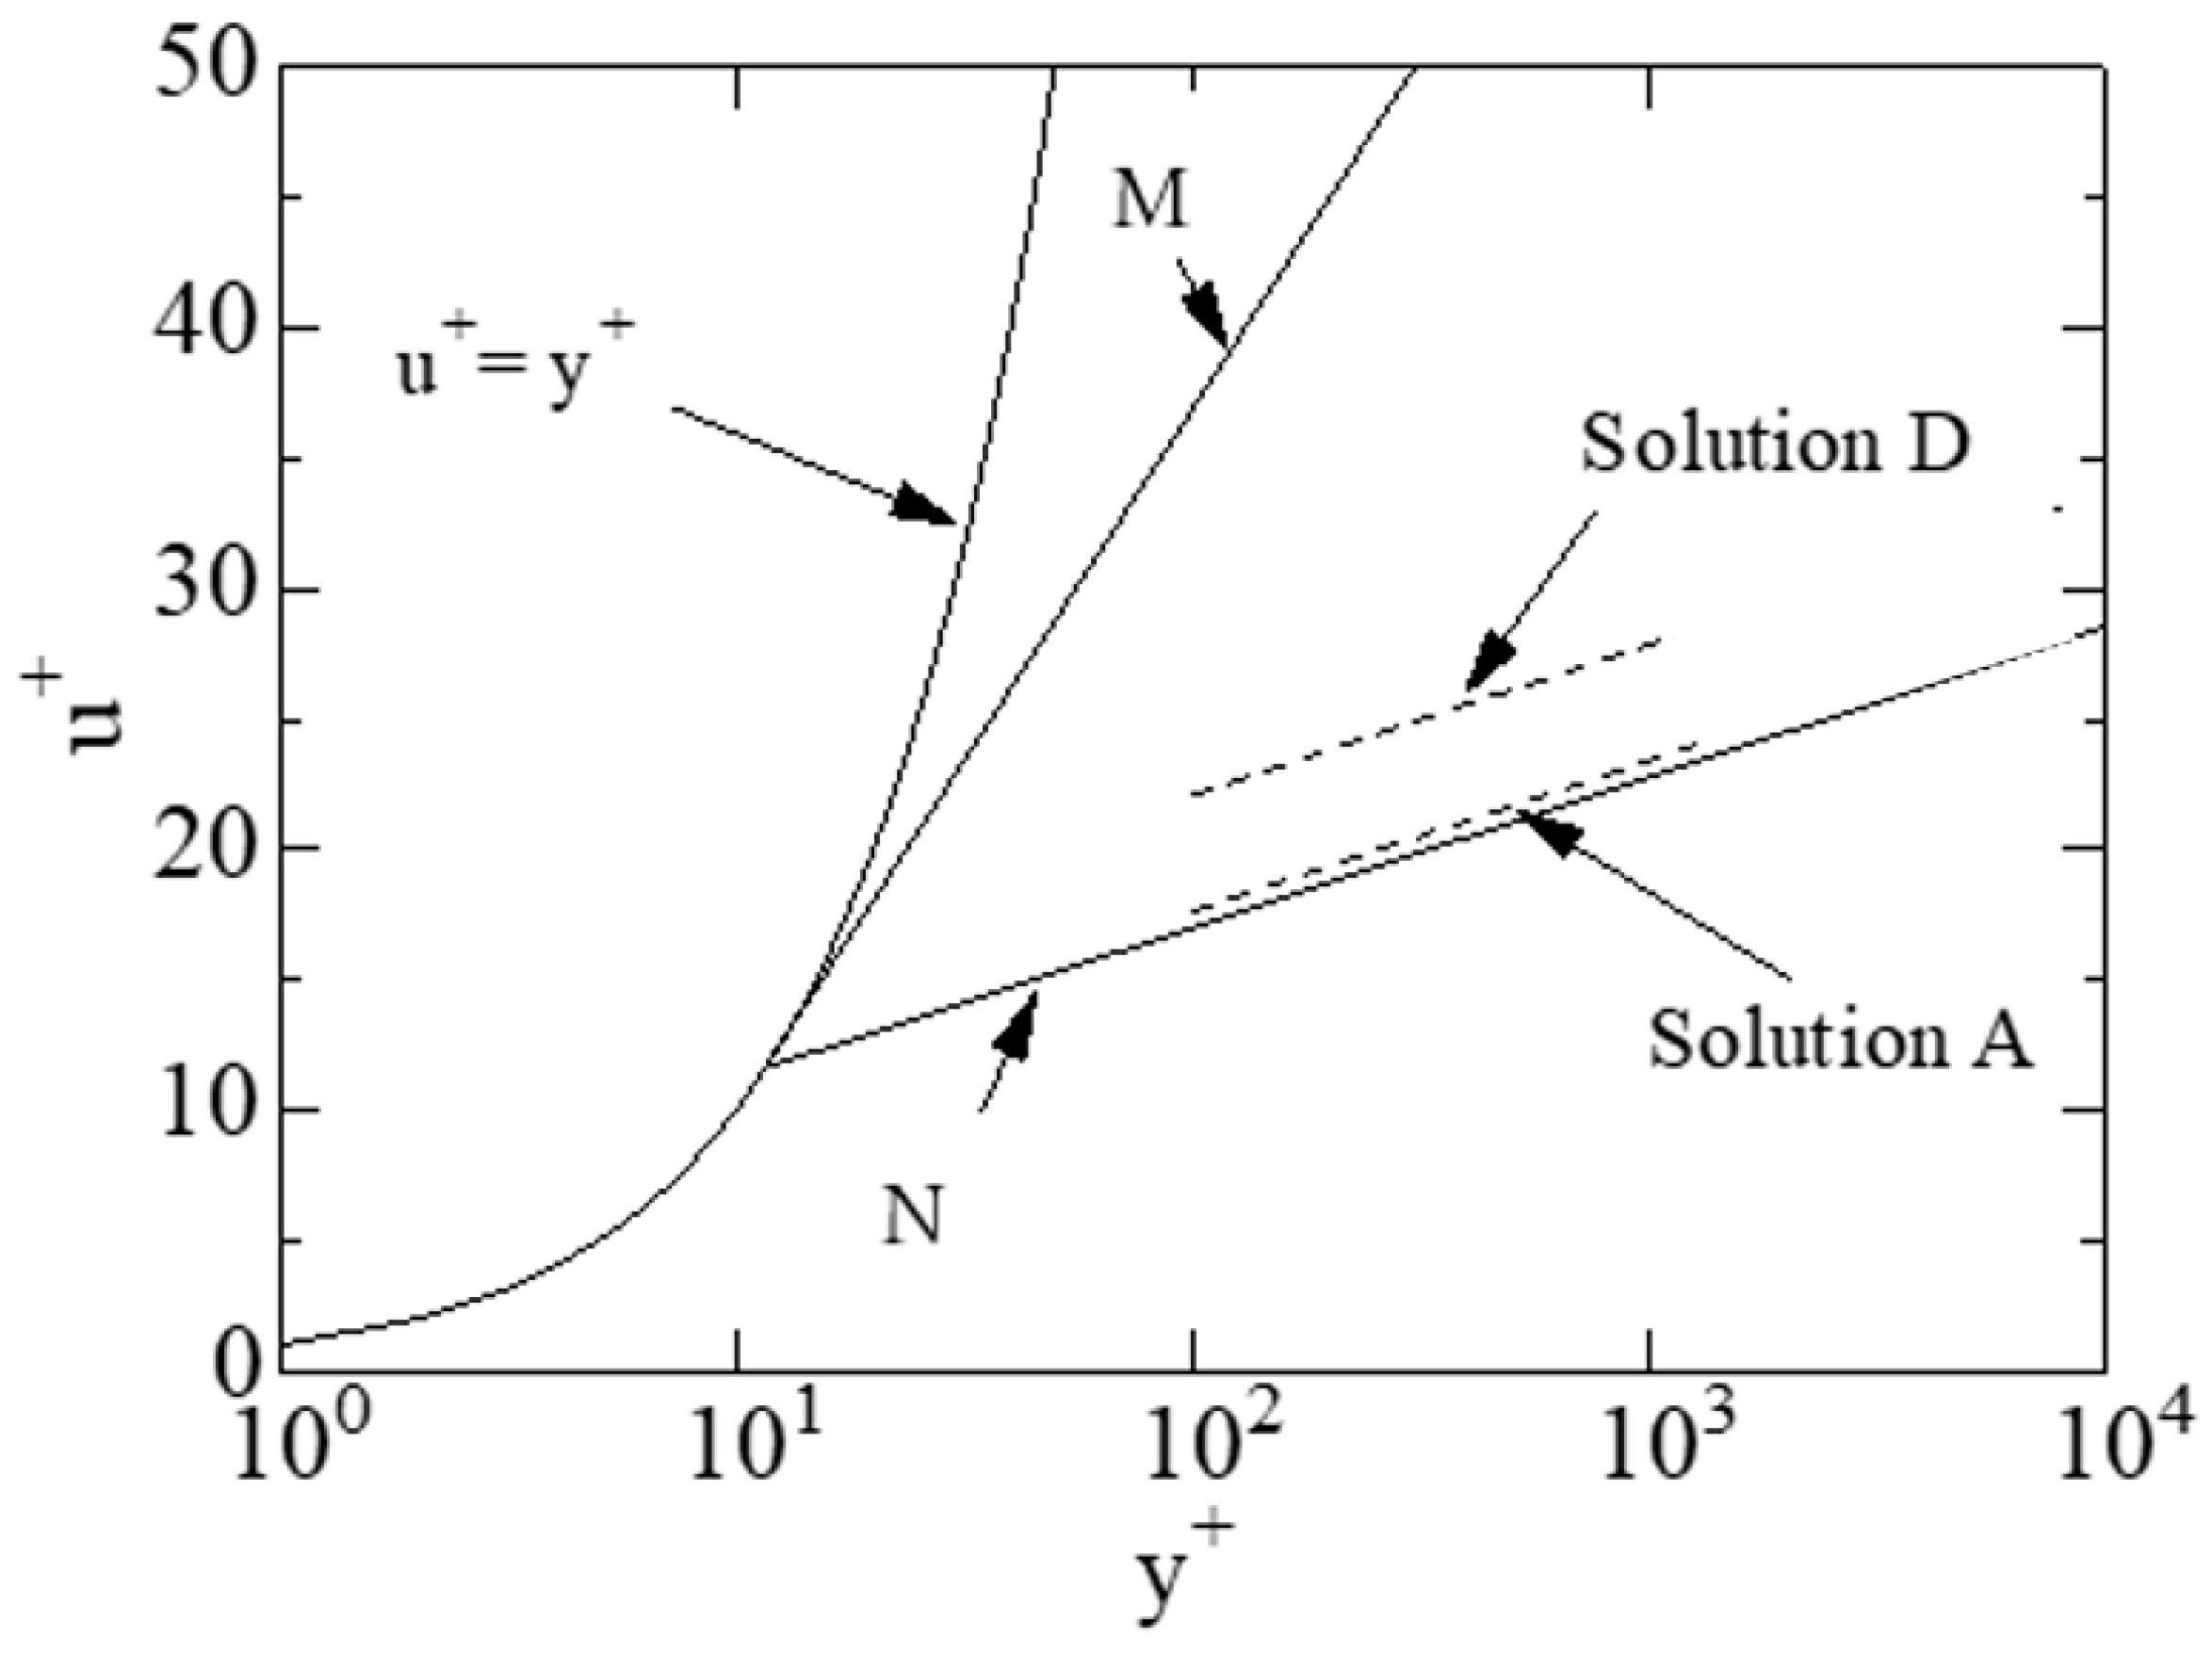
Figure 8 shows the predicted velocity profiles. The viscous layer thickens in the region where drag reduction occurs. Because the predicted velocity distribution shifts upward with an increasing drag reduction rate, the thickness of the viscous layer increases.

Figure 8.
Predicted velocity profiles of malted rice solutions in pipe flows. Line N represents the universal velocity profile in the turbulent flow range. M represents the ultimate velocity profile.
Japper-Jaafar, A., et al. [15] investigated experimentally drag reduction in a fully developed turbulent pipe flow of an aqueous solution of a rigid “rod-like” polymer, scleroglucan, at concentrations of 0.005% and 0.01% (similar to Type B drag reduction). Mean velocity profiles and turbulent fluctuation levels were measured using a laser Doppler anemometer. The experimental friction factor curves were parallel to those of Newtonian fluids, and the experimental friction factors were lower than those of Newtonian fluids. This finding is qualitatively consistent with the results of this study.
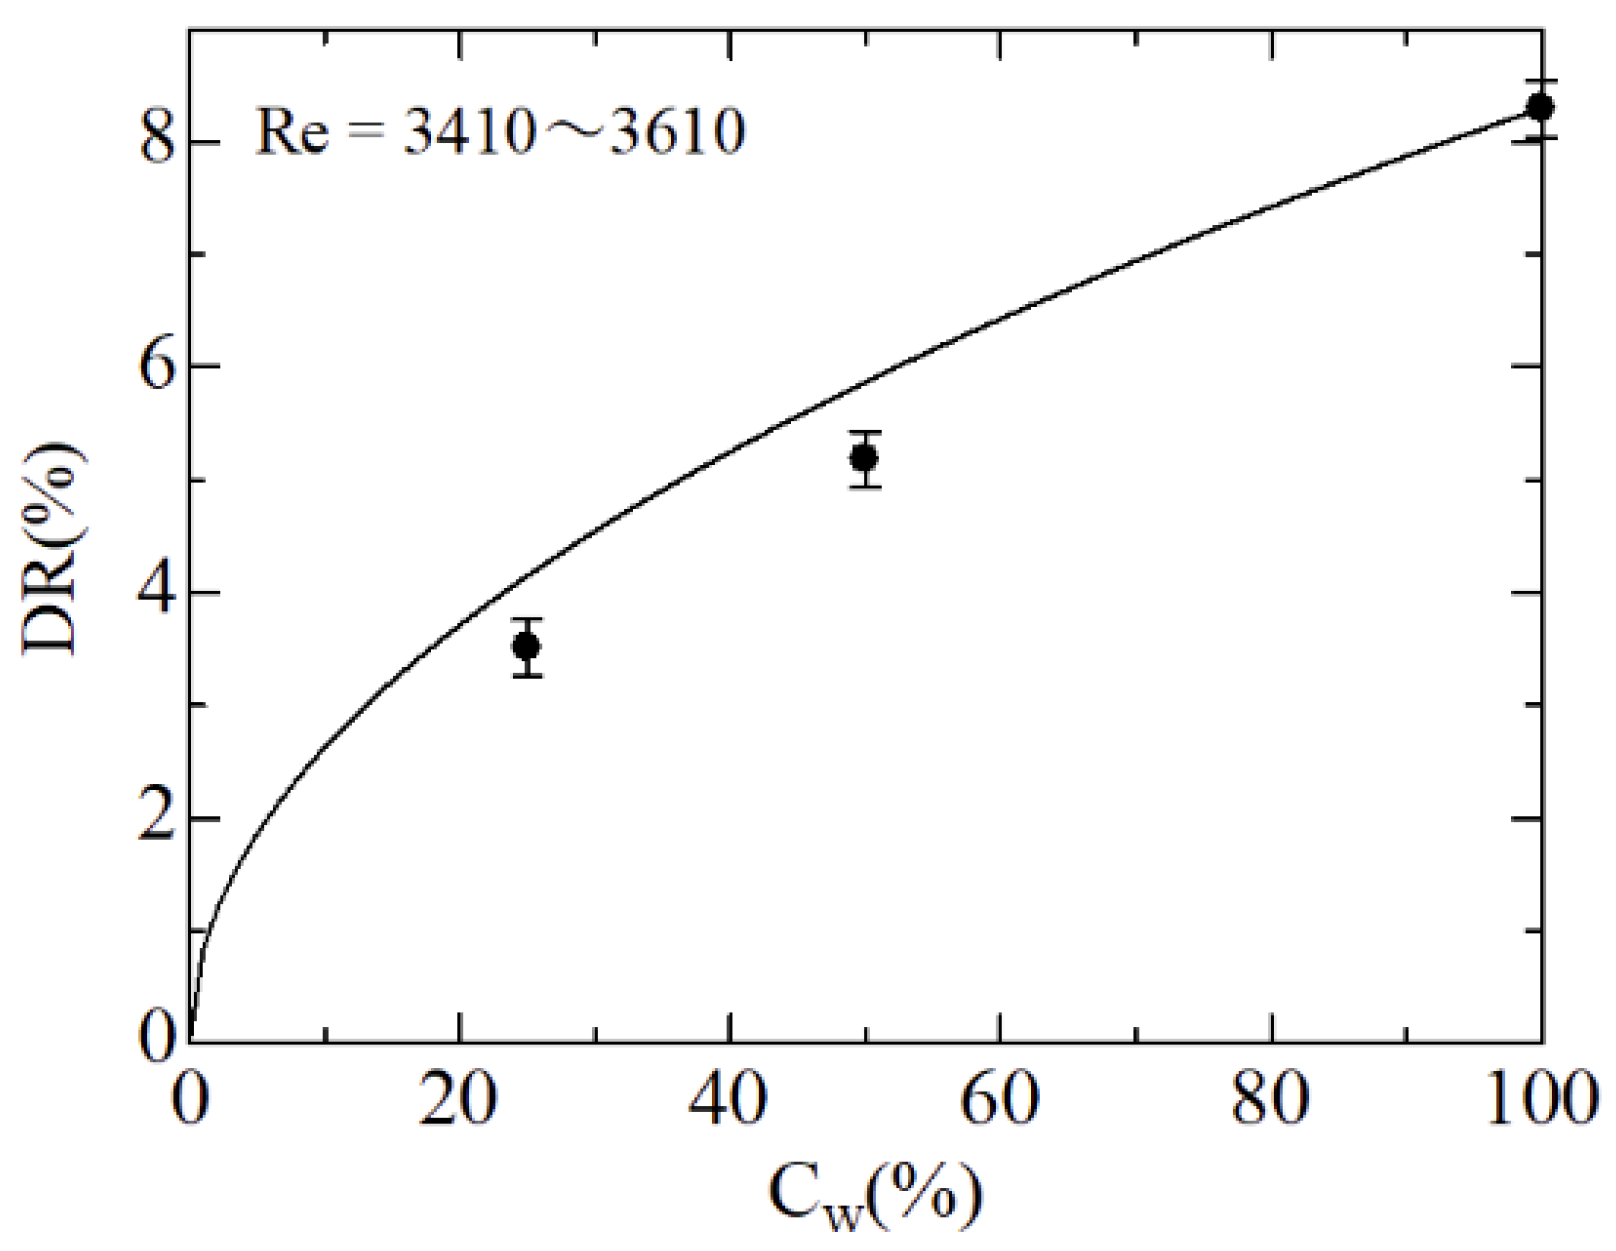
Moreover, predictions of the drag reduction ratio of diluted solutions are convenient for the actual application of this biopolymer solution. Figure 9 depicts the effect of the drag reduction of the diluted solution. The test solution was cultured under the same conditions as those of Solution D in Table 1. In the experiment, the stock solution was diluted twice and four times with water, and the drag reduction ratio was measured at Re = 3410~3610. As a result, the maximum drag reduction ratio was 8.3% at Re = 6 × 10³. The solid line in the figure is given by ; here, is a concentration, regarding 100% as 1. The results are in agreement with the experimental data, with errors of 11% and 15% at = 50% and 25%, respectively. Therefore, if the drag reduction ratio of the stock solution is known, the drag reduction ratio of the diluted solution can be predicted from within a 15% error range.
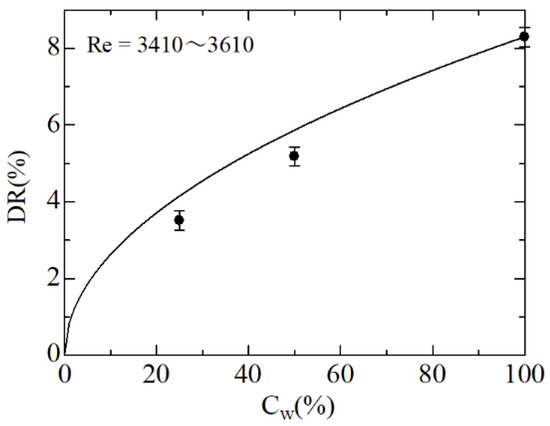
Figure 9.
Drag reduction of dilute solution. The undilute solution had the same preparation conditions as those for Solution D in Table 1.
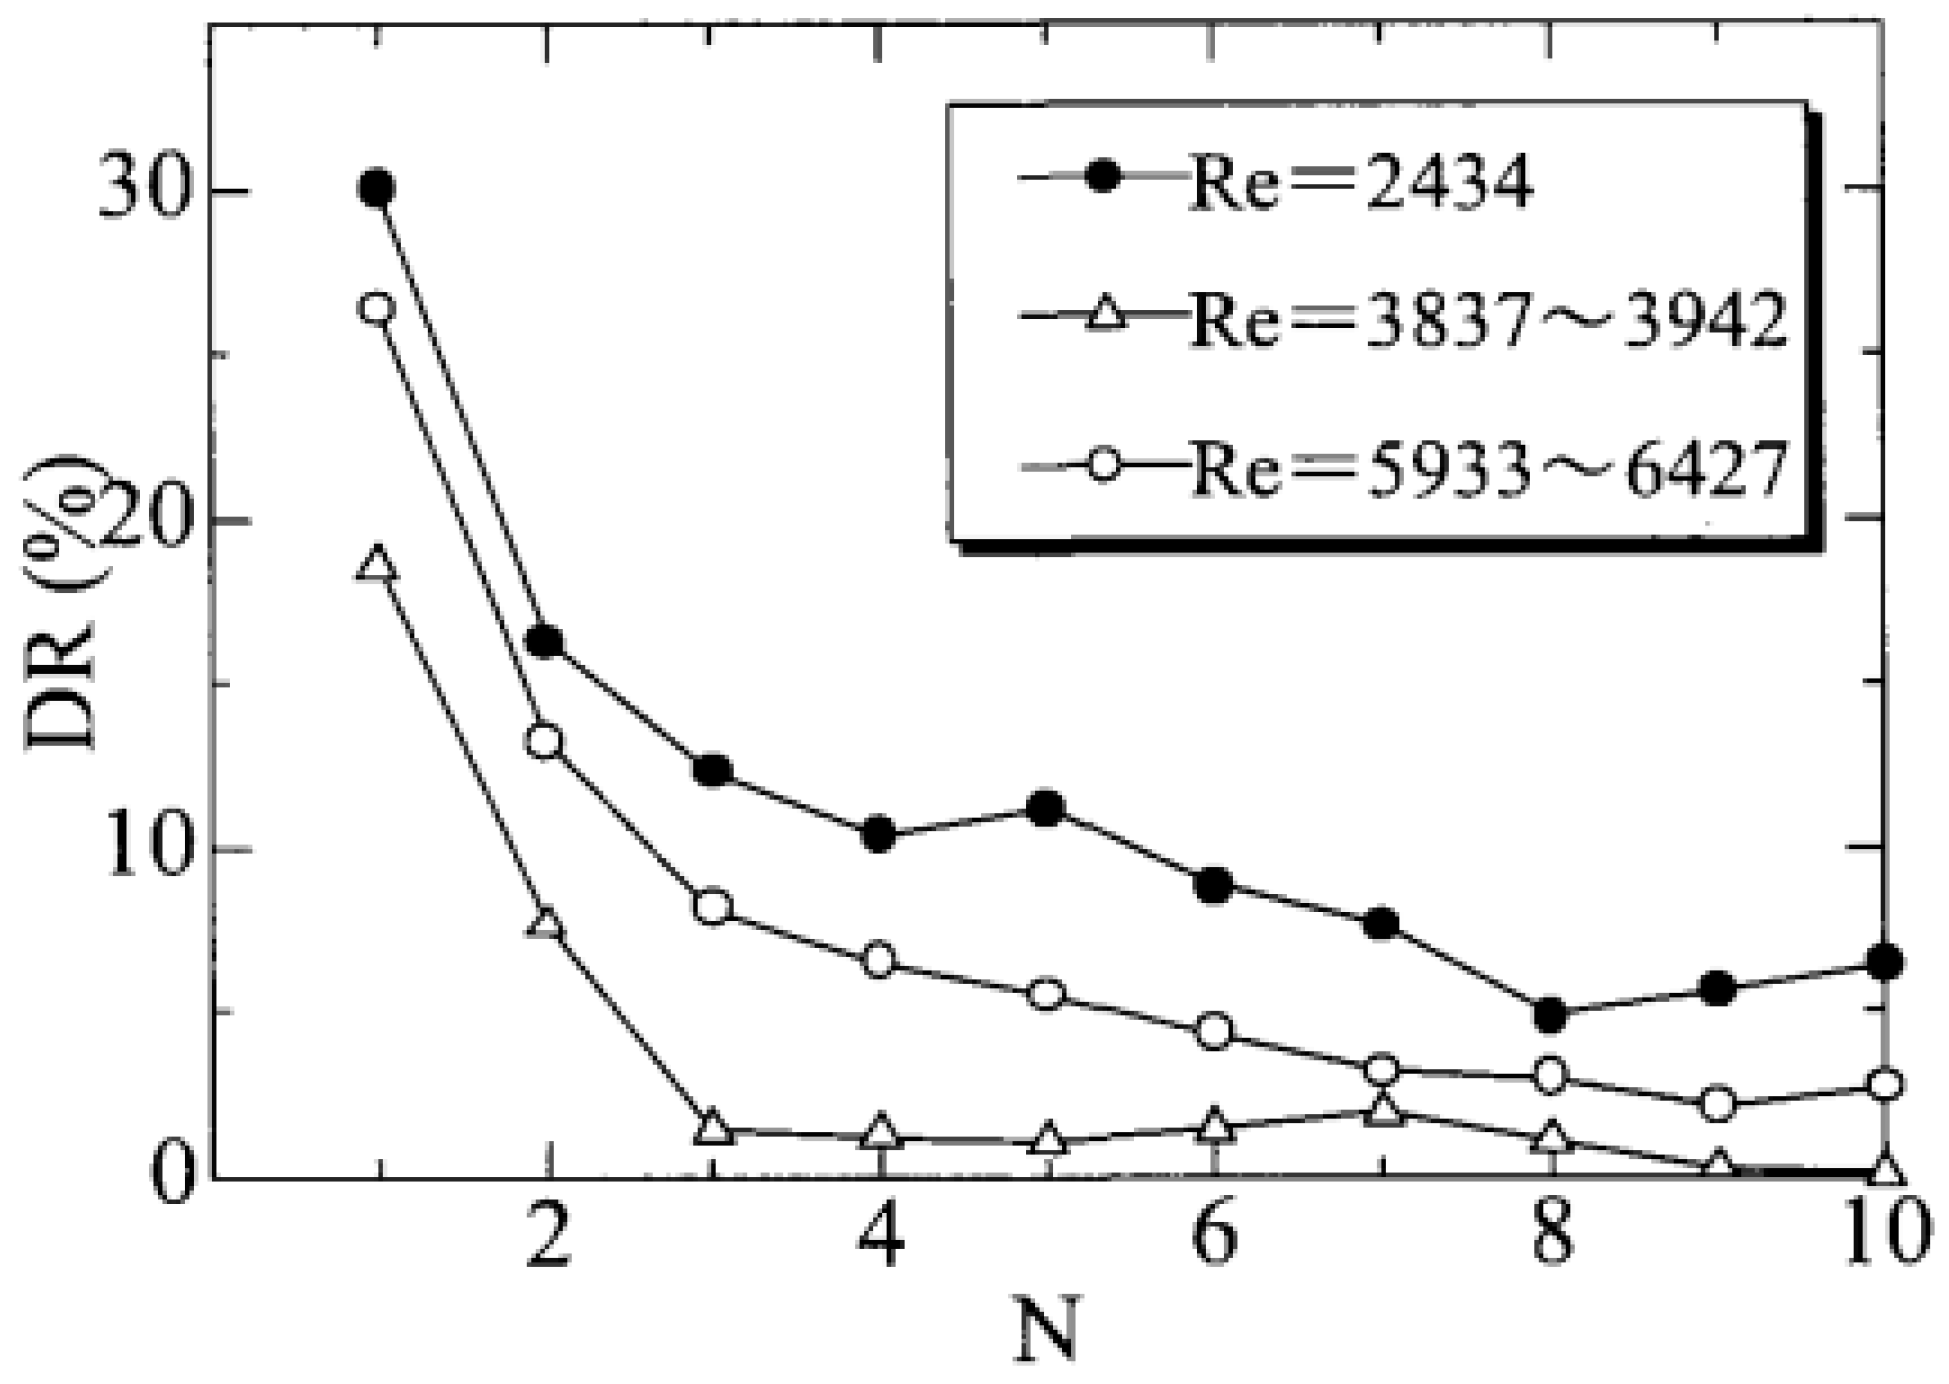
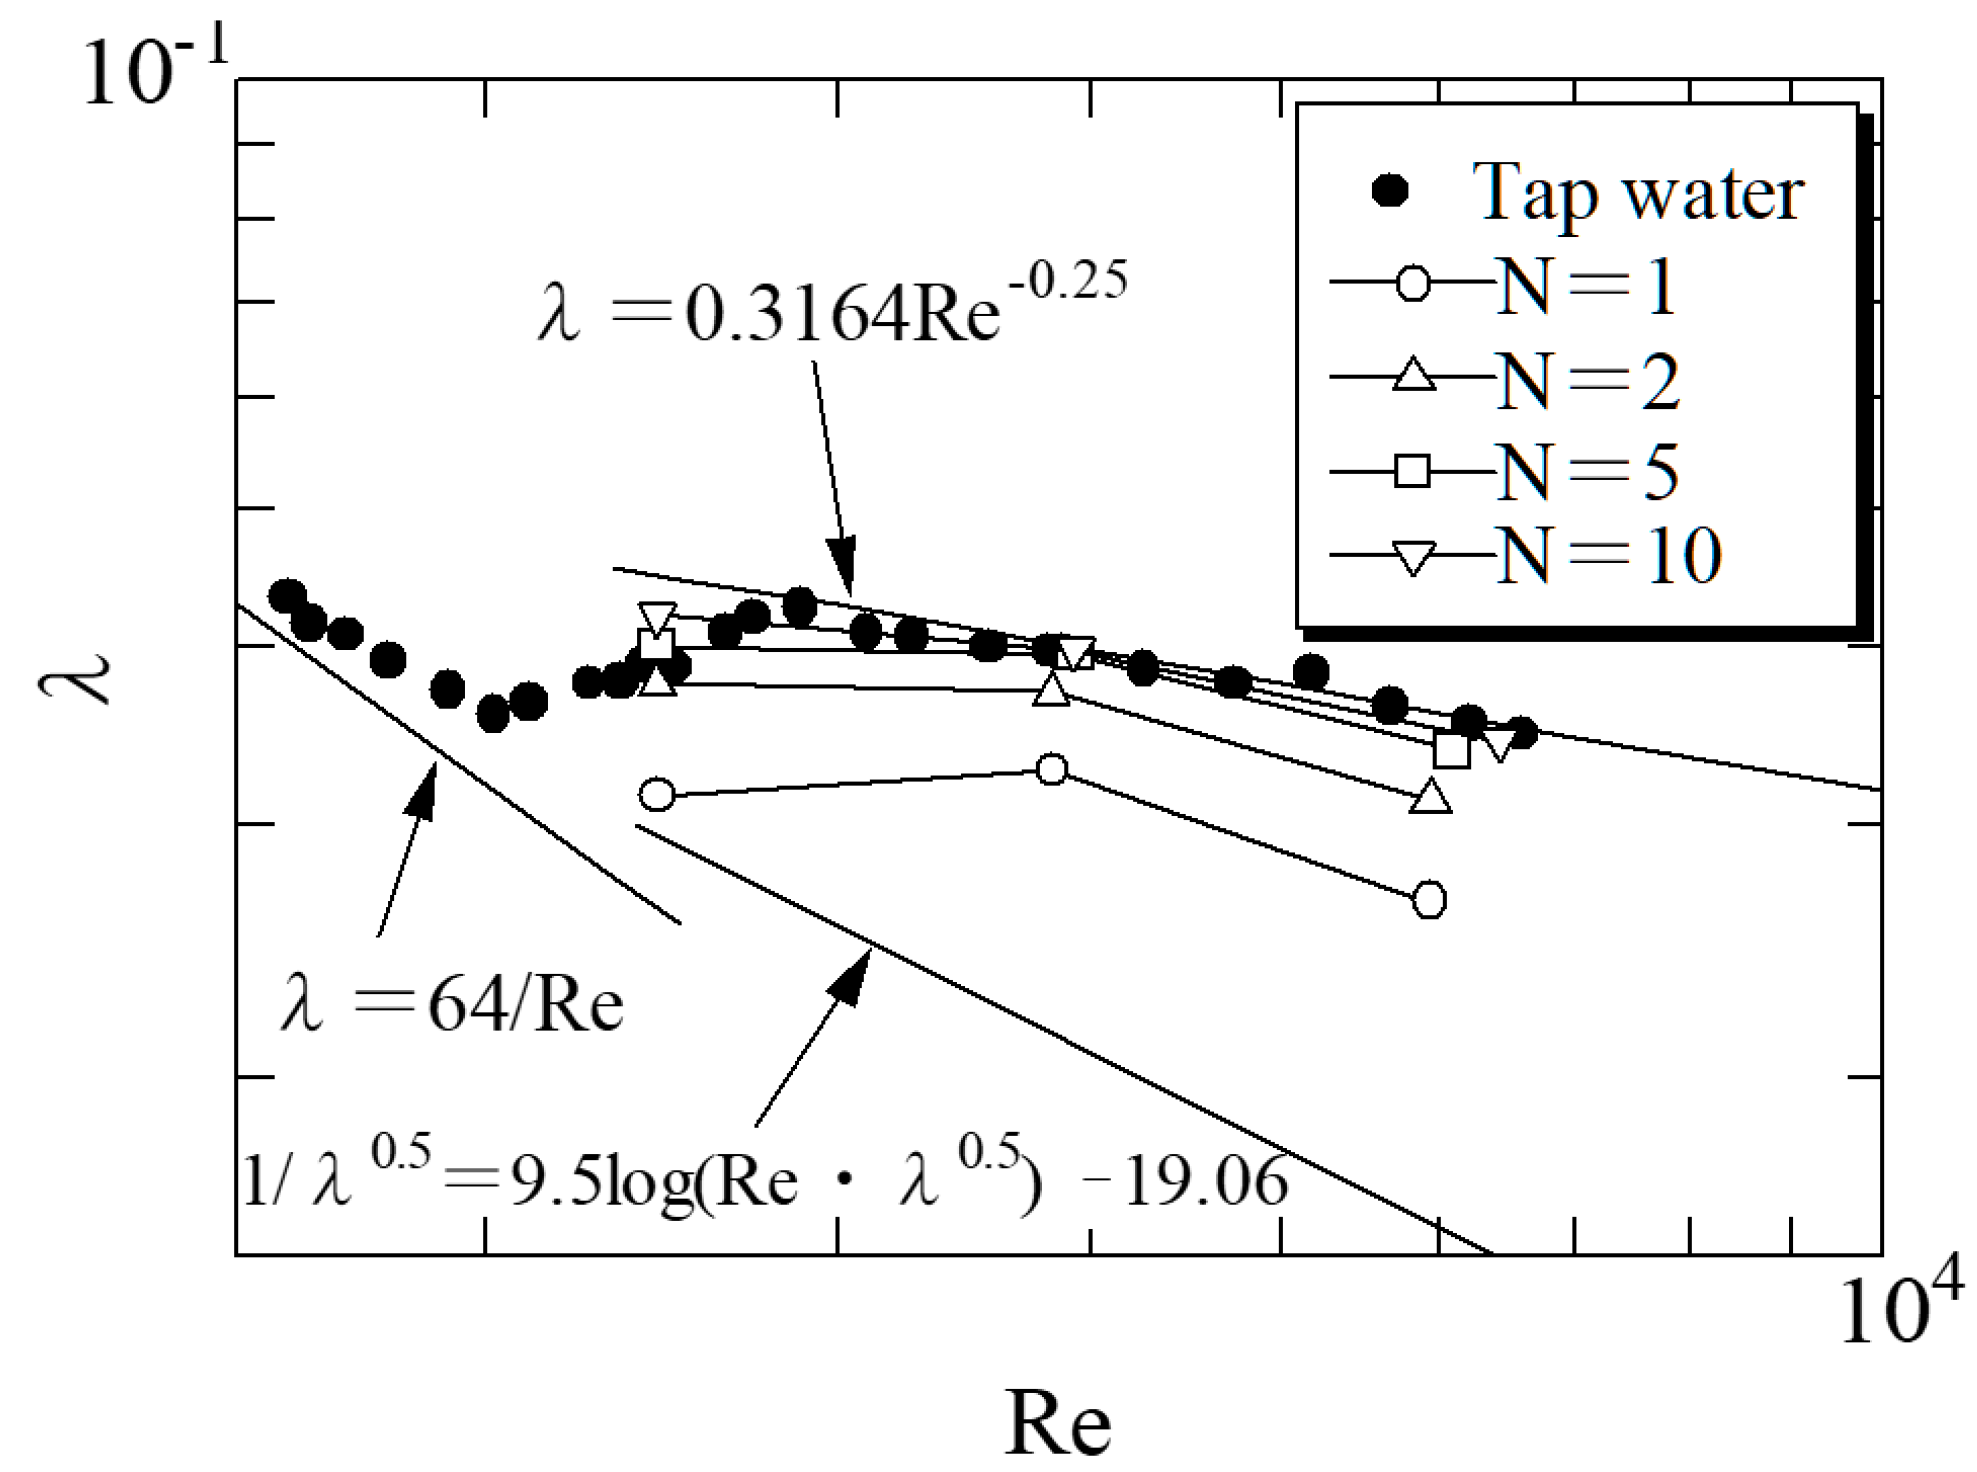
The physical properties of polymer solutions degrade depending on external changes. Mechanical shear degradation is particularly problematic and can hamper the practical application of polymer solutions for turbulent drag reduction phenomena. Mechanical degradation refers to the chemical process in which the activation energy of polymer chain scission is exceeded by mechanical action on the polymer chain, and bond rupture occurs. Many corresponding experiments have been performed under turbulent flow conditions using various experimental apparatuses. We examined the mechanical degradation of test solutions experimentally. In this study, a discharge pipeline system [14] was employed to measure the pressure loss relative to mechanical degradation. The system comprised a syringe-type pump and a syringe directed into a test pipe. The test solution was fed into the syringe, and the pressure loss was measured repeatedly. The results are presented in Figure 10. From Figure 9, the drag reduction ratio clearly decreased after two to three repetitions and then asymptotically approached a constant value. However, the drag reduction phenomenon disappeared in the high Re range. This is replotted in Figure 11 for clarity, incorporating the experimental data of the friction factor.
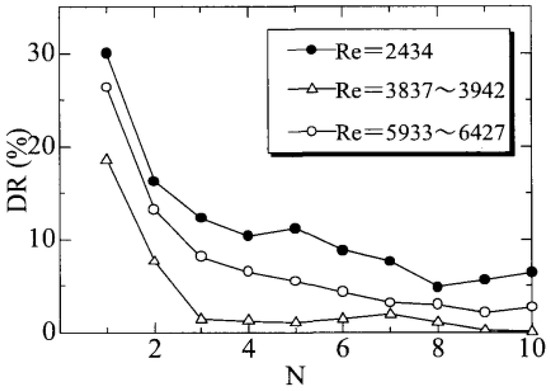
Figure 10.
Degradation expressed as the drag redaction ratio. N indicates the number of repetitions.
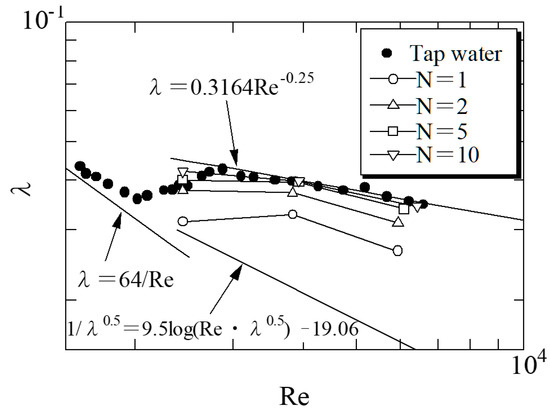
Figure 11.
Degradation phenomenon expressed as the friction factor.
Observations of microscopic photographs of the solution in which the drag reduction phenomenon disappeared reveal that the size of the conidial spore itself had decreased and had been cut by mechanical shearing. From these observation results, it is not possible to clearly determine changes in the molecular bonding state of polysaccharides. It is necessary to clarify the mechanical degradation of the biopolymer, including the effects on the growth of conidia and its modification according to turbulent flow, in the future.
4. Conclusions
In this study, we conducted experiments investigating the effect of turbulence on drag reduction in a circular pipe flow using dried malted rice, a product in fermented foods in Japan, among other Asian countries. As a result, the liquid extracted from the rice was confirmed as an effective drag-reducing agent. was achieved for the onset of the drag reduction phenomena, where Re and are the Reynolds number and friction factor, respectively.
The drag reduction effectiveness increased with the solution concentration, and the change in the friction factor for Re coincided with that of the Type B drag reduction phenomenon. The maximum drag reduction was approximately 27%, corresponding to drag reduction resulting from the 5–50 ppm xanthan gum solutions reported by Virk et al.
Not only the friction factor but also the turbulent velocity profile in the pipe flow should be determined to consider the drag reduction mechanism. In this study, the turbulent velocity profile was estimated using a semi theoretical equation, including the difference between the experimental results of the friction factor for the tested solutions and those of Newtonian fluids. The result was quantitatively displayed along with that of Newtonian fluids. In conclusion, the mechanism of the drag reduction phenomenon is predominantly the thickening of the viscous layer. Further investigation on the velocity profile near the pipe wall is necessary.
Author Contributions
K.W. conceptualized the study, designed the velocity profile analysis and wrote the manuscript. S.O. analyzed the experimental data and described the experimental results. All authors have read and agreed to the published version of the manuscript.
Funding
This study was supported by the research funding of a Grant-in-Aid for Scientific Research (C) (grant number 19560161) from the Japanese government in 2007~2008.
Data Availability Statement
The raw data required to reproduce these findings are available upon request from the authors.
Conflicts of Interest
The authors declare no conflicts of interest.
References
- Li, X. Turbulent drag reduction by polymer additives: Fundamentals and recent advances. Phys. Fluids 2019, 31, 121302. [Google Scholar]
- Burger, E.D.; Munk, W.R.; Wahl, H.A. Flow increase in the Trans Alaska Pipeline through use of a polymeric drag-reducing additive. Petrol. Technol. 1982, 34, 377–386. [Google Scholar] [CrossRef]
- Phukan, S.; Kumar, P.; Panda, J.; Navak, B.R.; Tiwari, K.N.; Singh, R.P. Application of drag reducing commercial and purified guargum for reduction of energy requirement of sprinkler irrigation and percolation rate of the soil. Agric. Water Manag. 2001, 47, 101–118. [Google Scholar] [CrossRef]
- Hoyt, J.W. High molecular weight algal substances in the sea. Marine Biol. 1970, 7, 93–99. [Google Scholar] [CrossRef]
- Hoyt, J.W. Drag reduction in polysaccharide solutions. Trends Biotechnol. 1985, 3, 17–19. [Google Scholar] [CrossRef]
- Wyatt, N.B.; Gunther, C.M.; Liberatore, M.W. Drag reduction effectiveness of dilute and entangled xanthan in turbulent pipe flow. J. Non-Newtonian Fluid Mech. 2011, 166, 25–31. [Google Scholar] [CrossRef]
- Yassn, E.I.; Herald, T.J.; Aramouni, F.M.; Alavi, S. Rheological properties of selected gum solutions. Food Res. Int. 2005, 38, 111–119. [Google Scholar] [CrossRef]
- Peterson, G.R.; Nelson, G.A.; Cathey, C.A.; Fuller, G.G. Rheological interesting polysaccharides from yeasts. Appl. Biochem. Biotchnol. 1989, 20, 845–867. [Google Scholar] [CrossRef] [PubMed]
- Peterson, G.R.; Schubert, W.W.; Richards, G.F.; Nelson, G.A. Yeasts producing exopolysaccharides with drag-reducing activity. Enzyme Microb. Technol. 1990, 12, 255–259. [Google Scholar] [CrossRef]
- Virk, P.S. Drag reduction by collapsed and extended polyelectrolytes. Nature 1975, 253, 109–110. [Google Scholar] [CrossRef]
- Virk, P.S. Glimpses of flow development and degradation during type B drag reduction by aqueous solutions of polyacrylamide. Flow Turb. Combust. 2018, 100, 889–917. [Google Scholar] [CrossRef]
- Virk, P.S. Drag reduction fundamentals. AIChE J. 1975, 21, 625–656. [Google Scholar] [CrossRef]
- Virk, P.S.; Mickley, H.S.; Smith, K.A. The ultimate asymptote and mean flow structure in Toms phenomenon. J. Appl. Mech. 1970, 37, 488–493. [Google Scholar] [CrossRef]
- Watanabe, K.; Ogata, S. Drag reduction of aqueous solutions of fine solid matter in pipe flows. AIChE J. 2021, 67, e17241. [Google Scholar] [CrossRef]
- Japper-Jaafar, A.; Escudier, M.P.; Poole, R.J. Turbulent pipe flow of a drag-reducing rigid ‘rod-like’ polymer solution. J. Non-Newtonian Fluid Mech. 2009, 161, 86–93. [Google Scholar] [CrossRef]
Disclaimer/Publisher’s Note: The statements, opinions and data contained in all publications are solely those of the individual author(s) and contributor(s) and not of MDPI and/or the editor(s). MDPI and/or the editor(s) disclaim responsibility for any injury to people or property resulting from any ideas, methods, instructions or products referred to in the content. |
© 2024 by the authors. Licensee MDPI, Basel, Switzerland. This article is an open access article distributed under the terms and conditions of the Creative Commons Attribution (CC BY) license (https://creativecommons.org/licenses/by/4.0/).