Abstract
Many reactions are carried out in solvent mixtures, mainly because of practical reasons. For example, E2 eliminations are favored over SN2 substitutions in aqueous organic solvents because the bases are desolvated. This example raises the question: how do we chose binary solvents to favor reaction outcomes? This important question is deceptively simple because it requires that we understand the details of all interactions within the system. Solvatochromism (solvent-dependent color change of a substance) has contributed a great deal to answer this difficult question, because it gives information on the interactions between solvents, solute-solvent, and presumably transition state-solvent. This wealth of information is achieved by simple spectroscopic measurements of selected (solvatochromic) substances, or probes. An important outcome of solvatochromism is that the probe solvation layer composition is almost always different from that of bulk mixed solvent. In principle, this difference can be exploited to “tune” the composition of solvent mixture to favor the reaction outcome. This minireview addresses the use of solvatochromic probes to quantify solute-solvent interactions, leading to a better understanding of the complex effects of solvent mixtures on chemical phenomena. Because of their extensive use in chemistry, we focus on binary mixtures containing protic-, and protic-dipolar aprotic solvents.
1. Reasons for Using Mixed Solvents in Chemistry
Solvent mixtures are extensively employed in chemistry for practical reasons. For example, the solubilities of inorganic bases, such as KOH, and other electrolytes in alcohols are enhanced in presence of water [,]. Cellulose that is insoluble in water is, however, readily soluble in some aqueous electrolyte solutions [], water-DMSO mixtures [], and mixtures of ionic liquids-molecular solvents (ILs-MSs) [,,,]. In the latter example, cellulose dissolution is attributed to the disruption of the strong hydrogen-bonding (H-bonding) between the hydroxyl groups of the anhydroglucose units, as well as to the hydrophobic interactions between cellulose chains, as shown in Figure 1a (IL-DMSO). Consequently, addition of protic non-solvents to solutions of cellulose in IL-MS causes biopolymer precipitation because the non-solvent efficiently solvates the ions of the IL (Figure 1b).
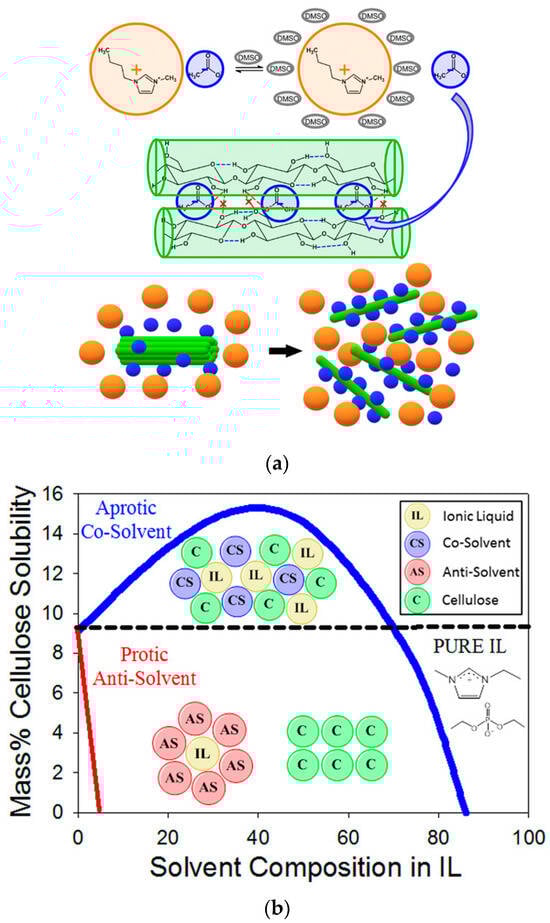
Figure 1.
(a) A simplified scheme for cellulose dissolution in ionic liquid-DMSO. The biopolymer dissolution is attributed to interactions of its hydroxyl groups with the ions of the ionic liquid and the dipole of DMSO. Reproduced with permission from []. (b) Effects of the addition of a protic non-solvent (such as water or ethanol) on the dissolution of cellulose IL-dipolar solvent. Addition of the non-solvent leads to cellulose precipitation. Reprinted with permission from [].
In addition to enhanced biopolymer solubility, the use of mixed solvents also causes noticeable changes in the physicochemical properties, such as a reduction in viscosity, leading to better heat and mass transfer, as shown by Figure 2a,c.
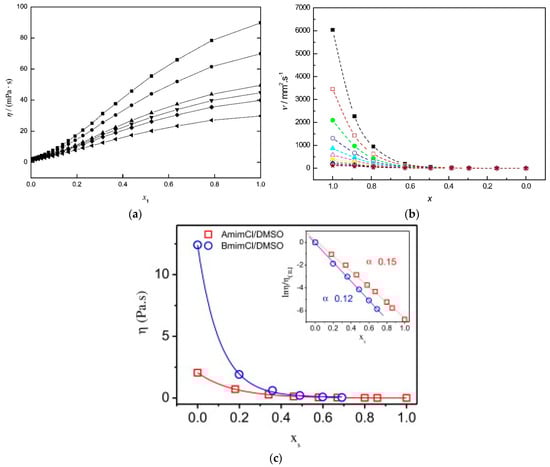
Figure 2.
(a) Dependence of the viscosity (η) of PEG 400-DMSO on the mole fraction of PEG 400 at different temperatures: ◼, 25 °C; ●, 30 °C; ▲, 35 °C; ▼, 40 °C; ⧫, 45 °C; ◄, 50 °C. Reprinted with permission from []. (b) Viscosities of BuMeImCl-DMF (1-butyl-3-methylimidazolium chloride-N,N-Dimethylformamide) mixtures as a function of mole fraction of DMF: ■, 30 °C; □, 35 °C; ●, 40 °C; ○, 45 °C; ▲, 50 °C; △, 55 °C; ▼, 60 °C; ∇, 65 °C; ♦, 70 °C; ◊, 75 °C; ★, 80 °C. Reprinted with permission from []. (c) Effects of increasing the mole fraction of DMSO (χS) on the viscosity of cotton cellulose in binary mixtures of DMSO with the ILs AlMeImCl (1-allyl-3-methylimidazolium chloride) and BuMeImCl. The insert is the logarithm-linear plot of the reduced viscosity ratio versus DMSO mole fraction at 25 °C Reprinted with permission from [].
2. A Rationale for Effects of Mixed Solvents on Chemical Phenomena
How do we explain these interesting and very useful effects of binary solvent mixtures on diverse chemical phenomena? While deceptively simple, this question cannot be answered in a straightforward manner. Consider, for example, the fact that most physicochemical properties of binary mixtures are not ideal. That is, the property of the binary mixture does not vary in a simple way as a function of binary solvent composition, as shown in Figure 3a–c.
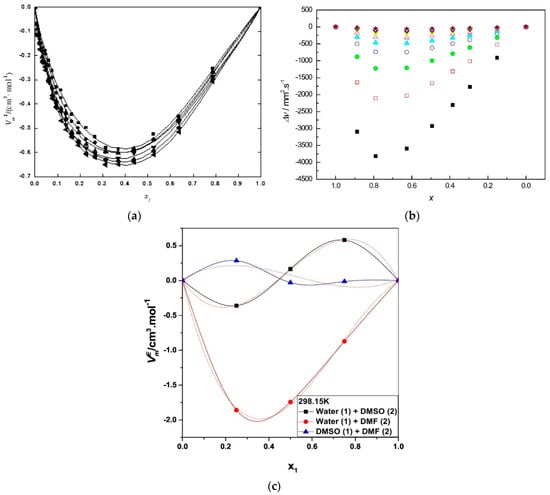
Figure 3.
(a) Density-based excess molar volumes as a function of mole fraction and temperature for PEG 400-DMSO. (a) ◼, 25 °C; ●, 30 °C; ▲, 35 °C; ▼, 40 °C; ⧫, 45 °C; ◄, 50 °C. Reprinted with permission from []; (b) Deviation of viscosity of mixtures of BuMeImCl-DMF from the values calculated from Σ χcomponent × Vmolar volume of component. ■, 30 °C; □, 35 °C; ●, 40 °C; ○, 45 °C; ▲, 50 °C K; △, 55 °C; ▼, 60 °C; ∇, 65 °C; ♦, 70 °C; ◊, 75 °C; ★, 80 °C. Reprinted with permission from []; (c) Excess molar volume (VE) of binary mixed systems for water-DMSO; water-MF, and DMSO-DMF at 25 °C. Reprinted with permission from [].
The reason behind this non-ideality is clearly the interactions between components of the binary solvent mixture. To a first approximation, one expects that the composition of the solvation layer of a dissolved substance (which we will refer to as “probe”) should be the same as that of bulk binary mixture. Consequently, the same explanations given for bulk binary mixtures should apply to the solvation layers of the dissolved probes. This simple view, however, does not hold in most cases because probe-solvent nonspecific and specific interactions were not taken into consideration. These interactions change the composition of the solvation layers relative to bulk solvent mixtures, as shown below.
The composition of the solvation layer of a probe may deviate from that of an (already non-ideal) bulk solvent mixture due to the so-called “preferential solvation” of the probe by one component of the mixture (Figure 4). In principle, this phenomenon includes contributions from probe-independent “dielectric enrichment”, and probe-solvent interactions. The first mechanism is operative in mixtures of nonpolar/low polar solvents, such as cyclohexane-THF (Tetrahydrofuran). It denotes enrichment of the probe solvation layer (relative to that of bulk solvent mixture) by the component of larger dielectric constant (or relative permittivity), due to non-specific probe dipole-solvent dipole interactions [,,].
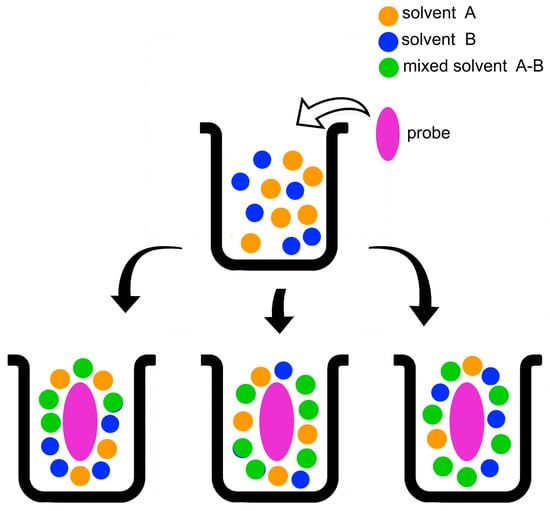
Figure 4.
Schematic representation of the solvation of a solute in a binary solvent mixture composed of two solvents (A, B), and the “mixed” solvent A-B, whose formation is discussed below. The parts of the lower line represent from the left: ideal solvation, i.e., the composition of the probe solvation layer is the same as that of bulk solvent mixture; preferential solvation by the solvents (A, A-B); preferential solvation by the solvents (B, A-B).
The second solvation mechanism is dominant in protic solvents (such as aqueous alcohols) and their mixtures with strongly dipolar solvents (water-DMSO, alcohol-DMF, etc.). It is essentially due to solute-solvent H-bonding and hydrophobic interactions. One additional complication is that solvent-solvent H-bonding generates an additional or “mixed” solvent species that should be considered. For example, in mixtures of water (W) and alcohol (ROH), and W-DMSO, we have in solution both the parent and the mixed solvents, HOH…O(H)R and HOH…O(H)=S(CH3)2 []; this turns analysis of the solvation data more complex. In summary, most significant consequence of preferential solvation is that compositions of the solvation layers of most probes are different from those of the corresponding bulk solvent mixtures; these composition differences are probe-, and temperature-dependent [,].
How do we calculate the “effective” (or local) composition of the solvation layer of a probe? Several techniques were employed to solve this problem, including FTIR [], resonance Raman spectroscopy [], and X-ray diffraction (for solvated crystals) []. It is our view that the most useful approach is to use solvatochromic indicators as models for the compounds of interest, e.g., reactants. Solvatochromic probes are substances whose absorption or emission spectra are sensitively dependent on the solvent or the composition of solvent mixtures (Figure 5). The reason for solvatochromism is that the energy difference between the probe’s ground and excited states is sensitively affected by probe-solvent interactions, leading to medium-dependent values of λmax, and hence a change in solution color. For most probes, the solvatochomism is negative, meaning there is a hypsochromic shift of the longest wavelength absorption band with increasing medium polarity. The reason is that solvents stabilize the zwitterionic ground state much more than the diradical excited state (see Figure 6 for light-induced transition of the probe t-Bu5RB). The latter corresponds to a so-called FranckCondon excited state, because the time scale of the electronic excitation (ca. 10−15 s) is much shorter than that required for the solvent molecule to reorient in order to stabilize the probe’s excited state. The energy of this transition furnishes the solvatochromic property of interest, vide infra.
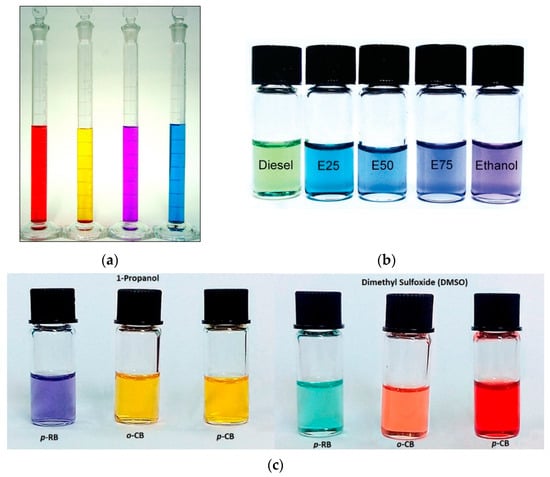
Figure 5.
Examples of solvatochromism. Part (a) is for MePMBr2 (2,6-dibromo-4-[(E)-2-(1-methylpyridinium-4-yl)ethenyl]) empirical polarity indicator in (from left) ethanol, water, acetone, and dichloromethane []. Part (b) is that for the empirical polarity probe t-Bu5RB, Figure 6), in (mineral) diesel oil and its mixtures with 25, 50, 75% bioethanol, and in pure bioethanol, respectively. Reprinted with permission from []. Part (c) shows the dependence of solution color on the structure of the solvatochromic probe. Reprinted with permission from []. The structures and names of these probes are shown in Figure 7.
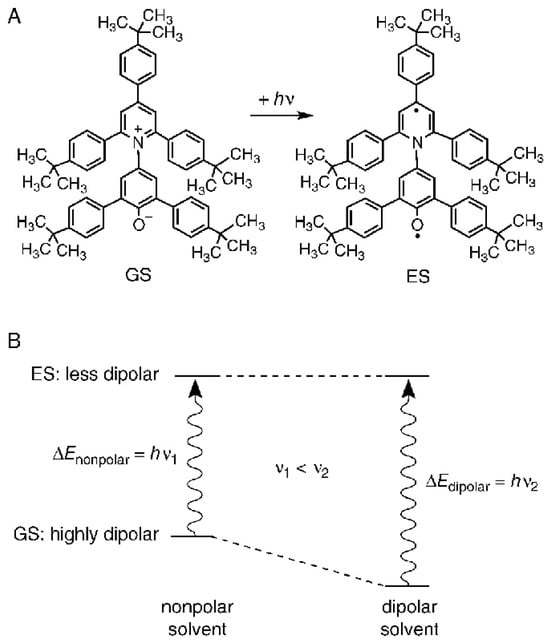
Figure 6.
(A) The molecular structure of the solvatochromic indicator dye, t-Bu5RB (2,6-bis [4-(t-butyl)phenyl]-4-{2,4,6-tris[4-(t-butyl)phenyl]pyridinium-1-yl}phenolate): a zwitterionic pyridinium-N-phenolate betaine dye with a highly dipolar electronic ground state (GS) and a much less dipolar first excited state (ES). (B) A schematic qualitative representation of the solvent influence on the differences ΔE between the energies of the GS and ES of t-Bu5RB, dissolved in a nonpolar and a dipolar solvent, respectively. Reprinted with permission from [].
This approach was advanced thanks to the work of professor C. Reichardt, initially under the supervision of professor K. Dimroth at Marburg university [,]. The experimental part is relatively simple: register the UV-Vis spectrum of a solvatochromic probe → calculate the value of λmax of a specific peak (the longest wavelength, due to intermolecular charge-transfer within the probe) → use the value of λmax to calculate the desired property, or descriptor, of the solvent or solvent mixture. The power of solvatochromism is that it can be employed to calculate the overall (or empirical) solvent polarity scale, ET (in kcal/mol), as well as the individual solvent descriptors that contribute to ET, namely solvent Lewis acidity (SA), solvent Lewis basicity (SB), solvent dipolarity (SD), and solvent polarizability (SP), where S refers to solvent. Other abbreviations that were employed for designating these descriptors include SdP and SP for solvent dipolarity and polarizability, respectively. For consistency, however, we use two letters to designate each solvent descriptor.
Equation (1) shows the relationship of these solvent descriptors:
where ET(probe)0 corresponds to gas phase, the descriptors (SA, SB, SD, SP) are those defined above, and (a, b, d, and p) are the corresponding regression coefficients. Figure 7 shows some solvatochromic probes used to calculate the descriptors of Equation (1). In the Taft–Kamlet–Abboud approach, similar solvatochromic parameters and different symbols were employed to describe probe–solvent interactions, α, β, and π* for solvent Lewis acidity, Lewis basicity, and (combined) dipolarity/polarizability []. The signs of the coefficients in Equation (1) indicate whether the property of the solvent considered increases (positive sign) or decreases (negative sign) the empirical solvent polarity [].
ET(probe) = ET(probe)0 + aSA + bSB + dSD + pSP
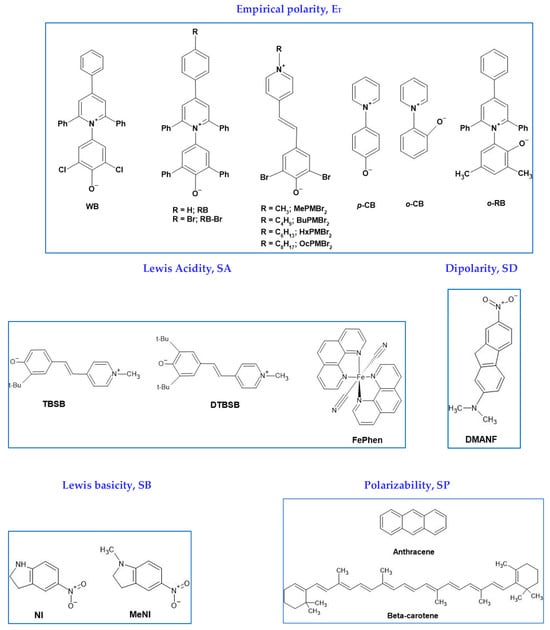
Figure 7.
Structures and acronyms of some solvatochromic probes, employed to calculate the solvent descriptors shown in Equation (1).
3. A Model for the Solvation of Probes
A solvation model is required to calculate the local concentration of the species in the solvating layer of the probe. For simplicity, we consider a W-ROH mixture, containing a certain water mole fraction, χW. We address the question of preferential solvation by using a series of exchange equilibria between the solvent species in the bulk binary mixture and those in the probe solvation layer. Any realistic model should consider, therefore, the exchange of the three solvents (W, ROH, and W-ROH) between the bulk solvent and the probe solvation layer, where the equilibria involving the mixed solvent are given by Equations (2)–(4):
ROH + W ⇆ ROH − W
Probe(ROH)m + m (ROH − W) ⇆ Probe(ROH − W)m + m ROH
Probe(W)m + m (ROH − W) ⇆ Probe(ROH − W)m + m W
Note that (m) is not the solvation number of the probe; it represents the number of solvent molecules whose exchange in the probe solvation layer affects its solvatochromism; usually, the value of (m) is close to unity. For example, for the solvation of WB in mixtures of water with 4 alcohols (methanol, 1-propanol, 2-propanol, and 2-methylethanol), the calculated values of (m) range from 1.06 to 1.70 []. With this proviso (meaning of (m)), addressing the important point of probe-dependent volume of the solvation layer is not required for the analysis shown below. Additionally, using this model, one should be able to calculate the probe-induced preferential solvation, as expressed by the fractionation factor (φ) ,which represents the equilibrium constant for solvent exchange between the bulk binary mixture and the probe solvation layer. This model has been elaborated; Equations (5)–(7) are for W-ROH, where (Bk) refers to bulk solvent:
In Equation (5), φW/ROH describes the preference of (W) for the probe solvation layer relative to bulk solvent mixture. Values of φW/ROH > 1 indicate that the probe solvation layer is richer in (W) than the bulk solvent; the inverse is true for φW/ROH < 1. In absence of preferential solvation, φW/ROH is unity, indicating that solvent composition in the probe solvation layer is the same as that of the bulk solvent. The same line of reasoning applies to φROH-W/ROH (mixed solvent displaces ROH) and φROH-W/W (mixed solvent displaces W), as depicted in Equations (6) and (7).
The use of 1:1 stoichiometry for ROH-W is an assumption that has been employed elsewhere [,,,,,,]. Mixed solvents with a stoichiometry other than 1:1 can be regarded, to a good approximation, as mixtures of the 1:1 structure plus excess of a pure solvent. We stress that taking into account the presence of mixed solvents is more than a practical and convenient assumption; the presence of such species has been successfully employed in fitting results of spectroscopic techniques that are particularly suitable to determine the stoichiometry and association constant of solvents, e.g., NMR [,,] and FTIR [,,]. The observed solvatochromic property, such as the ETObs(probe), can be then calculated by iteration from Equations (8) and (9):
where (m), , , and refer to the number of molecules in the probe solvation layer that affects its solvatochromic response, and effective mole fractions of the appropriate species in bulk mixed solvent, respectively. Note that these effective mole fractions differ from the analytical or starting mole fractions due to the formation of the mixed solvent, e.g., ROH-W. The input data to solve these equations include , , , and , along with initial estimates of (m), and the appropriate solvent fractionation factors. The values of , , and are calculated from the dependence of a physical property (e.g., density on solution composition) by using the association model discussed by Katz et al. [,,]; a list of the association constants of W-ROH has been published [].
Figure 8 and Figure 9 show the dependence of the effective concentrations of solvent species on the analytical mole fractions of the two solvents.
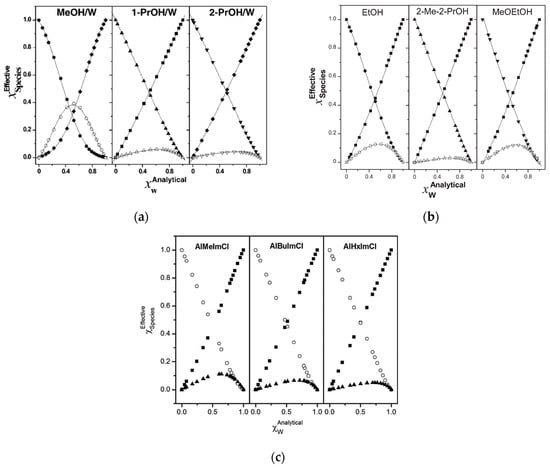
Figure 8.
(a) Species distribution for MeOH–W, 1-PrOH–W and 2-PrOH–W mixtures at 25 °C. W (♦); ROH (●, ▲, ▼); and ROH–W (◯, △, ▽). Reprinted with permission from []. (b) Species distribution for EtOH/W, 2-Me-2-PrOH (2-methyl-2-propanol)/W and MeOEtOH (2-methoxyethanol)/W mixtures, respectively, at 25 °C: W (■), ROH (●, ▲, ▼), and ROH–W (◯, △, ▽). Reprinted from []. (c) Dependence of species distribution for IL-W binary mixtures on the length of R of AlRImCl (1-ally-3-methylimidazoilium chloride), at 25 °C, where R = methyl, 1-butyl, and 1-hexyl, respectively. The symbols employed are ◯, ■, ▲ for IL, W, and the IL-W 1:1 complex, respectively. Reprinted with permission from [].
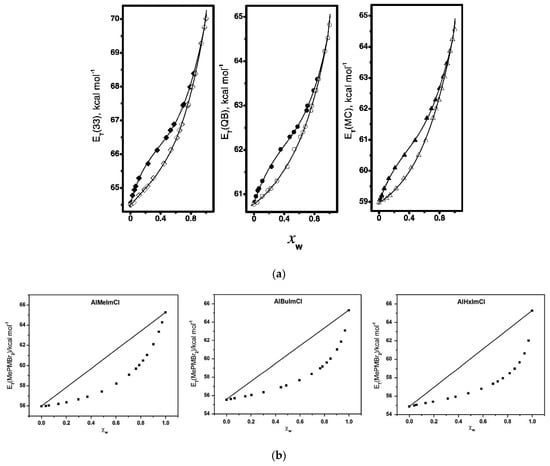
Figure 9.
(a) Dependence of solvent polarity scale, ET(probe), on analytical, χWAnalytical (open symbols), and “effective”, χWEffective (solid symbols) χW for MeOH-W mixtures at 25 °C. Reprinted with permission from []. (b) Dependence of the empirical solvent polarity parameter ET(MePMBr2) on the mole fraction of water, χW, at 25 °C, for mixtures of water with ILs. The straight lines connecting the polarities of the pure solvents are theoretical, plotted merely to depict the ideal solvation of the probe by the binary mixtures. Reprinted from [].
By using data such as those shown in Figure 8, and Equations (8) and (9), one can calculate the dependence of a solvatochromic property (e.g., solvent polarity or ET(probe)) as a function of binary solvent composition at a fixed temperature, or at a series of temperatures (referred to as thermo-solvatochromism), as shown in Figure 9.
The preceding discussion shows that it is relatively simple to calculate medium descriptors (e.g., SA and SB) for pure and mixed solvents; the use of the appropriate solvation model permits calculation of the composition of the solvation layers of the solvatochromic probes dissolved therein. Although there are a large number of solvatochromic probes that are employed to calculate the solvent descriptors, the results are consistent when different probes were employed. This is demonstrated by application of Equation (1) to a series of ILs, where the calculated empirical solvent polarities using the RB (Reichardt betaine—2,6-diphenyl-4-(2,4,6-triphenylpyridinium-1-yl) phenolate) probe correlate linearly with the calculated values, based on the 4 descriptors (SA, SB, SD, SP), which were calculated using different solvatochromic probes (Figure 10). Values of φ were also calculated at different temperatures, showing the effect of temperature on the composition of the probe solvation layer (thermo-solvatochromism).
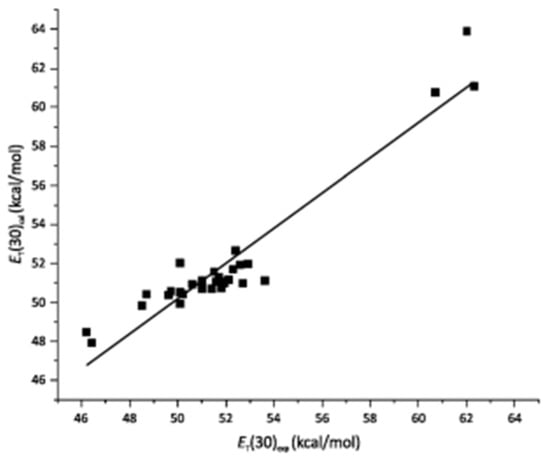
Figure 10.
Correlation between experimentally determined ET(RB) and those calculated by Equation (1a) for ionic liquids. Reprinted with permission from [].
4. Selected Examples of the Application of Solvatochromism to Understand Medium Effects on Chemical Phenomena
One of the most important applications is that the probes employed, when properly selected, can be used as models. Because most of these probes are dipolar or zwitterionic, and have varying hydrophilic/hydrophobic character, it should not be difficult to select the probes that are expected to match the reaction of interest. For a comprehensive list of solvatochromic probes, see references [,,]. Consequently, the information obtained from the solvatochromic probe can be employed to understand the effects of medium composition on diverse chemical phenomena and processes.
Selected examples show the importance of the last phrase. Consider the following question: What is the medium effect on a chemical phenomenon of increasing probe hydrophobicity in a solvent mixture? An example is shown for the solvation in DMSO-W and 1-PrOH-W of 4 probes (Figure 11). Two of these are hydrophilic, 4- (pyridinium-1-yl)phenolate and 2-(pyridinium-1-yl)phenolate (p-CB and o-CB, respectively)); the other two (RB and o-RB, 2,4-dimethyl-6-(2,4,6-triphenylpyridinium-1-yl)phenolate) have more elaborate, hydrophobic structures (Figure 7); the corresponding values of φ are shown in Table 1 []. The straight lines in Figure 11 represent the case where there is no probe-induced preferential solvation, i.e., the composition of the probe solvation layer is equal to that of bulk solvent mixture. It is clear that this is not case; the deviation increases as a function of increasing probe hydrophobicity (RB is practically insoluble in water). Usually, more hydrophobic probes show more deviation from linearity [].
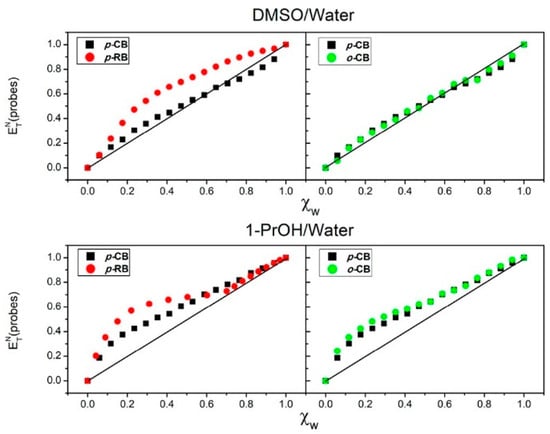
Figure 11.
Dependence of ETN(probe) on the χW for W-DMSO (left) and W-1-PrOH (right) mixtures. The black and green squares are for (hydrophilic) p-CB, and o-CB, respectively. The red spheres are for (hydrophobic) p-RB (or RB). The curves clearly show that the deviation form ideality increases as a function of increasing probe hydrophobicity. Reprinted with permission from [].

Table 1.
Solvatochromism of p-RB, p-CB, and o-CB in binary mixtures of W-DMSO and W-1-PrOH at 25 °C. Reprinted with permission from [].
With one exception (o-CB in DMSO-W), all values for φW/S are <1, showing that the organic solvents displace water from the probe solvation layer. All values of φMixed solvent/solvent (mixed solvents displacing pure solvents) are > 1, i.e., the complex solvents are more efficient than the parent ones. As expected, the calculated empirical polarity of the mixed solvent is greater than that of pure DMSO or 1-PrOH, because the mixed solvent contains (more polar) water molecules. The reason for the efficiency of the mixed solvent is that probe−solvent interactions include H-bonding to the probe phenolate oxygen, as well as hydrophobic interactions. Thus, 1-PrOH/W has more sites for hydrogen-bond donation/acceptance than water or 1-PrOH, while it is also capable of solvating the probe by the hydrophobic effect due to the organic “end” of the solvent. A similar reasoning can be advanced for the efficiency of DMSO/W relative to W and DMSO. All φSolvent-W are larger for 1-PrOH/W than DMSO/W, and for p-RB than p-CB or o-CB. The first result underlines the importance of H-bonding to solvation, whereas the second one is in agreement with the dependence of preferential solvation (hence, the values of φ) on the hydrophobicity of the probe [].
Likewise, for the solvation of the same probe in a series of structurally related solvents (e.g., alcohols) the fractionation factors, hence the compositions of the probe solvation layer are sensitively dependent on the hydrophobicity of ROH, as shown in Table 2, for the solvation of a hydrophobic- (WB; 2,6-dichloro-4-(2,4,6-triphenylpyridinium-1-yl)-phenolate; pKa = 4.78) and a hydrophilic probe (QB; 1-methylquinolinium-8-olate; pKa = 6.80), at 25 °C [,].
Table 2.
Results for the solvation of WB and QB in water-alcohol mixtures at 25 °C [].
Table 2 shows that values of φ are probe-dependent, being larger for WB than for QB in any W-ROH mixture. Additionally, the values φROH-W/ROH and φROH-W/W increase on going from MeOH to 1-PrOH. If H-bonding to the phenolate oxygen of WB was the dominant probe-solvent interaction, then the expected order of φROH-W/ROH and φROH-W/W should have been QB (stronger base) > WB (weaker base); this is not the case. We conclude that solute-solvent hydrophobic interactions dominate the solvation of these probes. This also agrees with the dependence of φ on the hydrophobicity (or log P) of the alcohol (MeOH to 1-PrOH). Similar results were observed for the solvation of a series of merocyanine probes (see Figure 7), in binary mixture of W-ROH (MeOH, 1-PrOH) and W-MS (MeCN and DMSO) where the values of φ increase on going from MePMBr2 (less hydrophobic probe) to OcPMBr2 (2,6-dibromo-4-[(E)-2-(1-octylpyridinium-4-yl)ethenyl]; more hydrophobic probe) in every binary mixture, and from methanol to 1-PrOH for the same probe []. This type of information cannot be easily obtained by other approaches and is important, e.g., for choosing the appropriate solvent mixture for a certain application.
As in the experimental determination of the activation energy of reactions, solvation was studied as a function of temperature. An example for the dependence of ET(probe) on T is shown in Figure 12, for the solvation of QB and MePMBr2 in alkoxy-alcohols [].
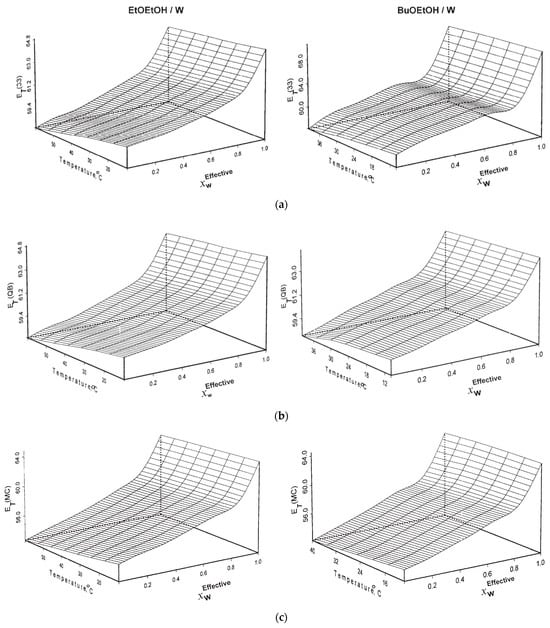
Figure 12.
Dependence of the empirical solvent polarity on temperature, for the solvation of WB (a), QB (b), and MePMBr2 (c) in aqueous alcohols. Reprinted with permission from [].
Plots (not shown) of ET(probe)Solvent versus T gave excellent straight lines, the negative slopes of which are given by ΔET(probe)Solvent/ΔT (in kcal mol−1 K−1). These were calculated for pure solvents; the order is |ΔET(probe)ROH| > |ΔET(probe)W|, reflecting the greater effect of temperature on the structure of ROH. Consequently, H-bonding of water with the probe ground state is less susceptible to temperature increases than ROH. Values of ΔET(probe)Solvent for 50 °C intervals (ΔET(10 °C)–(ΔET(60 °C) for WB and MePMBr2 in mixtures of water and 9 alcohols and alkoxy-alcohols were calculated, which range between 2.1 and 3.7 kcal mol−1. This is a sizeable energy, relative to the activation energies of many reactions (ca. 10–12 kcal/mol). This underlines the importance of studying thermo-solvatochromism to quantify the contribution of temperature-induced changes in solvation to the energetics of reactions in solution, a quantity that cannot be calculated, e.g., from rate data.
An example that shows the usefulness of solvatochromic probes as models for chemical reactions is the pH-independent hydrolysis of esters, including the hydrophobic 2,4-dinitrophenyl carbonate [], the relatively hydrophilic 4-nitrophenyl chloroformate (calculated log P = 1.66), and the very hydrophobic ester 4-nitrophenyl heptafluorobutyrate (calculated log P = 4.02) []; all reactions were studied in W-MeCN mixtures (see Scheme 1). These reactions show a complex dependence of reaction rate constants on water concentration, as shown in the left-hand parts of Figure 13 and Figure 14.
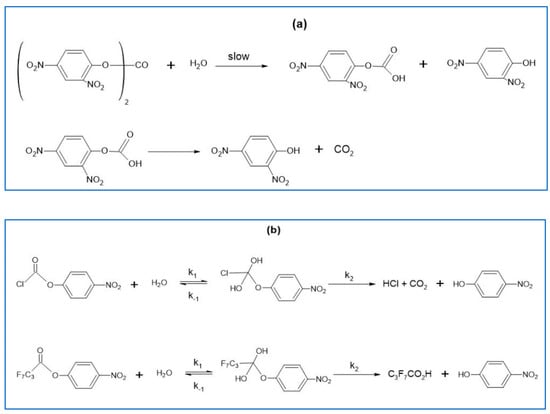
Scheme 1.
Pathways for the pH-independent hydrolyses of: (a) DNPC, reprinted with permission from []; and (b) NPCF and NPFB, reprinted with permission from [].
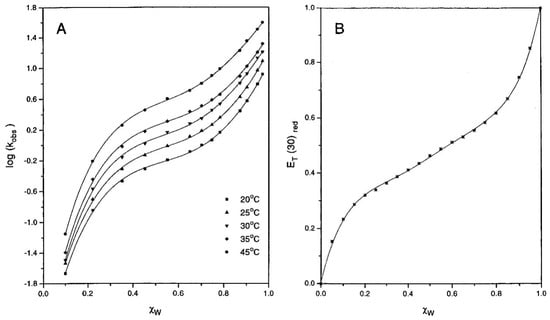
Figure 13.
(A) Dependence of log (kobs), the observed rate constant on χw, the mole fraction of water in aqueous acetonitrile, at different temperatures. The points are experimental, and the solid sigmoidal lines were calculated by a fourth power polynomial dependence of log (kobs) o χw. (B) Dependence of the empirical solvent polarity ET(RB) on χw. The solid curve was calculated from a fifth power polynomial dependence of ET(RB) on χw. Reprinted with permission from [].
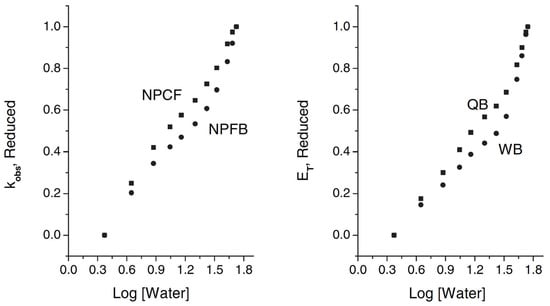
Figure 14.
Plots of the dependence of log (kobs) and of ET(probe) on log [W], at 25 °C. Reduced log (kobs) and reduced ET(probe) are employed, so that the results of different species (esters, probes) may be directly compared. Values of ET(probe) of pure water and pure MeCN are, respectively, 64.62 and 52.97 kcal mol−1 (QB) and 70.24 and 54.72 kcal mol−1 (WB). Reprinted with permission from [].
Because addition of MeCN to water induces a series of structural changes in the medium that depends on binary solvent composition [,,], we carried out a “proton-inventory” study to probe the structures of the corresponding transition states []. Our results showed that the complex dependence of reaction rate constants and activation parameters on [H2O] is not due to changes in the number of water molecules in the transition states. It reflects, however, the effects of acetonitrile-water interactions on solvation of reactants and transition states. We therefore expected that the dependence of kinetic data on [W] should be similar to that of model solvatochromic probes, as clearly illustrated by Figure 13 and Figure 14. Note that these hydrolysis reactions are particularly suitable to test the potential of using solvatochromic probes as models for chemical phenomena, because complicating acid or base catalysis play no role.
Another example of the application of solvatochromic probes to elucidate chemical reactions is retro-DielsAlder reaction (RDA) of anthracene-9,10-dione in aqueous solutions (Scheme 2). The RDA reaction proceeds exceptionally fast in water compared to organic solvents (Figure 15a) because this solvent greatly accelerates pericyclic reactions through H-bonding, which stabilizes the activated complex. []. Figure 15b shows that this reaction has the Gibbs energy of activation clearly governed by the polarity of the solvent.
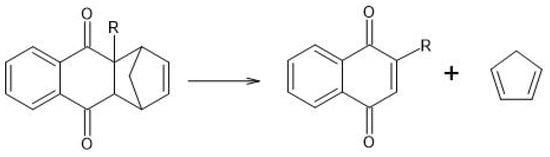
Scheme 2.
RDA of anthracene-9,10-dione in aqueous solution. Reprinted with permission from [].
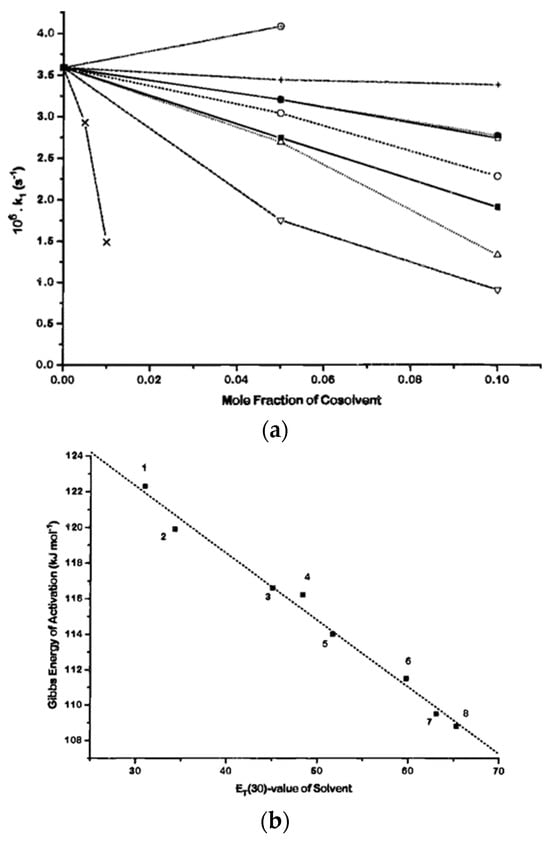
Figure 15.
(a) First-order rate constant (×106 s−1; 40 °C) of the RDA reaction of anthracene-9,10-dione in aqueous solutions versus the mole fraction of organic cosolvent: MeOH (☐), EtOH (◯), 1-PrOH (△), t-BuOH (▽), formamide (●), acetonitrile (■), 1-cyclohexyl-2-pyrrolidinone (×), urea (+), and glucose (⊕). (b) Correlation between the Gibbs free energy of activation of the RDA reaction of anthracene-9,10-dione and the solvatochromic parameter ET(RB) of the solvents. Reprinted with permission from [].
We end this discussion by showing how the results of solvatochromism can be employed to determine the relative importance of solvent descriptors to cellulose dissolution. First, solvatochromism of WB was studied in several IL-DMSO mixtures, at χDMSO = 0.6 and 40 °C []. This study generated an equation showing the dependence of ET(WB) on solvent descriptors SA, SB, SD and SP. In a later study, microcrystalline cellulose (MCC) was dissolved in these binary mixtures and the mass of dissolved MCC (expressed as %m) was correlated with the same solvent descriptors, calculated from the solvatochromic study [], see Equations (10) and (11):
where SA and SB are those defined above, VM and ƒ(n) are the molar volume of the neat IL, and the LorentzLorenz refractive index function; these were employed instead of SD and SP, as explained elsewhere []. The signs of the regression coefficients in both equations are the same. That is, solvatochromism and MCC dissolution are enhanced by solvent Lewis acidity, Lewis basicity and polarizability; the inverse is true for the molar volume of the IL. The different relative importance of SA/SB in both cases can be explained because MCC is a H-bond acceptor and donor, whereas the probes are only H-bond acceptors. The relevant point, however, is that two very different chemical process can be similarly correlated with the same set of solvent descriptors. This agreement can be fruitfully employed, e.g., for screening possible candidates as solvents for cellulose and other biopolymers.
ET(WB) = 54.61 + 2.77 SA + 0.61 SB − 1.06 VM + 0.41 ƒ(n) → Based on solvatochromism in 13 IL-DMSO mixtures; R2 = 0.939
MCC-m% = 9.49 + 3.01 SA + 6.88 SB − 2.99 VM + 2.427 ƒ(n) → Based on MCC dissolution in 11 IL-DMSO mixtures; R2 = 0.902
5. Conclusions
Solvent mixtures are extensively employed in chemistry for practical reasons. Their use leads to enhanced solubilities, increased rate constants, etc. These beneficial effects call for a clear understanding of solvent effects on chemical phenomena. This understanding is, however, hindered by two complications: (i) The dependencies of the physicochemical properties of the binary mixtures on its composition are usually not ideal, and (ii) The compositions of the solvation layers of the solutes are almost always different from those of the bulk solvents. The reasons for the latter differences are combinations of dielectric enrichment and, more importantly, H-bonding and solute-solvent hydrophobic interactions. This intricate situation has been greatly simplified by using solvatochromic probes as models for the reaction or process under consideration. By applying appropriate solvation models, the study of these probes furnishes a set of solvent-exchange equilibrium constants (φ) that permits calculation of the effective (or local) composition of the solvatochromic probe. If the latter is a good model for the reaction or process under consideration, one can access information (about the composition of the solvation layer) that is inaccessible by other techniques. To our view, this represents a practical solution for a complex problem. Theoretical calculations will certainly enhance our understanding of solvation, because they permit, inter alia, calculation of the UV-Vis spectra of probes in mixed solvents [], and prediction of solvatochromism [].
A list of all abbreviations employed is given below. The structures of the solvatochromic probes discussed are shown in Figure 7.
Funding
This research received no external funding.
Acknowledgments
We thank the following agencies for research project grants: O. A. El Seoud, FAPESP, grant 2014/22136-4; CNPq, grant 306108/2019-4; N. I. Malek, UGC-DAE, Collaborative Research Scheme (UDCSR/MUM/CRS-M-997/2023). O. A. El Seoud thanks Clarissa T. Martins, Carina Loffredo, Erika B. Tada, Jéssica C. de Jesus, Ludmila C. Fidale, Luzia P. Novaki, Marc Kostag, Marcella T. Dignani, Nicolas Keppeler, Paulo R. Pires, Priscilla L. Silva, Romeu Casarano; Shirley Possidonio, and Thaís A. Bioni because their dedication and enthusiasm resulted in the solvatochromic results discussed here, and C. Reichardt for stimulating discussions on solvatochromism during his visits to Marburg.
Conflicts of Interest
The authors declare no conflict of interest.
Abbreviations and Acronyms
| AlMeImCl | 1-Allyl-3-methylimidazolium chloride |
| BuMeImCl | 1-(1-butyl)-3-methylimidazolium chloride |
| BuPMBr2 | 2,6-dibromo-4-[(E)-2-(1-butylpyridinium-4-yl)ethenyl] |
| t-Bu5RB | 2,6-bis[4-(t-butyl)phenyl]-4-{2,4,6-tris[4-(t-butyl)phenyl]pyridinium-1-yl}phenolate |
| t-BuOH | tert-Butanol |
| o-CB | 2-(pyridinium-1-yl)phenolate |
| p-CB | 4- (pyridinium-1-yl)phenolate |
| DMANF | 2-(N,N-dimethylamino)-7-nitrofluorene |
| DMF | N,N-Dimethylformamide |
| DMSO | Dimethyl sulfoxide |
| DNPC | 2,4-dinitrophenyl carbonate |
| DTBSB | o,o’-di-tert-butylstilbazolium betaine |
| ET (probe) | Empirical solvent polarity scale using a specific probe |
| EtOH | Ethanol |
| FePhen | [FeII(1,10-phenanthroline)2(CN)2] |
| HxPMBr2 | 2,6-Dibromo-4-[(E)-2-(1-hexylpyridinium-4-yl)ethenyl] |
| IL | Ionic liquid |
| Log P | Partition coefficient between two partially immiscible solvents, usually n-octanol and water |
| MCC | Microcrystalline cellulose |
| MeCN | Acetonitrile |
| MeOEtOH | 2-Methoxyethanol |
| MeOH | Methanol |
| MePMBr2 | 2,6-Dibromo-4-[(E)-2-(1-methylpyridinium-4-yl)ethenyl] |
| 2-Me-2-PrOH | 2-Methyl-2-propanol |
| MeNI | 1-Methyl-5-nitroindoline |
| MS | Molecular solvent |
| NPFB | 4-Nitrophenyl chloroformate |
| NHFB | 4-Nitrophenyl heptafluorobutyrate |
| NI | 5-Nitroindoline |
| OcPMBr2 | 2,6-Dibromo-4-[(E)-2-(1-octylpyridinium-4-yl)ethenyl] |
| PEG | Polyethylene glycol |
| 1-PrOH | 1-Propanol |
| QB | 1-Methylquinolinium-8-olate |
| RB (or p-RB) | Reichardt betaine, dye number 30 in a list of solvatochromic dyes; 2,6-diphenyl-4-(2,4,6-triphenylpyridinium-1-yl) phenolate. |
| o-RB | 2,4-dimethyl-6-(2,4,6-triphenylpyridinium-1-yl)phenolate, |
| RDA | Retro-Diels—Alder reaction |
| SA | Solvent Lewis acidity; calculated from solvatochromic data |
| SB | Solvent Lewis Basicity; calculated from solvatochromic data |
| SD | Solvent dipolarity; calculated from solvatochromic data |
| Solvatochromism Effect of the medium on the color of a solvatochromic probe | |
| SP | Solvent polarizability; calculated from solvatochromic data |
| TBSB | o-tert-butylstilbazolium betaine |
| Thermo-solvatochromism Effect of temperature on solvatochromism | |
| THF | Tetrahydrofuran |
| WB | Wolfbeis betaine; 2,6-dichloro-4-(2,4,6-triphenylpyridinium-1-yl)-phenolate |
| φ | Fractionation factor: Refers to solvent exchange equilibrium constant between bulk solvent mixture and the solvation layer of the probe |
| χ | Mole fraction |
References
- Chiavone-Filho, O.; Rasmussen, P. Solubilities of Salts in Mixed Solvents. J. Chem. Eng. Data 1993, 38, 367–369. [Google Scholar] [CrossRef]
- Pinho, S.P.; Macedo, E.A. Solubility of NaCl, NaBr, and KCl in Water, Methanol, Ethanol, and Their Mixed Solvents. J. Chem. Eng. Data 2005, 50, 29–32. [Google Scholar] [CrossRef]
- Dogan, H.; Hilmioglu, N.D. Dissolution of cellulose with NMMO by microwave heating. Carbohydr. Polym. 2009, 75, 90–94. [Google Scholar] [CrossRef]
- Kostag, M.; Jedvert, K.; Achtel, C.; Heinze, T.; El Seoud, O.A. Recent advances in solvents for the dissolution, shaping and derivatization of cellulose: Quaternary ammonium electrolytes and their solutions in water and molecular solvents. Molecules 2018, 23, 511. [Google Scholar] [CrossRef] [PubMed]
- El Seoud, O.A.; Bioni, T.A.; Dignani, M.T. Understanding cellulose dissolution in ionic liquid-dimethyl sulfoxide binary mixtures: Quantification of the relative importance of hydrogen bonding and hydrophobic interactions. J. Mol. Liq. 2021, 322, 114848. [Google Scholar] [CrossRef]
- Keppeler, N.; Pires, P.A.R.; Freitas, J.L.S.; El Seoud, O.A. Cellulose dissolution in mixtures of ionic liquids and molecular solvents: The fruitful synergism of experiment and theory. J. Mol. Liq. 2023, 386, 122490. [Google Scholar] [CrossRef]
- Minnick, D.L.; Flores, R.A.; DeStefano, M.R.; Scurto, A.M. Cellulose Solubility in Ionic Liquid Mixtures: Temperature, Cosolvent, and Antisolvent Effects. J. Phys. Chem. B 2016, 120, 7906–7919. [Google Scholar] [CrossRef]
- Zhong, C.; Cheng, F.; Zhu, Y.; Gao, Z.; Jia, H.; Wei, P. Dissolution mechanism of cellulose in quaternary ammonium hydroxide: Revisiting through molecular interactions. Carbohydr. Polym. 2017, 174, 400–408. [Google Scholar] [CrossRef]
- El Seoud, O.A.; Keppeler, N. Education for Sustainable Development: An Undergraduate Chemistry Project on Cellulose Dissolution, Regeneration, and Chemical Recycling of Polycotton. J. Lab. Chem. Educ. 2020, 8, 11–17. [Google Scholar] [CrossRef]
- Zhang, K.; Yang, J.; Yu, X.; Zhang, J.; Wei, X. Densities and Viscosities for Binary Mixtures of Poly(ethylene glycol) 400 + Dimethyl Sulfoxide and Poly(ethylene glycol) 600 + Water at Different Temperatures. J. Chem. Eng. Data 2011, 56, 3083–3088. [Google Scholar] [CrossRef]
- Yang, F.; Wang, X.; Tan, H.; Liu, Z. Improvement the viscosity of imidazolium-based ionic liquid using organic solvents for biofuels. J. Mol. Liq. 2017, 248, 626–633. [Google Scholar] [CrossRef]
- Lv, Y.; Wu, J.; Zhang, J.; Niu, Y.; Liu, C.-Y.; He, J.; Zhang, J. Rheological properties of cellulose/ionic liquid/dimethylsulfoxide (DMSO) solutions. Polymer 2012, 53, 2524–2531. [Google Scholar] [CrossRef]
- Alam, M.S.; Ashokkumar, B.; Siddiq, A.M. The density, dynamic viscosity and kinematic viscosity of protic and aprotic polar solvent (pure and mixed) systems: An experimental and theoretical insight of thermophysical properties. J. Mol. Liq. 2019, 281, 584–597. [Google Scholar] [CrossRef]
- Suppan, P. Local polarity of solvent mixtures in the field of electronically excited molecules and exciplexes. J. Chem. Soc. Faraday Trans. 1 Phys. Chem. Condens. Phases 1987, 83, 495. [Google Scholar] [CrossRef]
- Suppan, P. Time-resolved luminescence spectra of dipolar excited molecules in liquid and solid mixtures. Dynamics of dielectric enrichment and microscopic motions. Faraday Discuss. Chem. Soc. 1988, 85, 173. [Google Scholar] [CrossRef]
- LNovaki, P.; El Seoud, O.A. Solvatochromism in binary solvent mixtures: Effects of the molecular structure of the probe. Berichte Bunsenges. Phys. Chem. 1997, 101, 902–909. [Google Scholar] [CrossRef]
- Skaf, M.S. Molecular Dynamics Study of Dielectric Properties of Water−Dimethyl Sulfoxide Mixtures. J. Phys. Chem. A 1999, 103, 10719–10729. [Google Scholar] [CrossRef]
- El Seoud, O.A. Solvation in pure and mixed solvents: Some recent developments. Pure Appl. Chem. 2007, 79, 1135–1151. [Google Scholar] [CrossRef]
- Machado, V.G.; Stock, R.I.; Reichardt, C. Pyridinium N -Phenolate Betaine Dyes. Chem. Rev. 2014, 114, 10429–10475. [Google Scholar] [CrossRef]
- Bai, B.; Li, Z.; Wang, H.; Li, M.; Ozaki, Y.; Wei, J. Exploring the difference in xerogels and organogels through in situ observation. R. Soc. Open Sci. 2018, 5, 170492. [Google Scholar] [CrossRef]
- McHale, J.L. Subpicosecond Solvent Dynamics in Charge-Transfer Transitions: Challenges and Opportunities in Resonance Raman Spectroscopy. Acc. Chem. Res. 2001, 34, 265–272. [Google Scholar] [CrossRef] [PubMed]
- Jha, K.K.; Kumar, A.; Munshi, P. Solvatochromism and Reversible Solvent Exchange Phenomena in Solvatomorphic Organic Chromophore Crystals. Cryst. Growth Des. 2023, 23, 2922–2931. [Google Scholar] [CrossRef]
- Martins, C.T.; Lima, M.S.; El Seoud, O.A. Thermosolvatochromism of merocyanine polarity indicators in pure and aqueous solvents: Relevance of solvent lipophilicity. J. Org. Chem. 2006, 71, 9068–9079. [Google Scholar] [CrossRef] [PubMed]
- El Seoud, O.A.; Loffredo, C.; Galgano, P.D.; Sato, B.M.; Reichardt, C. Have biofuel, will travel: A colorful experiment and a different approach to teach the undergraduate laboratory. J. Chem. Educ. 2011, 88, 1293–1297. [Google Scholar] [CrossRef]
- Pires, P.A.R.; El Seoud, O.A.; Machado, V.G.; de Jesus, J.C.; de Melo, C.E.A.; Buske, J.L.O.; Cardozo, A.P. Understanding Solvation: Comparison of Reichardt’s Solvatochromic Probe and Related Molecular ‘core’ Structures. J. Chem. Eng. Data 2019, 64, 2213–2220. [Google Scholar] [CrossRef]
- Dimroth, K.; Reichardt, C.; Siepmann, T.; Bohlmann, F. Über Pyridinium-N-phenol-betaine und ihre Verwendung zur Charakterisierung der Polarität von Lösungsmitteln. Justus Liebigs Ann. Chem. 1963, 661, 1–37. [Google Scholar] [CrossRef]
- Reichardt, C.; Welton, T. Solvents and Solvent Effects in Organic Chemistry, 4th ed.; John Wiley & Sons: Hoboken, NJ, USA, 2011. [Google Scholar]
- NWeiß; Schmidt, C.H.; Thielemann, G.; Heid, E.; Schröder, C.; Spange, S. The physical significance of the Kamlet–Taft π* parameter of ionic liquids. Phys. Chem. Chem. Phys. 2021, 23, 1616–1626. [Google Scholar] [CrossRef]
- El Seoud, O.A.; Kostag, M.; Jedvert, K.; Malek, N.I. Cellulose in Ionic Liquids and Alkaline Solutions: Advances in the Mechanisms of Biopolymer Dissolution and Regeneration. Polymers 2019, 11, 1917. [Google Scholar] [CrossRef]
- Tada, E.B.; Silva, P.L.; El Seoud, O.A. Thermo-solvatochromism of zwitterionic probes in aqueous alcohols: Effects of the properties of the probe and the alcohol. Phys. Chem. Chem. Phys. 2003, 5, 5378–5385. [Google Scholar] [CrossRef]
- Antonious, M.S.; Tada, E.B.; El Seoud, O.A. Thermo-solvatochromism in aqueous alcohols: Effects of the molecular structures of the alcohol and the-solvatochromic probe. J. Phys. Org. Chem. 2002, 15, 403–412. [Google Scholar] [CrossRef]
- Rosés, M.; Ràfols, C.; Ortega, J.; Bosch, E. Solute–solvent and solvent–solvent interactions in binary solvent mixtures. Part 1. A comparison of several preferential solvation models for describing ET(30) polarity of bipolar hydrogen bond acceptor-cosolvent mixtures. J. Chem. Soc. Perkin Trans. 1995, 2, 1607–1615. [Google Scholar] [CrossRef]
- Bosch, E.; Herodes, K.; Koppel, I.; Leito, I.; Koppel, I.; Taal, V.; Rosés, M. Solute-solvent and solvent-solvent interactions in binary solvent mixtures. 2. Effect of temperature on the ET(30) polarity parameter of dipolar hydrogen bond acceptor-hydrogen bond donor mixtures. J. Phys. Org. Chem. 1996, 9, 403–410. [Google Scholar] [CrossRef]
- Ortega, J.; Ràfols, C.; Bosch, E.; Rosés, M. Solute–solvent and solvent–solvent interactions in binary solvent mixtures. Part 3. The ET(30) polarity of binary mixtures of hydroxylic solvents. J. Chem. Soc. Perkin Trans. 1996, 2, 1497–1503. [Google Scholar] [CrossRef]
- Bosch, E.; Rived, F.; Rosés, M. Solute–solvent and solvent–solvent interactions in binary solvent mixtures. Part 4. Preferential solvation of solvatochromic indicators in mixtures of 2-methylpropan-2-ol with hexane, benzene, propan-2-ol, ethanol and methanol. J. Chem. Soc. Perkin Trans. 1996, 2, 2177–2184. [Google Scholar] [CrossRef]
- Ràfols, C.; Rosés, M.; Bosch, E. Solute–solvent and solvent–solvent interactions in binary solvent mixtures. Part 5. Preferential solvation of solvatochromic indicators in mixtures of propan-2-ol with hexane, benzene, ethanol and methanol. J. Chem. Soc. Perkin Trans. 1997, 2, 243–248. [Google Scholar] [CrossRef]
- Buhvestov, U.; Rived, F.; Ràfols, C.; Bosch, E.; Rosés, M. Solute-solvent and solvent-solvent interactions in binary solvent mixtures. Part 7. Comparison of the enhancement of the water structure in alcohol-water mixtures measured by solvatochromic indicators. J. Phys. Org. Chem. 1998, 11, 185–192. [Google Scholar] [CrossRef]
- Chen, J.-S.; Shiao, J.-C. Graphic method for the determination of the complex NMR shift and equilibrium constant for a hetero-association accompanying a self-association. J. Chem. Soc. Faraday Trans. 1994, 90, 429. [Google Scholar] [CrossRef]
- Eblinger, F.; Schneider, H.-J. Self-Association of Water and Water−Solute Associations in Chloroform Studied by NMR Shift Titrations. J. Phys. Chem. 1996, 100, 5533–5537. [Google Scholar] [CrossRef]
- Sacco, A.; De Cillis, F.M.; Holz, M. NMR Studies on hydrophobic interactions in solution Part 3 Salt effects on the self-association of ethanol in water at two different temperatures. J. Chem. Soc. Faraday Trans. 1998, 94, 2089–2092. [Google Scholar] [CrossRef]
- Max, J.-J.; Daneault, S.; Chapados, C. 1-Propanol hydrate by IR spectroscopy. Can. J. Chem. 2002, 80, 113–123. [Google Scholar] [CrossRef]
- Nomen, R.; Sempere, J.; Avilés, K. Detection and characterisation of water alcohol hydrates by on-line FTIR using multivariate data analysis. Chem. Eng. Sci. 2001, 56, 6577–6588. [Google Scholar] [CrossRef]
- Ghoraishi, M.S.; Hawk, J.E.; Phani, A.; Khan, M.F.; Thundat, T. Clustering mechanism of ethanol-water mixtures investigated with photothermal microfluidic cantilever deflection spectroscopy. Sci. Rep. 2016, 6, 23966. [Google Scholar] [CrossRef] [PubMed]
- Katz, E.D.; Ogan, K.; Scott, R.P.W. Distribution of a solute between two phases: The basic theory and its application to the prediction of chromatographic retention. J. Chromatogr. A 1986, 352, 67–90. [Google Scholar] [CrossRef]
- Katz, E.D.; Lochmüller, C.H.; Scott, R.P.W. Methanol-Water Association and Its Effect on Solute Retention in Liquid Chromatography. Anal. Chem. 1989, 61, 349–355. [Google Scholar] [CrossRef]
- Scott, R.P.W. The thermodynamic properties of methanol–water association and its effect on solute retention in liquid chromatography. Analyst 2000, 125, 1543–1547. [Google Scholar] [CrossRef]
- Bastos, E.L.; Silva, P.L.; El Seoud, O.A. Thermosolvatochromism of Betaine Dyes Revisited: Theoretical Calculations of the Concentrations of Alcohol−Water Hydrogen-bonded Species and Application to Solvation in Aqueous Alcohols. J. Phys. Chem. A 2006, 110, 10287–10295. [Google Scholar] [CrossRef]
- Tada, E.B.; Silva, P.L.; El Seoud, O.A. Thermo-solvatochromism of betaine dyes in aqueous alcohols: Explicit consideration of the water-alcohol complex. J. Phys. Org. Chem. 2003, 16, 691–699. [Google Scholar] [CrossRef]
- Sato, B.M.; de Oliveira, C.G.; Martins, C.T.; El Seoud, O.A. Thermo-solvatochromism in binary mixtures of water and ionic liquids: On the relative importance of solvophobic interactions. Phys. Chem. Chem. Phys. 2010, 12, 1764. [Google Scholar] [CrossRef]
- Spange, S.; Lienert, C.; Friebe, N.; Schreiter, K. Complementary interpretation of ET(30) polarity parameters of ionic liquids. Phys. Chem. Chem. Phys. 2020, 22, 9954–9966. [Google Scholar] [CrossRef]
- Sato, B.M.; Martins, C.T.; El Seoud, O.A. Solvation in aqueous binary mixtures: Consequences of the hydrophobic character of the ionic liquids and the solvatochromic probes. New J. Chem. 2012, 36, 2353. [Google Scholar] [CrossRef]
- Martins, C.T.; Lima, M.S.; El Seoud, O.A. A novel, convenient, quinoline-based merocyanine dye: Probing solvation in pure and mixed solvents and in the interfacial region of an anionic micelle. J. Phys. Org. Chem. 2005, 18, 1072–1085. [Google Scholar] [CrossRef]
- Tada, E.B.; Silva, P.L.; Tavares, C.; El Seoud, O.A. Thermo-solvatochromism of zwitterionic probes in aqueous aliphatic alcohols and in aqueous 2-alkoxyethanols: Relevance to the enthalpies of activation of chemical reactions. J. Phys. Org. Chem. 2005, 18, 398–407. [Google Scholar] [CrossRef]
- El Seoud, O.A.; El Seoud, M.I.; Farah, J.P.S. Kinetics of the pH-Independent Hydrolysis of Bis(2,4-dinitrophenyl) Carbonate in Acetonitrile−Water Mixtures: Effects of the Structure of the Solvent. J. Org. Chem. 1997, 62, 5928–5933. [Google Scholar] [CrossRef]
- El Seoud, O.A.; Siviero, F. Kinetics of the pH-independent hydrolyses of 4-nitrophenyl chloroformate and 4-nitrophenyl heptafluorobutyrate in water-acetonitrile mixtures: Consequences of solvent composition and ester hydrophobicity. J. Phys. Org. Chem. 2006, 19, 793–802. [Google Scholar] [CrossRef]
- Easteal, A. A Nuclear Magnetic Resonance Study of Water + Acetonitrile Mixtures. Aust. J. Chem. 1979, 32, 1379. [Google Scholar] [CrossRef]
- Balakrishnan, S.; Easteal, A. Intermolecular interactions in water + acetonitrile mixtures: Evidence from the composition variation of solvent polarity parameters. Aust. J. Chem. 1981, 34, 943. [Google Scholar] [CrossRef]
- Easteal, A.J.; Woolf, L.A. Measurement of (p, V, x) for (water + acetonitrile) at 298.15 K. J. Chem. Thermodyn. 1982, 14, 755–762. [Google Scholar] [CrossRef]
- Schowen, K.B.J. Solvent Hydrogen Isotope Effects. In Transition States of Biochemical Processes; Springer: Boston, MA, USA, 1978; pp. 225–283. [Google Scholar]
- Wijnen, J.W.; Engberts, J.B.F.N. Retro-Diels-Alder Reaction in Aqueous Solution: Toward a Better Understanding of Organic Reactivity in Water. J. Org. Chem. 1997, 62, 2039–2044. [Google Scholar] [CrossRef]
- Bioni, T.A.; de Oliveira, M.L.; Dignani, M.T.; El Seoud, O.A. Understanding the efficiency of ionic liquids-DMSO as solvents for carbohydrates: Use of solvatochromic- and related physicochemical properties. New J. Chem. 2020, 44, 14906–14914. [Google Scholar] [CrossRef]
- Lacerda, E.G.; Canuto, S.; Coutinho, K. New insights on nonlinear solvatochromism in binary mixture of solvents. In Advances in Quantum Chemistry; Oddershede, J., Brändas, E.J., Eds.; Jack Sabin, Scientist and Friend; Academic Press: Cambridge, MA, USA, 2022; pp. 57–79. [Google Scholar]
- Saini, V.; Kumar, R. A machine learning approach for predicting the empirical polarity of organic solvents. New J. Chem. 2022, 46, 16981–16989. [Google Scholar] [CrossRef]
Disclaimer/Publisher’s Note: The statements, opinions and data contained in all publications are solely those of the individual author(s) and contributor(s) and not of MDPI and/or the editor(s). MDPI and/or the editor(s) disclaim responsibility for any injury to people or property resulting from any ideas, methods, instructions or products referred to in the content. |
© 2024 by the authors. Licensee MDPI, Basel, Switzerland. This article is an open access article distributed under the terms and conditions of the Creative Commons Attribution (CC BY) license (https://creativecommons.org/licenses/by/4.0/).