1. Introduction
The present trend in public and private transportation systems focuses on replacing internal combustion engine (ICE) cars with electric vehicles, representing a challenge for the vehicle industry because of the giant effort to manufacture millions of electric cars in the coming decades [
1]. Indeed, supranational organizations, such as the United Nations or the European Commission, are in favor of electrifying the vehicle fleet by mid-century. [
2,
3,
4,
5].
Today, three systems apply to the process: batteries, ultracapacitors, and fuel cells [
6,
7,
8,
9], all operating with continuous current at the selected power and voltage [
10,
11,
12]. Battery-powered electric vehicles dominate the market with an implementation rate of over 99.5%, either in Battery Electric Vehicle (BEV), Plug-in Hybrid Electric Vehicle (PHEV), or Hybrid Electric Vehicle (HEV) [
13]. Most battery-powered electric vehicles use lithium-ion batteries because of their high specific power, energy density, wide temperature operationality, cycle life, high cell voltage, low self-discharge, and fast charging support [
14,
15,
16,
17]. On the other hand, lithium-ion batteries suffer from some disadvantages, like fire risk, high price, and safety requirements [
18]. Nevertheless, despite the cost of an electric vehicle without subsidy now being on the same order as that of a combustion vehicle in the same category, the total cost of ownership (TCO) is more favorable to the electric vehicle.
The continuous growth in lithium demand for EVs and portable applications, computers, tablets, and small electronic devices suggests a complex future for lithium applications [
19,
20,
21]. Lithium resources are finite; therefore, the lithium industry depends on new reserves [
22,
23]. Conversely, some authors say that lithium scarcity will not occur in the future due to sufficient reserves or better management [
24,
25].
The research community and car manufacturers turn their attention to hydrogen as an alternative to lithium for powering electric vehicles [
26,
27,
28] despite the many problems associated with hydrogen use in cars [
29] because of the dependence on new lithium reserves for powering battery electric vehicles.
One of the insurmountable obstacles in the short run of hydrogen application for powering electric vehicles derives from the barriers to hydrogen refueling station implementation [
30,
31,
32]. Despite the existing barriers, the number of hydrogen refueling stations has increased in some regions, showing the feasibility of their implementation [
33]. Nevertheless, the hydrogen refueling station density is low or null in many world regions, motivating people not to consider fuel cell electric vehicles as a feasible alternative to atmospheric engines.
Additional barriers come from the system manufacturing cost, including the materials for hydrogen production from electrolysis. The Proton Exchange Membrane Water Electrolysis (PEMWE) technique requires not only fundamental elements for the polymeric membrane like Nafion but also some rare elements such as titanium, tantalum, or niobium, which are geopolitically dependent since their principal deposits are in Canada, Brazil, Finland Russia, and the Congo for niobium, Egypt and China for tantalum [
34], and Australia, China, India, South Africa, and Ukraine for titanium [
35].
On the other hand, the Alkaline Water Electrolysis (AWE) technology is not very flexible and suffers from moderate efficiency, 60% at the maximum, which limits the global processing performance [
36]. This efficiency is lower than hydrogen production from reforming technology (65–75%) [
37,
38]. In summary, there is not a high difference between the various technologies for hydrogen production since hydrogen production efficiency from pure water electrolysis moves in the range of 70% to 80% [
39,
40].
The cascade pressurization system is not new since it has been widely used in the gas industry like in integrated liquid air energy storage [
41,
42], natural gas condensation [
43], refrigeration systems [
44], or liquefaction processes [
45,
46], among other applications.
This paper contributes to reducing the infrastructure barriers to implementing hydrogen refueling stations by proposing a new design to minimize the station structure and simplifying the refueling process by using a hybrid cascade hydrogen storage system combined with a small compression unit. The new design reduces the infrastructure layout, minimizes the investment cost, and promotes small hydrogen refueling station installation, favoring the implementation of a dense H
2 station network. The results obtained in the present study corroborate previous analysis developed to evaluate the advantages of refueling stations using a multi-tank cascade system [
47,
48].
On the other hand, this paper contributes to improving the scientific background through a detailed thermodynamic study of system performance, analyzing the thermal behavior and pressure evolution of gases contained in the storage block unit.
2. Background
Hydrogen refueling stations are of two types: off-site and on-site hydrogen production [
49,
50,
51]. The principal difference between the two types is the hydrogen production unit that characterizes the on-site hydrogen refueling station.
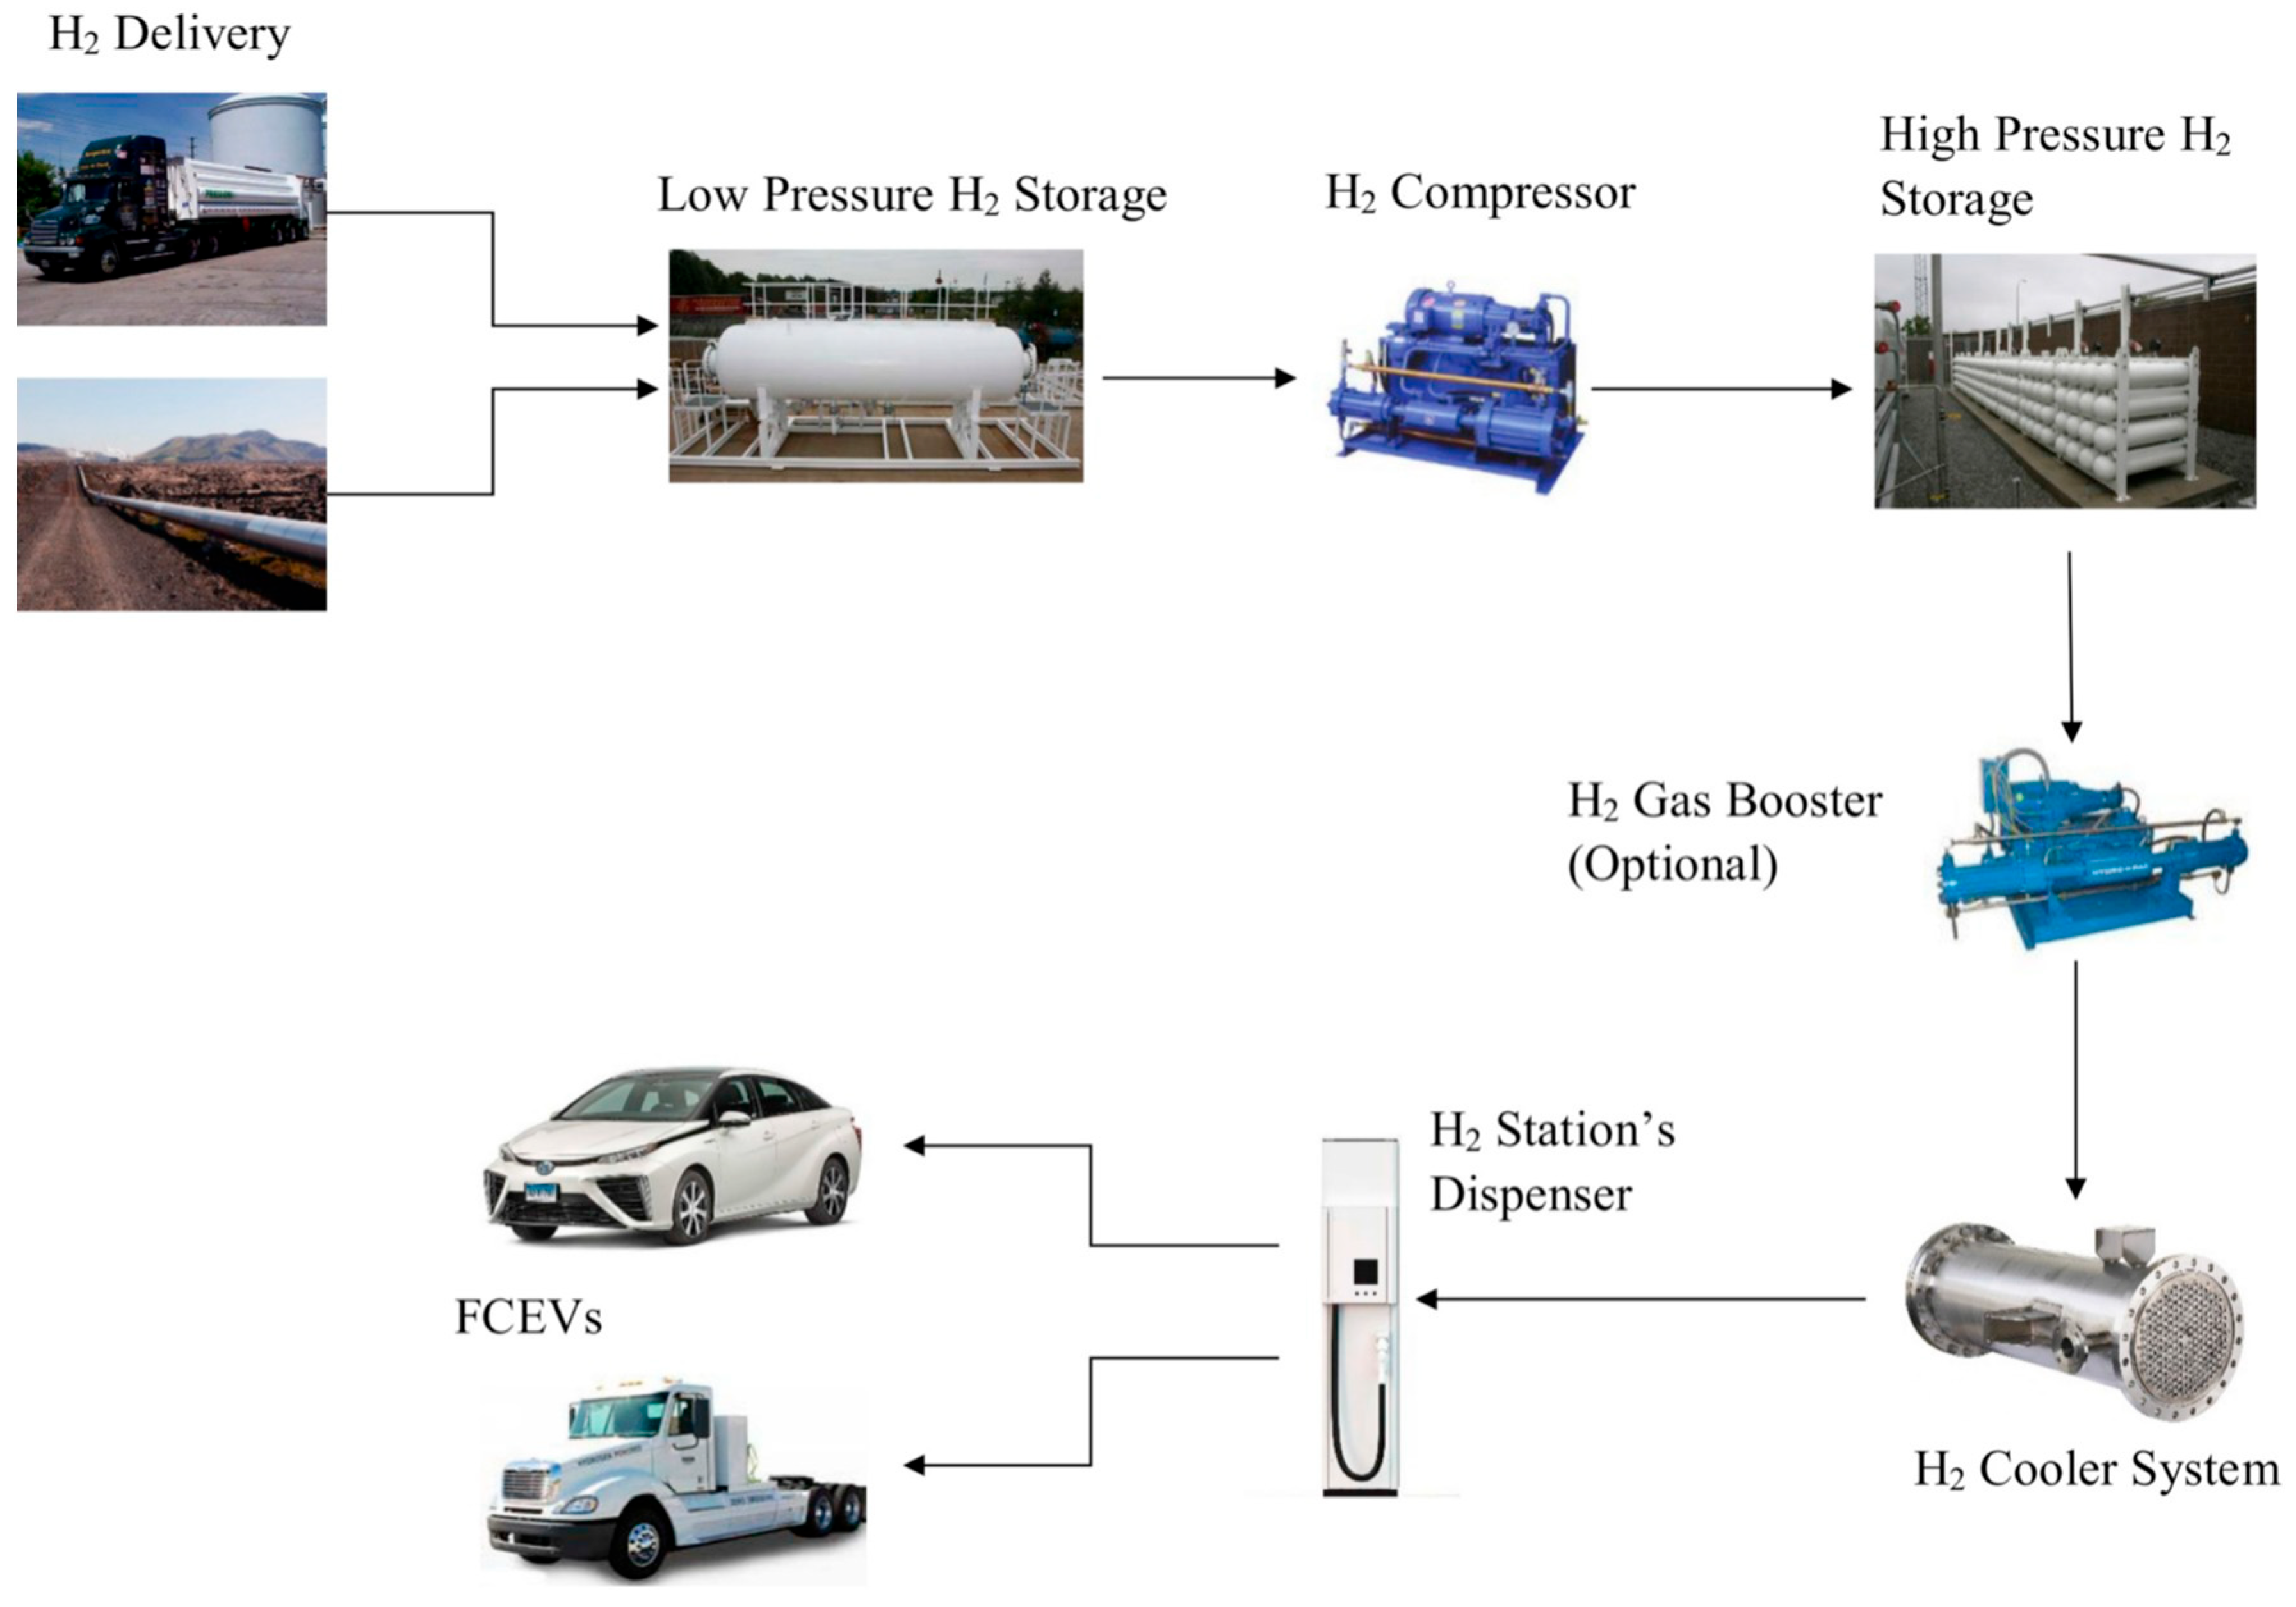
An off-site H
2 production in a hydrogen gas refueling station consists of the following components (
Figure 1).
The supply to the off-site hydrogen refueling station currently depends on two external sources: intermittent delivery by high-capacity trucks or continuous supply through a hydrogen pipeline. In the first case, the supply is not warranted if road access to the refueling station is blocked due to atmospheric conditions or accidental interruption in the distribution process. The supply from a pipeline is more reliable and constant since it does not depend on meteorological events. Nevertheless, it is subject to accidental breakdown in the pipeline layout or interruptions due to the distribution management.
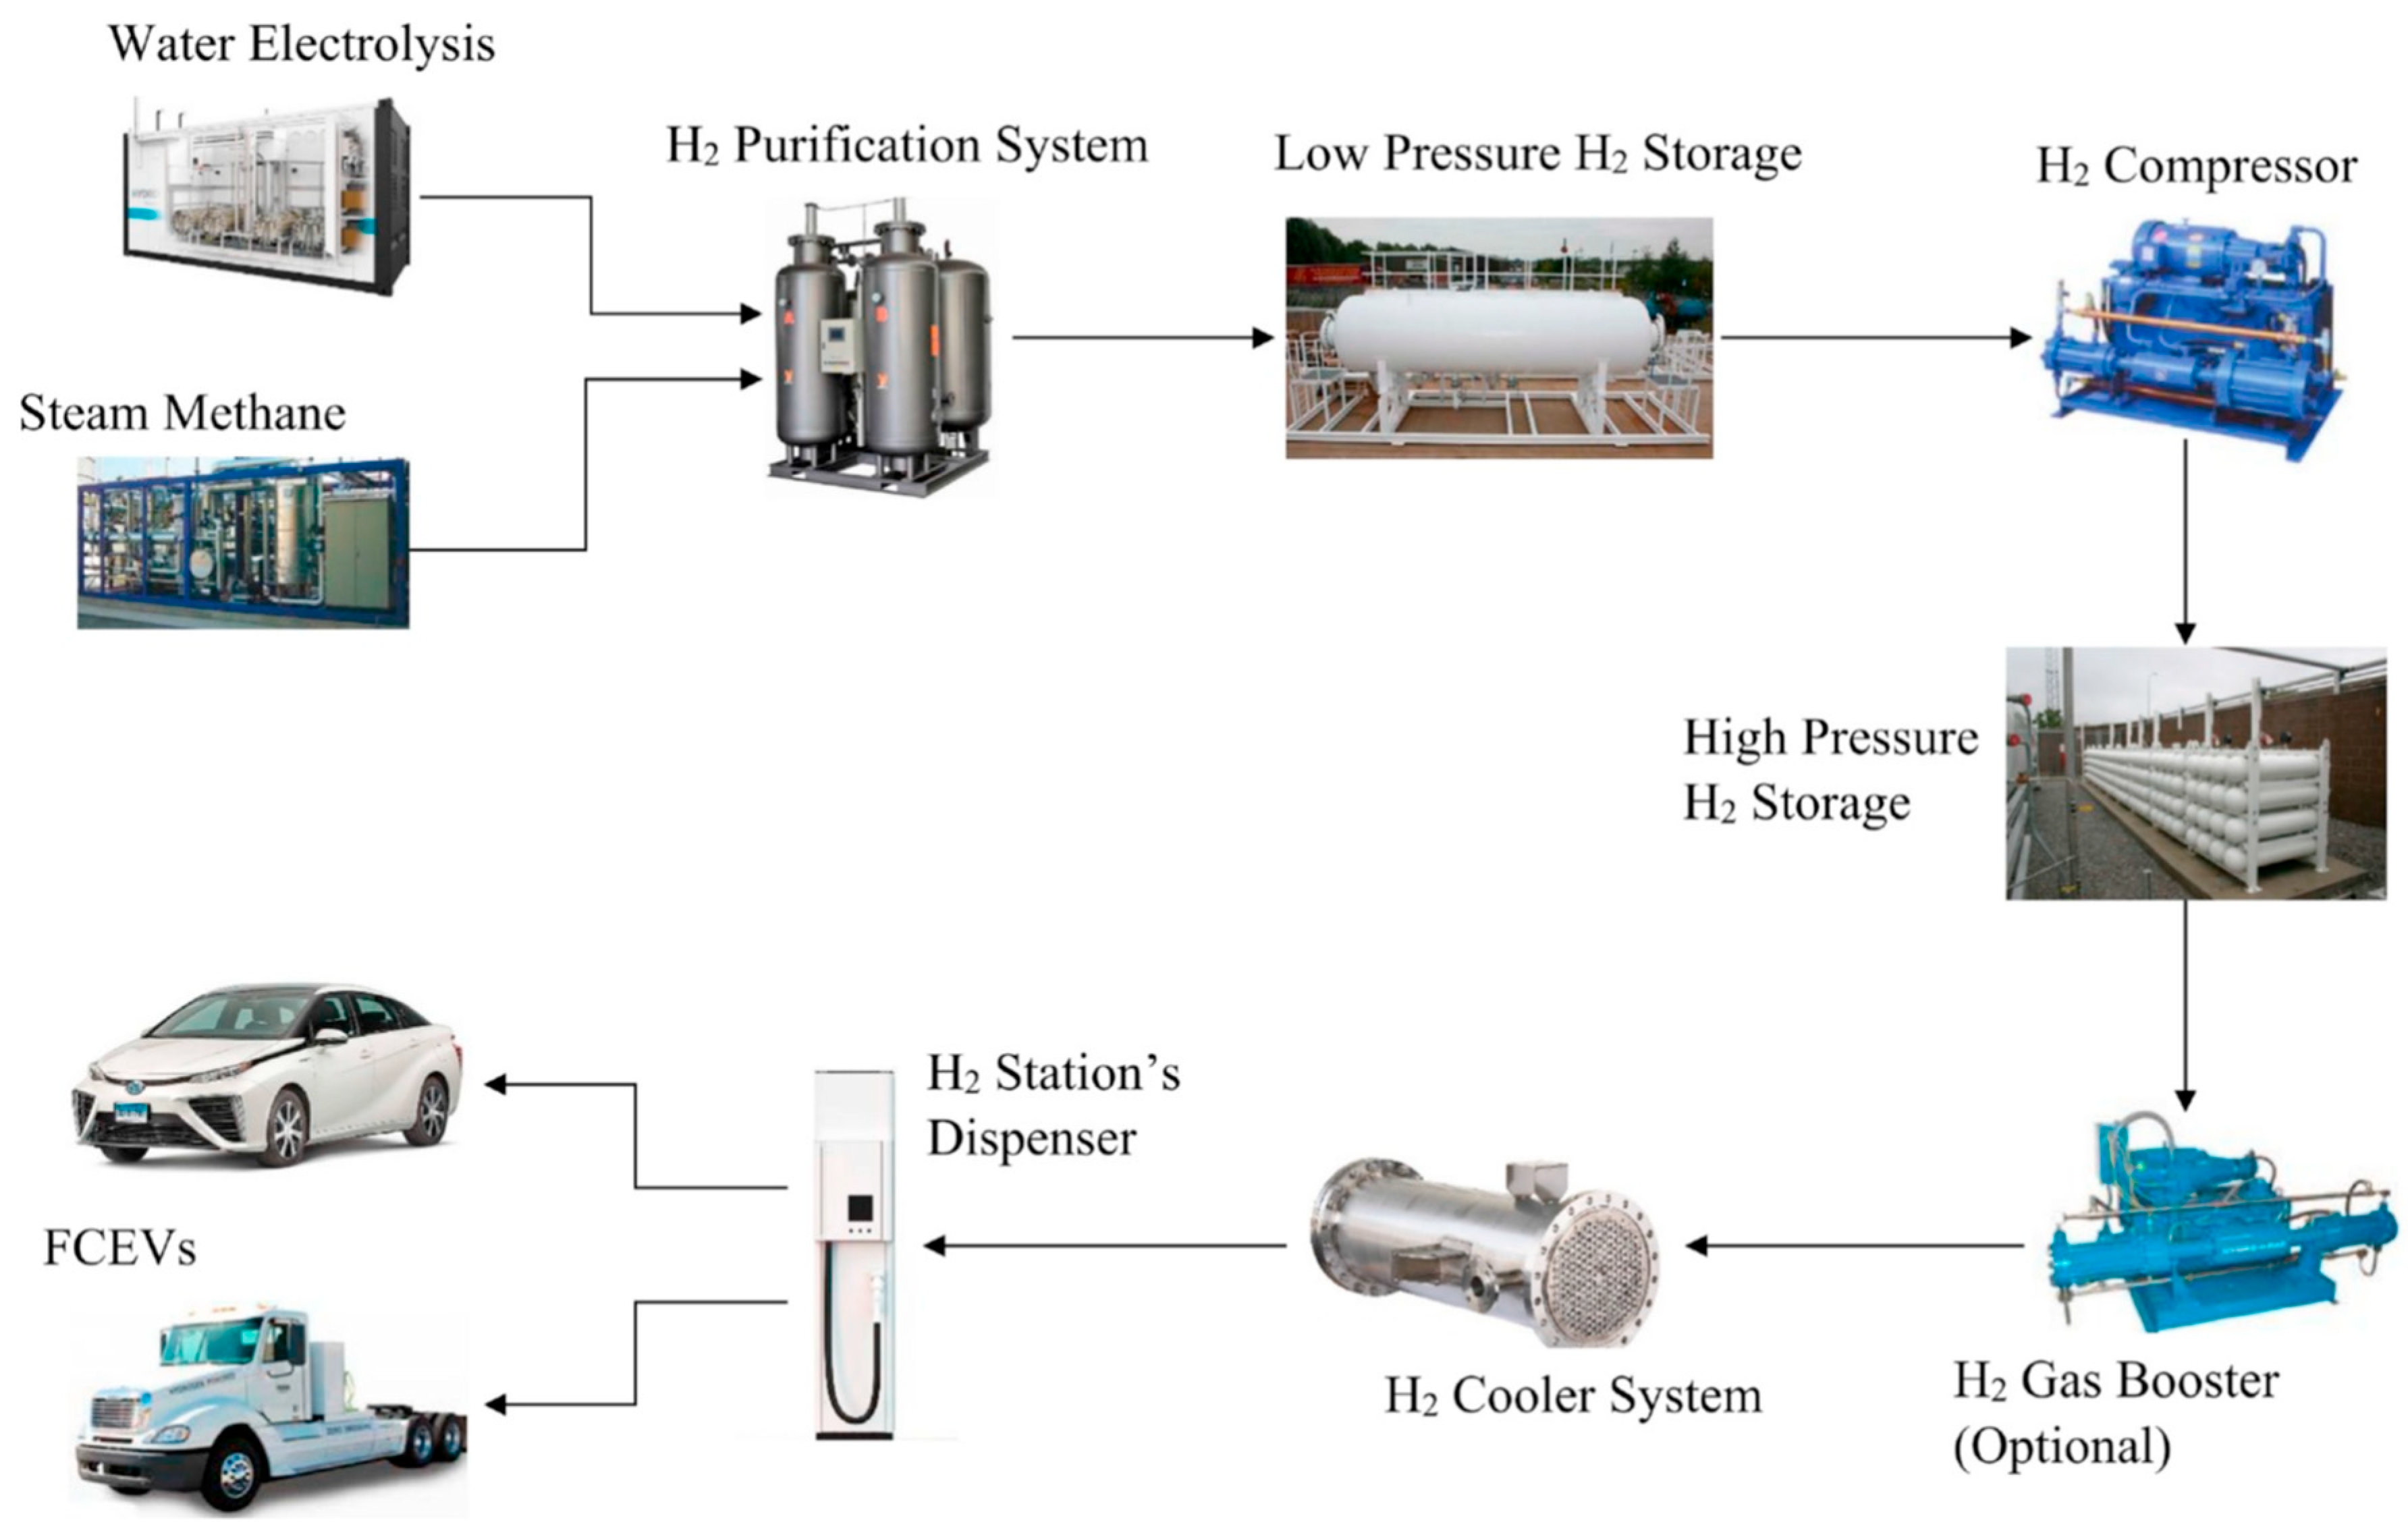
The on-site refueling station does not need any external supply since it produces hydrogen by water electrolysis or steam methane reforming (
Figure 2).
The eliminated components reduce the system complexity and the investment cost. The industrialists tend to reduce or replace elements in the search for lower maintenance costs, reduced failure risks, and higher performance.
Despite the apparent independence of external supplies, the on-site refueling station requires distilled water or methane to feed the water electrolyzer or the steam methane reforming unit. In both cases, the system requires a hydrogen purification system to avoid gas pollution that may increase fire risk or fuel cell malfunctioning.
On-site methane production is feasible but not economically viable because of the high complex design and investment cost.
Water distillation technology is mature and does not require complex design. The design consists of a water distillation plant connected to a water source like a river, lake, or pond (
Figure 3). Water is continuously pumped from the water source to the distillation plant using a duct through which the water circulates with the help of a water pump.
Off-site and on-site H2 installation share most components.
3. Engineering Design
The cost and land use reduction involves simplifying the refueling station structure as much as possible, eliminating all components not strictly necessary for the hydrogen dispensation, and reducing the remaining size to the operational minimum. To meet this goal, we eliminate the gas pressure booster, which is optional, and we reduce the power and size of the cooling system since the hydrogen is tempered by the high-pressure tank, exchanging energy with the environment and the hydrogen transfer from the storage tank to the dispenser develops at lower gradient pressure.
Since we intend to design small refueling stations, size minimization of the structure components is critical; therefore, the design minimizes the water distillation plant to adjust the distilled water production to the hydrogen mass dispensation.
The principal novelty of the proposed design is a hydrogen storage system in cascade with tanks containing gas at the highest operating pressure connected to the compressor and the hydrogen dispenser through a manifold to distribute gas to and from the corresponding tank.
Figure 4 shows the scheme of the proposed system layout.
The system includes pressure gauges and a three-stage compressor unit that reduces excessive pressure jump.
The low-pressure section includes the water distillation unit and the hydrogen purification system, while the high-pressure section corresponds to the H2 cascade storage system and the hydrogen dispenser.
A control system is attached to the manifold to regulate hydrogen pressure entering each tank in the cascade storage system. It also operates the opening and closing tank valves for hydrogen injection or extraction. Depending on the operation conditions, the control system may operate on an individual or a group of tanks.
Comparing the new design with the conventional one for on-site hydrogen production, we observe that the system layout is less complex, reducing the land occupation and the initial investment. Because of the new design, the operation and maintenance costs are lower.
The proposed refueling station operates at variable hydrogen pressure since the compressor operates from zero to maximum attainable pressure; the current working pressure is 350 bars, although we may raise it to 700 bars by coupling a gas booster if necessary.
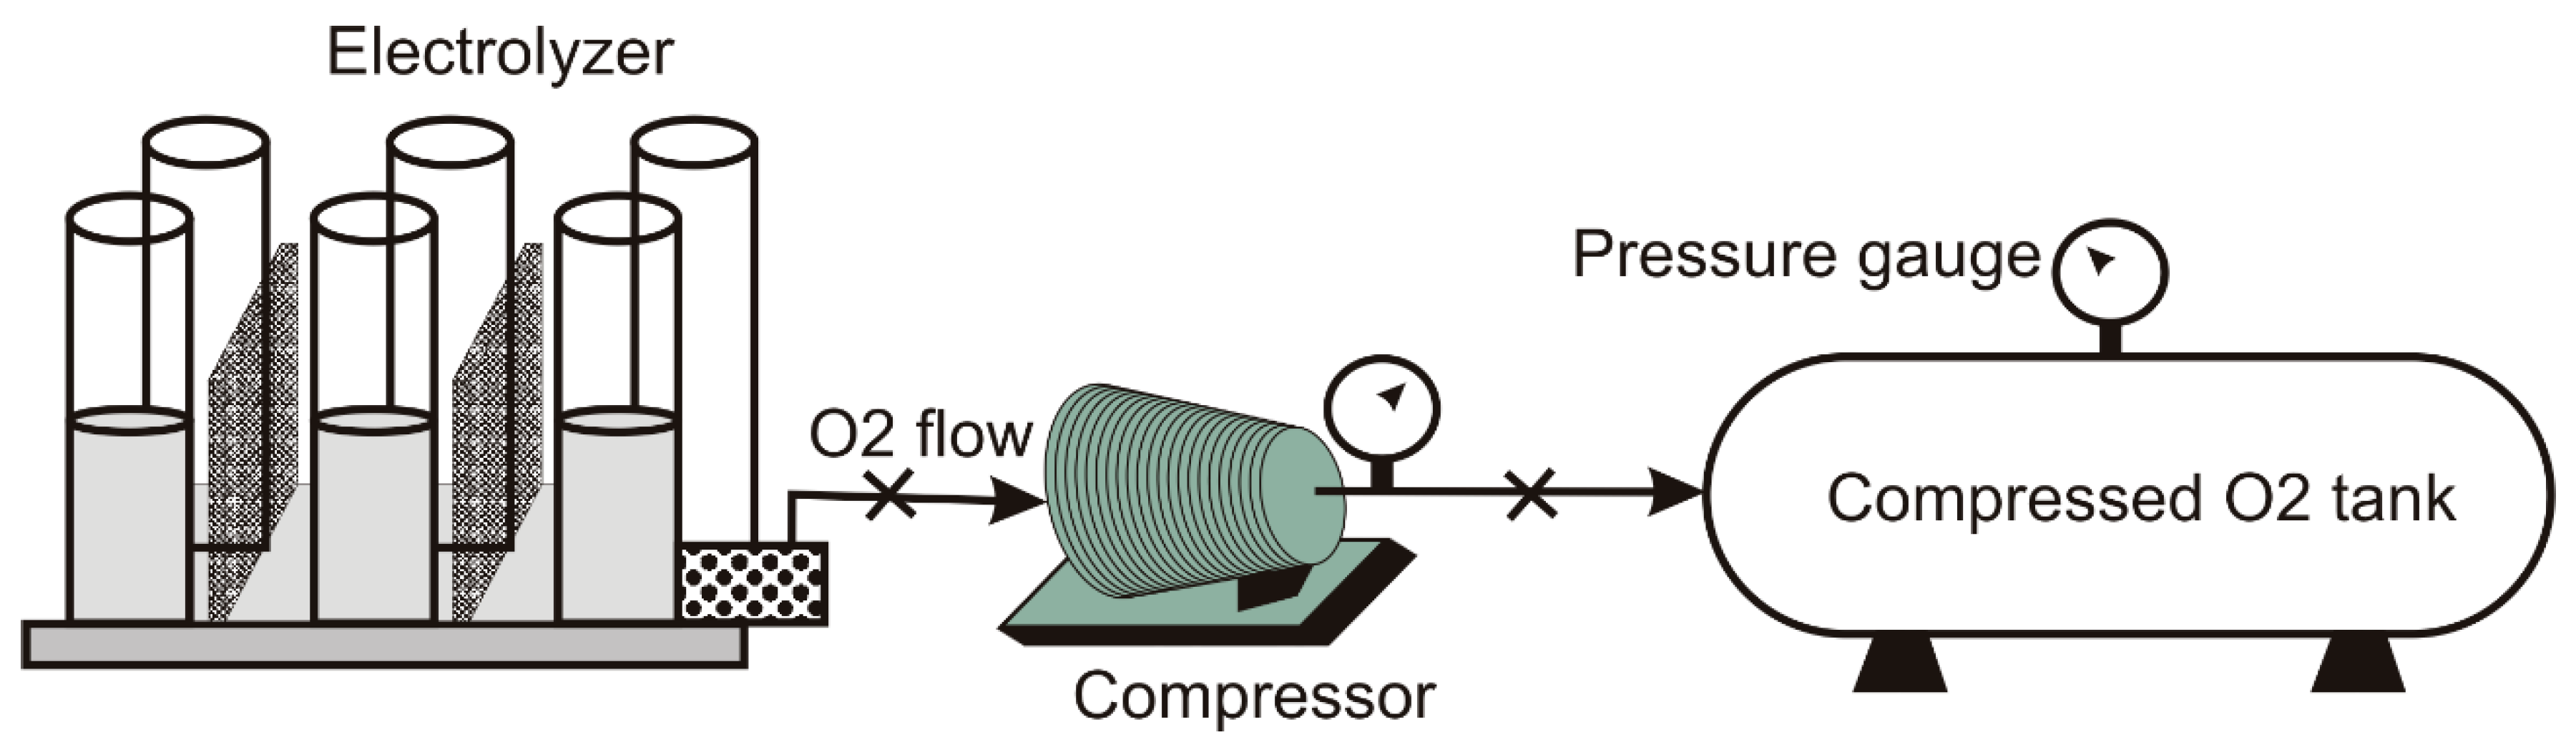
An alternative version to the designed refueling station is the advanced configuration that includes an oxygen recovery system (
Figure 5).
The oxygen recovery system is optional since oxygen is not critical for fuel cell operation, which collects the oxygen from the environment. Nevertheless, the oxygen recovery system is practical in advanced fuel cell units operating with pure oxygen for higher performance.
Since the vehicle tank refueling process from the compressed hydrogen in the storage system tanks increases gas temperature because of the sudden pressure increase, it is necessary to install a refrigeration system to cool down the hydrogen while flowing through the supplying duct. In conventional systems, on-site or off-site installations, the cooling is produced by a hydrogen cooler system like the one shown in
Figure 1 and
Figure 2. In our system, we propose to use the water flow for the distillation plant to cool the compressed hydrogen supply.
Considering that we operate at constant volume during the refueling process and applying the Boyle–Mariotte law, the gas temperature increase directly depends on the pressure gradient as in
The temperature increases with the pressure ratio; therefore, the lower the pressure ratio, the lower the temperature increase. In this sense, a gradual pressure increase through a refueling cascade method reduces the temperature increase during refueling.
The cooling system uses the water flow for the distillation plant as a heat exchange fluid in a heat exchanger with heat transfer coefficient, F
R; therefore, we obtain
Clearing the water mass flow from Equation (2):
is the water mass flow circulating through the heat exchanger,
is the refueling hydrogen mass flow,
and
cw are the hydrogen and water specific heat,
p and
po are the final and initial vehicle tank pressure at the refueling process, and Δ
Tw is the water temperature drop at the heat exchanger (
Figure 6).
We can replace the river with a lake, a pond, or a water reservoir like an industrial tank or a refilled underground cavity if there is no river in the installation vicinity.
The proposed engineering design is feasible because specialized companies can manufacture all components using current technology knowledge and development capacity. The proposed design does not differ significantly from existing industrial systems for gas compression, liquefied air storage, and similar applications.
Nevertheless, the proposed system is complex and requires a large land lot to install all the refueling station components, which limits the implementation of this type of station, especially in places with land limitations. Moreover, the high cost of this type of installation curbs the public or private investors’ interest in building hydrogen refueling stations. This situation leads to lowering the H2 network density and limiting access to this type of fuel, which reduces the hydrogen implementation as a fuel for road transportation.
Regarding system characteristics, we can mention safety, which requires specific measurements against leakage that may produce fire or explosion [
52,
53,
54] and material embrittlement due to hydrogen’s interaction with the storage tank components [
55,
56,
57,
58]. We should extend the safety measurements to truck tanks for hydrogen transportation [
59] and the analysis of failure prediction in storage tank composite materials analysis [
60].
Hydrogen leak detection in storage tanks involves various techniques to ensure safety and prevent potential hazards. These methods include using portable hydrogen detectors, listening for high-pressure gas escaping, and utilizing instrumented systems with sensors, transducers, and alarms. We can also use visual indicators, like color changes or coatings [
61,
62,
63,
64,
65]. We can use mechanical testing, such as slow strain rate testing, to detect hydrogen embrittlement in materials [
66,
67,
68].
4. Power Sources
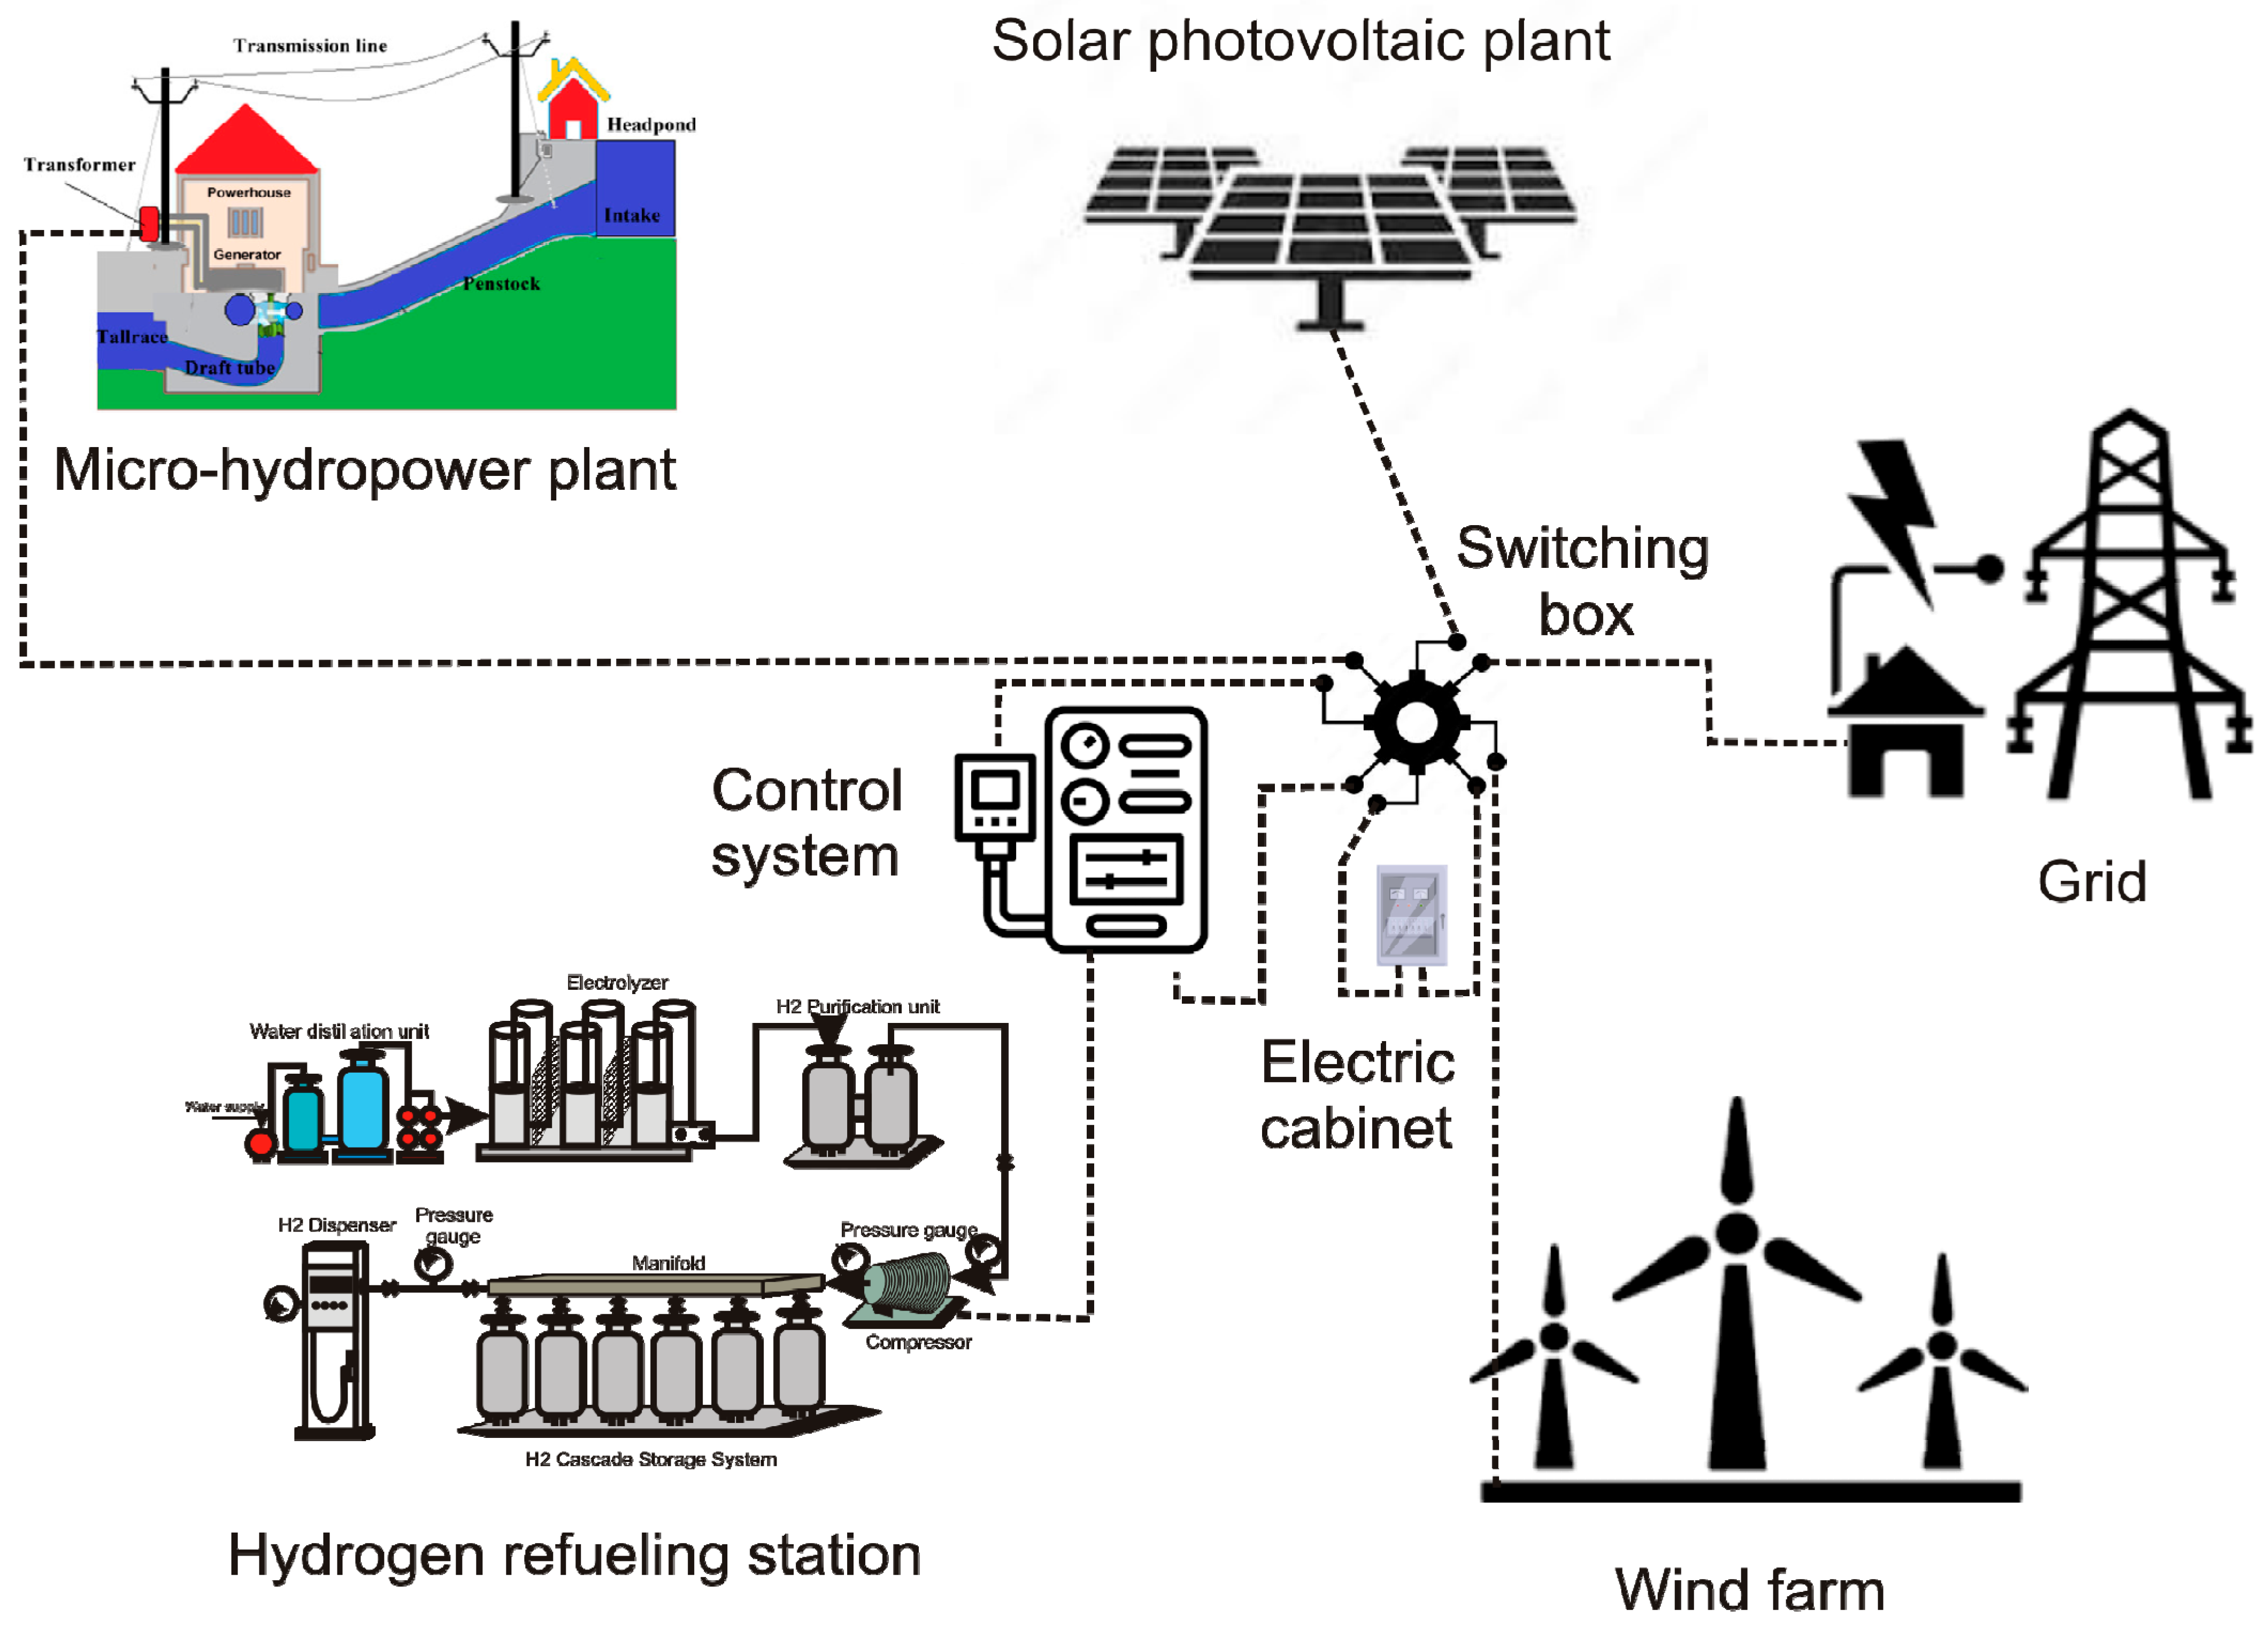
The power supply for operating the hydrogen refueling station may come from the grid or an autonomous renewable energy source like solar photovoltaic or wind farm. For small installations like the one proposed in this work, the renewable power plant and the grid hybridization represent an optimum configuration since they provide the benefits of a non-pollutant energy generation system and the power supply security of redundant energy sources.
Hybridization is feasible if the solar or wind resource is high enough to supply the required power to operate the refueling station. A more complex but reliable system is an on-grid hybridization of a solar photovoltaic array and a wind farm. Since the wind and solar resources currently complement each other throughout the day, hybridization reduces the dependence on the grid power supply.
An alternative to hybridization is using micro-hydropower plants if the river from which the installation takes water for distillation shows low or moderate water jumps around 3 m.
Figure 7 shows a schematic view of a possible configuration for on-grid hybrid renewable power plants connected to the hydrogen refueling station.
The configuration shown in
Figure 7 is a feasible option if renewable energies are available in the refueling station vicinity; if any or none of the renewable power sources are not available, the layout changes by simply omitting the non-available source; thus, the other renewable sources or the grid connection power the refueling station.
5. System Operation
The basic scheme of the refueling station operation is as follows:
Water is collected from the reservoir, river, lake, or pond and pumped to the water distillation system.
The distilled water is transferred to the electrolyzer for hydrogen production.
Hydrogen is generated by the electrolyzer; the oxygen is released to the environment. In advanced refueling stations, the oxygen is compressed and stored in an auxiliary tank (
Figure 5).
Hydrogen generated at the electrolyzer is carried to the purification unit to eliminate pollutant components.
Purified hydrogen is compressed and transported to the manifold, from which the control unit injects the gas into the cascade storage system tanks.
The compressed hydrogen injection continues until the tank is full or the control unit closes the valve.
Hydrogen is served to the H2 dispenser from any tank of the cascade storage system.
Hydrogen is dispensed at the H2 dispenser to users’ requirements.
The described operational mode does not differ from a conventional installation, except by skipping some steps corresponding to the missing components. Nevertheless, the proposed configuration provides significant advantages over a standard system like the one shown in
Figure 2.
In practice, a conventional refueling station stores the compressed hydrogen in a tank set at high pressure, currently 350 bars, although some configurations operate at 700 bars. The optional gas booster elevates the hydrogen pressure from the storage value to a setup value to reduce refueling time or to supply higher hydrogen mass flow for heavy vehicles.
The constant pressure hydrogen supply favors short-time refueling but forces the management of high-pressure gas at all times, which in some cases is unnecessary. A short-time refueling favors vehicle mobility at the station, avoiding long waits to access the hydrogen dispenser. On the other hand, we can achieve a short-time refueling process by refilling the vehicle’s hydrogen tank at lower pressure. A lower-pressure refilling allows for a shorter driving range; however, driving long distances is not always required, which supports the low-pressure refilling action.
A short refueling high-pressure gas supply is not critical since short driving range refueling requires a low mass flow rate. Additionally, if hydrogen dispensation develops at a lower pressure, the energy demand to refill the hydrogen storage tank is lower, reducing the compressor operating time and the energy demand from the grid.
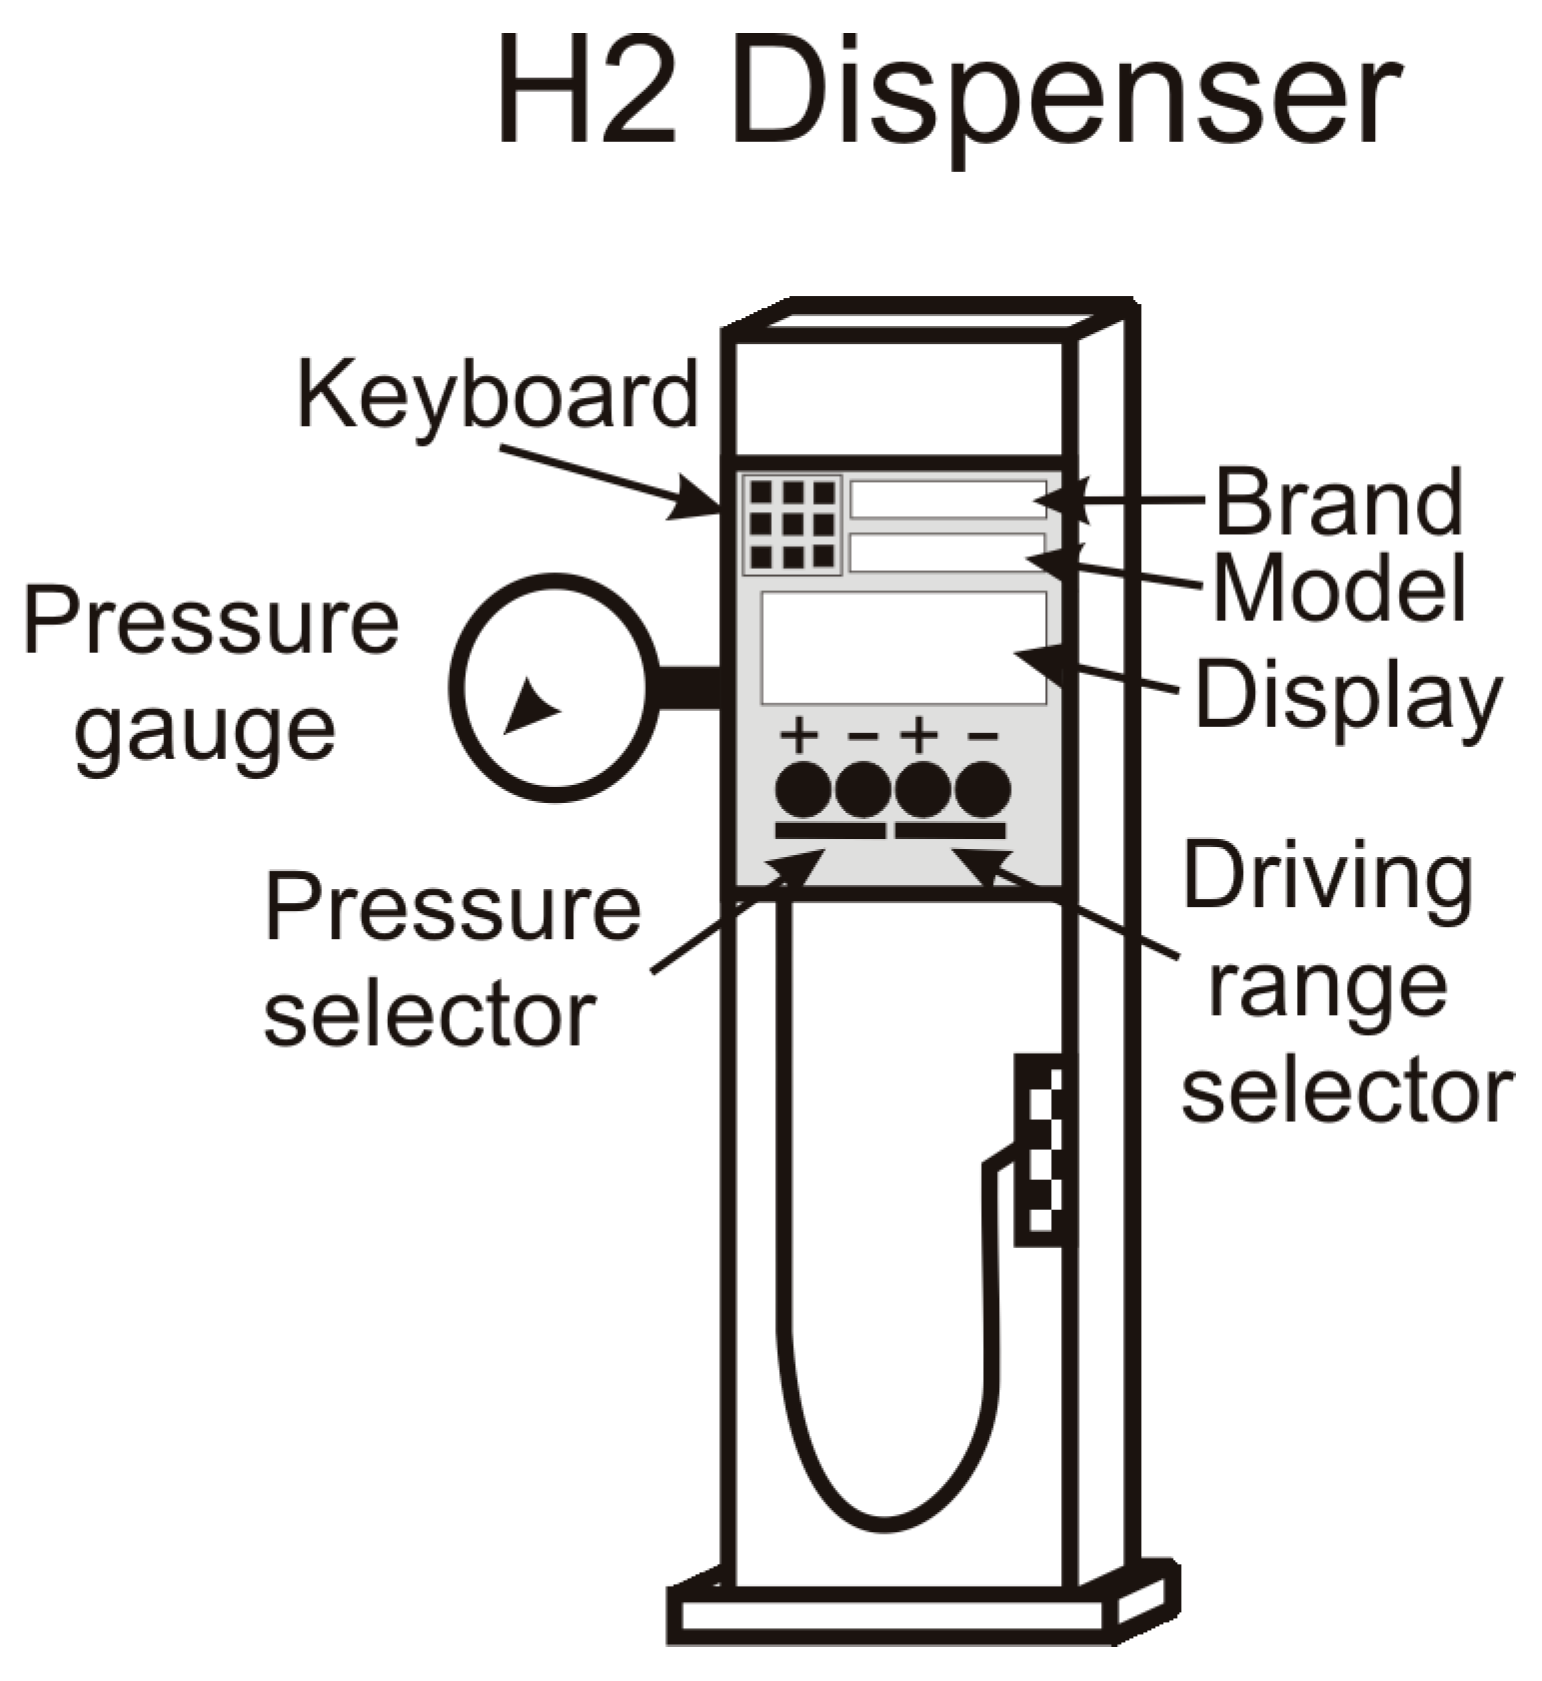
Figure 8 shows a schematic view of the hydrogen dispenser.
As a result of the above statements, we propose a refueling process based on the
Figure 4 schematic view, which may operate in a versatile mode, either supplying hydrogen at full pressure or an intermediate value at the driver’s request. For this goal, the hydrogen dispenser equips an internal control device that allows the driver to select the refueling process among two options: pressure or driving distance refueling; in the first option, the driver chooses the vehicle’s hydrogen tank final pressure, while in the second, the car tank pressure depends on the available driving range selected by the driver corresponding to the hydrogen refueling (
Figure 8).
Additionally, the control system operates at a three-way electronic valve at the manifold inlet that commutes between the cascade storage system and the hydrogen dispenser, allowing the compressed hydrogen to flow either to the cascade storage tank or the dispenser (
Figure 9).
The three-way valve rotates clockwise or counterclockwise to connect the compressor to the storage tank or the hydrogen dispenser.
The operational mode of the proposed system is as follows:
- (a)
Pressure selection (Ps)
The driver selects the final pressure for the vehicle’s hydrogen tank.
The hydrogen dispenser’s internal control device connects to the control system.
The control unit checks the pressure at every tank in the storage system (Tp), opens the valve corresponding to the highest pressure tank (j = 1), and selects the position S-D at the three-way electronic valve.
When pressure stabilizes, the control unit closes the tank valve.
The control unit reads the pressure gauge value at the hydrogen dispenser.
The control system rotates the electronic valve from the S-D to the C-D position, closes the connection from the storage tank system, and opens the connection to the compressor if the pressure reading is higher than the next highest pressure tank (j = j + 1). At the same time, the control system automatically starts the compressor, which increases the hydrogen dispenser pressure supply until the selected value when the control system stops the compressor.
The control unit opens the valve, letting the hydrogen flow to the vehicle tank through the hydrogen dispenser if the pressure reading is below the second highest pressure tank in the storage system. The process repeats with consecutive tanks in the storage system until the hydrogen pressure gauge reading is higher when the process described in the previous step applies.
- (b)
Driving range selection (DRs)
The driver selects the driving range to run until the next refueling station or final destination.
The driver selects the vehicle brand and model from the system database using the dispenser keyboard.
The control system computer calculates the hydrogen mass (mo) corresponding to the selected driving range using the vehicle’s standard hydrogen consumption rate. The control system includes a 15% security factor to compensate for deviations from standard consumption due to a more aggressive driving mode, ensuring the selected driving range.
The control unit selects the highest pressure tank from the storage system (j = 1), opens the tank valve, and sets up the three-way electronic valve at the S-D position, letting the hydrogen flow until the pressure stabilizes.
The control system reads the hydrogen mass flow through the manifold built-in H2 flowmeter (m). The control system closes the tank valve and compares the stabilized pressure with the next highest pressure tank (j = j + 1) if the stabilized pressure reading is below the calculated value; otherwise, the control system rotates the three-way electronic valve to the C-D position, starts the compressor, and leaves the hydrogen flowing from the compressor until reaching the determined mass flow injection.
If the stabilized pressure is lower than the calculated value, the control system opens the next highest pressure tank, repeating the process until the refueling process completes.
Figure 10 shows the hydrogen refueling protocol flowchart.
The continuous line corresponds to the driving range option, while the dashed line is for the pressure selection.
Advantages and Disadvantages
In this section, we analyze the advantages and disadvantages of the proposed technique, comparing it with the conventional configuration shown in
Figure 2.
Among the advantages, we can mention the following:
The system uses a smaller compressor, lowering the power demand and energy consumption.
The cascade storage system allows faster refueling, favoring frequent access to the hydrogen dispenser.
The system design is less complex, avoiding the gas booster.
The developed protocol permits lower pressure hydrogen operation without reducing pressure from the storage tank set. This option avoids compressing and expanding hydrogen and saves energy, improving global efficiency.
The proposed configuration is suitable for partial refueling and is compatible with low-pressure vehicle tanks.
The system is versatile since the drivers can choose between different options, refueling by pressure or driving range.
The hydrogen dispenser allows the driver to select the maximum refueling pressure.
The cascade storage system is compatible with the driver’s refueling pressure selection without pressure reduction from the storage tank set.
The compressor uses less time to refill an intermediate pressure tank.
Among the disadvantages, the following are the most relevant:
The new configuration possesses a lower hydrogen supply capacity.
The system is unsuitable for trucks or heavy vehicles with high-capacity hydrogen tanks.
The installation cost per power unit supply increases, and the economic reliability lowers.
The refueling station requires a higher land size per vehicle occupation.
6. Fundamentals
The new configuration requires a theoretical test to prove its validity and suitability for frequent vehicle refueling in variable conditions. To do so, we simulate and reproduce the present situation faithfully. Therefore, we base the simulation on realistic hypotheses matching the current situation of the automotive industry and the vehicle fleet.
Using the list of countries and territories by motor vehicles per capita [
69] and focusing on the densest vehicle fleet in world regions, the average rate value is 688 vehicles per thousand people. Fuel cell electric vehicles represent 4% of the total, according to data from the literature [
70], meaning an average rate of 27.5 vehicles per thousand people.
Applying this value to a population of one million, the number of fuel cell electric vehicles is 27,500. Considering an average daily driving distance of 33.2 km [
71] and a driving range of 300–400 miles (480–640 km) [
72], the daily refueling FCEV number is
The simulation also requires the time distribution in refueling, which depends on drivers’ habits. A previous study analyzed the sizing of hydrogen refueling stations based on refueling behavior [
73]. The study shows the relative probabilities of refueling events within one week (
Figure 11).
Although the
Figure 10 distribution corresponds to a car-sharing model, it is coherent with people’s habits; therefore, we adopt this model as the reference for the simulation.
Analyzing data for the number of petrol stations as a function of the population [
74], we obtain the following correlations:
All correlations have a regression coefficient R2 = 1. p is the population of millions of people.
Averaging over the four values,
Since we have considered a population of one million, considering that hydrogen refueling stations replace petrol ones, the number of refueling stations is as follows:
Assuming a homogeneous distribution of vehicles per refueling station, the number of attending FCEVs per station is around 30. Nevertheless, because the homogeneous distribution is unrealistic, we consider a deviation of 20% for the most concentrated refueling station. Therefore, the maximum daily attending number of FCEVs is 36.
Since the daily attending number of FCEVs is variable depending on the refueling station location, we estimate four types of attendance: maximum, high, medium, and low, with FCEV attending numbers of 36, 30, 18, and 9, representing a coverage factor of 120%, 100%, 50%, and 25% of the calculated number of maximum attending FCEVs per station.
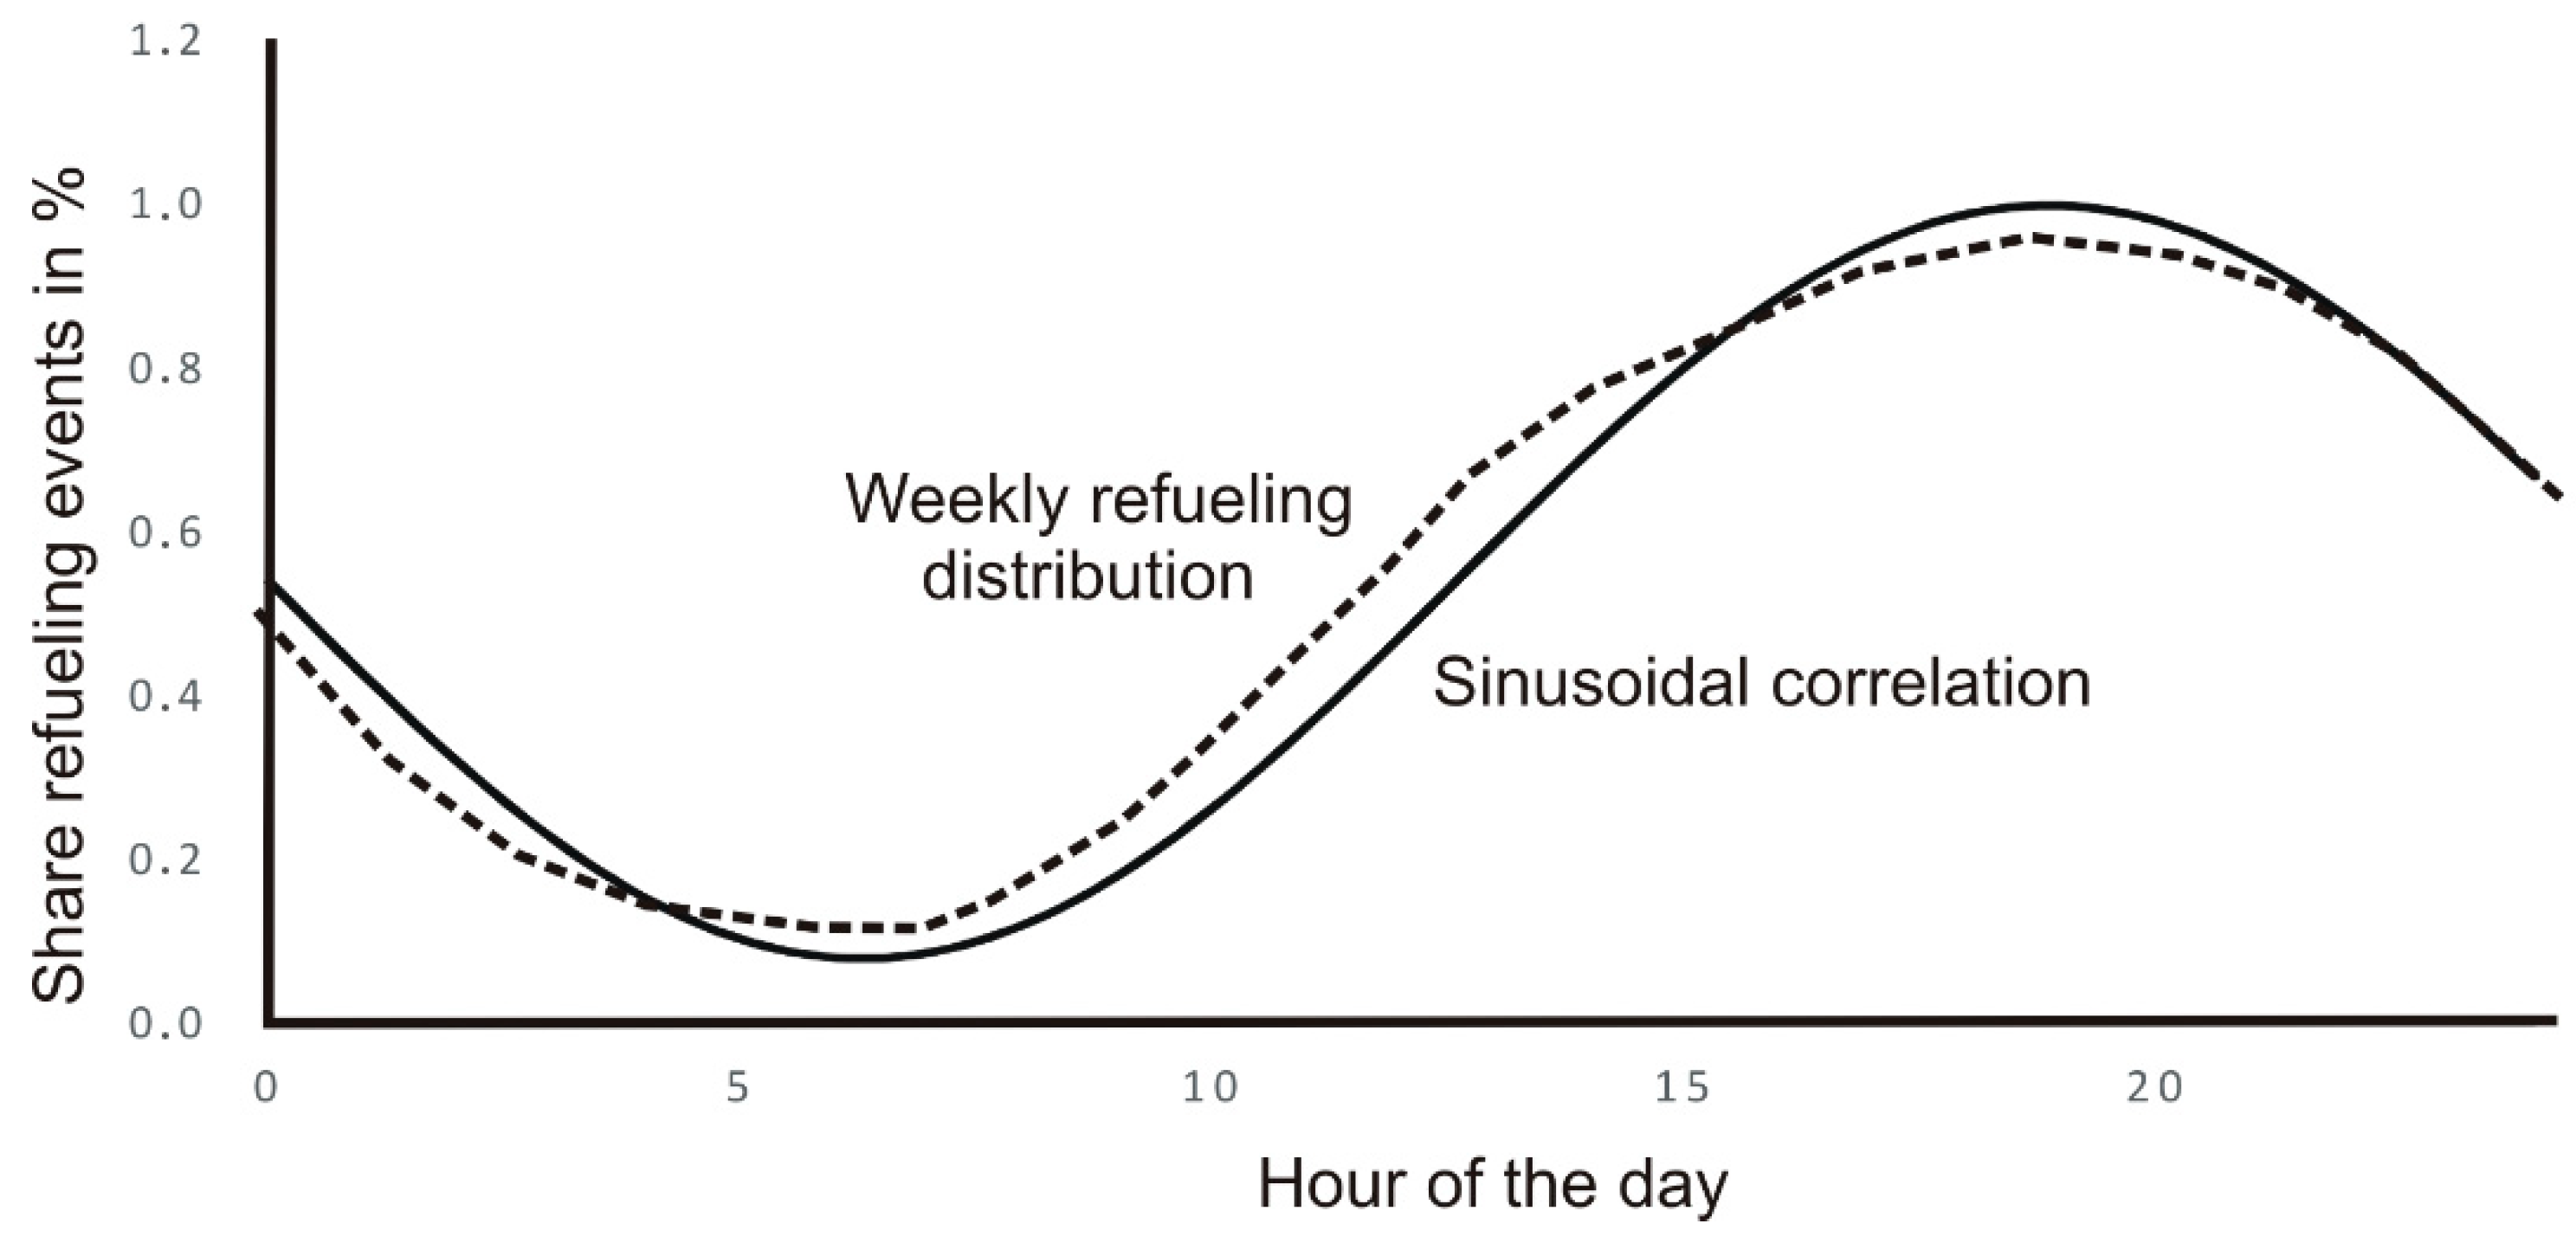
The weekly refueling distribution of
Figure 11 reminds us of a sinusoidal evolution; by doing so, we obtain the following correlation (
Figure 12) averaging daily distribution.
The corresponding expression to the sinusoidal correlation is
f represents the probability function of a refueling event.
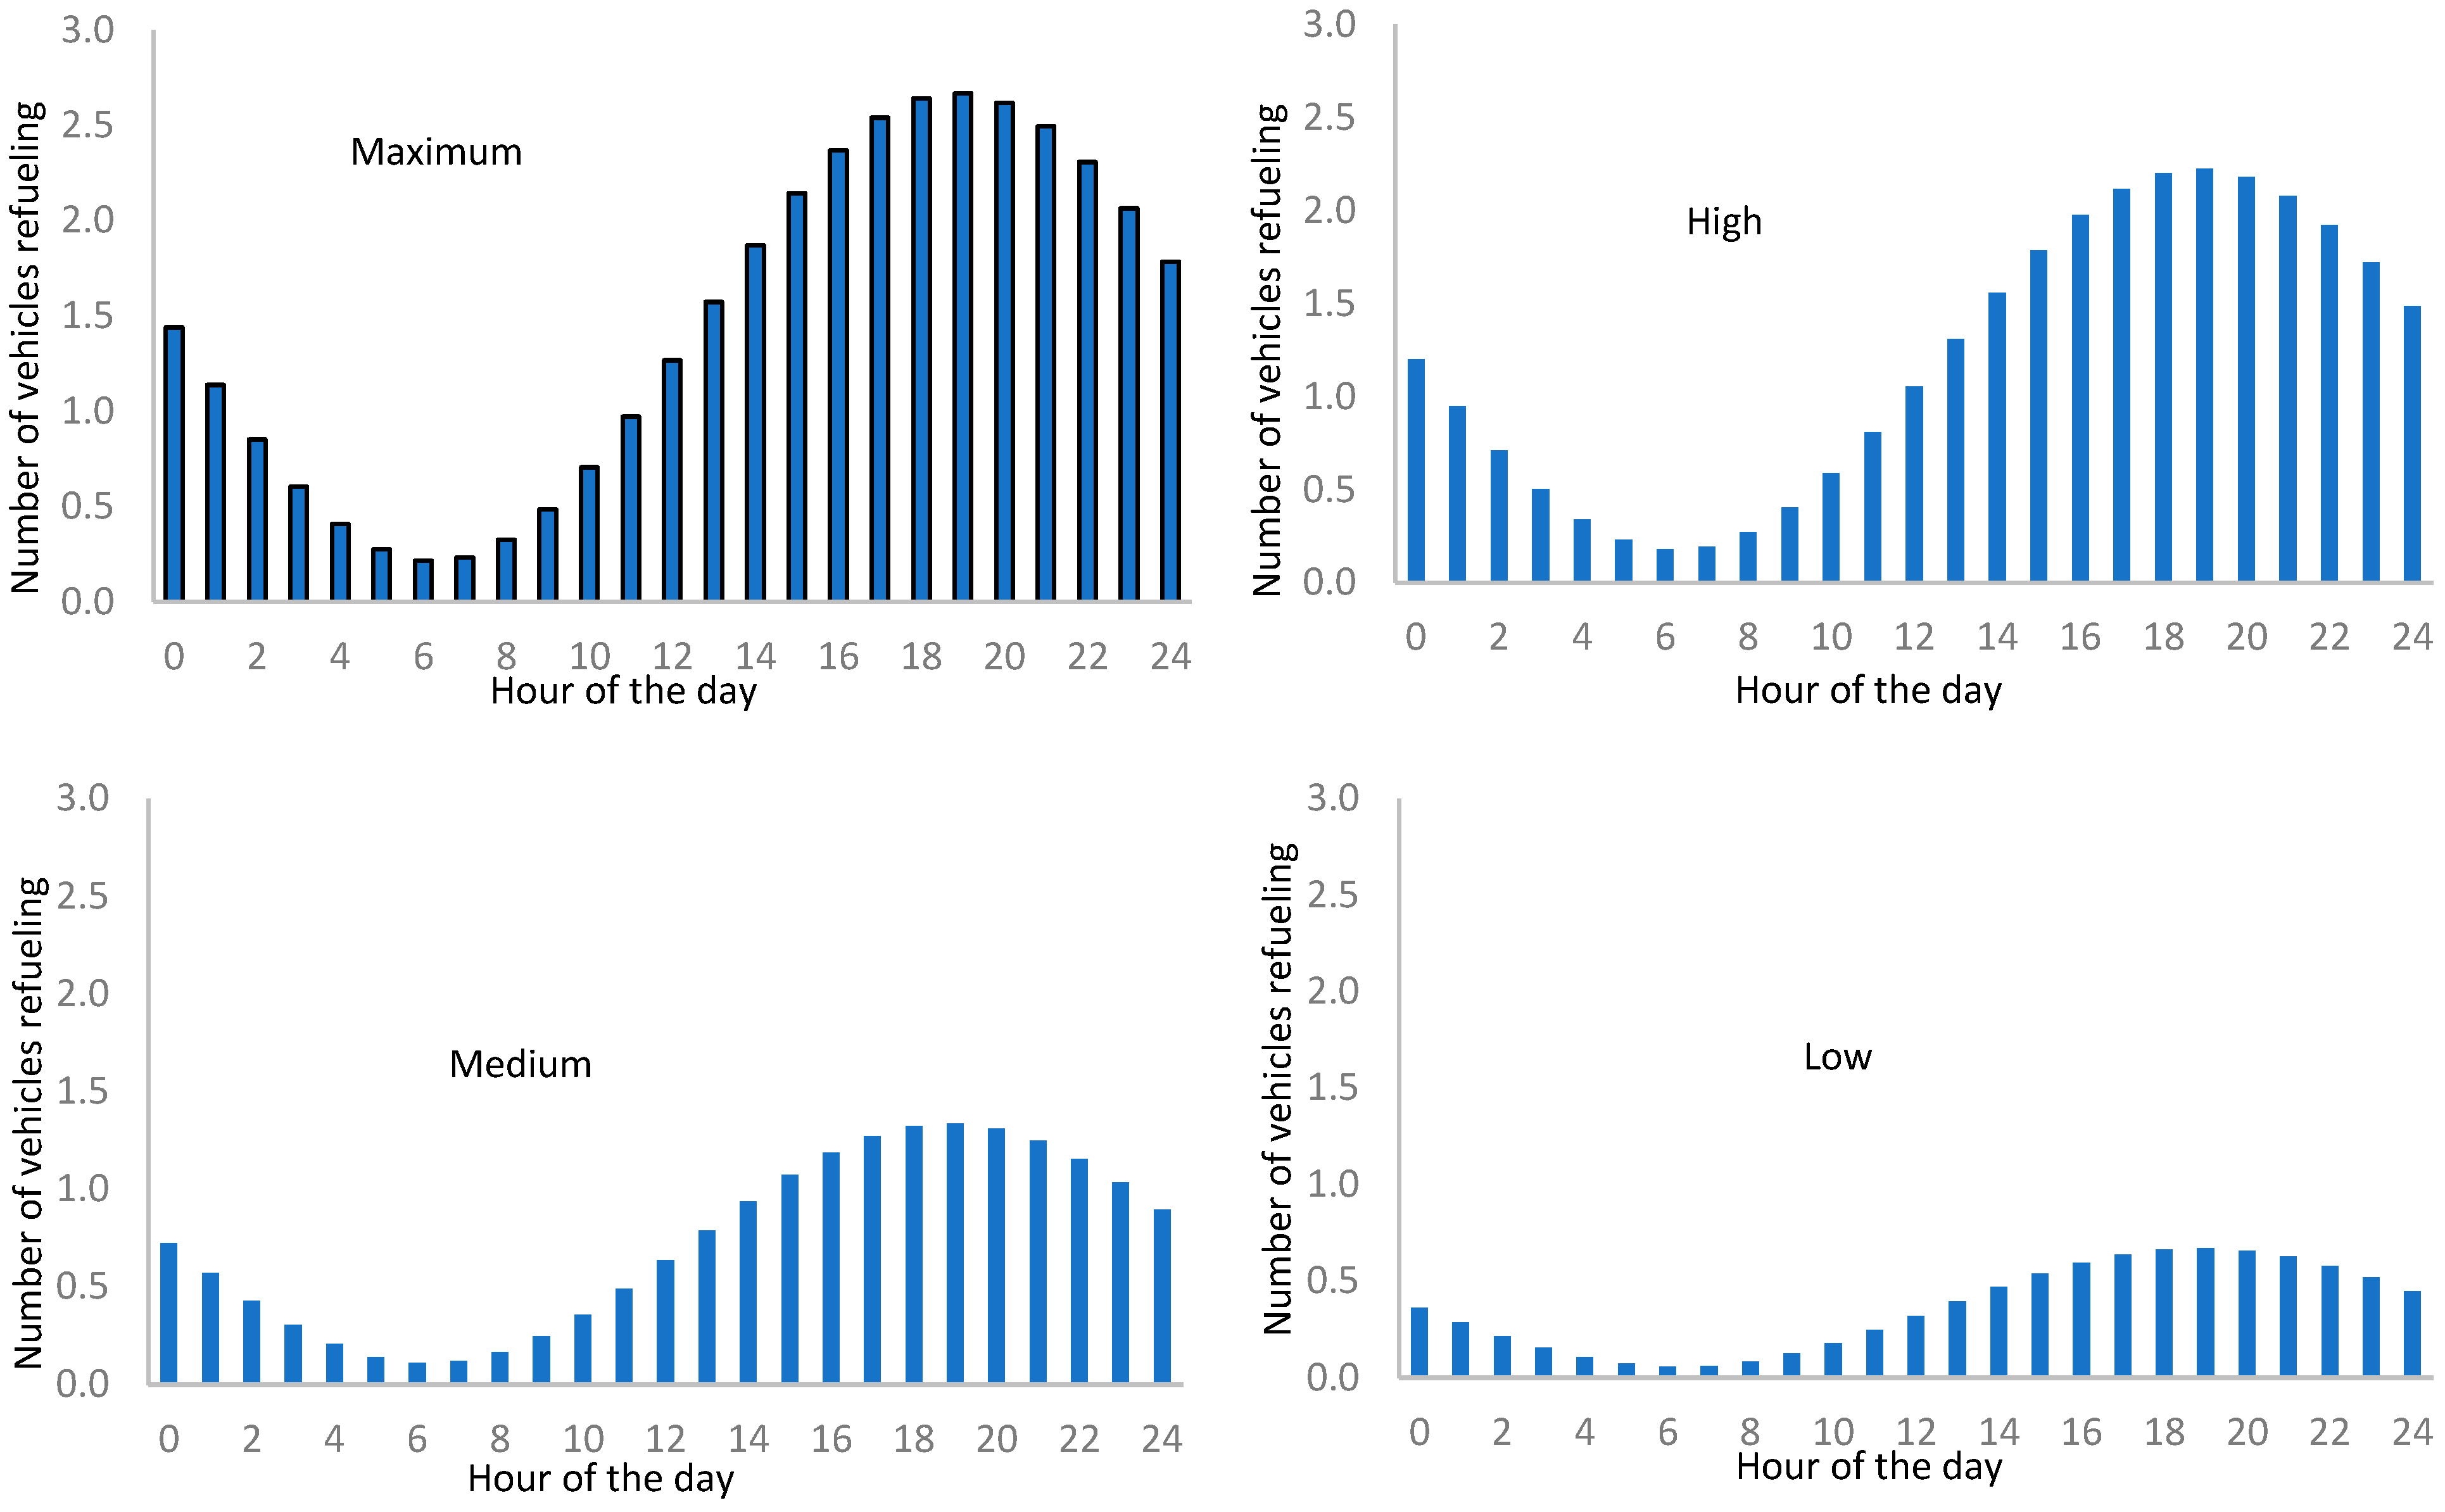
Applying the sinusoidal correlation to the maximum daily attending number of FCEVs, we obtain the following daily attendance distribution for every refueling rate station.
The fraction numbers in
Figure 13 correspond to partial refueling.
The refueling hydrogen mass depends on the type of vehicle and storage pressure, 350 or 700 bars. Current values for electric vehicles are in the 5 to 6.33 kg of H
2 [
75], corresponding to a range of 220 to 279 L and 130 to 165 L, applying the volume-to-mass ratio of 44 and 26 for the 350 and 700 bar pressure [
76].
Considering the present fuel cell electric vehicle market growth, trends, and forecast [
77], the vehicle characteristics for hydrogen refueling are as follows (
Table 1):
Applying data from
Table 1 to values in
Figure 13, we obtain the hydrogen mass requirements for daily vehicle refueling. The calculation process is as follows:
Hourly number of attended vehicles is collected for every refueling station type.
The enter part of the number is considered as refueling at the highest pressure, 700 bars or 350 bars depending on the vehicle type.
The fraction part of the number represents a partial refueling at intermediate pressure.
We determine the pressure corresponding to a partial refueling by applying the following expression:
where
is the refueling pressure,
fr is the fraction of the hourly number of attended vehicles, and
ptk is the maximum admitted vehicle tank pressure.
7. Refueling Process Development
The refueling process is based on independent and successive use of each tank of the cascade storage system; therefore, the control unit initiates the process by opening the first tank in the storage system, leaving the hydrogen flow to the vehicle(s) tank(s) through the hydrogen dispensers until the pressure equalizes. Once hydrogen flow stops due to equal pressure at the vehicle and storage first tank, the control unit closes the first tank, opens the second, and repeats the process. The process continues until the last storage tank.
Considering a set of
n hydrogen tanks of volume
Vtk each and a set of
m vehicles with tank volume
Vi each, attending the station for refueling, applying the mass conservation principle, we obtain
is the hydrogen density at the specific pressure. Vtk is the volume of the cascade storage system tank, and Vveh is the combined volume of the tanks of the vehicles refueled simultaneously. The superscript tk accounts for the tank storage initial pressure, while superscript i corresponds to the storage tank final pressure and vehicle tank pressure. All tanks in the storage cascade system have the same volume.
Since hydrogen density relates to a specific pressure as in the following equation:
Equation (10) converts into
Equation (12) allows us to determine the vehicle tank pressure at the end of each refueling step from the storage system as a function of the volume and initial pressure of both tanks, vehicles, and storage system.
8. Storage System Design and Sizing
Based on the previously calculated number of vehicles attending a refueling station, considering the daily refueling distribution shown in
Figure 13, and using data from
Table 1, we can estimate the hourly hydrogen mass requirements.
Every tank volume in the storage system depends on the station design and available room. Nevertheless, it should be closely related to the vehicle tank volume; therefore, we must determine the hydrogen tank size for every vehicle listed in
Table 1; to do so, we apply the following expression:
is the hydrogen mass in the vehicle tank at full charge, is the maximum refueling hydrogen pressure, and is the hydrogen density at standard conditions.
Applying Equation (10) to the data in
Table 1, we obtain the following (
Table 2):
Averaging over all vehicle models, considering half of the size of the Saic Maxus model because it operates at half the hydrogen pressure, we obtain a tank volume of 90 L.
If we use a storage-to-vehicle tank volume ratio of 5:1, every storage tank has a volume of 450 L. Considering a cylindrical shape and standard height-to-base diameter ratio of 2.5, a cylinder of 80 cm in diameter and 1 m high produces a volume of 500 L, close to the above-calculated value; therefore, we use tanks of 500 L for the storage system. Optimizing the room occupation, we design a hexagonal distribution of the storage system, as shown in
Figure 14. Therefore, the storage system consists of six tanks of 500 L each at a maximum pressure of 700 bars using a square land lot of 2.5 m side.
Since the maximum attainable pressure is 700 bars, the stored hydrogen mass in every tank is
Therefore, the total hydrogen mass stored in the system is 189 kg.
Because the described system is a proposal, we submit it to a simulation process to evaluate its operational feasibility. The simulation runs on specific working conditions for the proposed system design.
9. Simulation
The simulation considers vehicle attendance for hydrogen refueling according to the station type and vehicle model. Using data from previous analyses, we obtain the following daily schedule (
Table 3).
We develop the simulation based on the following premises:
The refueling process starts from a filled up multi-tank hydrogen storage system.
The daily refueling distribution process follows a sinusoidal pattern regardless of daily vehicle attendance.
The distribution of vehicles per refueling station is homogeneous.
We classify the vehicle attendance in four types: maximum, high, medium, and low.
The simulation considers full or partial load, depending on working conditions.
The calculation considers the whole and fractional part of the number of vehicles shown in
Figure 13 as full or partial load. The number of cars for every model,
ni, results from applying the following equation:
Ni is the number of vehicles for every model, shown in
Table 1, and
nday is the daily vehicle attendance.
We notice that the hydrogen mass in the storage system matches the maximum daily hydrogen demand; therefore, we consider the storage system size suitable for vehicle refueling.
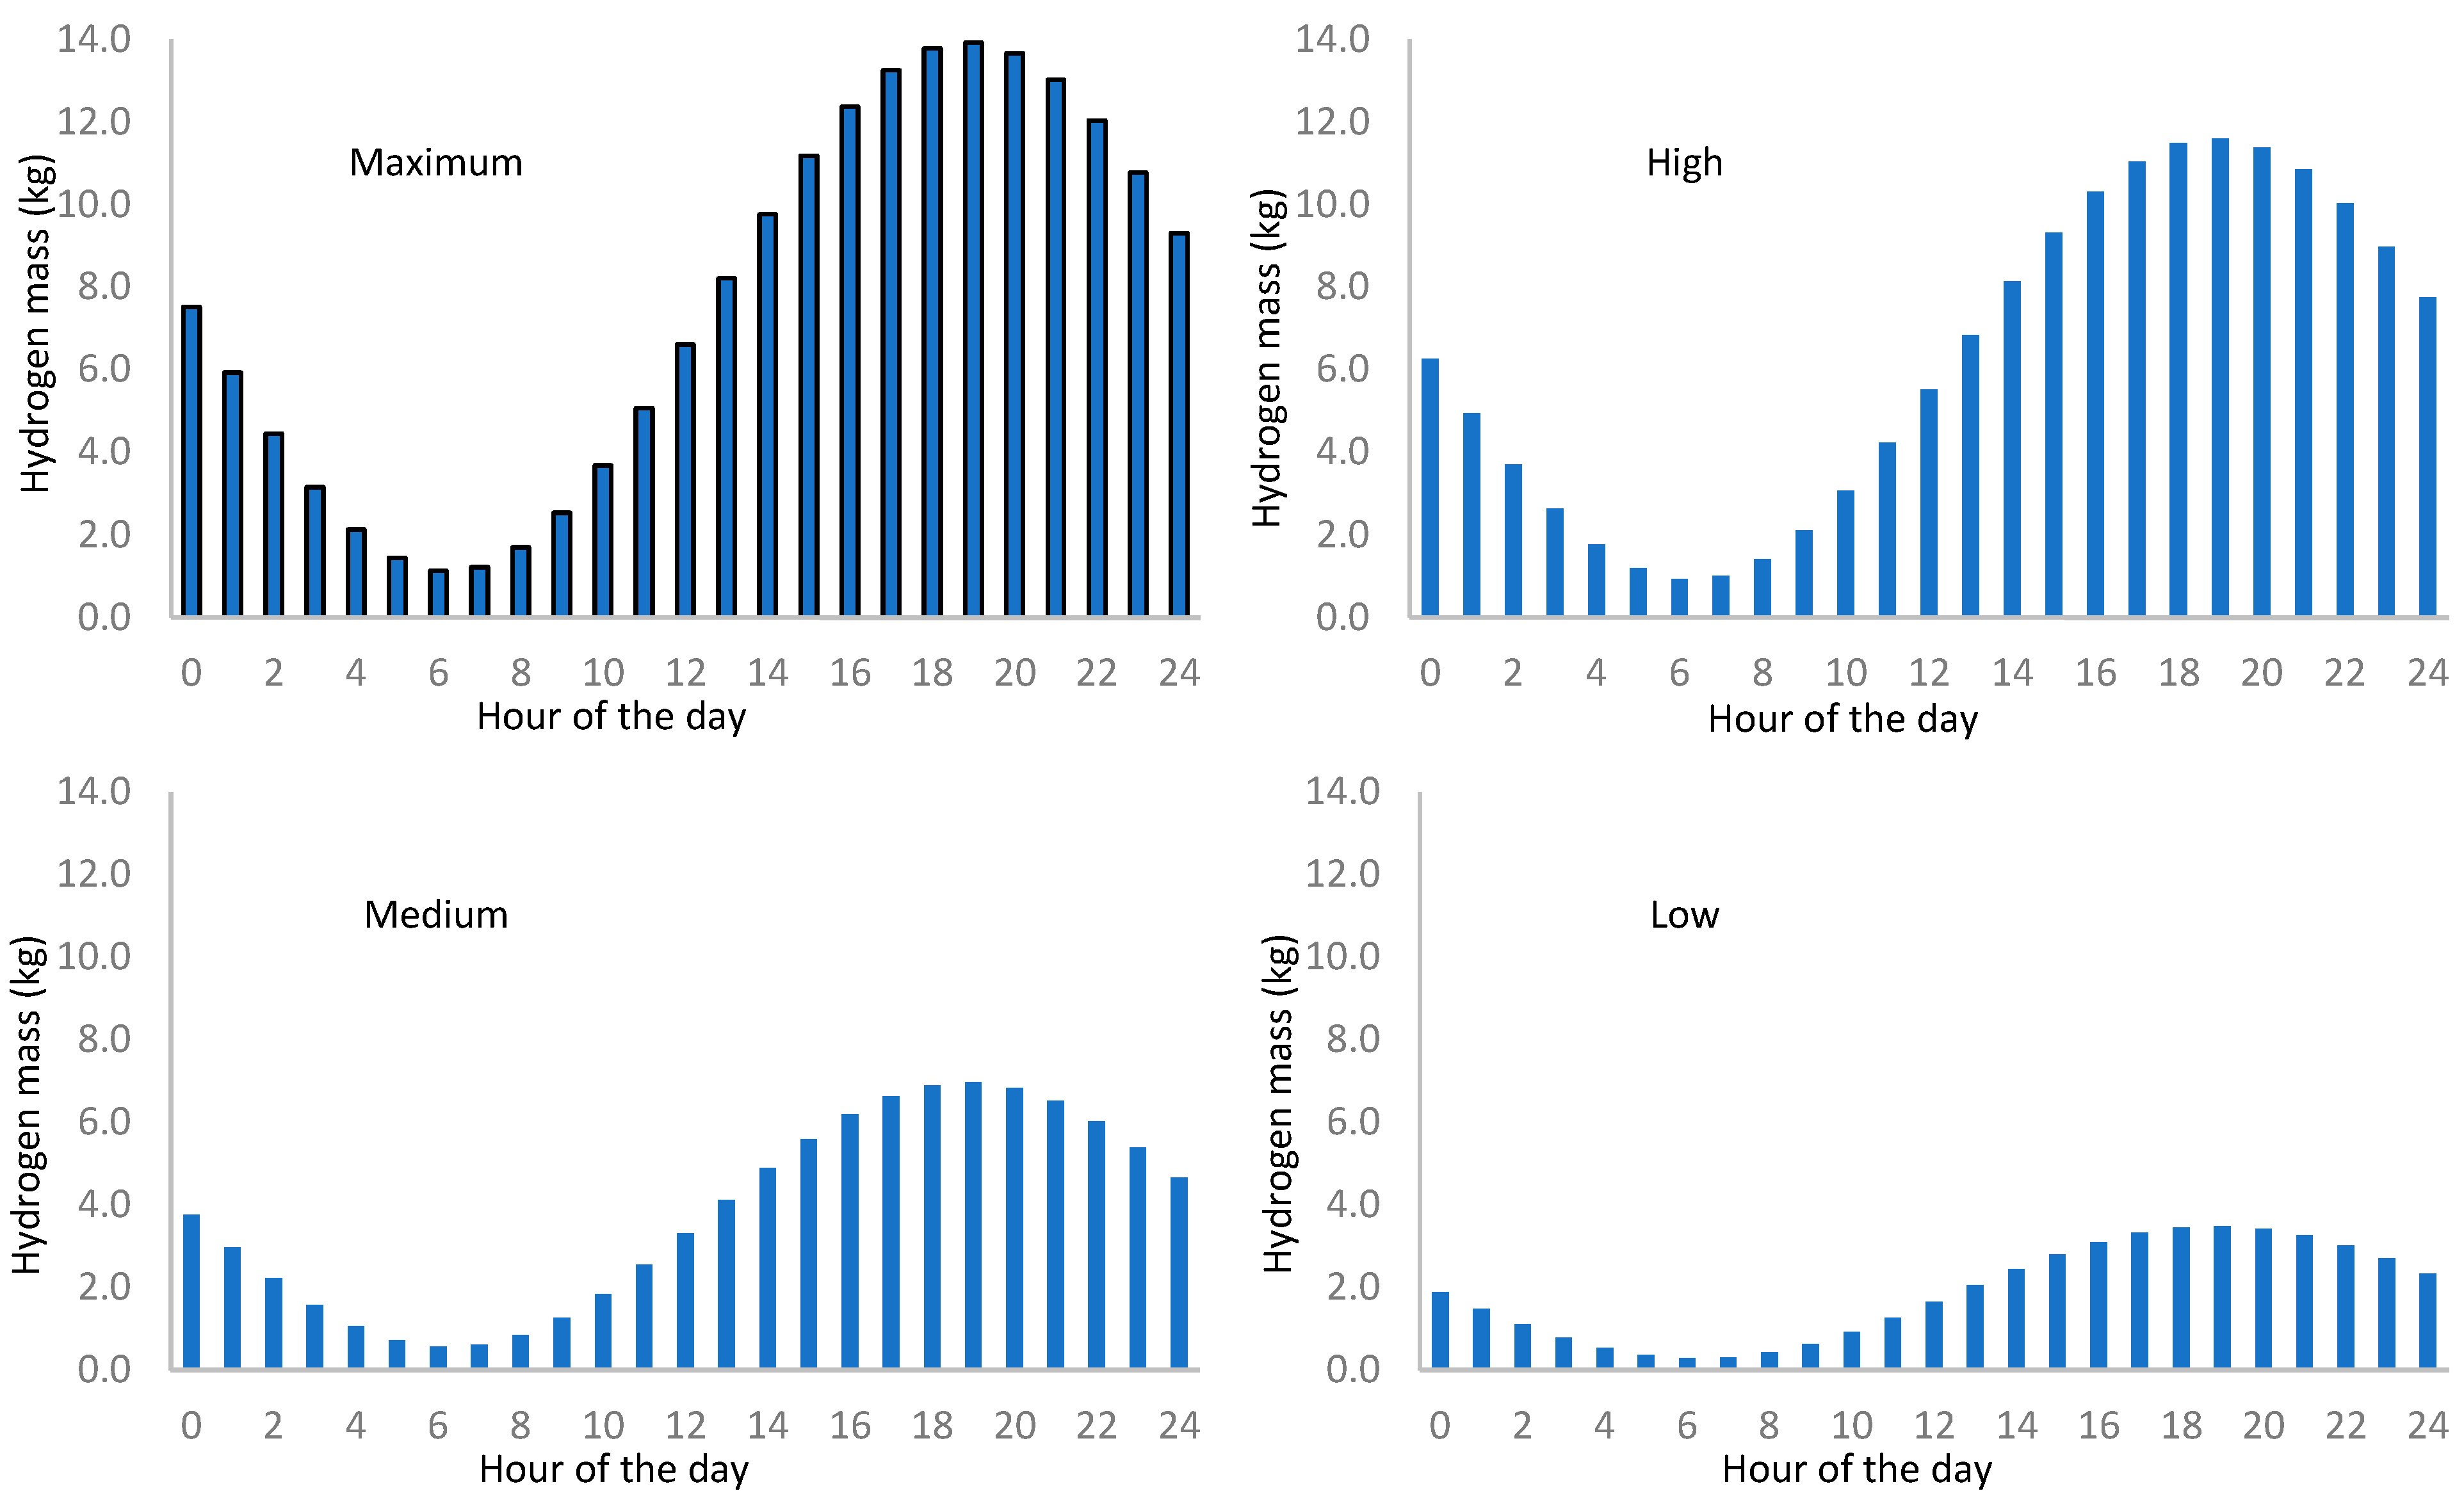
The refueling process evolves with the day hour; therefore, it is critical to determine the hourly hydrogen supply requirement since the station performance depends on the hydrogen supply profile throughout the day.
Figure 15 shows the hourly distribution of hydrogen mass requirement for every attendance rate. Nevertheless, the distribution shown in
Figure 14 corresponds to the total hydrogen mass supply but does not provide information about the pressure at which the vehicle refuels the tank. To do so, we determine the pressure corresponding to the partial refueling (
Figure 16).
Since it is impossible to predict the order in which every vehicle model will attend the refueling station, we consider the average tank size for the calculation.
To facilitate the following of the vehicle refueling using a cascade process, we represent in
Table 4 the daily hourly distribution of hydrogen supply. The numbers in the FP columns represent the times a vehicle tank is refilled at maximum pressure (700 bars), while the numbers in the PP columns are the refilling pressure for partial refueling.
The simulation process uses two forms of refueling: the cascade system uses the six storage system tanks individually and successively, and the conventional system uses the six tanks simultaneously.
Figure 17 shows the simulation results for the final pressure at the vehicle tank.
We observe that the cascade method supplies higher pressure throughout the day except for the low attendance rate and the first half of the day for the medium attendance rate.
10. Energy Balance
Since the goal of the refueling station is to start every day with a hydrogen storage system refilled at the maximum pressure to supply hydrogen to attending fuel cell electric vehicles, the compressor must refill every storage system tank after supplying hydrogen to fuel cell cars; therefore, we must calculate the compressor power as a function of the hydrogen flow and pressure increase according to the following expression:
is the volumetric hydrogen flow, and Δp is the pressure increase.
Equation (16) converts into the following expression for the cascade hydrogen supply method:
Considering an hourly step for the calculation, we obtain the compressor power requirement for tank refilling for the different station refueling rates (
Figure 18). The proposed cascade refilling method has a lower power demand in all cases and day hours except the 9 pm to 12 pm period for the maximum attendance rate where the cascade method shows higher power demand than the conventional process. This anomaly is considered purely incidental since there is no relevant cause to generate the power demand trend inversion.
We do not represent the low attendance rate because the difference between the conventional and the cascade method and the low compressor power requirement is negligible.
Computing over the whole day, we determine the daily energy requirements for all attendance rates (
Table 5).
The data analysis in
Table 5 shows that the cascade method requires lower compressor energy for refueling fuel cell vehicles. The energy saving increases with the number of tanks in the storage systems following a second-degree polynomial function with higher accuracy than 99%.
Table 6 lists the polynomial function coefficients.
Comparing the energy requirement values for every attendance rate, we determine the percentage of energy saved (
Table 7).
Table 7 shows the increase in the energy-saving ratio of the refueling cascade method as the vehicle attendance for refueling diminishes. The standard deviation low value for all cases shows that the energy ratio calculation is accurate.
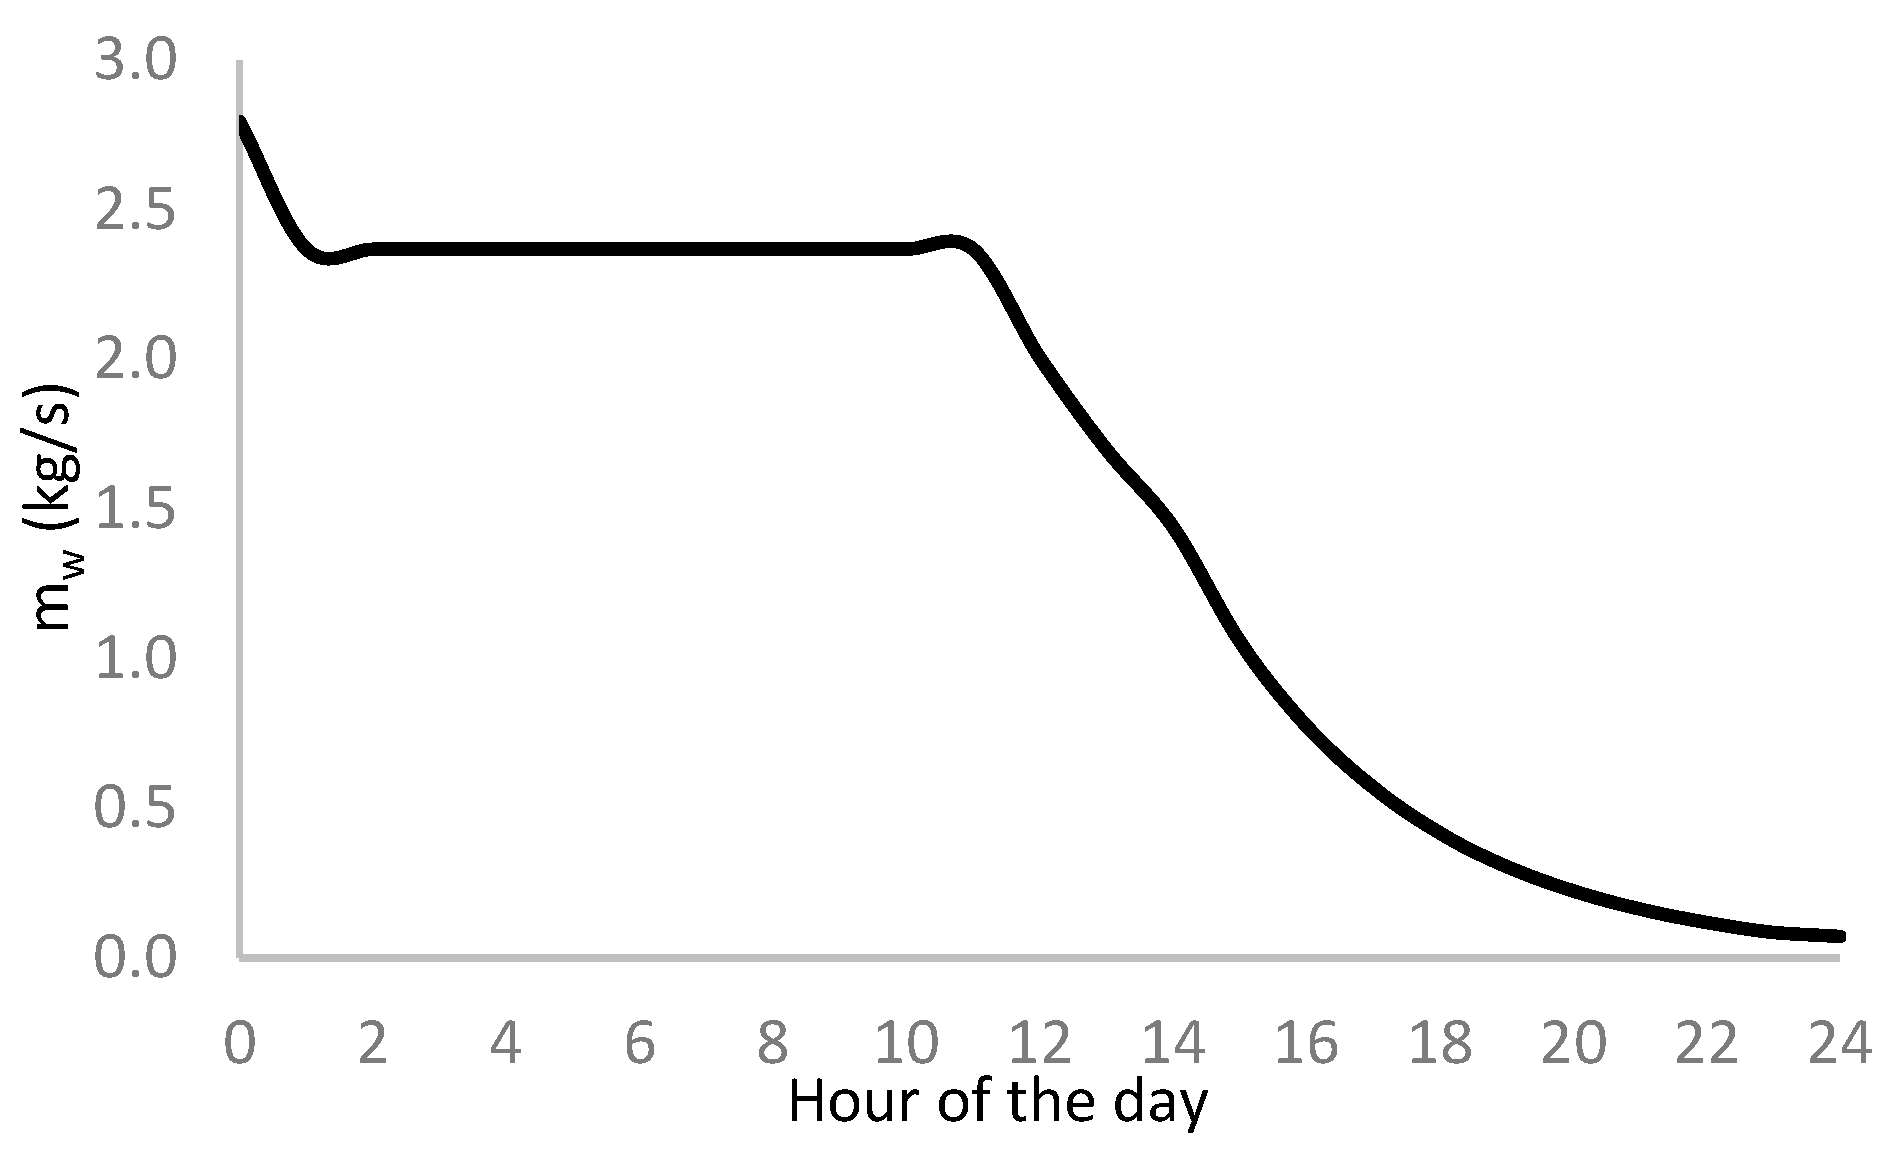
11. Compressed Hydrogen Refrigeration
Applying Equation (3) to data in
Figure 15 and
Figure 16, we determine the minimum required water flow to refrigerate the hydrogen supply from the storage tanks to the dispenser so the temperature does not affect the gas injected into the vehicle tank.
Figure 19 shows the calculation results.
We notice that the refrigeration water mass flow reduces as daytime runs because the hydrogen mass flow diminishes due to the lowering in pressure drop between the storage system and the vehicle tank.
The required power to circulate water through the heat exchanger derives from the classical expression
Pw is the required power, and
γw and
are the water specific weight and flow. The term
hp represents the mechanical losses along the refrigeration circuit, given by
f is the Darcy factor, and L and D are the refrigeration circuit duct length and diameter.
Therefore, the daily energy consumption for hydrogen refrigeration is
Considering a polished duct (
f = 0.020) and a duct length and diameter of 1 km and 0.2 m, applying results from
Figure 18, we obtain the following (
Table 8):
We observe that the energy consumption in the hydrogen refrigeration process is lower than the energy saving when using the refueling cascade method. On the other hand, the energy used for hydrogen cooling allows for maintaining the mass injection into the vehicle tank and preserving the expected driving range. Indeed, for a temperature increase of 70 °C, which corresponds to the highest temperature rise according to the working pressures at the first step of the refueling cascade process, the pressure drop after hydrogen cooling inside the vehicle tank derives from the following expression:
Now, applying values for a complete refueled tank at 700 bars and considering a steady state temperature of 25 °C, we obtain
Converting this pressure drop into hydrogen mass reduction
Replacing temperature values, we obtain
Corresponding to a driving range reduction of 23.5%.
12. Data Analysis
The analysis of the different parameters involved in this study shows that the refueling cascade method provides higher pressure and consumes less energy than all storage tanks simultaneously. The refueling differential time is irrelevant if the cascade method operates under the control of an automated process because the transient time in changing from one tank to the next is almost negligible.
Although this study run is for a six-tank storage system, the simulated data for lower tank numbers, from 5 to 1, shows a reduction of the energy demand in the refueling process but with a lowering energy-saving trend as the tank number diminishes.
The energy consumption required for hydrogen refrigeration is lower than the energy saving using the refueling cascade method; therefore, the station operation is economically consistent. On the other hand, the cooled gas refueling guarantees the driving range since the injected hydrogen mass does not change because of the temperature drop. The data analysis shows a drastic reduction of 23.5% in the driving range when hydrogen temperature drops after quick refueling at high pressure, which is considerable.
13. Environmental Impact
The use of hydrogen as fuel for vehicle propulsion represents an advance in fighting the climatic change and carbon dioxide reduction compromise acquired by many countries in the last summit [
78]. Modern studies prove the benefits of replacing fossil fuels with hydrogen and non-pollutant power sources for vehicles, analyzing the carbon footprint of green and fossil fuels [
79] and the reduction in GHG emissions by using electric vehicles [
80,
81]. These studies provided detailed analysis of compared data between EVs and combustion engine cars. Additional work analyzes the influence of the real driving range of electric vehicles and the influence on fuel consumption and carbon dioxide emissions reduction, providing an accurate account of the situation [
82].
14. Conclusions
The proposed alternative design for hydrogen refueling stations is feasible and compatible with renewable energy sources.
The refueling cascade method shows some advantages compared with the conventional method of using all hydrogen storage system tanks simultaneously. Saving energy is probably the most relevant gain, achieving a 9% to 45% benefit, depending on the vehicle attendance rate.
The designed protocol reduces the compressor power, which benefits from lower energy consumption and compatibility with low-intensity power sources like solar photovoltaic, wind farms, or micro-hydro plants.
The hydrogen refueling station design supports a daily vehicle attendance of 9 to 36 with a complete refueling process coverage. The carried-out simulation proves that the vehicle tank achieves the maximum attainable pressure of 700 bars with a storage system of six tanks.
The simulation shows that the proposed cascade method supplies higher pressure than the conventional method, limiting the power demand and reducing the required time to refill the storage system tanks.
The design applies to other configurations with higher daily vehicle attendance by simply modifying the size of the refueling station elements. The simulation proves that the daily hourly hydrogen demand follows a sinusoidal function.
The developed algorithm provides a practical tool for predicting the hydrogen demand for any vehicle attendance, allowing the planners and station designers to resize the elements to fulfill the new requirements.


