Article

Integrative Transcriptomic Meta-Analysis Reveals Risk Signatures and Immune Infiltration Patterns in High-Grade Serous Ovarian Cancer

by
Paula D. Morales-Suárez
1,2,
Yina T. Zambrano-O
1,3,
Alejandro Mejía-Garcia
4,
Hsuan Megan Tsao
4,
Liliana Lopez-Kleine
5,
Diego A. Bonilla
6,7,
Alba L. Combita
1,8,
Rafel Parra-Medina
9,10,
Patricia Lopez-Correa
9,
Silvia J. Serrano-G
1,
Juliana L. Rodriguez
11,12 and
Carlos A. Orozco
1,8,*
1
Grupo de Investigación en Biología del Cáncer, Instituto Nacional de Cancerología, Bogotá 110111, Colombia
2
Maestría en Genética Humana, Universidad Nacional de Colombia, Sede Bogotá, Bogotá 111321, Colombia
3
Doctorado en Oncología, Universidad Nacional de Colombia, Sede Bogotá, Bogotá 111321, Colombia
4
Department of Human Genetics, McGill University, Montreal, QC H3A 0G4, Canada
5
Departamento de Estadística, Facultad de Ciencias, Universidad Nacional de Colombia, Sede Bogotá, Bogotá 111321, Colombia
6
Research Division, Dynamical Business & Science Society, DBSS International SAS, Bogotá 110111, Colombia
7
Hologenomiks Research Group, Department of Genetics, Physical Anthropology and Animal Physiology, University of the Basque Country (UPV/EHU), 48940 Leioa, Spain
8
Grupo de Investigación en Oncología Traslacional, Instituto Nacional de Cancerología, Bogotá 111511, Colombia
9
Departamento de Patología Oncológica, Instituto Nacional de Cancerología, Bogotá 110111, Colombia
10
Instituto de Investigación, Departamento de Patología, Fundación Universitaria de Ciencias de la Salud (FUCS), Bogotá 110311, Colombia
11
Grupo de Investigación Clínica y Epidemiológica, Instituto Nacional de Cancerología, Bogotá 110111, Colombia
12
Departamento de Ginecología y Obstetricia, Universidad Nacional de Colombia, Sede Bogotá, Bogotá 111321, Colombia
*
Author to whom correspondence should be addressed.
Immuno 2025, 5(3), 23; https://doi.org/10.3390/immuno5030023
Submission received: 22 May 2025 / Revised: 11 June 2025 / Accepted: 13 June 2025 / Published: 25 June 2025

Abstract

Background: High-grade serous ovarian cancer (HGSOC) is a highly aggressive malignancy with poor prognosis due to late-stage diagnosis and limited treatments. Identifying differentially expressed genes (DEGs), and immune cell infiltration patterns may improve prognostic assessment and therapeutic strategies. Methods: We conducted a meta-analysis of gene expression data from the GEO (Gene Expression Omnibus, NCBI). DEGs were identified, functionally enriched, and analyzed for protein-protein interactions. Overlaps with oncogenes and tumor suppressor genes were examined. Cox survival analysis and a gene expression-based risk stratification model were developed. Immune infiltration differences were assessed using deconvolution methods. Results: A total of 11 studies (291 HGSOC, 96 controls) identified 892 DEGs, mainly involved in mitochondrial function, vesicle trafficking, and immune regulation. Key oncogenes (EZH2, PDK1, ERBB2) and tumor suppressor genes (BRCA1, DUSP22) were identified. Survival analysis associated the expression of SEC24B, TGOLN2, TRAK1, and CAST with poor prognosis. Low-risk patients had higher activated dendritic cells and CD4+ memory T cells while high-risk patients were enriched in common lymphoid progenitors and megakaryocyte-erythroid progenitors. Conclusions: This study identifies key DEGs in HGSOC progression and presents a risk stratification model predicting patient outcomes.

1. Introduction

High-grade serous ovarian cancer (HGSOC) is the most common and lethal subtype of epithelial ovarian cancers, accounting for approximately 70% of ovarian cancer-related deaths worldwide [1]. Despite advances in surgical techniques and chemotherapy, the 5-year survival rate for HGSOC remains below 30%, primarily due to late-stage diagnosis and the development of chemoresistance [2]. The asymptomatic nature of early-stage disease leads to diagnosis at advanced stages in approximately 75% of cases, underscoring the need for improved detection and treatment strategies [3]. Gene expression profiling has significantly advanced our understanding of cancer biology by enabling the simultaneous analysis of thousands of genes within tumor cells [4]. This approach aids in identifying dysregulated genes and signaling pathways that drive tumor initiation, progression, and metastasis. In HGSOC, gene expression studies have revealed molecular subtypes with distinct biological and clinical characteristics, contributing to more precise classification and prognostic assessments [5]. Furthermore, gene expression profiling facilitates the development of personalized medicine by identifying potential therapeutic targets and predicting responses to specific treatments [6]. Previous individual studies on gene expression in HGSOC have identified several biomarkers and therapeutic targets, including alterations in homologous recombination repair genes such as BRCA1 and BRCA2 [7,8]. However, many of these studies are limited by small cohort sizes, reducing statistical power and the ability to detect clinically significant gene expression changes [9] Additionally, substantial heterogeneity in HGSOC due to genetic diversity and differences in experimental conditions can obscure true biological signals and lead to conflicting results among studies [10].
Technological variations between gene expression profiling platforms further complicate data integration and interpretation. While microarrays have been widely used and provide extensive historical data, they have limitations in dynamic range and sensitivity compared to RNA sequencing (RNA-seq), which offers a more comprehensive view of the transcriptome [11]. Differences in data generation, preprocessing, and normalization methods between these platforms introduce biases that make direct comparisons challenging [12]. Given these limitations, there is a pressing need for a comprehensive meta-analysis exclusively in a HGSOC setting that integrates gene expression data from multiple studies and platforms. Meta-analysis enhances statistical power by combining data from independent studies, enabling the detection of consistent gene expression patterns across diverse datasets [13]. By employing statistical methods and normalization techniques to overcome platform-specific biases, data can provide a more robust and generalizable understanding of HGSOCs molecular underpinnings [14].
The objective of this study is to perform a gene expression meta-analysis of available microarray data in HGSOC to identify functional genes significantly associated with the disease. This unified approach represents the first meta-analysis focused specifically on the HGSOC subtype, rather than combining different histological or molecular subtypes within ovarian cancer.

2. Materials and Methods

This study was conducted using a bioinformatics-assisted review (BAR) approach, as previously described by Bonilla et al. [15]. This methodology allows for structured identification, integration, and downstream analysis of high-throughput molecular data, specifically transcriptomic datasets, by leveraging curated and reproducible open-access bioinformatics tools. Unlike narrative reviews or classical systematic reviews focused on clinical trials, BAR is particularly suited for exploring biological mechanisms at the systems level, enabling the extraction of experimentally validated gene expression profiles from multiple public repositories. For this purpose, we conducted a multistep search and selection of transcriptomic datasets relevant to HGSOC, followed by cross-referencing, normalization, and differential expression analyses. All data integration steps were curated and validated by researchers with experience in transcriptomics, molecular oncology, and functional enrichment pipelines.

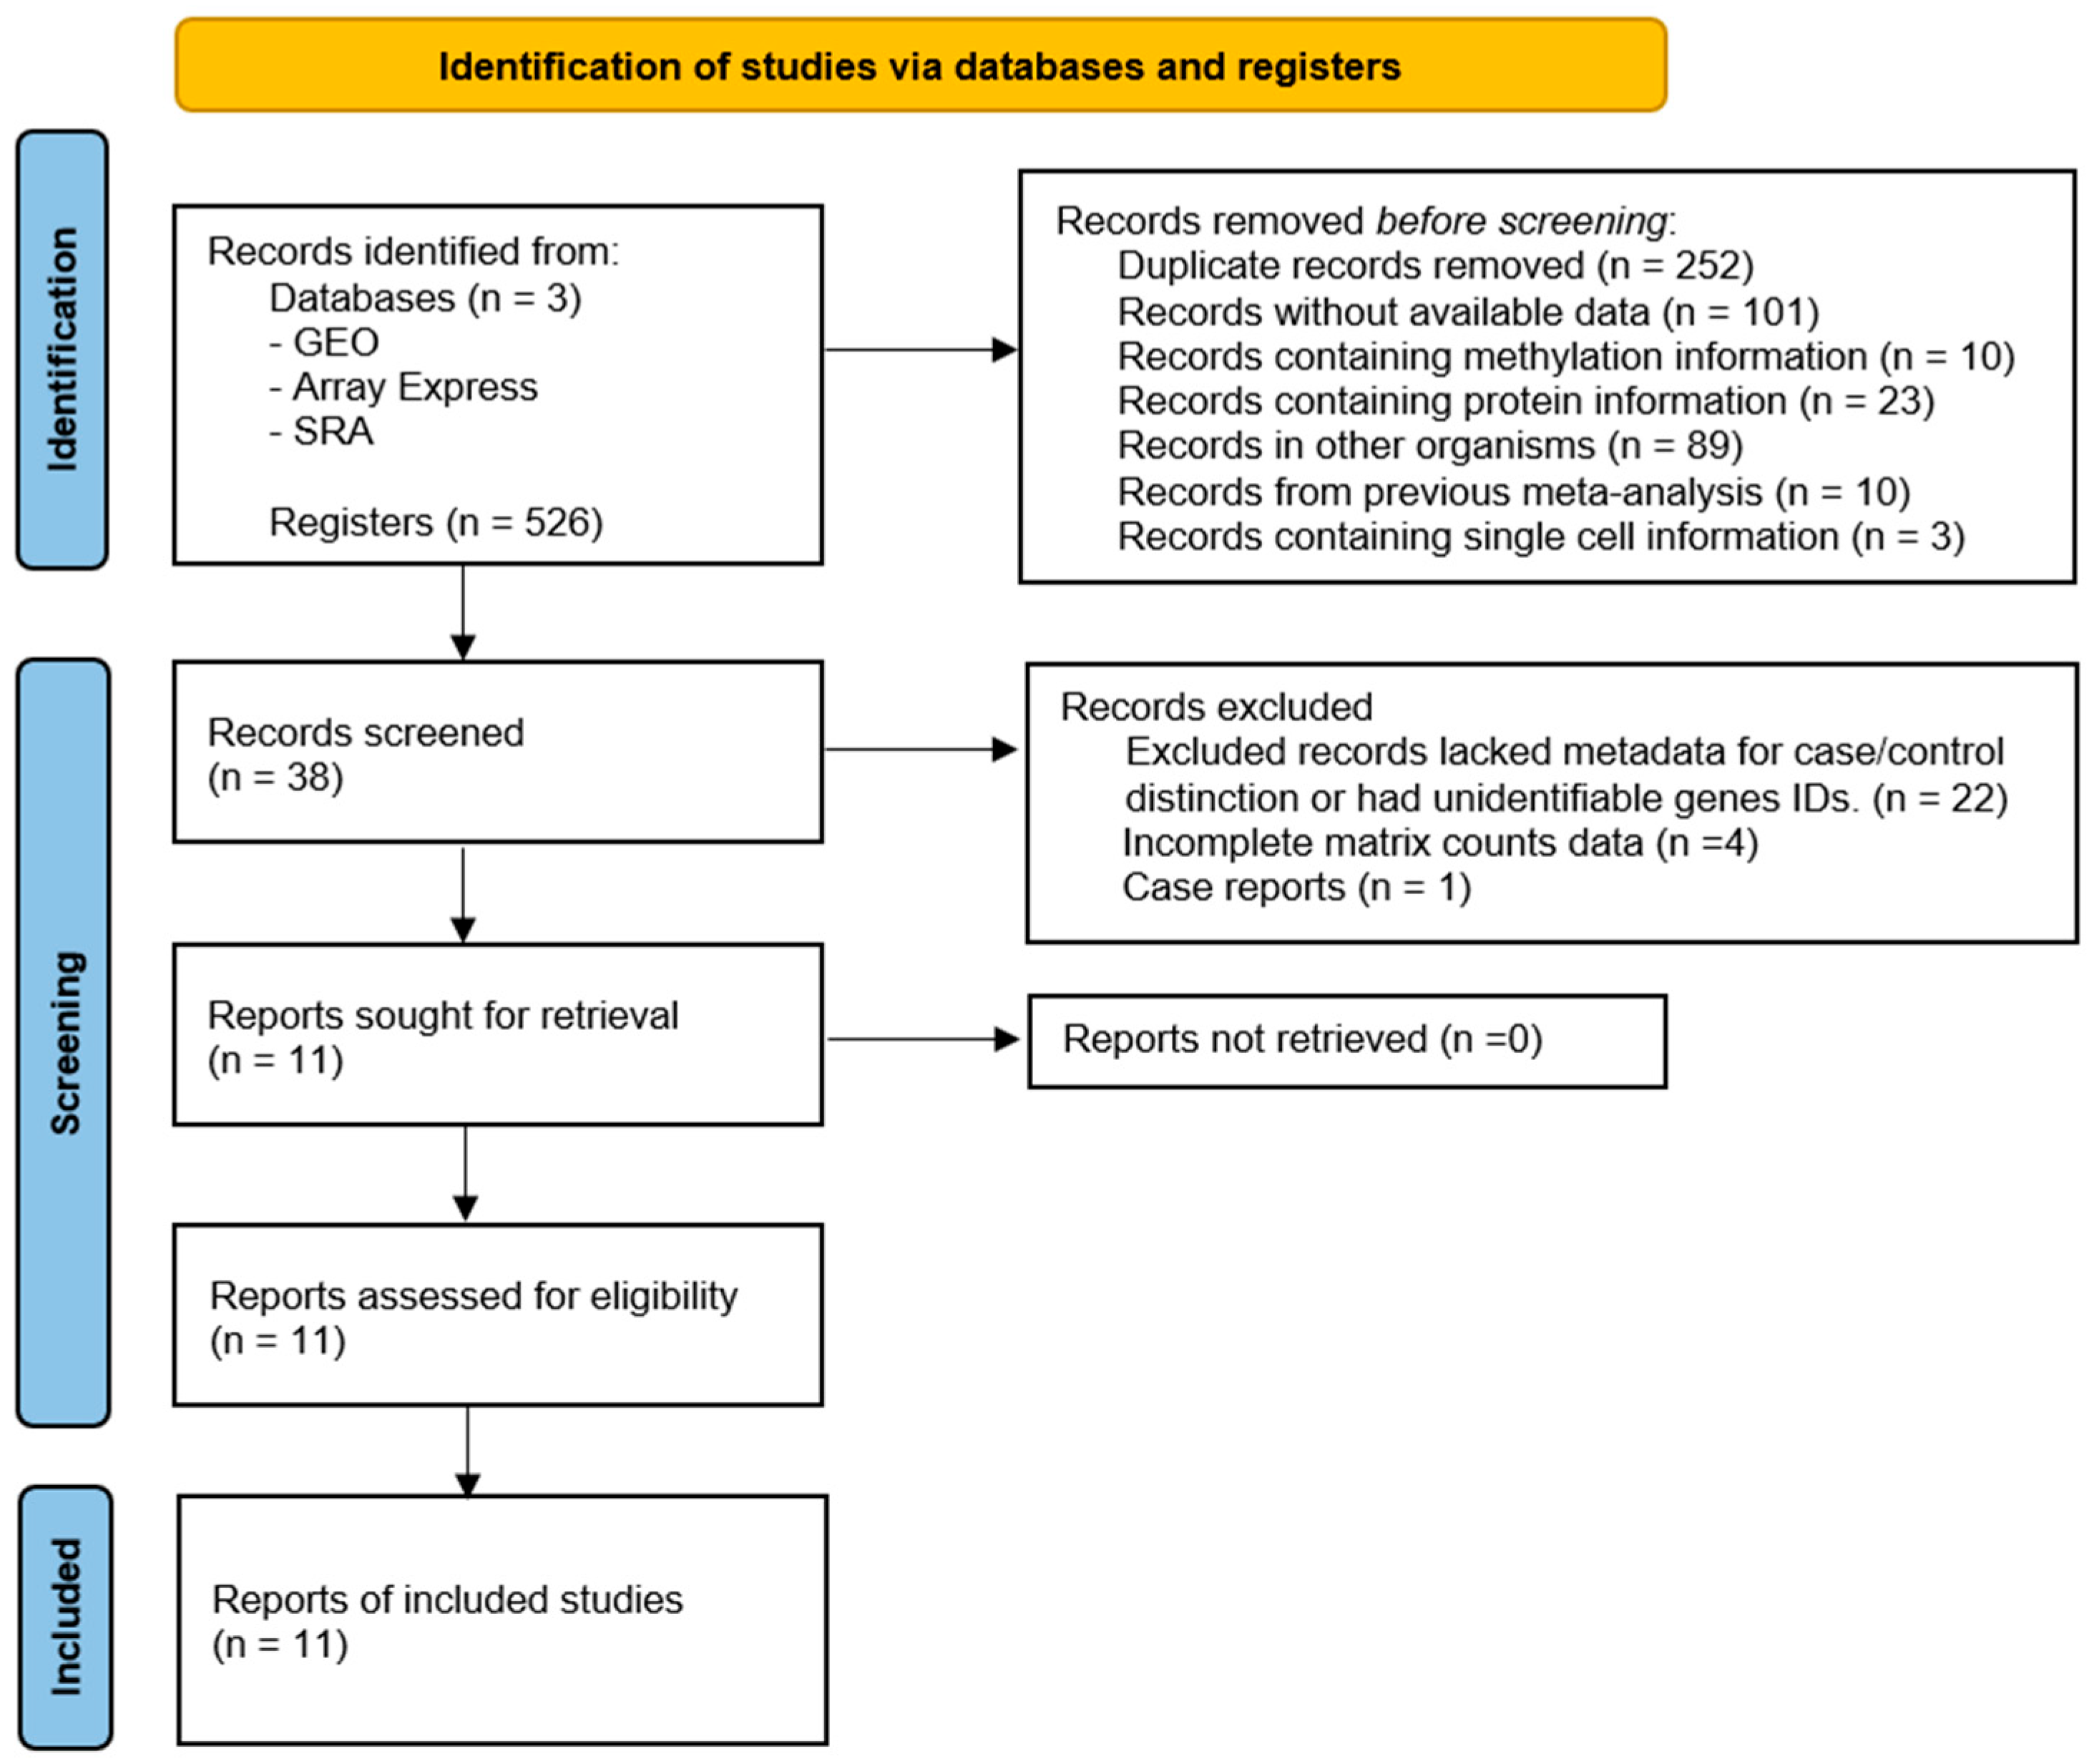
2.1. Search Strategy and Information Sources

To identify relevant gene expression datasets related to ovarian epithelial cancer, the NCBI Gene Expression Omnibus (GEO), ArrayExpress, and the Sequence Read Archive (SRA) databases were searched for free terms such as “high-grade serous ovarian cancer”. Inclusion criteria for datasets were restricted to: (i) including only HGSOC cancer and normal ovarian epithelial tissue as controls, (ii) studies performed on Homo sapiens, and (iii) having a minimum sample size of eight participants. Only datasets providing normalized expression values or raw data convertible into normalized formats were considered. Associated clinical metadata were also retrieved when available to support downstream survival analysis.

2.2. Meta-Analysis of Differentially Expressed Genes

We used the visual analytics platform NetworkAnalyst [16] to conduct a meta-analysis, identifying DEGs between HGSOC samples and normal samples from the selected datasets. The raw data from each dataset were pre-processed using quantile normalization for microarray datasets and log2 transformation for datasets requiring normalization of variance. After normalization, we applied the ComBat method to remove batch effects arising from differences between datasets, thus ensuring that data from different platforms and studies could be integrated without introducing bias. DEGs identification was performed using a limma R package (v 3.64.1), which fits a linear model to each gene and computes moderated t-statistics to test for differential expression. For the meta-analysis, we combined effect sizes across studies using a random-effects model, which accounts for variability between studies [17]. The significance of DEGs was adjusted for multiple testing using the Benjamini-Hochberg false discovery rate (FDR) method [18], and genes with an absolute fold change > 1.5 and FDR < 0.05 were considered significant. This approach ensured that only robust and biologically relevant DEGs were included for further analysis.

2.3. Functional Enrichment Analysis

Functional enrichment analysis was conducted using an Enrichr platform [19] to explore the biological significance of the upregulated DEGs. We performed enrichment analysis for Gene Ontology (GO) terms, including biological process (BP), molecular function (MF), and cellular component (CC) categories [20]. Enrichment results were considered statistically significant with an adjusted p-value < 0.05 (corrected for multiple testing using the Benjamini-Hochberg method). In addition, we conducted gene set enrichment analysis (GSEA) using the WebGestalt (WEB-based Gene SeT AnaLysis Toolkit) platform [21] to identify deregulated pathways. Both top 100 upregulated and downregulated significant DEGs were inputted for GSEA analysis for the identification of pathways enriched for these genes. For pathway enrichment, we utilized the Kyoto Encyclopedia of Genes and Genomes (KEGG) pathway database, which allows for the systematic identification of pathways significantly associated with the DEGs [22]. The FDR was calculated to account for multiple hypothesis testing, and pathways with an FDR < 0.05 were considered significantly enriched.

2.4. Protein-Protein Interaction (PPI)

To explore the interactions among the proteins coded by the identified DEGs, we constructed a PPI network using the Search Tool for the Retrieval of Interacting Genes (STRING) [23] The top 100 upregulated DEGs were uploaded to STRING, and interactions were mapped based on several evidence channels, including experimental data, co-expression, database annotations, and co-occurrence. We used a stringent interaction confidence score cutoff of 0.700 (high confidence) to ensure the inclusion of robust interactions in the network. Hub genes with a significant degree of connectivity were identified by calculating the number of interactions each gene had with its neighboring genes. Genes with a minimum of four interactions (degree ≥ 4) were considered hub genes, indicating their potential central role in the regulatory network of HGSOC. The identified hub genes and significant modules were analyzed for their potential biological functions and pathway involvement.

2.5. Cox Regression Analysis of DEGs

Using the top 100 upregulated DEGs identified from the meta-analysis, we performed a Cox proportional hazards regression analysis to evaluate the association between gene expression levels and overall survival, utilizing the TIMER 2.0 tool [24]. Genes were filtered based on statistical significance, including only those with an adjusted p-value < 0.05 and a Hazard Ratio (HR) >1. This approach ensured the selection of genes whose overexpression was associated with an increased risk of poor survival outcomes. We used the ovarian cancer survival data from the Cancer Genome Atlas (TCGA) cohort to calculate the risk scores. For each patient, we multiplied the regression coefficient of each gene by its respective expression level from the TCGA ovarian cancer cohort to quantify the strength of the association between gene expression and survival risk. The products of these calculations were summed to generate an overall risk score for each patient, reflecting the cumulative impact of the gene expressions on patient survival risk. The median risk score was calculated across the cohort, and patients were subsequently classified into high-risk and low-risk groups based on whether their risk score was above or below the median.
R i s k   S c o r e = i = 1 n β i × E x p r e s s i o n i
where: n is the total number of selected genes; βi is the Cox regression coefficient for gene i, representing the strength of association between the expression of gene i and the survival outcome (Hazard Ratio); Expression i is the log2 normalized expression of gene i in a given patient.

2.6. Survival Analysis

For the Kaplan-Meier survival analysis, the genes selected from the risk model were individually tested to assess whether higher or lower expression levels were associated with overall survival in patients from the TCGA ovarian cancer cohort. Each gene was analyzed separately to determine its prognostic significance. Additionally, the calculated risk scores (high vs. low risk) were collectively evaluated to predict survival outcomes. Kaplan-Meier survival curves were generated to compare survival distributions between high-risk and low-risk groups, with statistical significance determined using the log-rank test. A p-value of <0.05 was considered statistically significant for both individual gene analysis and the collective risk model assessment.

2.7. Estimation of Immune and Stromal Infiltration

To estimate the immune cell populations within the bulk RNA-seq samples of high- and low-risk ovarian cancer patients from the TCGA cohort, we used the xCell deconvolution tool [25]. Prior to xCell analysis, the RNA-seq data were normalized using the Fragments Per Kilobase Million (FPKM) method, as suggested by the guidelines for the xCell deconvolution algorithm. xCell applies a gene signature-based method for the inference of various immune and stromal cell types, allowing us to deconvolute the bulk tumor data into its constituent cellular components. Specifically, we aimed to quantify the levels of immune cell infiltration in both high- and low-risk patient groups based on the risk scores derived from our model. These scores were used as a proxy for the abundance of each cell type in the tumor microenvironment. To ensure robust comparisons, we first tested the normality of the xCell output data. Based on the data distribution, we applied non-parametric tests (e.g., Mann-Whitney U test) to compare specific immune cell populations between the high- and low-risk patient groups. Statistical significance was set at p < 0.05.

2.8. Analysis of Immunotherapy-Associated Gene Expression

To investigate the implications of our risk stratification model for immunotherapy response, we performed an expression analysis of a curated set of genes known to be associated with response to immune checkpoint inhibitors. The complete list of analyzed genes is available in (Supplementary Table S1). Normalized RNA-seq expression data (FPKM values) for these genes were retrieved from the TCGA ovarian cancer cohort. For each gene, we compared its expression levels between the low-risk and high-risk patient groups. Prior to statistical comparison, the normality of the expression data for each gene was assessed. As the data distributions were determined to be non-normal, non-parametric statistical methods were employed. Specifically, the Mann-Whitney U test was used to identify statistically significant differences in gene expression between the two risk groups, with a p-value threshold of <0.05 considered significant.

2.9. Convergence Analysis

To gain insights into the oncogenic or tumor suppressor functions of the upregulated and downregulated DEGs identified in the meta-analysis, we performed a convergence analysis using data from the ONCOkB database [26]. This analysis aimed to determine the overlap between the DEGs from our study and known oncogenes or tumor suppressor genes. Specifically, we compared the list of upregulated DEGs with the ONCOkB list of oncogenes to identify potential functional overlaps. Similarly, we cross-referenced the downregulated DEGs with the ONCOkB list of tumor suppressor genes. To visualize the convergence between the DEG lists and the ONCOkB gene sets, we used the Venny tool [27]. to create Venn diagrams for comparative analysis. The identified intersections highlighted key DEGs that may function as oncogenes or tumor suppressors in ovarian cancer.

2.10. Single Cell Analysis

We downloaded single-cell RNA-seq data from blueprint.lambrechtslab.org. This dataset comprises seven tumors from patients with high-grade serous tubo-ovarian cancer (HGSTOC) that were collected before treatment. Normalized and log-transformed expression matrices were analyzed using Seurat 4.4. Genes expressed in <10 cells were removed, and cells with <200 genes and >6000 genes and 15% of mitochondrial transcripts were removed. Principal component analysis (PCA) and clustering (Louvain algorithm) were performed using Seurat with default parameters [28]. Cells annotation was performed using known markers, as described in [29]. Uniform Manifold Approximation and Projection (UMAP) was implemented to visualize clusters in a two-dimensional space. For cancer cells, we inferred CNVs using CopyKAT (https://github.com/navinlabcode/copykat) (accessed on 5 January 2025). We combined CNVs and the expression of EPCAM, PAX8, KRT18 and CD24 to define cancer cells, as performed [29]. We then assessed the expression of the markers in the signature. Finally, we selected fibroblasts expressing CAST, TGOLN2, RCBTB2, SERINC1 and TGFBR2 and we performed enrichment analysis using EnrichR.

3. Results

3.1. Selection of Gene Expression Datasets

To identify relevant gene expression datasets for HGSOC exclusively, we conducted a comprehensive search across the GEO, Array Express, and SRA databases. After screening and filtering based on the inclusion criteria, 11 datasets from GEO met inclusion criteria and were included in the meta-analysis: GSE10971, GSE12470, GSE14001, GSE14407, GSE18520, GSE23391, GSE26712, GSE27651, GSE36668, GSE40595, and GSE6008. This process is detailed in Figure 1, which outlines each step of dataset selection. Collectively, these datasets include 291 ovarian cancer samples and 96 control samples (Table 1).
Table 1 Shows a summary of the studies included in this meta-analysis. The selected studies provided information about gene expression of HGSOC cases and controls. Most of the studies utilized the Affymetrix Human Genome U133 Plus platform, with a total of 11 studies published between 2007 and 2013. The dataset comprises 291 cases and 96 controls. These studies use diverse research methodologies, enhancing the generalizability and robustness of this meta-analysis. Each study is accompanied by its respective PMID and NCBI GEO accession number, ensuring traceability and facilitating access to the original datasets and publications.

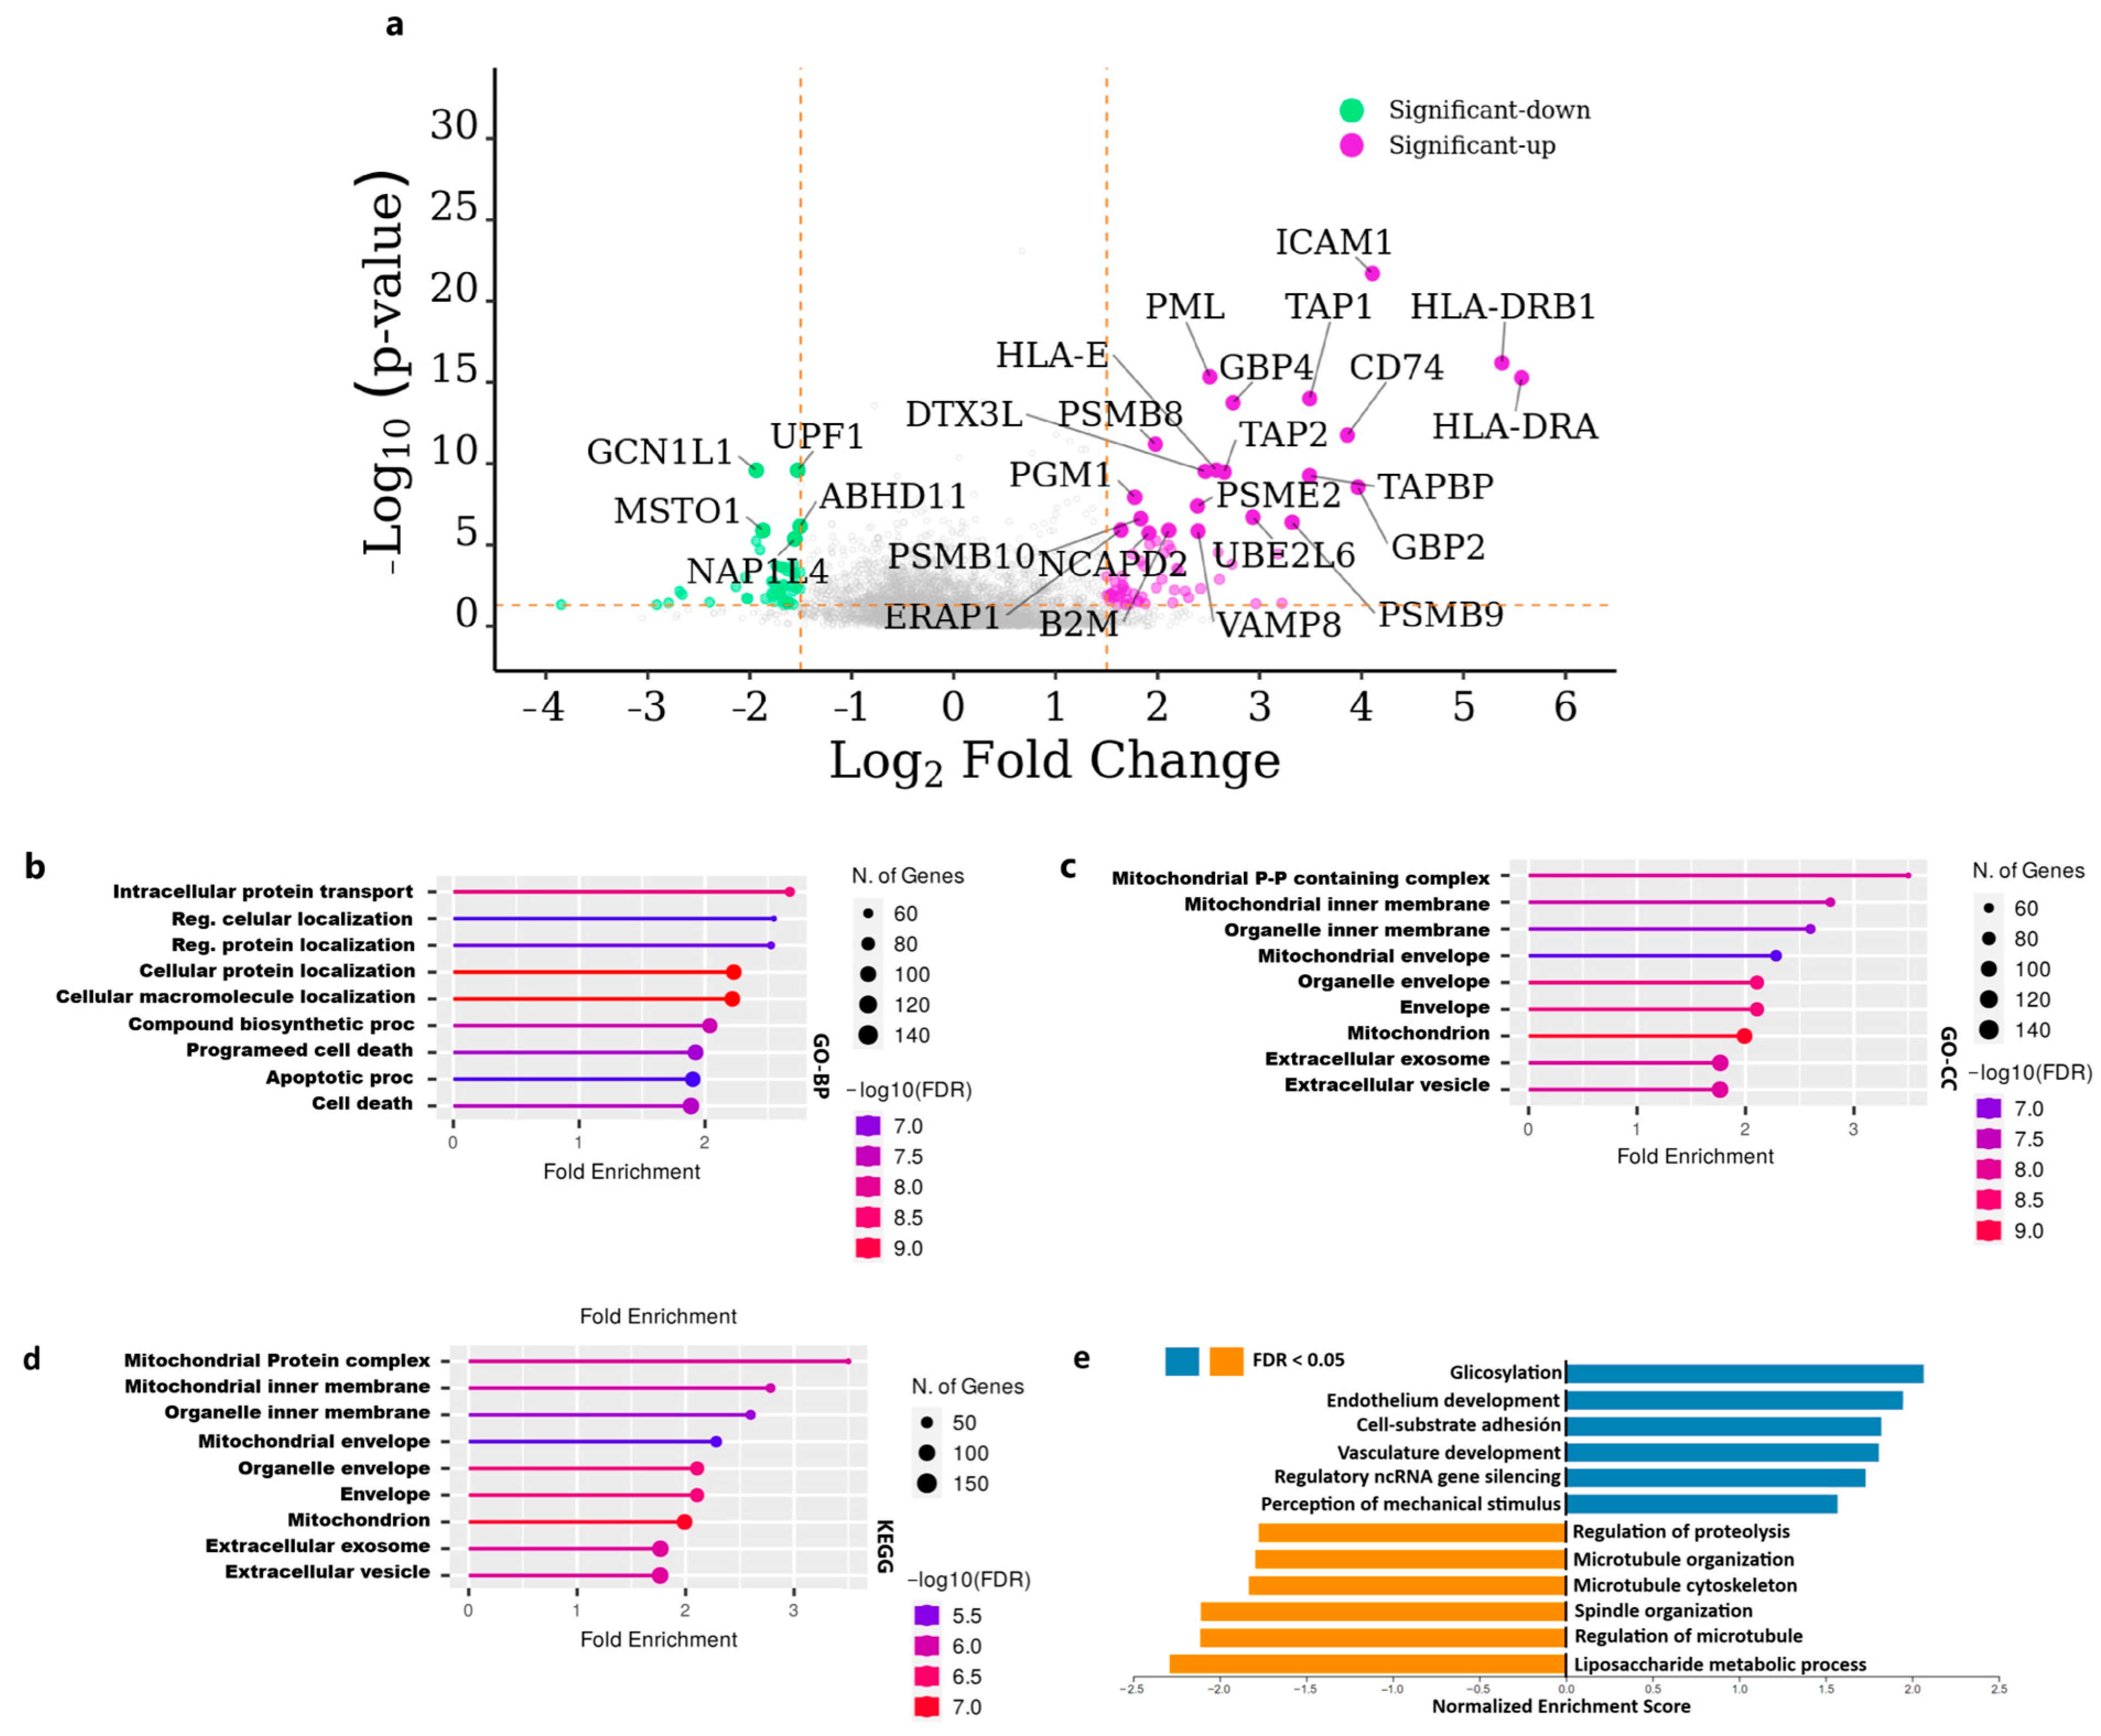
3.2. Functional Enrichment and Pathway Analysis of Differentially Expressed Genes

In this study, we identified a total of 606 upregulated and 286 downregulated DEGs (Supplementary Table S2). We then performed functional enrichment and pathway analysis on the top 100 upregulated DEGs derived from the meta-analysis of gene expression datasets in HGSOC. DEGs were selected based on statistical significance and fold change thresholds. The volcano plot in Figure 2a illustrates the expression distribution, highlighting key upregulated genes with notable statistical significance. GO enrichment was employed to explore biological processes and cellular components associated with these upregulated genes. The biological process enrichment analysis (Figure 2b) reveals that these genes are primarily involved in intracellular protein transport, regulation of cellular localization, and programmed cell death processes critical to tumor progression and cellular regulation in HGSOC. CC enrichment analysis (Figure 2c) indicates significant localization of these genes within mitochondrial inner membranes, extracellular exosomes, and other organelle structures, underscoring the role of these cellular compartments in the disease’s pathology.
To further examine functional pathways, we applied the KEGG pathway analysis to the top 100 upregulated DEGs, as shown in Figure 2d. The results suggest a significant involvement of mitochondrial protein-containing complexes, vesicular transport systems, and various cellular organelle membranes, indicating potential dysregulation of mitochondrial function and intracellular trafficking mechanisms in HGSOC. Additionally, we performed GSEA analysis incorporating the top 100 upregulated and top 100 downregulated DEGs (Figure 2e), which highlighted pathways related to cellular adhesion, vasculature development, and microtubule organization. These enriched pathways, integrating both up and downregulated genes, suggest a complex regulatory landscape involving processes that support tumor growth, invasion, and metastasis in HGSOC.

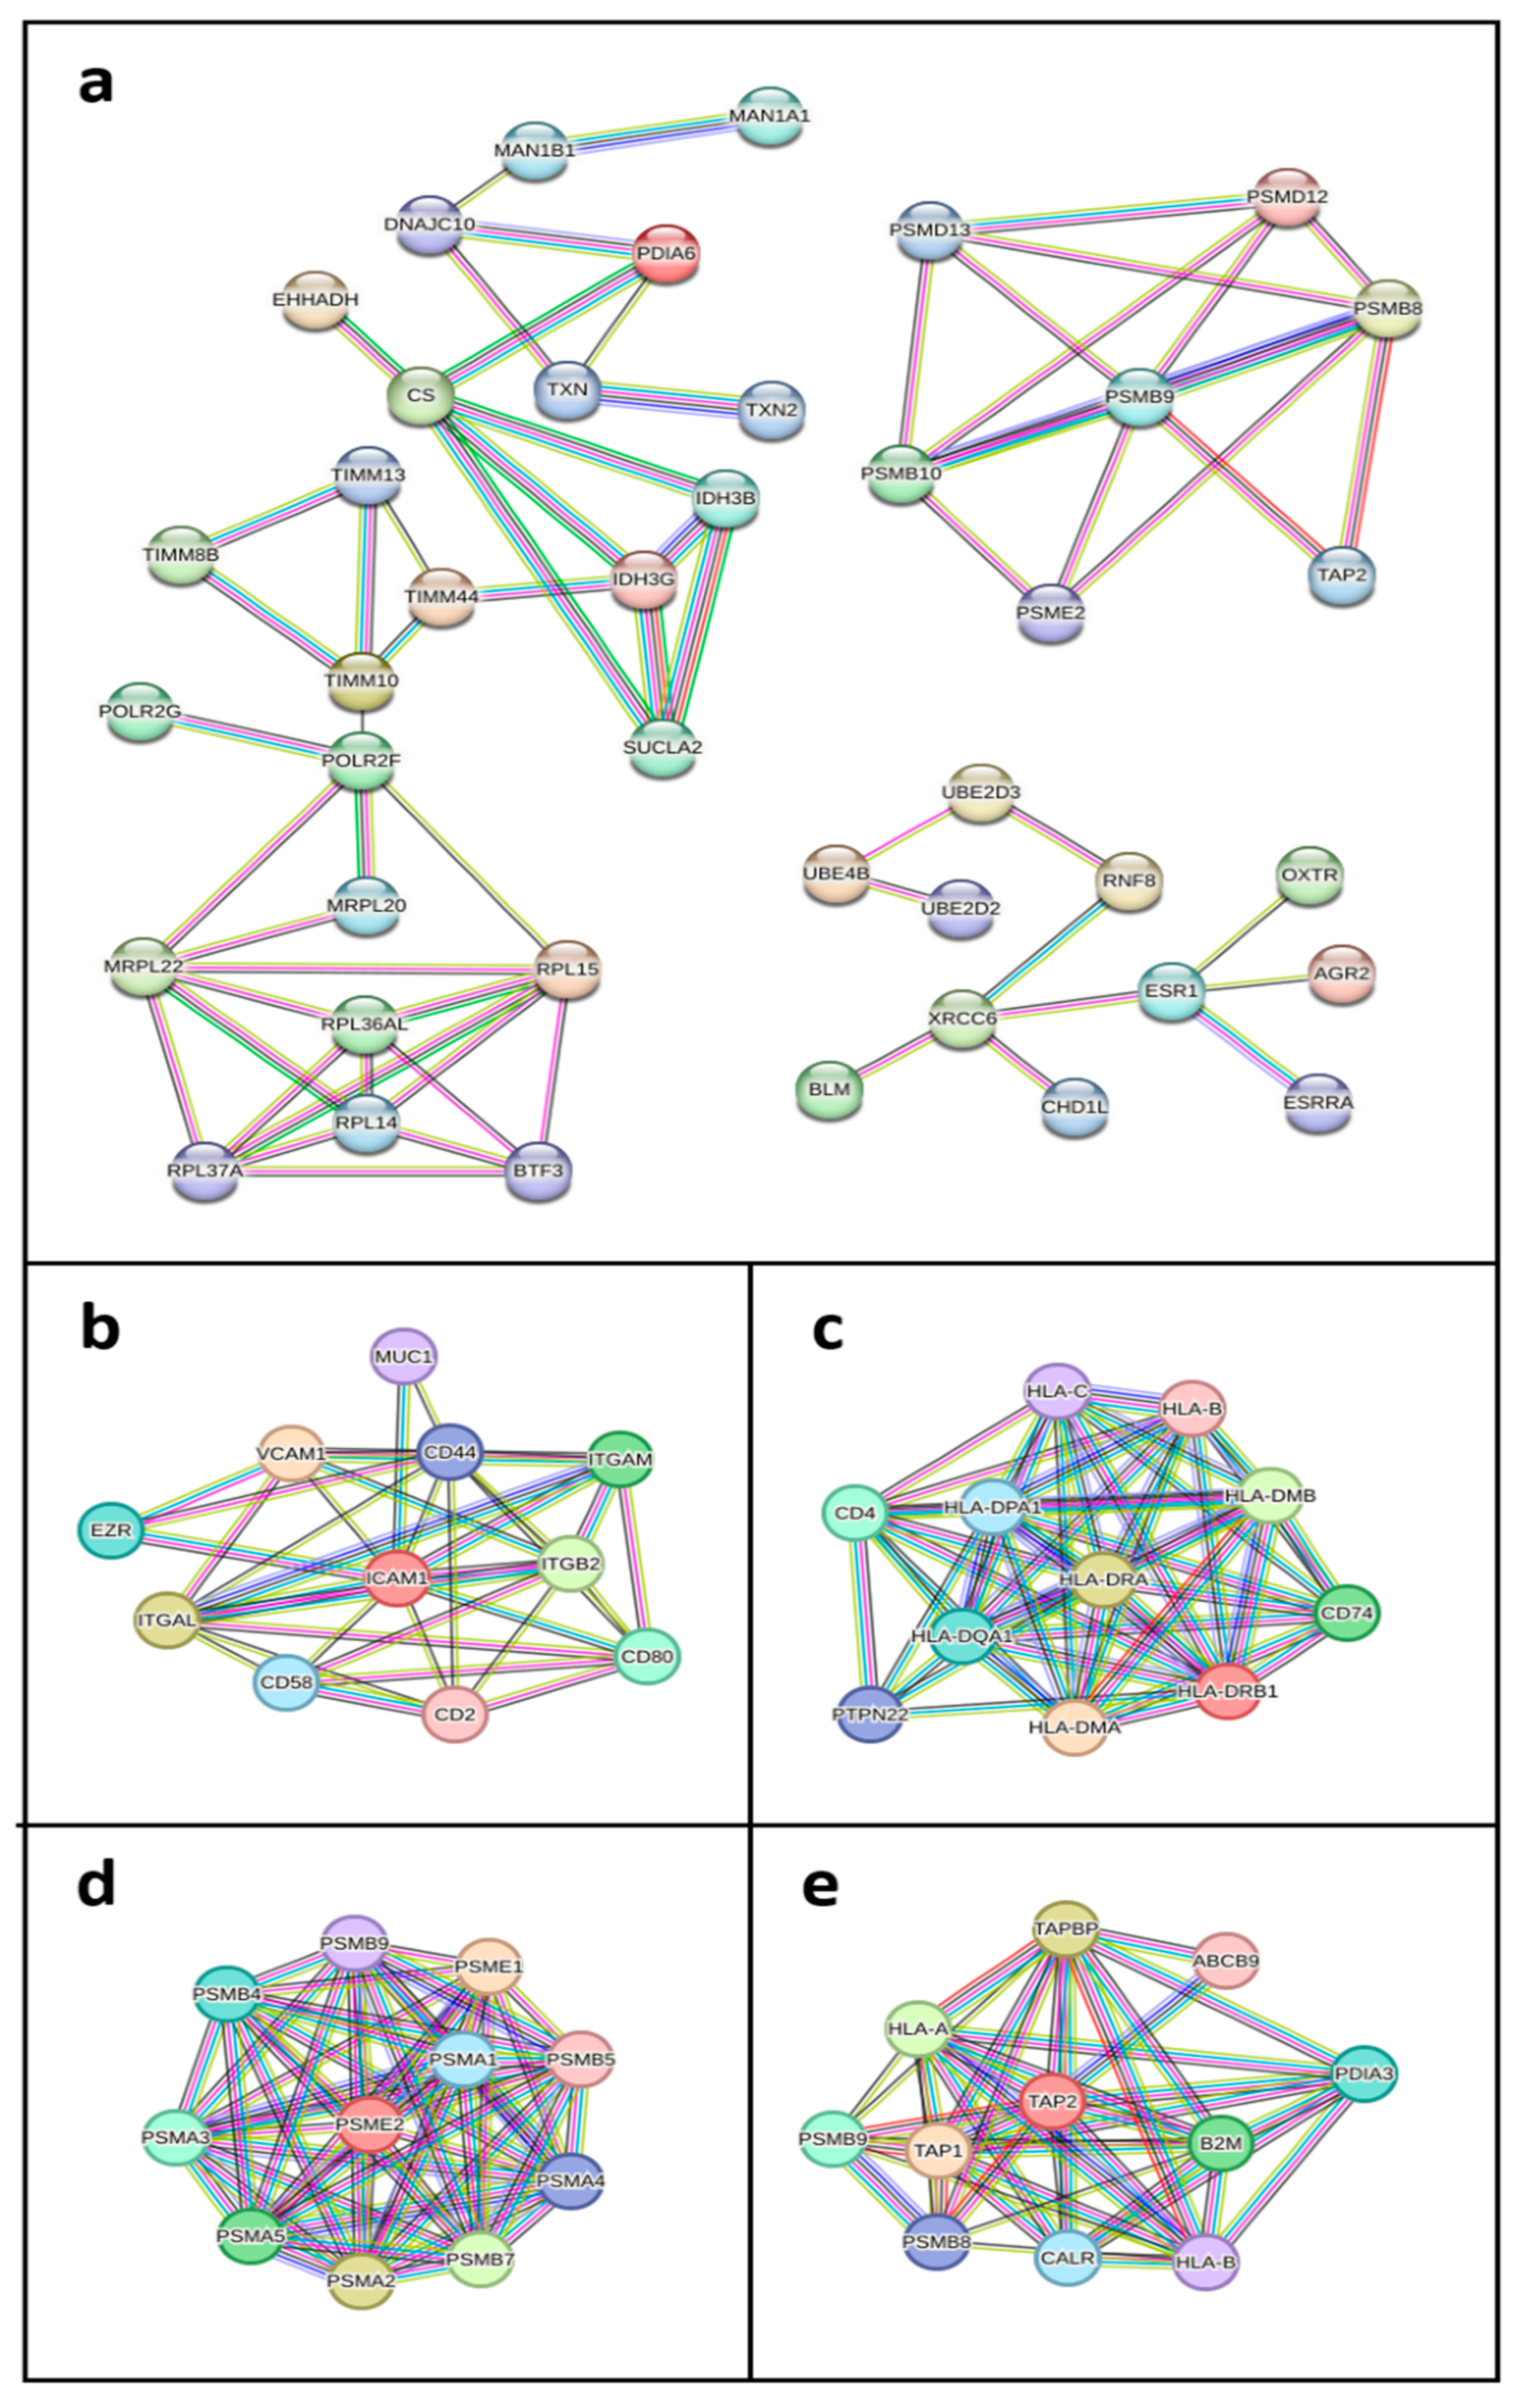
3.3. Protein-Protein Interaction Networks of Key Differentially Expressed Genes in HGSOC

To explore the functional interactions among the key DEGs associated with HGSOC, we performed PPI analysis using the STRING database. This analysis allowed us to examine how these genes are organized into networks, potentially revealing their roles in critical cellular processes. In Figure 3, we present the PPI networks derived from the STRING analysis of the top DEGs associated with HGSOC. Figure 3a displays the comprehensive network generated using the top 100 DEGs identified from the meta-analysis. This network reveals key clusters of proteins involved in cellular processes such as mitochondrial function, protein folding, and immune response regulation, reflecting the functional diversity of the DEGs in HGSOC. Among the genes identified in the PPI network and DEG analysis, RPL36A and IDH3G showed relevant functional roles. RPL36A, a ribosomal protein, is involved in translational control and has been reported to promote cell proliferation in colorectal cancer [41]. IDH3G, a subunit of mitochondrial isocitrate dehydrogenase, was recently linked to tumor progression in lung adenocarcinoma through glycolysis-dependent lactylation mechanisms [42]. These findings highlight the potential biological relevance of these genes in cancer contexts.
Figure 3b through Figure 3e depict more focused PPI networks centered on individual immune-related genes that were upregulated in HGSOC, selected for their relevance to immune function. In Figure 3b, the network around ICAM1 illustrates interactions with other cell adhesion and immune signaling molecules, highlighting ICAM1’s role in leukocyte adhesion and immune cell migration. Figure 3c focuses on HLA-DRA, a gene central to antigen presentation, showing interactions with various major histocompatibility complex (MHC) components, which are critical for immune surveillance. Figure 3d centers on PSME2, associated with the proteasome complex, and displays connections to proteasome subunits, underscoring its involvement in protein degradation and antigen processing. Lastly, Figure 3e highlights TAP2, a transporter associated with antigen processing, showing interactions with multiple MHC class I molecules and other proteins linked to peptide transport, further emphasizing the role of TAP2 in adaptive immunity.

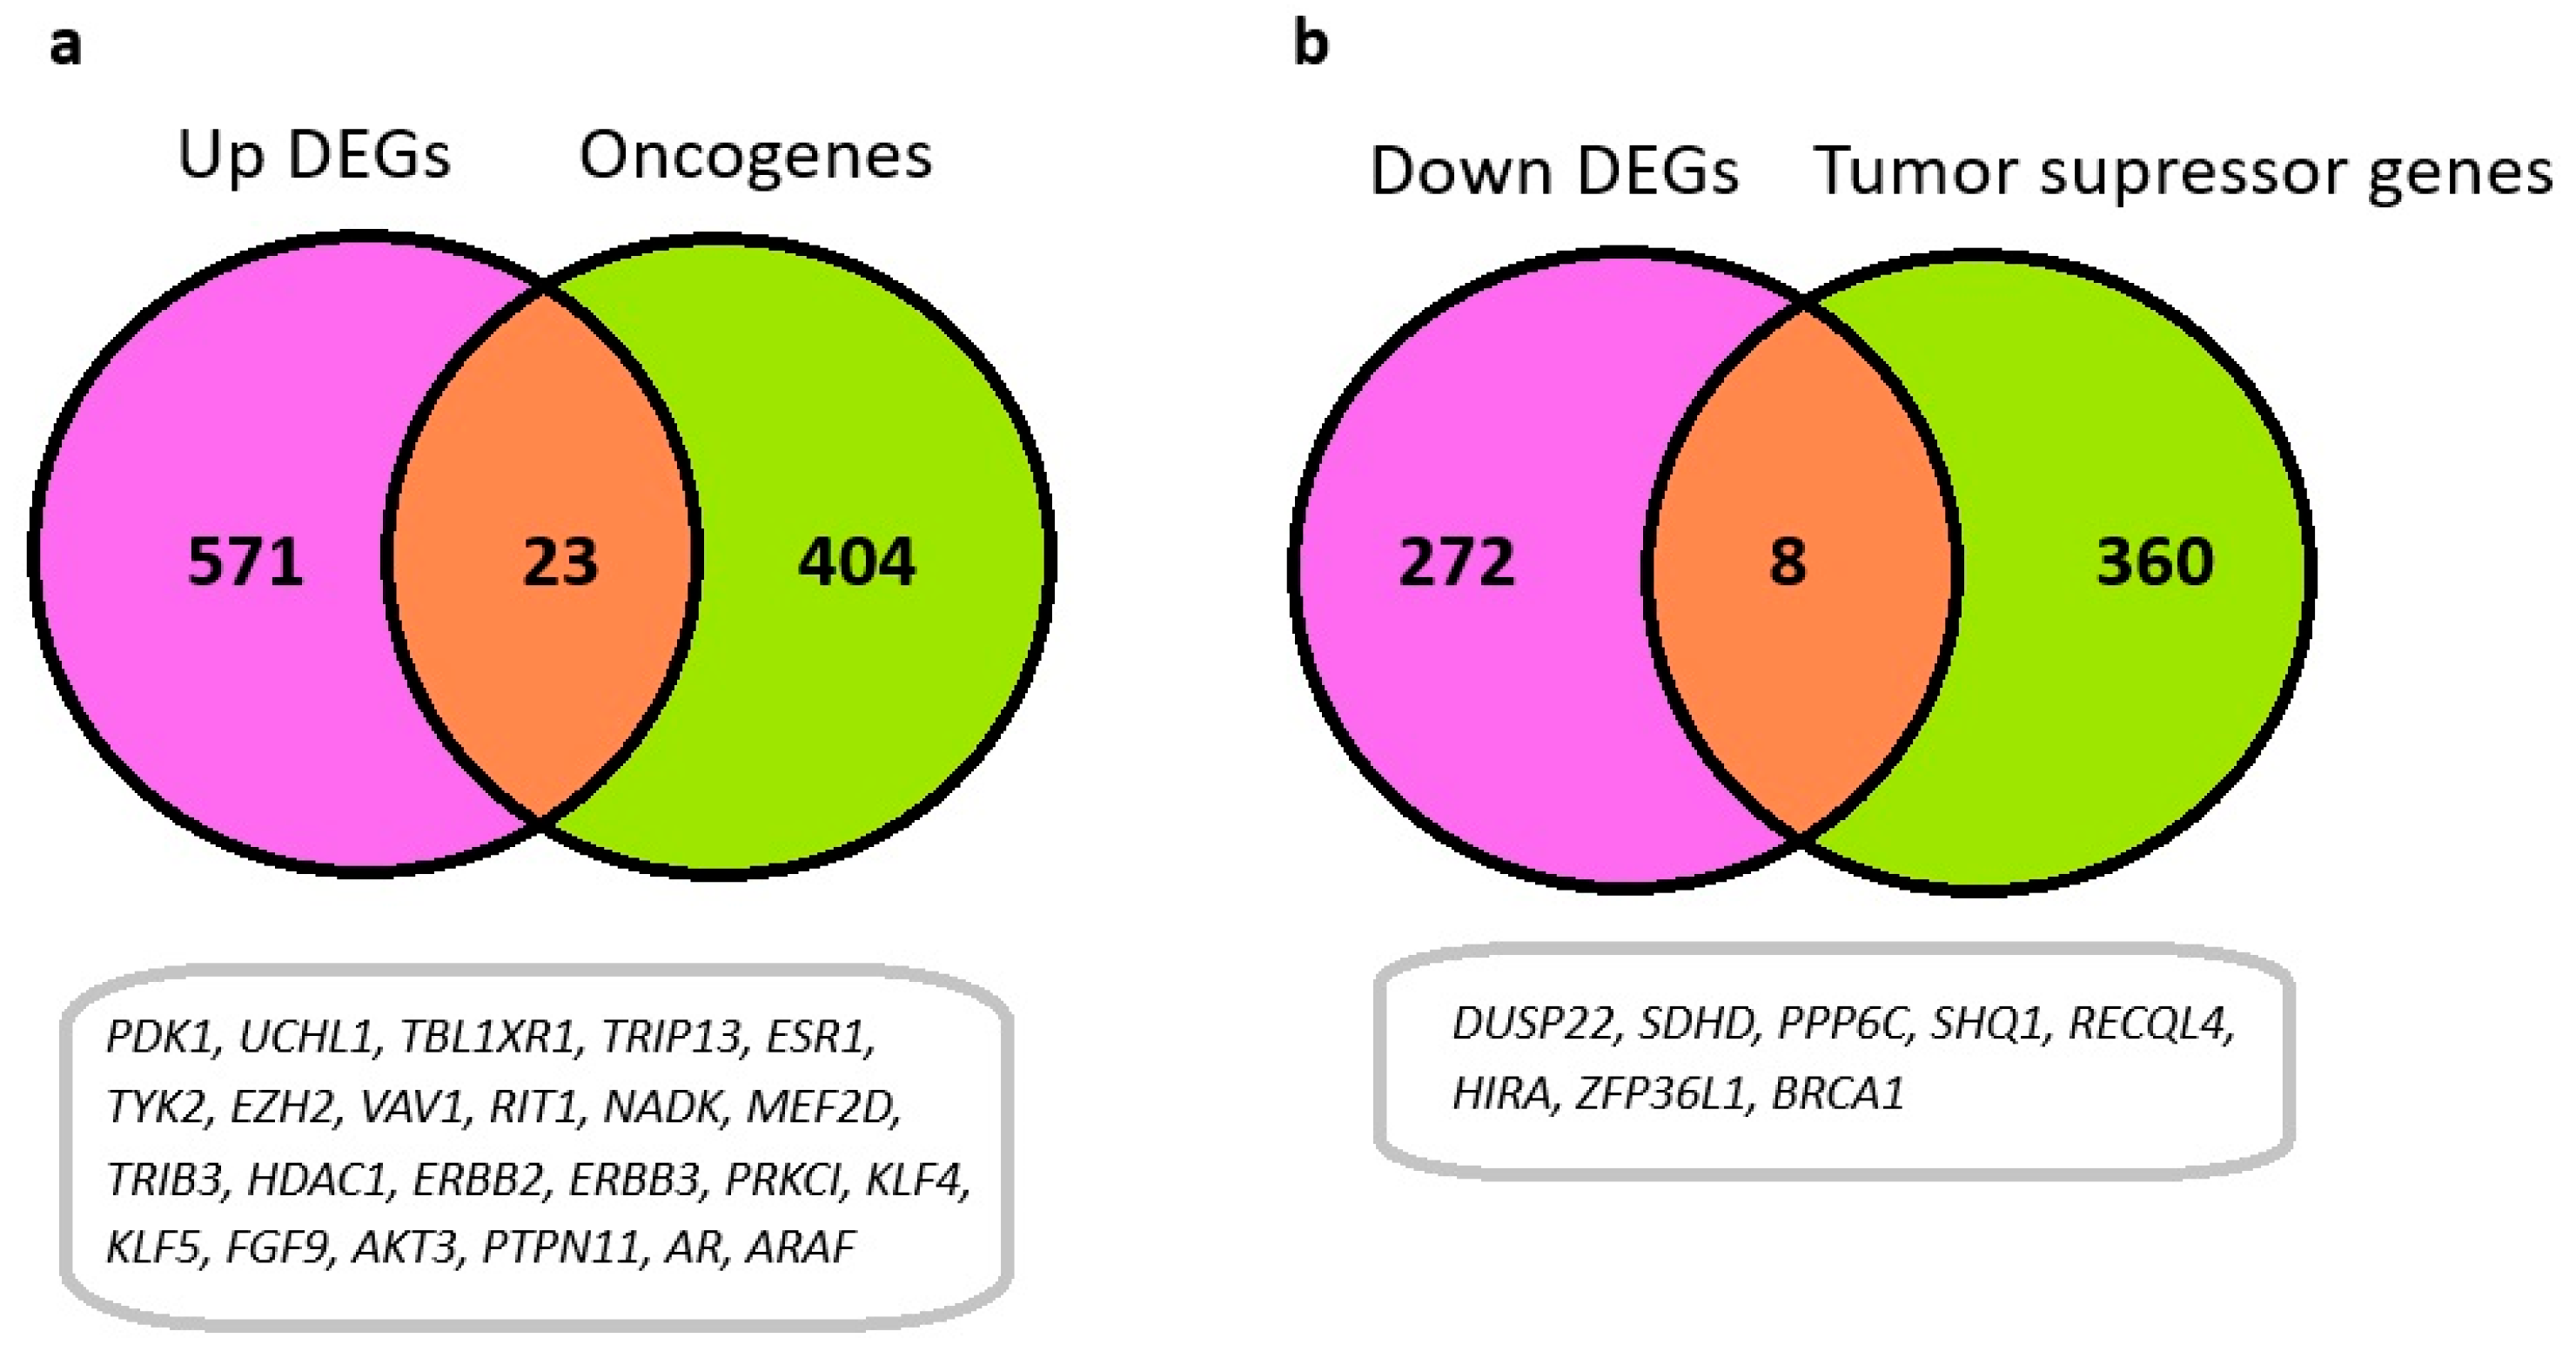
3.4. Identification of Oncogenes and Tumor Suppressor Genes Among Differentially Expressed Genes in HGSOC

To further investigate the roles of key DEGs in HGSOC, we examined their overlap with known oncogenes and tumor suppressor genes using the OncoKB database. This analysis aimed to identify whether the upregulated or downregulated genes in our study align with well-established cancer related genes, potentially revealing insights into mechanisms of tumorigenesis and cancer progression in HGSOC. Figure 4 shows the convergence between DEGs in HGSOC and known oncogenes and tumor suppressor genes, based on the OncoKB database. Figure 4a depicts a Venn diagram of the upregulated DEGs and oncogenes, revealing 23 genes that overlap with established oncogenes. These genes, including PDK1, UCHL1, TBL1XR1, TRIP13, ESR1, TYK2, EZH2, and others, may play significant roles in tumorigenesis and cancer progression in HGSOC. Figure 4b displays the overlap between downregulated DEGs and tumor suppressor genes, identifying eight overlapping genes, such as DUSP22, SDHD, PPP6C, SHQ1, RECQL4, and BRCA1. These downregulated tumor suppressor genes suggest potential pathways and mechanisms through which tumorigenic processes might evade regulatory checkpoints.

3.5. Survival Analysis of Key Upregulated Genes and Risk Stratification in Ovarian Cancer

Following the identification of top DEGs from the meta-analysis, we conducted a Cox univariate analysis on the top 100 upregulated DEGs to assess their association with survival risk in a cohort of ovarian cancer patients from the TCGA. The results are summarized in the forest plot (Figure 5a), which includes only those genes showing a statistically significant association with hazard risk, while non-significant genes are omitted for clarity. Among the significant genes, higher expression levels correlated with an increased hazard ratio, indicating a potential role in poorer patient outcomes. Kaplan-Meier survival plots for selected transcriptional profiles, specifically SEC24B, TGOLN2, TRAK1, and CAST, are displayed in panels b through e. These genes are involved in key cellular processes such as vesicular trafficking (TGOLN2), mitochondrial transport (TRAK1), and proteolytic regulation (CAST), processes often dysregulated in cancer. For each of these genes, patients were stratified into high and low expression groups based on their expression levels. The survival analysis reveals a significant association between elevated expression of these genes and decreased overall survival in ovarian cancer patients, with higher expression levels linked to worse survival outcomes. Panel f presents a Kaplan-Meier survival analysis using a composite risk score, developed by multiplying the expression levels of the genes in the forest plot by their respective Cox regression coefficients. This risk model effectively stratifies patients into high-risk and low-risk groups, with the high-risk group showing significantly reduced survival compared to the low-risk group (Figure 5f). This finding underscores the potential utility of our gene expression-based risk model in prognosticating survival in ovarian cancer patients. Furthermore, this model holds promise for identifying high-risk patients who may benefit from targeted therapies though further validation in independent cohorts is warranted.

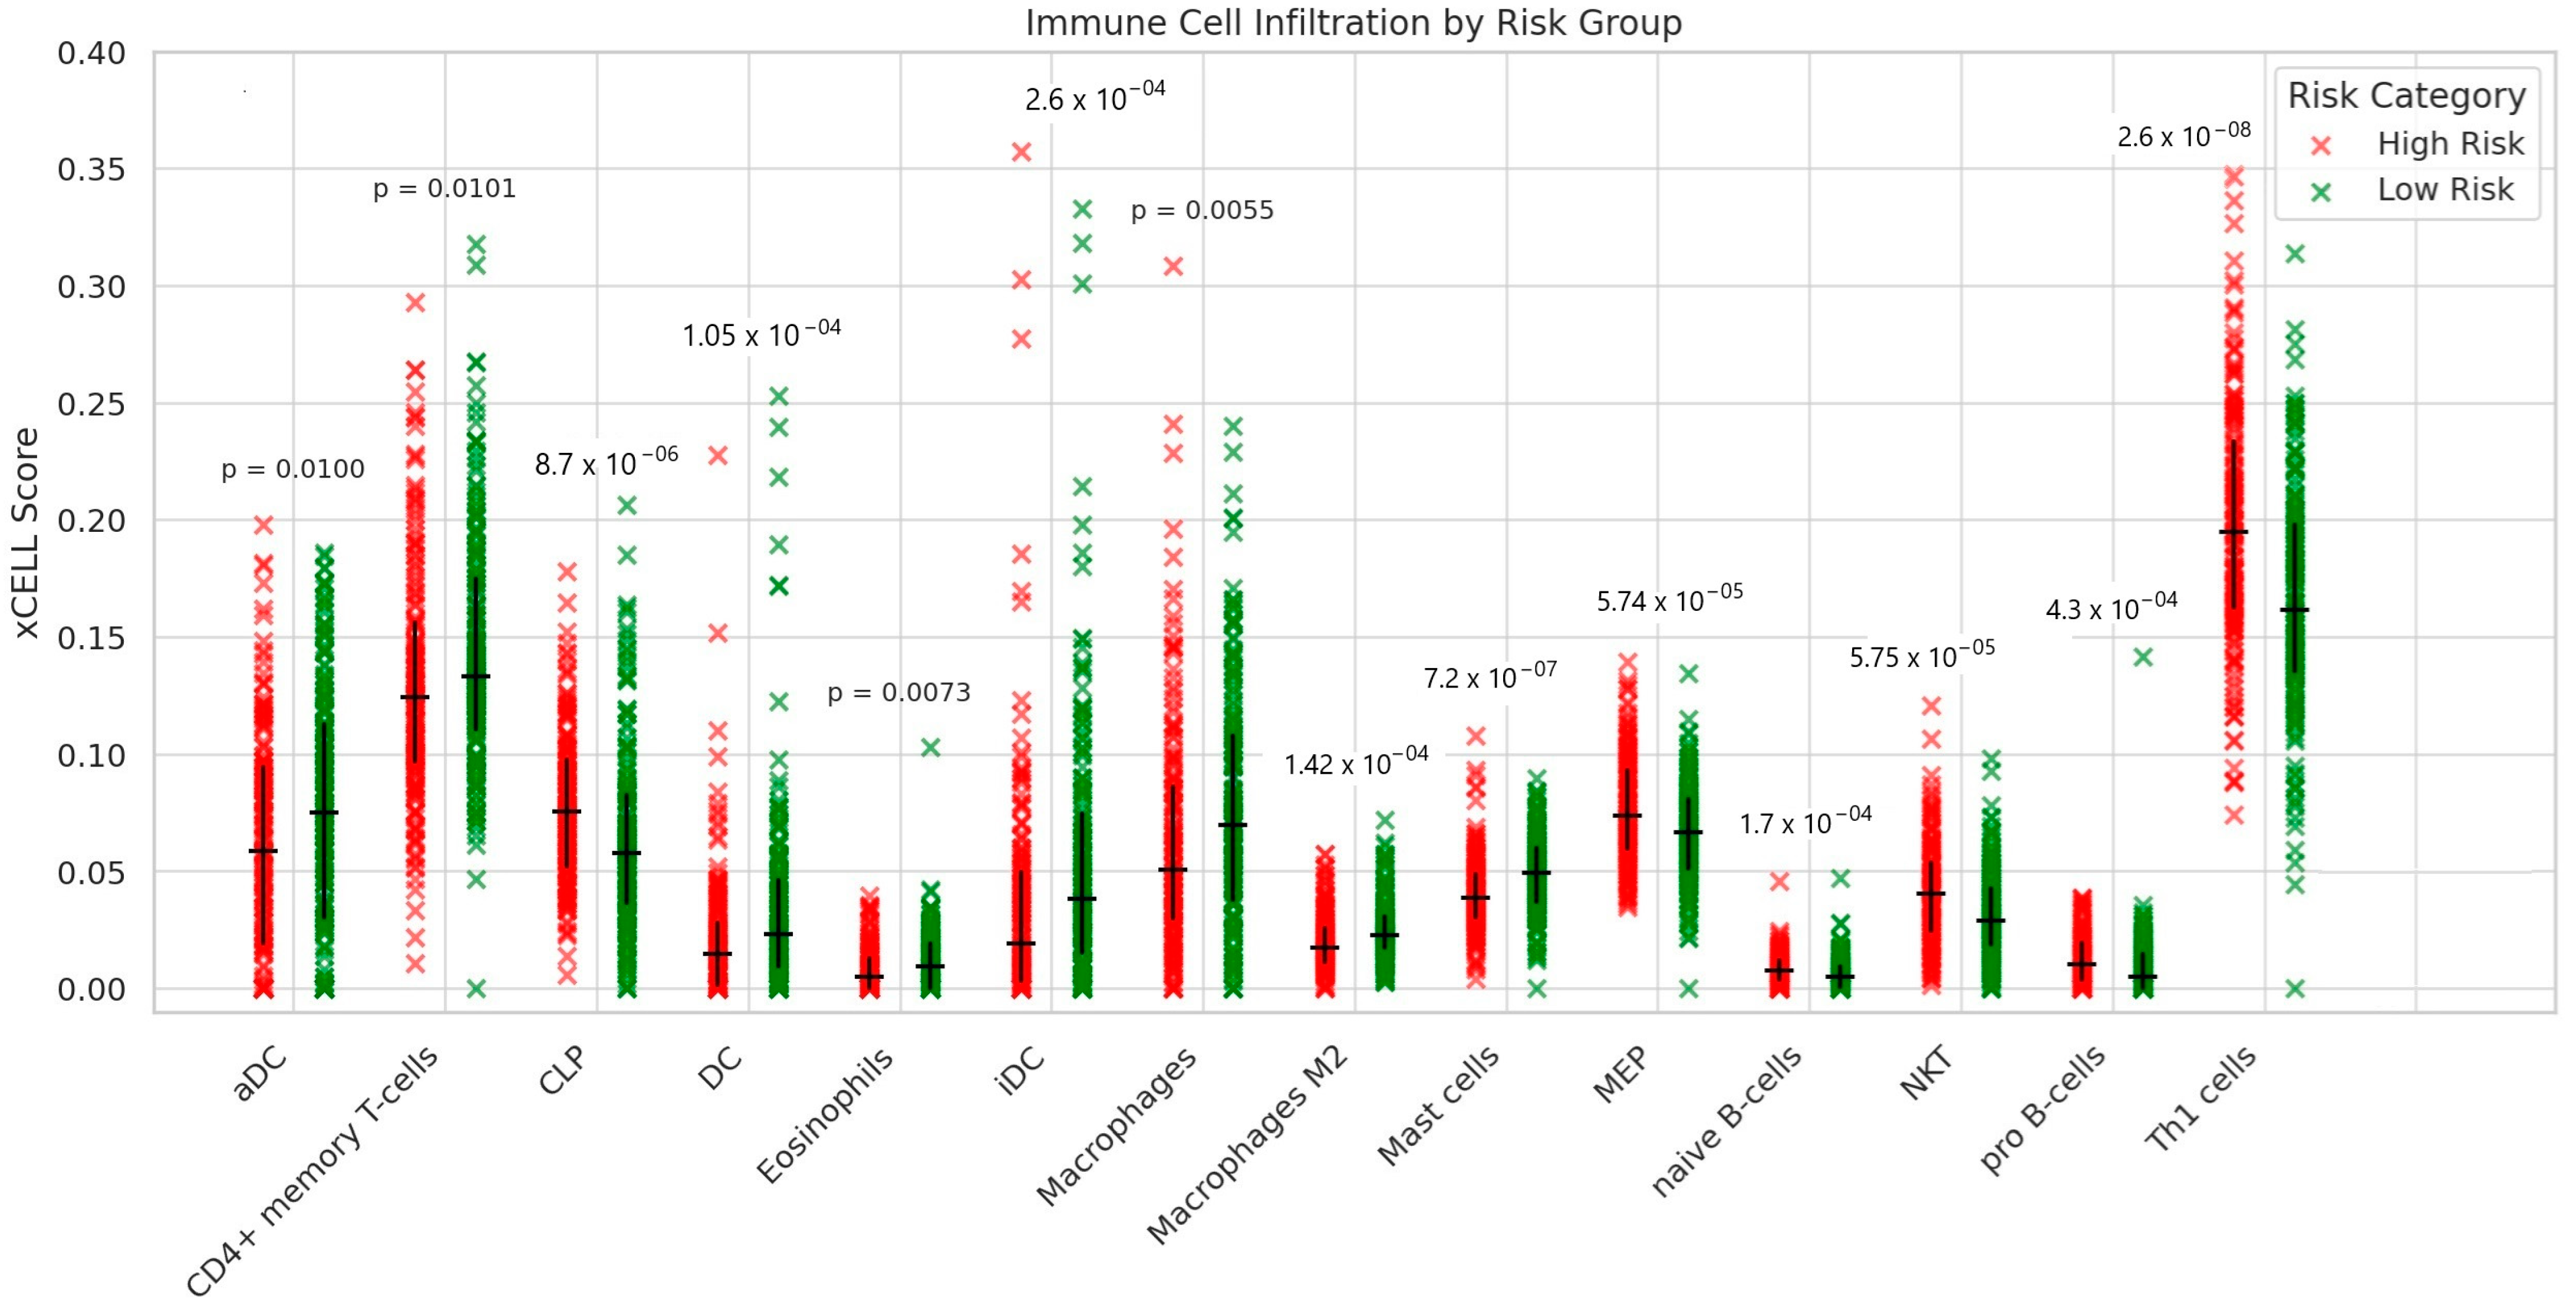
3.6. Estimation of Immune Cell Infiltration Between High- and Low-Risk Ovarian Cancer Patients

Using our risk stratification model, the TCGA ovarian cancer cohort was divided into high-risk and low-risk groups, and immune cell infiltration levels were analyzed using the xCell deconvolution method. Figure 6 highlights statistically significant differences in immune cell infiltration between these groups, with 14 out of 64 immune cell types showing variation. Low-risk patients exhibited increased infiltration of activated dendritic cells (aDC), dendritic cells (DC) and CD4+ memory T-cells, which are associated with anti-tumor immune responses. In contrast, high-risk patients showed higher levels of common lymphoid progenitors (CLP) and megakaryocyte-erythroid progenitors (MEP), indicative of an infiltration with immature immune cells and an immunosuppressive tumor microenvironment. These findings suggest that low-risk patients could benefit from a more active and potentially effective anti-tumor immune environment, while the high-risk group may experience poor survival outcomes due to an immunosuppressive landscape driven by elevated CLP and MEP. This highlights the pivotal role of immune composition in influencing patient prognosis and emphasizes the potential for immunotherapeutic interventions targeting these immune populations to improve outcomes in high-risk patients.

Differential Expression of Immunotherapy-Associated Genes

To further characterize the immune landscape associated with our risk stratification model and infer potential responsiveness to immunotherapy, we analyzed the expression of key immunotherapy-related genes in the low- and high-risk groups (Figure 7). This analysis revealed significant differences in the expression patterns of several genes. The low-risk patient group exhibited significantly higher expression levels of CD274 (PD-L1) (p = 0.034), VSIR (VISTA) (p = 0.0001), CD8A (p = 0.029), CD4 (p = 0.0001), STAT1 (p = 0.044), CXCL9 (p = 0.008), and TAP1 (p = 0.005) compared to the high-risk group. Higher expression of CD8A and CD4 indicates increased infiltration of cytotoxic and helper T lymphocytes, respectively, suggesting a more robust adaptive immune presence. Elevated levels of CXCL9, a chemokine, further support enhanced T-cell recruitment to the tumor microenvironment. The increased expression of STAT1, a downstream effector of IFN-γ signaling, points towards active anti-tumor immune responses. Crucially, the upregulation of immune checkpoints such as PD-L1 and VISTA in the low-risk group suggests an actively ongoing immune response that the tumor is attempting to suppress, positioning these patients as potentially better responders to immune checkpoint blockade. In contrast, HLA-A expression (p = 0.037) was found to be significantly higher in the high-risk group. While HLA-A is vital for antigen presentation, its increased expression in the context of overall lower immune activation markers (CD8A and CD4,) in the high-risk group may suggest alternative immune evasion mechanisms or an insufficient broader immune response to leverage this antigen presentation capacity. Collectively, these findings indicate that the low-risk group, identified by our model, is characterized by an immune profile consistent with an “immune hot” tumor phenotype, suggesting a higher likelihood of response to immune checkpoint inhibitor therapies.

3.7. Single-Cell Analysis Reveals Cellular Expression Patterns of Survival Associated Genes and Dysregulation of Extracellular Matrix Pathways in HGSOC

To further explore the expression patterns of the genes identified in the survival model at a single-cell resolution, we analyzed a publicly available dataset comprising eight HGSOC patients, which included 18,403 single-cell transcriptomes [29]. Cell clusters were first identified using unsupervised clustering (Figure 8a), revealing distinct populations of monocytes/macrophages, stromal cells, cancer cells, endothelial cells, and other immune and stromal components. The expression patterns of survival-associated genes were then interrogated at the cellular level. TGFBR2 (Figure 8b) exhibited enriched expression in endothelial cells, with additional expression detected in a subset of epithelial tumor cells and B cells. In contrast, CAST and TGOLN2 (Figure 8c,e) demonstrated widespread, ubiquitous expression across virtually all cell types and clusters. Notably, PTGIS (Figure 8d) was almost exclusively expressed in epithelial tumor cells, highlighting its tumor-specific role.
Functional enrichment analysis of the high-risk gene signature, characterized by the overexpression of these genes, revealed significant dysregulation of extracellular matrix (ECM) related pathways, including collagen biosynthesis, ECM organization, TGF-beta regulation in the ECM, integrin signaling, ECM-receptor interactions, and focal adhesion (Figure 8f). These findings underscore the critical role of microenvironmental components in driving the expression of genes associated with increased risk and poorer overall survival in HGSOC patients. This highlights the intricate interplay between cancer cells and their microenvironment in shaping aggressive tumor phenotypes and potential therapeutic vulnerabilities.

4. Discussion

In this meta-analysis of HGSOC gene expression profiles, we identified differentially expressed oncogenes and tumor suppressor genes associated with disease progression and patient survival (Figure 2a). Notably, 23 oncogenes were significantly upregulated, and 8 tumor suppressors were downregulated (Figure 4), pointing to their possible roles in sustaining tumor growth. Among the top upregulated genes, SEC24B, TGOLN2, TRAK1, and CAST emerged as strong prognostic factors, with elevated expression correlating with poorer overall survival in the TCGA ovarian cancer cohort (Figure 5). These findings align with previous studies indicating that gene signatures can refine risk stratification in HGSOC [43,44,45,46,47].
The selection of these specific genes was guided by their statistical association with survival and their biological plausibility based on known or emerging roles in cancer. SEC24B, a component of the COPII vesicle trafficking machinery, is involved in protein transport and autophagy, processes increasingly recognized as central to cancer cell survival and chemoresistance. Although its paralog SEC23 has been more extensively studied, evidence suggests that SEC24 family members may regulate secretory pathways that promote tumorigenic signaling cascades [48]. TGOLN2 (trans-Golgi network protein 2), recently implicated in distant metastasis in non-small cell lung cancer [49], may similarly support the vesicle-mediated trafficking of molecules involved in immune evasion or metastatic dissemination in ovarian cancer. TRAK1, initially identified as a tumor-associated antigen (MGb2-Ag) in gastric cancer [50], is a kinesin-binding protein linked to mitochondrial trafficking, a process that supports cancer cell motility and energy adaptation under stress conditions. While these genes are not among the most widely used clinical biomarkers (e.g., BRCA1/2, TP53, or CA-125), their prognostic relevance in our analysis was comparable or stronger in terms of hazard ratio and survival discrimination (Figure 5). Importantly, they may represent novel, HGSOC-specific vulnerabilities not captured by traditional markers. Future work should aim to integrate these candidates into multiplex prognostic models and explore their value in independent cohorts or in combination with established molecular classifiers.
Pathway enrichment analyses revealed a predominance of processes related to mitochondrial function and cellular transport, suggesting these pathways contribute substantially to HGSOC tumor biology. For instance, TRAK1 appears to support tumor cell metabolic demands through mitochondrial transport, while TGOLN2 and SEC24B may enhance vesicle trafficking, potentially facilitating the secretion of pro-tumorigenic factors (Figure 2b–d) [51,52,53]. Overexpression of CAST, a regulator of calcium dependent proteases, could further bolster tumor survival by conferring resistance to apoptosis [54]. These mechanisms are consistent with reports in other cancers, underscoring the broader relevance of mitochondrial and transport-related pathways to tumor progression [55].
Comparison with broader ovarian cancer meta-analyses highlights both common and HGSOC specific expression patterns. Genes such as EZH2, AKT3, and ICAM1 were shared across multiple ovarian cancer subtypes, underscoring their general involvement in immune evasion, proliferation, and migration [56,57]. However, SEC24B and TRAK1 were distinctly overexpressed in the HGSOC-specific cohort, suggesting they may reflect unique metabolic and invasive features of this aggressive subtype [48,58]. These findings emphasize the importance of subtype focused research to uncover therapeutic targets tailored to HGSOC’s distinct molecular landscape.
Leveraging the identified survival-associated genes, we built a risk stratification model that distinguished high- and low-risk patient groups. The high-risk group showed significantly reduced survival, indicating that a gene expression-based approach could augment existing clinical tools for prognostication [59]. Such models have gained traction in other malignancies for example, the 21-gene recurrence score in breast cancer [60] and hold promise for guiding personalized treatments and surveillance in HGSOC. Patients in the high-risk category, for example, may benefit from more aggressive therapeutic regimens or novel agents targeting these key survival-associated genes.
Our analysis of immune cell infiltration highlights distinct tumor microenvironment landscapes between high-risk and low-risk HGSOC patients, providing critical insights into the immune dynamics influencing patient outcomes. Low-risk patients exhibited higher infiltration of aDC, CD4+ memory T-cells, and DC, consistent with a more active anti-tumor immune response [61,62,63]. In contrast, high-risk patients displayed elevated levels of CLP and MEP, suggesting an immature immune profile and a tumor-promoting immunosuppressive environment [64,65]. These findings underscore the dual role of the immune microenvironment in HGSOC, where the presence of immunosuppressive and immature immune cells in high-risk patients may hinder anti-tumor immunity and contribute to poor survival outcomes. Targeting these immune cell populations, particularly by enhancing dendritic cell function or mitigating immunosuppressive elements like CLP and MEP, could offer novel therapeutic strategies to improve survival in high-risk patients.
Our findings align with previous transcriptomic studies describing the immune landscape of HGSOC. The observed enrichment of dendritic cells and CD4+ memory T cells in low-risk patients supports the presence of a more active immune microenvironment, consistent with the immunoreactive subtype reported by Tothill et al. [57] and the TCGA classification [66]. Additionally, overexpression of immune-related genes such as PSMB9 and TAP1 in our dataset is in line with a recent transcriptomic study that highlighted antigen presentation and interferon signaling as key features in HGSOC [47]. Together, these results suggest that low-risk patients may benefit from a more immunologically active tumor microenvironment, potentially contributing to improved clinical outcomes.
Limitations of the study: Despite the evidence provided by this meta-analysis, several limitations must be acknowledged. The use of heterogeneous datasets from different microarray platforms can introduce biases, and the retrospective design precludes definitive causal inferences. Additionally, microarray technology is generally less accurate than RNA-seq, as it may introduce signal detection biases, has a narrower dynamic range, and lower sensitivity. Moreover, public databases such as TCGA may not adequately represent all demographic groups, underscoring the need for validation in more diverse and representative patient cohorts [5]. Future investigations should include mechanistic studies to validate the functional roles of SEC24B, TGOLN2, TRAK1, and CAST in HGSOC progression and therapeutic resistance, as well as clinical trials aimed at leveraging our gene-based risk model to guide personalized treatment strategies.

5. Conclusions

Our findings deepen the understanding of HGSOC by pinpointing key genes and pathways that drive tumor aggression and confer poor prognosis. By integrating gene expression signatures with immune profiling, we highlight opportunities for targeted interventions ranging from metabolic inhibitors to immunomodulatory therapies tailored to the molecular features of this lethal disease. This work provides insights for more precise risk stratification and personalized treatment approaches that could ultimately improve outcomes for HGSOC patients.

Supplementary Materials

The following supporting information can be downloaded at: https://www.mdpi.com/article/10.3390/immuno5030023/s1.

Author Contributions

Study concept and design C.A.O., acquisition of data C.A.O., P.D.M.-S., A.M.-G. and H.M.T., analysis and interpretation of data C.A.O., P.D.M.-S., Y.T.Z.-O., A.M.-G., H.M.T. and D.A.B., drafting of the manuscript C.A.O., P.D.M.-S., Y.T.Z.-O., D.A.B., A.L.C., R.P.-M., P.L.-C., S.J.S.-G. and J.L.R., critical revision of the manuscript for important intellectual content C.A.O., A.M.-G., L.L.-K., A.L.C. and R.P.-M., administrative, technical, or material support C.A.O., and study supervision C.A.O., L.L.-K., S.J.S.-G. and J.L.R. All authors have read and agreed to the published version of the manuscript.

Funding

The work was supported by a grant from the Instituto Nacional de Cancerología (INC) (Colombia) (ID: 19010300455).

Institutional Review Board Statement

Not applicable. This study did not involve the recruitment of patients or the collection of new clinical data. All analyses were conducted using publicly available transcriptomic datasets obtained from open-access repositories, in accordance with open science principles. The study was entirely based on publicly available data and did not require ethical approval.

Informed Consent Statement

Not applicable. This study did not involve the recruitment of patients or the collection of new clinical data. All analyses were conducted using publicly available datasets obtained from open-access repositories, in accordance with open science principles.

Data Availability Statement

The gene expression datasets analyzed in this study are publicly available in the GEO database under the following accession numbers: GSE10971, GSE12470, GSE14001, GSE14407, GSE18520, GSE23391, GSE26712, GSE27651, GSE36668, GSE40595, and GSE6008. The single-cell RNA Raw sequencing data were obtained from the European Genome-phenome Archive under accession number EGAS00001004987 (EGA; https://ega-archive.org/studies/EGAS00001004987) (accessed on 5 January 2025).

Conflicts of Interest

The authors declare no conflicts of interest.

Abbreviations

The following abbreviations are used in this manuscript:
HGSOCHigh Grade Serous Ovarian Cancer
DEGsDifferentially Expressed Genes
GEOGene Expression Omnibus
NCBINational Center of Biotechnology Information
SRASequence Read Archive
RNA-seqRNA Sequencing
PCAPrincipal Component Analysis
UMAPUniform Manifold Approximation and Projection
CNVsCopy Number Variations
KEGGKyoto Encyclopedia of Genes and Genomes
GSEAGene Set Enrichment Analysis
MHCMajor histocompatibility Complex
aDCActivated Dendritic Cells
DCDendritic Cells
CLPCommon lymphoid progenitors
ECMExtracellular Matrix
iDCImmature Dendritic Cells
MEPMegakaryocyte-erythroid Progenitors
NKTNatural Killer T-Cells
FDRFalse Discovery Rate
GOGene Ontology
BPBiological Process
MFMolecular Function
CCCellular Component
WebGestaltWEB-based Gene SeT AnaLysis
PPIProtein Protein Interaction
STRINGSearch Tool for the Retrieval of Interacting Genes

References

  1. Elsherif, S.B.; Bhosale, P.R.; Lall, C.; Menias, C.O.; Itani, M.; Butler, K.A.; Ganeshan, D. Current Update on Malignant Epithelial Ovarian Tumors. Abdom. Radiol. 2021, 46, 2264–2280. [Google Scholar] [CrossRef] [PubMed]
  2. Lheureux, S.; Braunstein, M.; Oza, A.M. Epithelial Ovarian Cancer: Evolution of Management in the Era of Precision Medicine. CA Cancer J. Clin. 2019, 69, 280–304. [Google Scholar] [CrossRef]
  3. Govindarajan, M.; Wohlmuth, C.; Waas, M.; Bernardini, M.Q.; Kislinger, T. High-Throughput Approaches for Precision Medicine in High-Grade Serous Ovarian Cancer. J. Hematol. Oncol. 2020, 13, 134. [Google Scholar] [CrossRef]
  4. Golub, T.R.; Slonim, D.K.; Tamayo, P.; Huard, C.; Gaasenbeek, M.; Mesirov, J.P.; Coller, H.; Loh, M.L.; Downing, J.R.; Caligiuri, M.A. Molecular Classification of Cancer: Class Discovery and Class Prediction by Gene Expression Monitoring. Science (1979) 1999, 286, 531–537. [Google Scholar] [CrossRef]
  5. Tomczak, K.; Czerwińska, P.; Wiznerowicz, M. Review The Cancer Genome Atlas (TCGA): An Immeasurable Source of Knowledge. Contemp. Oncol./Współczesna Onkol. 2015, 2015, 68–77. [Google Scholar] [CrossRef] [PubMed]
  6. Hollis, R.L.; Gourley, C. Genetic and Molecular Changes in Ovarian Cancer. Cancer Biol. Med. 2016, 13, 236. [Google Scholar] [CrossRef] [PubMed]
  7. Karst, A.M.; Levanon, K.; Drapkin, R. Modeling High-Grade Serous Ovarian Carcinogenesis from the Fallopian Tube. Proc. Natl. Acad. Sci. USA 2011, 108, 7547–7552. [Google Scholar] [CrossRef]
  8. Lord, C.J.; Ashworth, A. BRCAness Revisited. Nat. Rev. Cancer 2016, 16, 110–120. [Google Scholar] [CrossRef]
  9. Konstantinopoulos, P.A.; Spentzos, D.; Karlan, B.Y.; Taniguchi, T.; Fountzilas, E.; Francoeur, N.; Levine, D.A.; Cannistra, S.A. Gene Expression Profile of BRCA Ness That Correlates with Responsiveness to Chemotherapy and with Outcome in Patients with Epithelial Ovarian Cancer. J. Clin. Oncol. 2010, 28, 3555–3561. [Google Scholar] [CrossRef]
  10. Kuhn, E.; Kurman, R.J.; Vang, R.; Sehdev, A.S.; Han, G.; Soslow, R.; Wang, T.; Shih, I. TP53 Mutations in Serous Tubal Intraepithelial Carcinoma and Concurrent Pelvic High-grade Serous Carcinoma—Evidence Supporting the Clonal Relationship of the Two Lesions. J. Pathol. 2012, 226, 421–426. [Google Scholar] [CrossRef]
  11. Wang, Z.; Gerstein, M.; Snyder, M. RNA-Seq: A Revolutionary Tool for Transcriptomics. Nat. Rev. Genet. 2009, 10, 57–63. [Google Scholar] [CrossRef] [PubMed]
  12. Zhao, S.; Fung-Leung, W.-P.; Bittner, A.; Ngo, K.; Liu, X. Comparison of RNA-Seq and Microarray in Transcriptome Profiling of Activated T Cells. PLoS ONE 2014, 9, e78644. [Google Scholar] [CrossRef] [PubMed]
  13. Ramasamy, A.; Mondry, A.; Holmes, C.C.; Altman, D.G. Key Issues in Conducting a Meta-Analysis of Gene Expression Microarray Datasets. PLoS Med. 2008, 5, e184. [Google Scholar] [CrossRef]
  14. Shabalin, A.A.; Tjelmeland, H.; Fan, C.; Perou, C.M.; Nobel, A.B. Merging Two Gene-Expression Studies via Cross-Platform Normalization. Bioinformatics 2008, 24, 1154–1160. [Google Scholar] [CrossRef] [PubMed]
  15. Bonilla, D.A.; Moreno, Y.; Petro, J.L.; Forero, D.A.; Vargas-Molina, S.; Odriozola-Martínez, A.; Orozco, C.A.; Stout, J.R.; Rawson, E.S.; Kreider, R.B. A Bioinformatics-Assisted Review on Iron Metabolism and Immune System to Identify Potential Biomarkers of Exercise Stress-Induced Immunosuppression. Biomedicines 2022, 10, 724. [Google Scholar] [CrossRef]
  16. Zhou, G.; Soufan, O.; Ewald, J.; Hancock, R.E.W.; Basu, N.; Xia, J. NetworkAnalyst 3.0: A Visual Analytics Platform for Comprehensive Gene Expression Profiling and Meta-Analysis. Nucleic Acids Res. 2019, 47, W234–W241. [Google Scholar] [CrossRef]
  17. DerSimonian, R.; Laird, N. Meta-Analysis in Clinical Trials. Control Clin. Trials 1986, 7, 177–188. [Google Scholar] [CrossRef]
  18. Benjamini, Y.; Hochberg, Y. Controlling the False Discovery Rate: A Practical and Powerful Approach to Multiple Testing. J. R. Stat. Soc. Ser. B (Methodol.) 1995, 57, 289–300. [Google Scholar] [CrossRef]
  19. Xie, Z.; Bailey, A.; Kuleshov, M.V.; Clarke, D.J.B.; Evangelista, J.E.; Jenkins, S.L.; Lachmann, A.; Wojciechowicz, M.L.; Kropiwnicki, E.; Jagodnik, K.M. Gene Set Knowledge Discovery with Enrichr. J. Curr. Protoc. 2021, 1, e90. [Google Scholar] [CrossRef]
  20. The Gene Ontology Resource: Enriching a GOld Mine. Nucleic Acids Res. 2021, 49, D325–D334. [CrossRef]
  21. Zhang, B.; Kirov, S.; Snoddy, J. WebGestalt: An Integrated System for Exploring Gene Sets in Various Biological Contexts. Nucleic Acids Res. 2005, 33, W741–W748. [Google Scholar] [CrossRef]
  22. Kanehisa, M.; Sato, Y.; Furumichi, M.; Morishima, K.; Tanabe, M. New Approach for Understanding Genome Variations in KEGG. Nucleic Acids Res. 2019, 47, D590–D595. [Google Scholar] [CrossRef] [PubMed]
  23. Szklarczyk, D.; Gable, A.L.; Lyon, D.; Junge, A.; Wyder, S.; Huerta-Cepas, J.; Simonovic, M.; Doncheva, N.T.; Morris, J.H.; Bork, P. STRING V11: Protein–Protein Association Networks with Increased Coverage, Supporting Functional Discovery in Genome-Wide Experimental Datasets. Nucleic Acids Res. 2019, 47, D607–D613. [Google Scholar] [CrossRef] [PubMed]
  24. Li, T.; Fu, J.; Zeng, Z.; Cohen, D.; Li, J.; Chen, Q.; Li, B.; Liu, X.S. TIMER2. 0 for Analysis of Tumor-Infiltrating Immune Cells. Nucleic Acids Res. 2020, 48, W509–W514. [Google Scholar] [CrossRef]
  25. Aran, D.; Hu, Z.; Butte, A.J. XCell: Digitally Portraying the Tissue Cellular Heterogeneity Landscape. Genome Biol. 2017, 18, 220. [Google Scholar] [CrossRef] [PubMed]
  26. Chakravarty, D.; Gao, J.; Phillips, S.; Kundra, R.; Zhang, H.; Wang, J.; Rudolph, J.E.; Yaeger, R.; Soumerai, T.; Nissan, M.H. OncoKB: A Precision Oncology Knowledge Base. JCO Precis. Oncol. 2017, 1, 1–16. [Google Scholar] [CrossRef]
  27. Oliveros, J.C. Venny (v2.1.0), An Interactive Tool for Comparing Lists with Venn’s Diagrams. BioinfoGP, CNB: Madrid, Spain, 2007. [Google Scholar]
  28. Butler, A.; Hoffman, P.; Smibert, P.; Papalexi, E.; Satija, R. Integrating Single-Cell Transcriptomic Data across Different Conditions, Technologies, and Species. Nat. Biotechnol. 2018, 36, 411–420. [Google Scholar] [CrossRef]
  29. Olbrecht, S.; Busschaert, P.; Qian, J.; Vanderstichele, A.; Loverix, L.; Van Gorp, T.; Van Nieuwenhuysen, E.; Han, S.; Van den Broeck, A.; Coosemans, A. High-Grade Serous Tubo-Ovarian Cancer Refined with Single-Cell RNA Sequencing: Specific Cell Subtypes Influence Survival and Determine Molecular Subtype Classification. Genome Med. 2021, 13, 1–30. [Google Scholar] [CrossRef]
  30. Tone, A.A.; Begley, H.; Sharma, M.; Murphy, J.; Rosen, B.; Brown, T.J.; Shaw, P.A. Gene Expression Profiles of Luteal Phase Fallopian Tube Epithelium from BRCA Mutation Carriers Resemble High-Grade Serous Carcinoma. Clin. Cancer Res. 2008, 14, 4067–4078. [Google Scholar] [CrossRef]
  31. Yoshihara, K.; Tajima, A.; Komata, D.; Yamamoto, T.; Kodama, S.; Fujiwara, H.; Suzuki, M.; Onishi, Y.; Hatae, M.; Sueyoshi, K. Gene Expression Profiling of Advanced-stage Serous Ovarian Cancers Distinguishes Novel Subclasses and Implicates ZEB2 in Tumor Progression and Prognosis. Cancer Sci. 2009, 100, 1421–1428. [Google Scholar] [CrossRef]
  32. Tung, C.S.; Mok, S.C.; Tsang, Y.; Zu, Z.; Song, H.; Liu, J.; Deavers, M.T.; Malpica, A.; Wolf, J.K.; Lu, K.H. PAX2 Expression in Low Malignant Potential Ovarian Tumors and Low-Grade Ovarian Serous Carcinomas. Mod. Pathol. 2009, 22, 1243–1250. [Google Scholar] [CrossRef] [PubMed]
  33. Bowen, N.J.; Walker, L.D.; Matyunina, L.V.; Logani, S.; Totten, K.A.; Benigno, B.B.; McDonald, J.F. Gene Expression Profiling Supports the Hypothesis That Human Ovarian Surface Epithelia Are Multipotent and Capable of Serving as Ovarian Cancer Initiating Cells. BMC Med. Genom. 2009, 2, 71. [Google Scholar] [CrossRef] [PubMed]
  34. Mok, S.C.; Bonome, T.; Vathipadiekal, V.; Bell, A.; Johnson, M.E.; Park, D.-C.; Hao, K.; Yip, D.K.P.; Donninger, H.; Ozbun, L. A Gene Signature Predictive for Outcome in Advanced Ovarian Cancer Identifies a Survival Factor: Microfibril-Associated Glycoprotein 2. Cancer Cell 2009, 16, 521–532. [Google Scholar] [CrossRef]
  35. Shahab, S.W.; Matyunina, L.V.; Mezencev, R.; Walker, L.D.; Bowen, N.J.; Benigno, B.B.; McDonald, J.F. Evidence for the Complexity of MicroRNA-Mediated Regulation in Ovarian Cancer: A Systems Approach. PLoS ONE 2011, 6, e22508. [Google Scholar] [CrossRef]
  36. Bonome, T.; Levine, D.A.; Shih, J.; Randonovich, M.; Pise-Masison, C.A.; Bogomolniy, F.; Ozbun, L.; Brady, J.; Barrett, J.C.; Boyd, J. A Gene Signature Predicting for Survival in Suboptimally Debulked Patients with Ovarian Cancer. Cancer Res. 2008, 68, 5478–5486. [Google Scholar] [CrossRef] [PubMed]
  37. King, E.R.; Tung, C.S.; Tsang, Y.T.M.; Zu, Z.; Lok, G.T.M.; Deavers, M.T.; Malpica, A.; Wolf, J.K.; Lu, K.H.; Birrer, M.J. The Anterior Gradient Homolog 3 (AGR3) Gene Is Associated with Differentiation and Survival in Ovarian Cancer. Am. J. Surg. Pathol. 2011, 35, 904–912. [Google Scholar] [CrossRef]
  38. Elgaaen, B.V.; Olstad, O.K.; Sandvik, L.; Ødegaard, E.; Sauer, T.; Staff, A.C.; Gautvik, K.M. ZNF385B and VEGFA Are Strongly Differentially Expressed in Serous Ovarian Carcinomas and Correlate with Survival. PLoS ONE 2012, e46317. [Google Scholar] [CrossRef]
  39. Yeung, T.-L.; Leung, C.S.; Wong, K.-K.; Samimi, G.; Thompson, M.S.; Liu, J.; Zaid, T.M.; Ghosh, S.; Birrer, M.J.; Mok, S.C. TGF-β Modulates Ovarian Cancer Invasion by Upregulating CAF-Derived Versican in the Tumor Microenvironment. Cancer Res. 2013, 73, 5016–5028. [Google Scholar] [CrossRef]
  40. Wu, R.; Hendrix-Lucas, N.; Kuick, R.; Zhai, Y.; Schwartz, D.R.; Akyol, A.; Hanash, S.; Misek, D.E.; Katabuchi, H.; Williams, B.O. Mouse Model of Human Ovarian Endometrioid Adenocarcinoma Based on Somatic Defects in the Wnt/β-Catenin and PI3K/Pten Signaling Pathways. Cancer Cell 2007, 11, 321–333. [Google Scholar] [CrossRef]
  41. Shi, J.; Yang, Y.; Chen, F.; Zhou, L.; Wei, H.; Dong, F.; Wang, X.; Shan, Y.; Chen, T. RPL36A Activates ERK Pathway and Promotes Colorectal Cancer Growth. Transl. Oncol. 2025, 51, 102170. [Google Scholar] [CrossRef]
  42. Wang, M.; He, T.; Meng, D.; Lv, W.; Ye, J.; Cheng, L.; Hu, J. BZW2 Modulates Lung Adenocarcinoma Progression through Glycolysis-Mediated IDH3G Lactylation Modification. J. Proteome Res. 2023, 22, 3854–3865. [Google Scholar] [CrossRef] [PubMed]
  43. Spentzos, D.; Levine, D.A.; Ramoni, M.F.; Joseph, M.; Gu, X.; Boyd, J.; Libermann, T.A.; Cannistra, S.A. Gene Expression Signature with Independent Prognostic Significance in Epithelial Ovarian Cancer. J. Clin. Oncol. 2004, 22, 4700–4710. [Google Scholar] [CrossRef]
  44. Denkert, C.; Budczies, J.; Darb-Esfahani, S.; Györffy, B.; Sehouli, J.; Könsgen, D.; Zeillinger, R.; Weichert, W.; Noske, A.; Buckendahl, A. A Prognostic Gene Expression Index in Ovarian Cancer—Validation across Different Independent Data Sets. J. Pathol. A J. Pathol. Soc. Great Br. Irel. 2009, 218, 273–280. [Google Scholar] [CrossRef]
  45. Zhao, Y.; Yang, S.-M.; Jin, Y.-L.; Xiong, G.-W.; Wang, P.; Snijders, A.M.; Mao, J.-H.; Zhang, X.-W.; Hang, B. A Robust Gene Expression Prognostic Signature for Overall Survival in High-Grade Serous Ovarian Cancer. J. Oncol. 2019, 2019, 3614207. [Google Scholar] [CrossRef] [PubMed]
  46. Subramanian, J.; Simon, R. Gene Expression–Based Prognostic Signatures in Lung Cancer: Ready for Clinical Use? J. Natl. Cancer Inst. 2010, 102, 464–474. [Google Scholar] [CrossRef] [PubMed]
  47. Millstein, J.; Budden, T.; Goode, E.L.; Anglesio, M.S.; Talhouk, A.; Intermaggio, M.P.; Leong, H.S.; Chen, S.; Elatre, W.; Gilks, B. Prognostic Gene Expression Signature for High-Grade Serous Ovarian Cancer. Ann. Oncol. 2020, 31, 1240–1250. [Google Scholar] [CrossRef]
  48. Jing, J.; Wang, B.; Liu, P. The Functional Role of SEC23 in Vesicle Transportation, Autophagy and Cancer. Int. J. Biol. Sci. 2019, 15, 2419. [Google Scholar] [CrossRef]
  49. Gerashchenko, T.; Skitchenko, R.; Korobeynikova, A.; Kuanysheva, K.; Khozyainova, A.; Vorobiev, R.; Rodionov, E.; Miller, S.; Topolnitsky, E.; Shefer, N. Whole-Exome Sequencing Reveals an Association of Rs112065068 in TGOLN2 Gene with Distant Metastasis of Non-Small Cell Lung Cancer. Gene 2024, 920, 148507. [Google Scholar] [CrossRef]
  50. Zhang, F.; Ren, G.; Lu, Y.; Jin, B.; Wang, J.; Chen, X.; Liu, Z.; Li, K.; Nie, Y.; Wang, X. Identification of TRAK1 (Trafficking Protein, Kinesin-Binding 1) as MGb2-Ag: A Novel Cancer Biomarker. Cancer Lett. 2009, 274, 250–258. [Google Scholar] [CrossRef]
  51. Wallace, D.C. Mitochondria and Cancer. Nat. Rev. Cancer 2012, 12, 685–698. [Google Scholar] [CrossRef]
  52. Porporato, P.E.; Filigheddu, N.; Pedro, J.M.B.-S.; Kroemer, G.; Galluzzi, L. Mitochondrial Metabolism and Cancer. Cell Res. 2018, 28, 265–280. [Google Scholar] [CrossRef] [PubMed]
  53. Mellman, I.; Yarden, Y. Endocytosis and Cancer. Cold Spring Harb. Perspect. Biol. 2013, 5, a016949. [Google Scholar] [CrossRef] [PubMed]
  54. Brzozowski, J.S.; Skelding, K.A. The Multi-Functional Calcium/Calmodulin Stimulated Protein Kinase (CaMK) Family: Emerging Targets for Anti-Cancer Therapeutic Intervention. Pharmaceuticals 2019, 12, 8. [Google Scholar] [CrossRef] [PubMed]
  55. Matulonis, U.A.; Sood, A.K.; Fallowfield, L.; Howitt, B.E.; Sehouli, J.; Karlan, B.Y. Ovarian Cancer. Nat. Rev. Dis. Primers 2016, 2, 16061. [Google Scholar] [CrossRef]
  56. Ahmed, A.A.; Knapp, S.; Sood, A.K.; Bast, R.C. Targeting Therapies in Cancer: Opportunities in Ovarian Cancer. In Gynaecological Cancers: Biology and Therapeutics; Cambridge University Press: Cambridge, UK, 2011; pp. 167–182. [Google Scholar]
  57. Tothill, R.W.; Tinker, A.V.; George, J.; Brown, R.; Fox, S.B.; Lade, S.; Johnson, D.S.; Trivett, M.K.; Etemadmoghadam, D.; Locandro, B. Novel Molecular Subtypes of Serous and Endometrioid Ovarian Cancer Linked to Clinical Outcome. Clin. Cancer Res. 2008, 14, 5198–5208. [Google Scholar] [CrossRef]
  58. Onodera, Y.; Nam, J.-M.; Horikawa, M.; Shirato, H.; Sabe, H. Arf6-Driven Cell Invasion Is Intrinsically Linked to TRAK1-Mediated Mitochondrial Anterograde Trafficking to Avoid Oxidative Catastrophe. Nat. Commun. 2018, 9, 2682. [Google Scholar] [CrossRef]
  59. Yang, Q.; Jiang, W.; Hou, P. Emerging Role of PI3K/AKT in Tumor-Related Epigenetic Regulation. In Seminars in Cancer Biology; Elsevier: Amsterdam, The Netherlands, 2019; Volume 59, pp. 112–124. [Google Scholar]
  60. Sparano, J.A.; Gray, R.J.; Makower, D.F.; Pritchard, K.I.; Albain, K.S.; Hayes, D.F.; Geyer, C.E., Jr.; Dees, E.C.; Goetz, M.P.; Olson, J.A., Jr. Adjuvant Chemotherapy Guided by a 21-Gene Expression Assay in Breast Cancer. N. Engl. J. Med. 2018, 379, 111–121. [Google Scholar] [CrossRef]
  61. Curiel, T.J.; Coukos, G.; Zou, L.; Alvarez, X.; Cheng, P.; Mottram, P.; Evdemon-Hogan, M.; Conejo-Garcia, J.R.; Zhang, L.; Burow, M. Specific Recruitment of Regulatory T Cells in Ovarian Carcinoma Fosters Immune Privilege and Predicts Reduced Survival. Nat. Med. 2004, 10, 942–949. [Google Scholar] [CrossRef]
  62. Hwang, W.-T.; Adams, S.F.; Tahirovic, E.; Hagemann, I.S.; Coukos, G. Prognostic Significance of Tumor-Infiltrating T Cells in Ovarian Cancer: A Meta-Analysis. Gynecol. Oncol. 2012, 124, 192–198. [Google Scholar] [CrossRef]
  63. Kurozumi, S.; Fujii, T.; Matsumoto, H.; Inoue, K.; Kurosumi, M.; Horiguchi, J.; Kuwano, H. Significance of Evaluating Tumor-Infiltrating Lymphocytes (TILs) and Programmed Cell Death-Ligand 1 (PD-L1) Expression in Breast Cancer. Med. Mol. Morphol. 2017, 50, 185–194. [Google Scholar] [CrossRef]
  64. Jacquelot, N.; Seillet, C.; Vivier, E.; Belz, G.T. Innate Lymphoid Cells and Cancer. Nat. Immunol. 2022, 23, 371–379. [Google Scholar] [CrossRef] [PubMed]
  65. Zhang, H.; Wan, G.; Wang, Y.; Chen, W.; Guan, J.-Z. The Role of Erythrocytes and Erythroid Progenitor Cells in Tumors. Open Life Sci. 2022, 17, 1641–1656. [Google Scholar] [CrossRef] [PubMed]
  66. Network, C.G.A.R. Integrated Genomic Analyses of Ovarian Carcinoma. Nature 2011, 474, 609. [Google Scholar] [CrossRef]
Figure 1. Flow diagram illustrating the study selection process for gene expression datasets related to HGSOC.
Immuno 05 00023 g001
Figure 2. Functional enrichment and pathway analysis of top DEGs in HGSOC. (a) Volcano plot showing top 100 upregulated DEGs. (b) GO-BP enrichment for biological processes. (c) GO enrichment for CC. (d) KEGG pathway analysis highlighting enriched pathways. (e) GSEA plot for the top 100 upregulated and downregulated DEGs, showing significant pathways involved in tumor progression and immune regulation.
Immuno 05 00023 g002
Figure 3. PPI networks for differentially expressed genes (DEGs) in HGSOC from STRING analysis. (a) PPI network of the top 100 DEGs with high-confidence interactions (0.7). (be) Focused PPI networks for selected upregulated immune-related genes: (b) ICAM1 (intercellular adhesion molecule 1) (c) HLA-DRA (HLA class II histocompatibility antigen, DR alpha chain), (d) PSME2, (proteasome activator complex subunit 2) and (e) TAP2. antigen peptide transporter. The different colors of the connecting lines in the PPI network represent distinct types of associations. Light blue lines indicate interactions from curated databases, and pink lines represent experimentally determined associations. Green, red, and blue edges denote predicted interactions based on gene neighborhood, gene fusions, and gene co-occurrence, respectively. Yellow, black, and lavender lines correspond to associations inferred through text mining, co-expression, and protein homology.
Immuno 05 00023 g003
Figure 4. Venn diagrams showing the overlap between DEGs in HGSOC and OncoKB-annotated oncogenes and tumor suppressor genes. (a) Upregulated DEGs with oncogenes. (b) Downregulated DEGs with tumor suppressor genes.
Immuno 05 00023 g004
Figure 5. Cox univariate and Kaplan-Meier survival analysis of key upregulated DEGs associated with survival in ovarian cancer patients. (a) Forest plot showing hazard ratios for gene transcripts significantly associated with survival risk in the TCGA ovarian cancer cohort. (be) Kaplan-Meier survival curves for individual gene transcripts (SEC24B, TGOLN2, TRAK1, and CAST) stratified by high and low expression levels, demonstrating an association with worse survival at higher expression. (f) Kaplan-Meier survival curve for the risk score model combining the expression of genes from the forest plot, indicating that patients classified as high-risk show significantly poorer survival compared to the low-risk group.
Immuno 05 00023 g005
Figure 6. Comparison of immune cell infiltration scores between high-risk and low-risk ovarian cancer patients, as determined by xCell. Only immune infiltrates with significant differences between groups are depicted. Each dot represents an individual sample, with the median and interquartile range indicated. Red represents high-risk patients, while green represents low-risk patients. The Mann-Whitney U test was used to assess statistical significance, with p-values displayed for each comparison. Immune cell annotations: aDC = activated dendritic cells, CD4+ memory T-cells, CLP = common lymphoid progenitors, DC = dendritic cells, eosinophils = eosinophils, iDC = immature dendritic cells, macrophages = macrophages, macrophages M2 = M2 macrophages, mast cells = mast cells, MEP = megakaryocyte-erythroid progenitors, naive B-cells = naive B-cells, NKT = natural killer T-cells, pro B-cells = pro B-cells and Th1 cells = T helper 1 cells.
Immuno 05 00023 g006
Figure 7. Differential expression of immunotherapy-associated genes in low- and high-risk ovarian cancer groups. Boxplots depict the normalized expression of key immunotherapy-related genes in low-risk (light green) and high-risk (pink) ovarian cancer patients. Each dot represents an individual patient. The horizontal line within each box indicates the median, and the box represents the interquartile range. Statistically significant differences between the two groups were determined by the Mann-Whitney U test, with corresponding p-values displayed above each gene. This analysis reveals a more immune-inflamed (hot) phenotype in the low-risk patient group.
Immuno 05 00023 g007
Figure 8. Single cell gene expression distribution and pathway analysis of genes associated with survival in HGSOC. (a) UMAP plot showing distinct cell clusters identified from single-cell RNA sequencing of HGSOC tumors. The clusters include monocytes/macrophages, ovarian stromal cells, fibroblasts, cancer cells, smooth muscle cells, endothelial cells, T cells, and B cells. (be) UMAP plots illustrating the cellular expression patterns of genes incorporated in the survival model: TGFBR2 (b), CAST (c), PTGIS (d), and TGOLN2 (e). Higher expression levels are represented in shades of blue, with darker intensities indicating higher expression. (f) Bar plot of pathway enrichment analysis for the survival-associated genes, highlighting biological pathways such as collagen biosynthesis and modification enzymes, extracellular matrix organization, and TGF-beta regulation of the extracellular matrix. Pathways are ranked by their significance (Log10 combined score).
Immuno 05 00023 g008
Table 1. Overview of selected studies for gene expression meta-analysis in HGSOC.
Author/YearNCBI GEOCases (n = 291)Controls (n = 96)PlatformPMID
Tone AA, et al., 2008GSE109711324Affymetrix Human Genome U133 Plus 2.018593983 [30]
Yoshihara K, et al., 2009GSE124704310Agilent-012097 Human 1A Microarray (V2)19486012 [31]
Tung CS et al., 2009GSE14001103Affymetrix Human Genome U133 Plus 2.019525924 [32]
Bowen NJ et al., 2009GSE144071212Affymetrix Human Genome U133 Plus 2.020040092 [33]
Mok SC, et al., 2009GSE185205310Affymetrix Human Genome U133 Plus 2.019962670 [34]
Shahab S, et al., 2011GSE2339135Affymetrix U133 Plus 2.0 3’ expression21811625 [35]
Bonome T, et al., 2008GSE2671210710Affymetrix Human Genome U133A18593951 [36]
King ER, et al., 2011GSE27651226Affymetrix Human Genome U133 Plus 2.021451362 [37]
Elgaaen BV, et al., 2012GSE3666884Affymetrix Human Genome U133 Plus23029477 [38]
Yeung TL, et al., 2013GSE40595328Affymetrix human genome U133 Plus 2.023824740 [39]
Wu R et al., 2007GSE6008414Affymetrix HG_U133A array23824740 [40]
Disclaimer/Publisher’s Note: The statements, opinions and data contained in all publications are solely those of the individual author(s) and contributor(s) and not of MDPI and/or the editor(s). MDPI and/or the editor(s) disclaim responsibility for any injury to people or property resulting from any ideas, methods, instructions or products referred to in the content.

