1. Introduction
As the population increases, the phenomenon of urbanization becomes more and more evident. The heat emission, the reduction in vegetation coverage, the growth of the impervious layer area, and other phenomena accompanying urban expansion will lead to the so-called urban heat island effect, which affects the urban climate [
1,
2]. Many researches have conducted relevant discussions on the topic of urban heat islands. In addition, global environmental changes have also received attention in recent years, and extreme weather events have emerged one after another.
According to previous studies and global warming, the phenomenon of global urbanization is also becoming more serious. The urban environment cannot ignore the urban heat island effect and air pollution caused by dense populations. To better simulate the atmospheric conditions in urban areas to improve urban heat islands, air quality deterioration, and other related urban issues, many studies have used weather research and forecasts (WRF) coupled with the urban canopy model (UCM) for associated discussions [
3,
4].
The UCM model focuses on the original land use. The urban areas are subdivided into three categories: low-density residential areas, high-density residential areas, and industrial and commercial areas. The classification process makes the meteorological field simulation closer to observational data in urban areas [
5,
6].
This research target is mainly in middle Taiwan; the simulation of the UHI is carried out in Taichung City. Because the original UCM model only provides three types of urban types and simplifies the diversity of today’s buildings, this study includes the local climate zone (LCZ) based land use classification, based on the height and compactness of buildings, provides ten types of land use in urban areas, and attempts to construct the corresponding urban parameters under the LCZ to simulate urban canopy patterns.
Improve the simulation of meteorological fields in urban areas by providing a more satisfactory urban type. The simulation results are compared with the measurement data from the observation stations to test the products of the urban canopy model on simulating the UHI, and try to develop a set of methods that are more suitable for the classification of urban land use in Taiwan, and improve the inexhaustible parts of the original land use classification, to apply it to Taiwan. Other cities in the region discussed related issues such as the heat island effect.
2. Method
2.1. Study Area
The base selected for this study is located in the metropolitan area of Taichung City. It is surrounded by mountains and cut by many rivers (
Figure 1). The diversified land use and cover types make the city’s cooling and ventilation have the specific potential for change in the climate and environment. Taichung City is located in a subtropical climate zone, with high temperatures and more than 200 days in summer. The annual average temperature is 22.5 °C, with the highest in July, reaching 28.0 °C.
2.2. Urban Pattern Distribution
2.2.1. Building Information
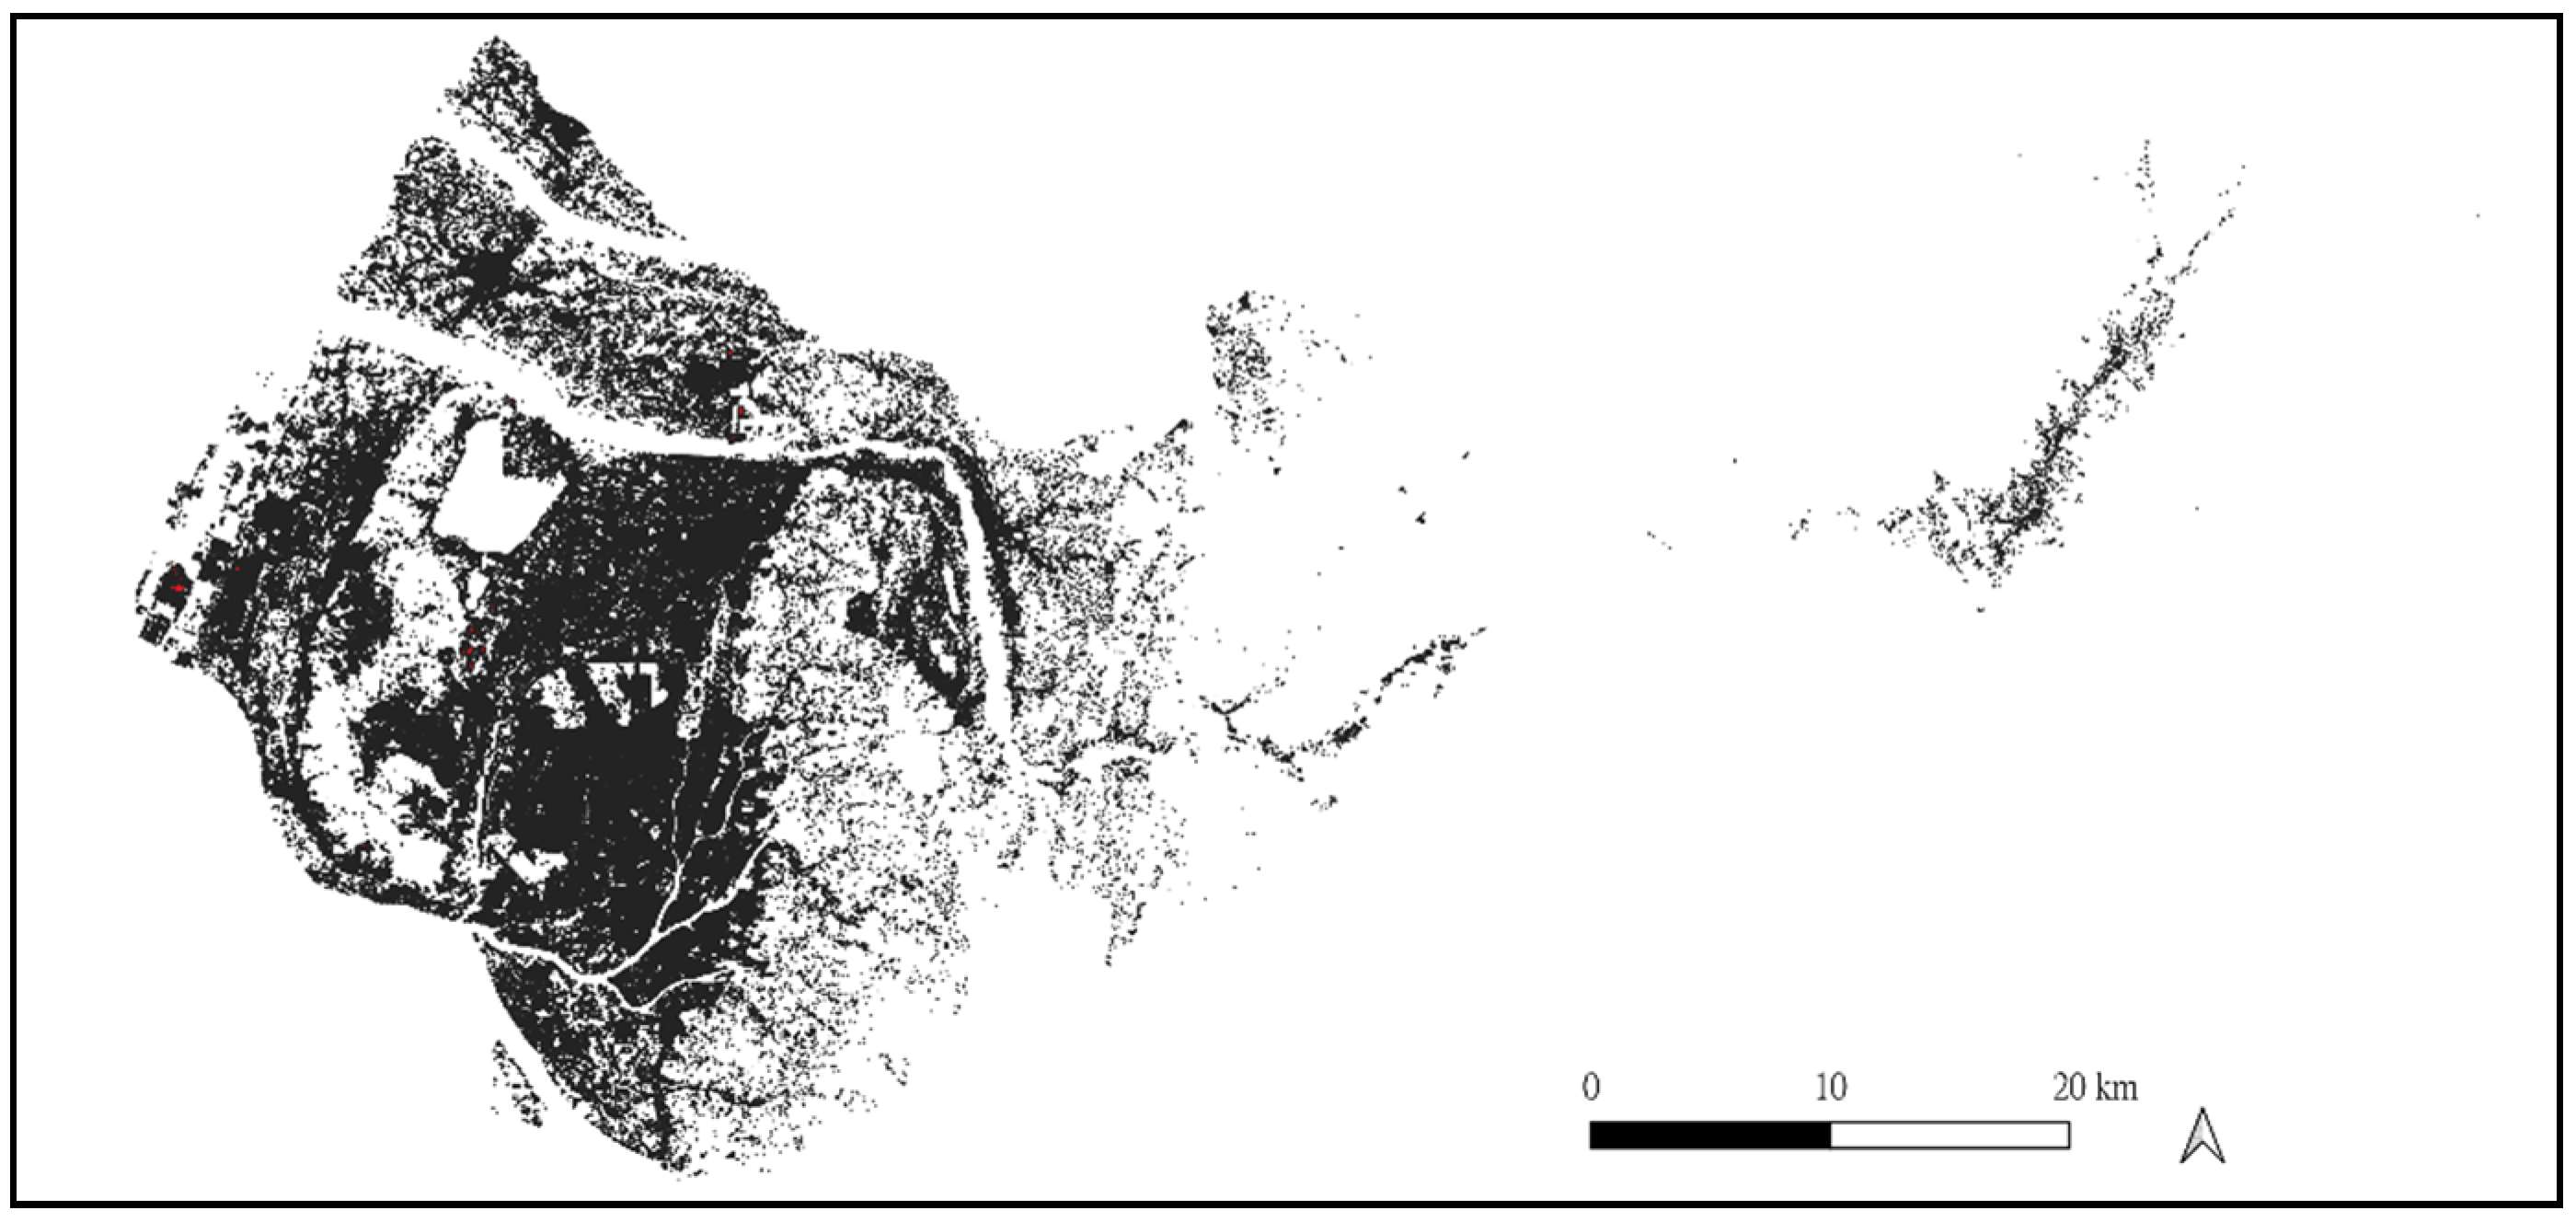
Multiple urban development factors were used in the research process. Among them, the building floor area information is an important urban vector, which includes the building area and floor height and the total floor area information for subsequent calculations of energy and comfort (
Figure 2).
Through this layer, you can quickly calculate the urban development characteristics in different terrain areas. The density and location of buildings in the center of Taichung City far exceed that of the suburban areas on the east and west sides. From the total floor area map, compared with the less densely built areas on the east and west sides, you can see the downtown area because of the number of building floors, Which then lead to a more prominent area distribution of buildings.
2.2.2. Green Information
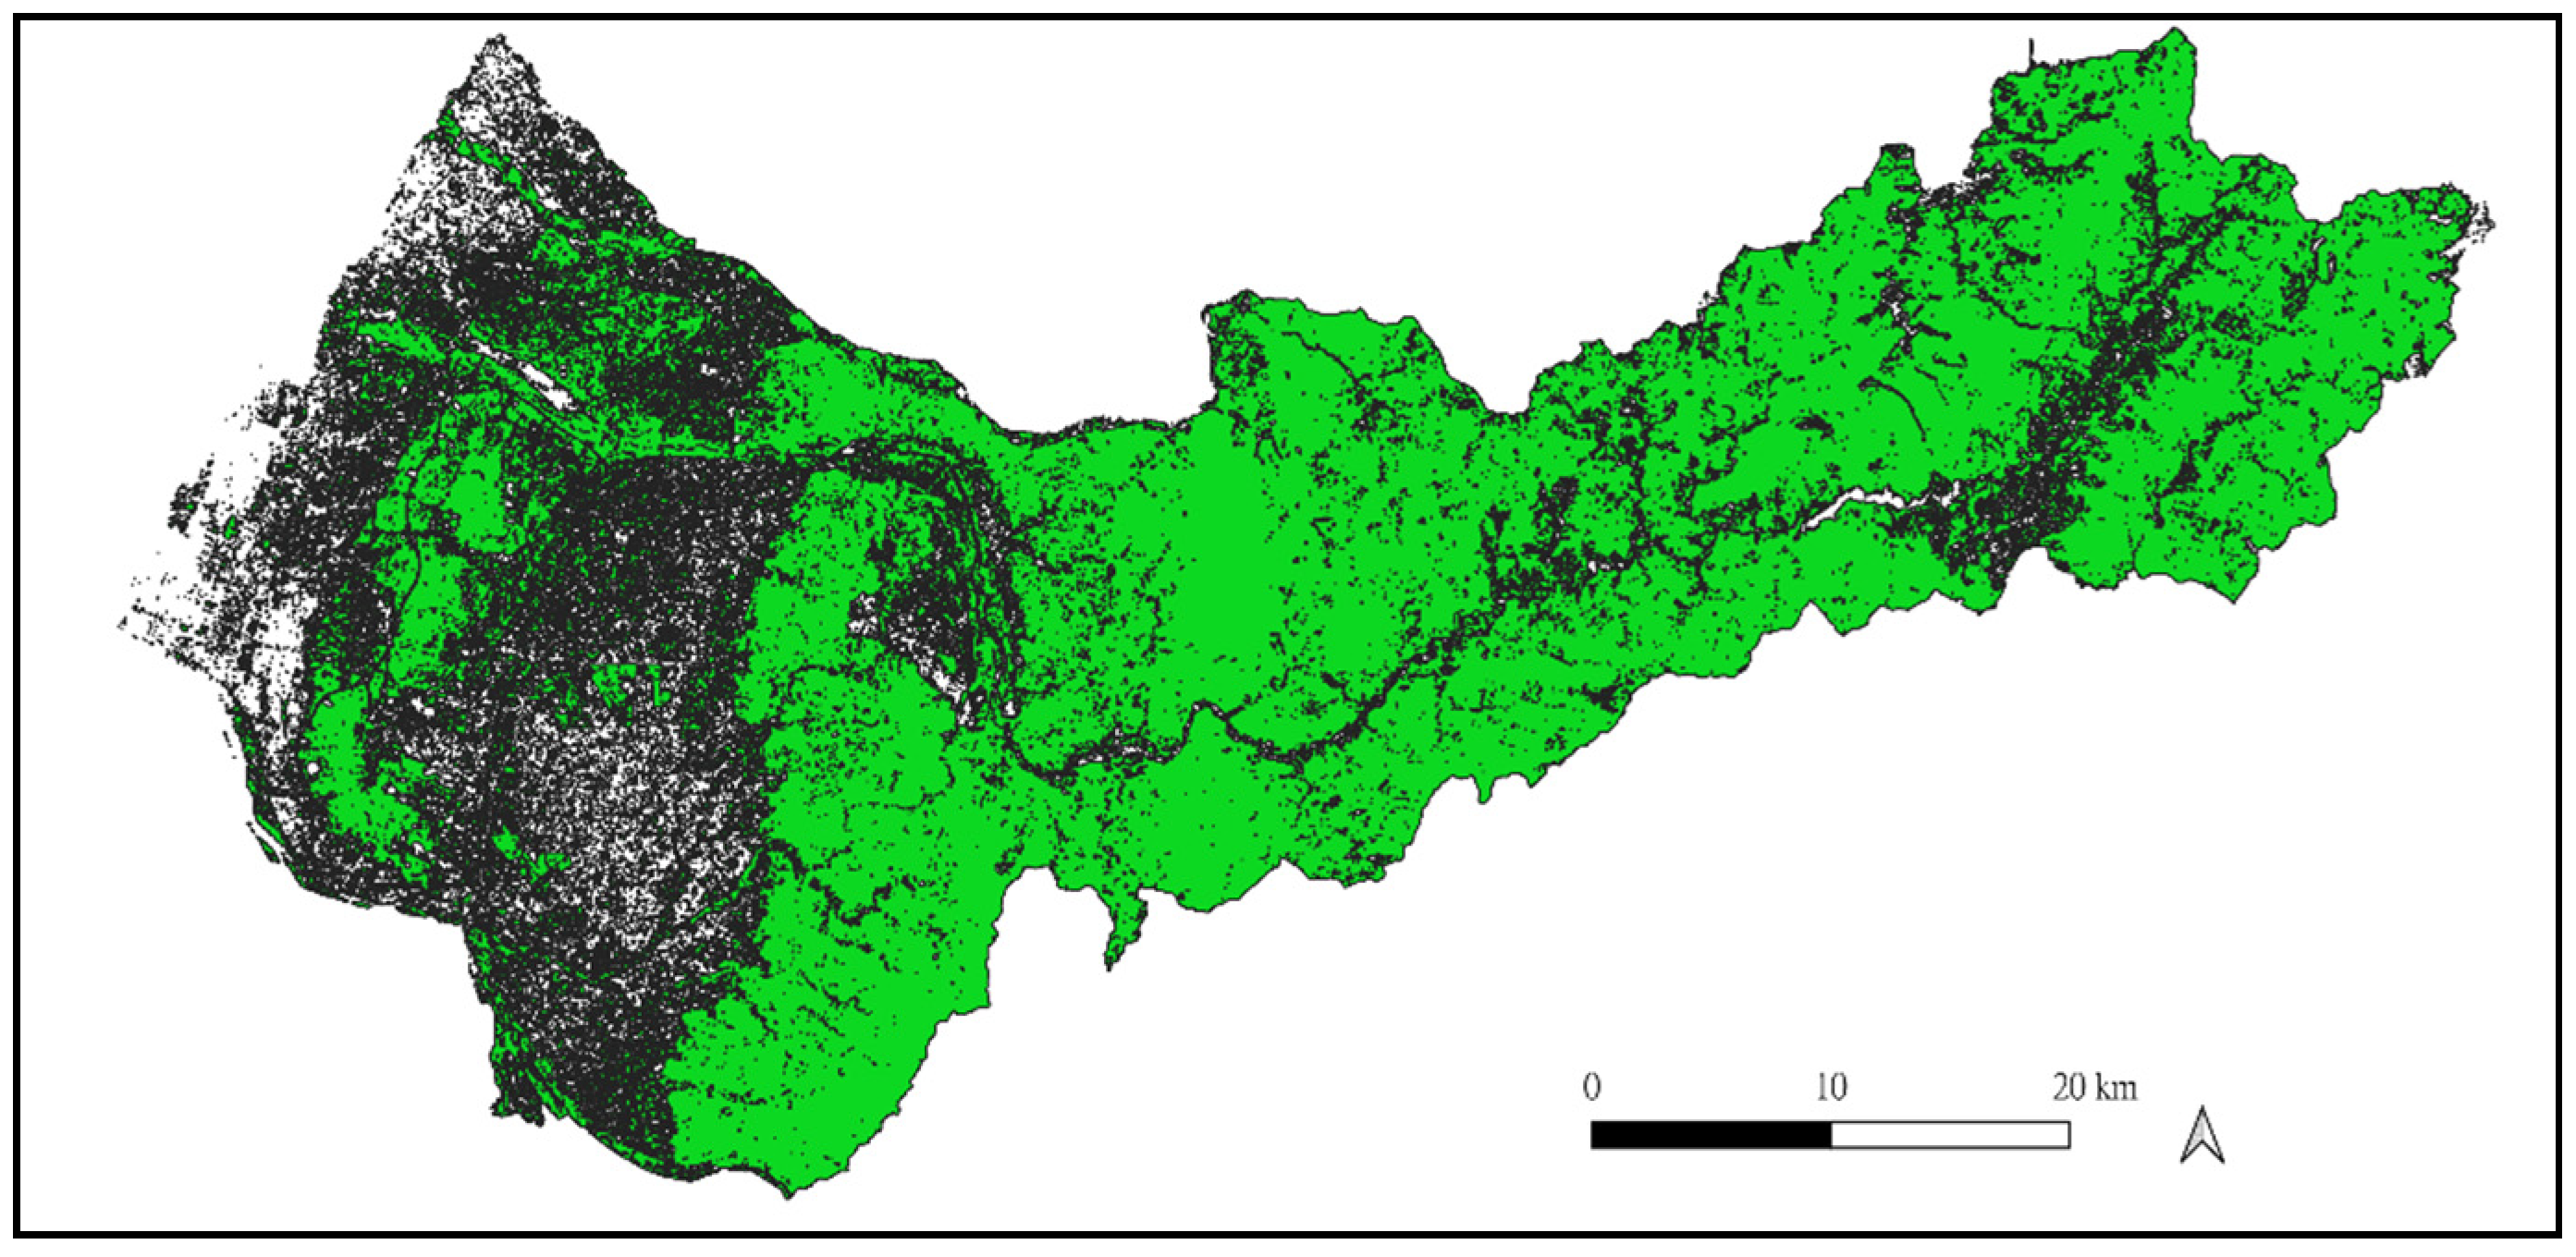
This research used the normalized difference vegetation index (NDVI) to analyze the green cover. The NDVI usually uses telemetry data, including satellite images and aerial cameras, and is equipped with instruments to shoot red light and near-infrared light.
The purpose of normalization is to prevent the numerical error of division by zero and to limit the ratio to between −1 and +1 for easy comparison; the index is more when it is large, which means more vegetation, and when the index is less than zero it indicates non-vegetable waters, roads, buildings, and the soil of open land. Past studies in Taiwan have shown that 0.2–0.5 indicates grass and shrubs, and more than 0.5 is mostly trees [
7]. When calculating the green cover rate, if the overall scope of Taichung City is considered, there is a relatively high degree of green cover rate, about 66% (
Figure 3).
2.3. Local Climate Zone
2.3.1. Classification Scheme
Because countries have different descriptions and definitions of various artificial and natural environments on the surface, establishing a set of urban platforms that can adapt to multiple users must go through systematic and standardized climate and environmental factor criteria. LCZ was originally proposed by Stewart and Oke.
The climate zoning system and a series of quantification and verification of relevant data information include sky visibility, building height, street aspect ratio, building projection area, impervious pavement area ratio, average building height, surface roughness, etc. The surface environment factors are used to summarize the LCZ system [
8] that has most of the characteristics of the urban built-up environment in a broad sense. The classification and naming form is LCZx, X is marked by numbers 1 to 10 in built-up areas, and X is A to G in non-built-up areas.
2.3.2. Classification Process
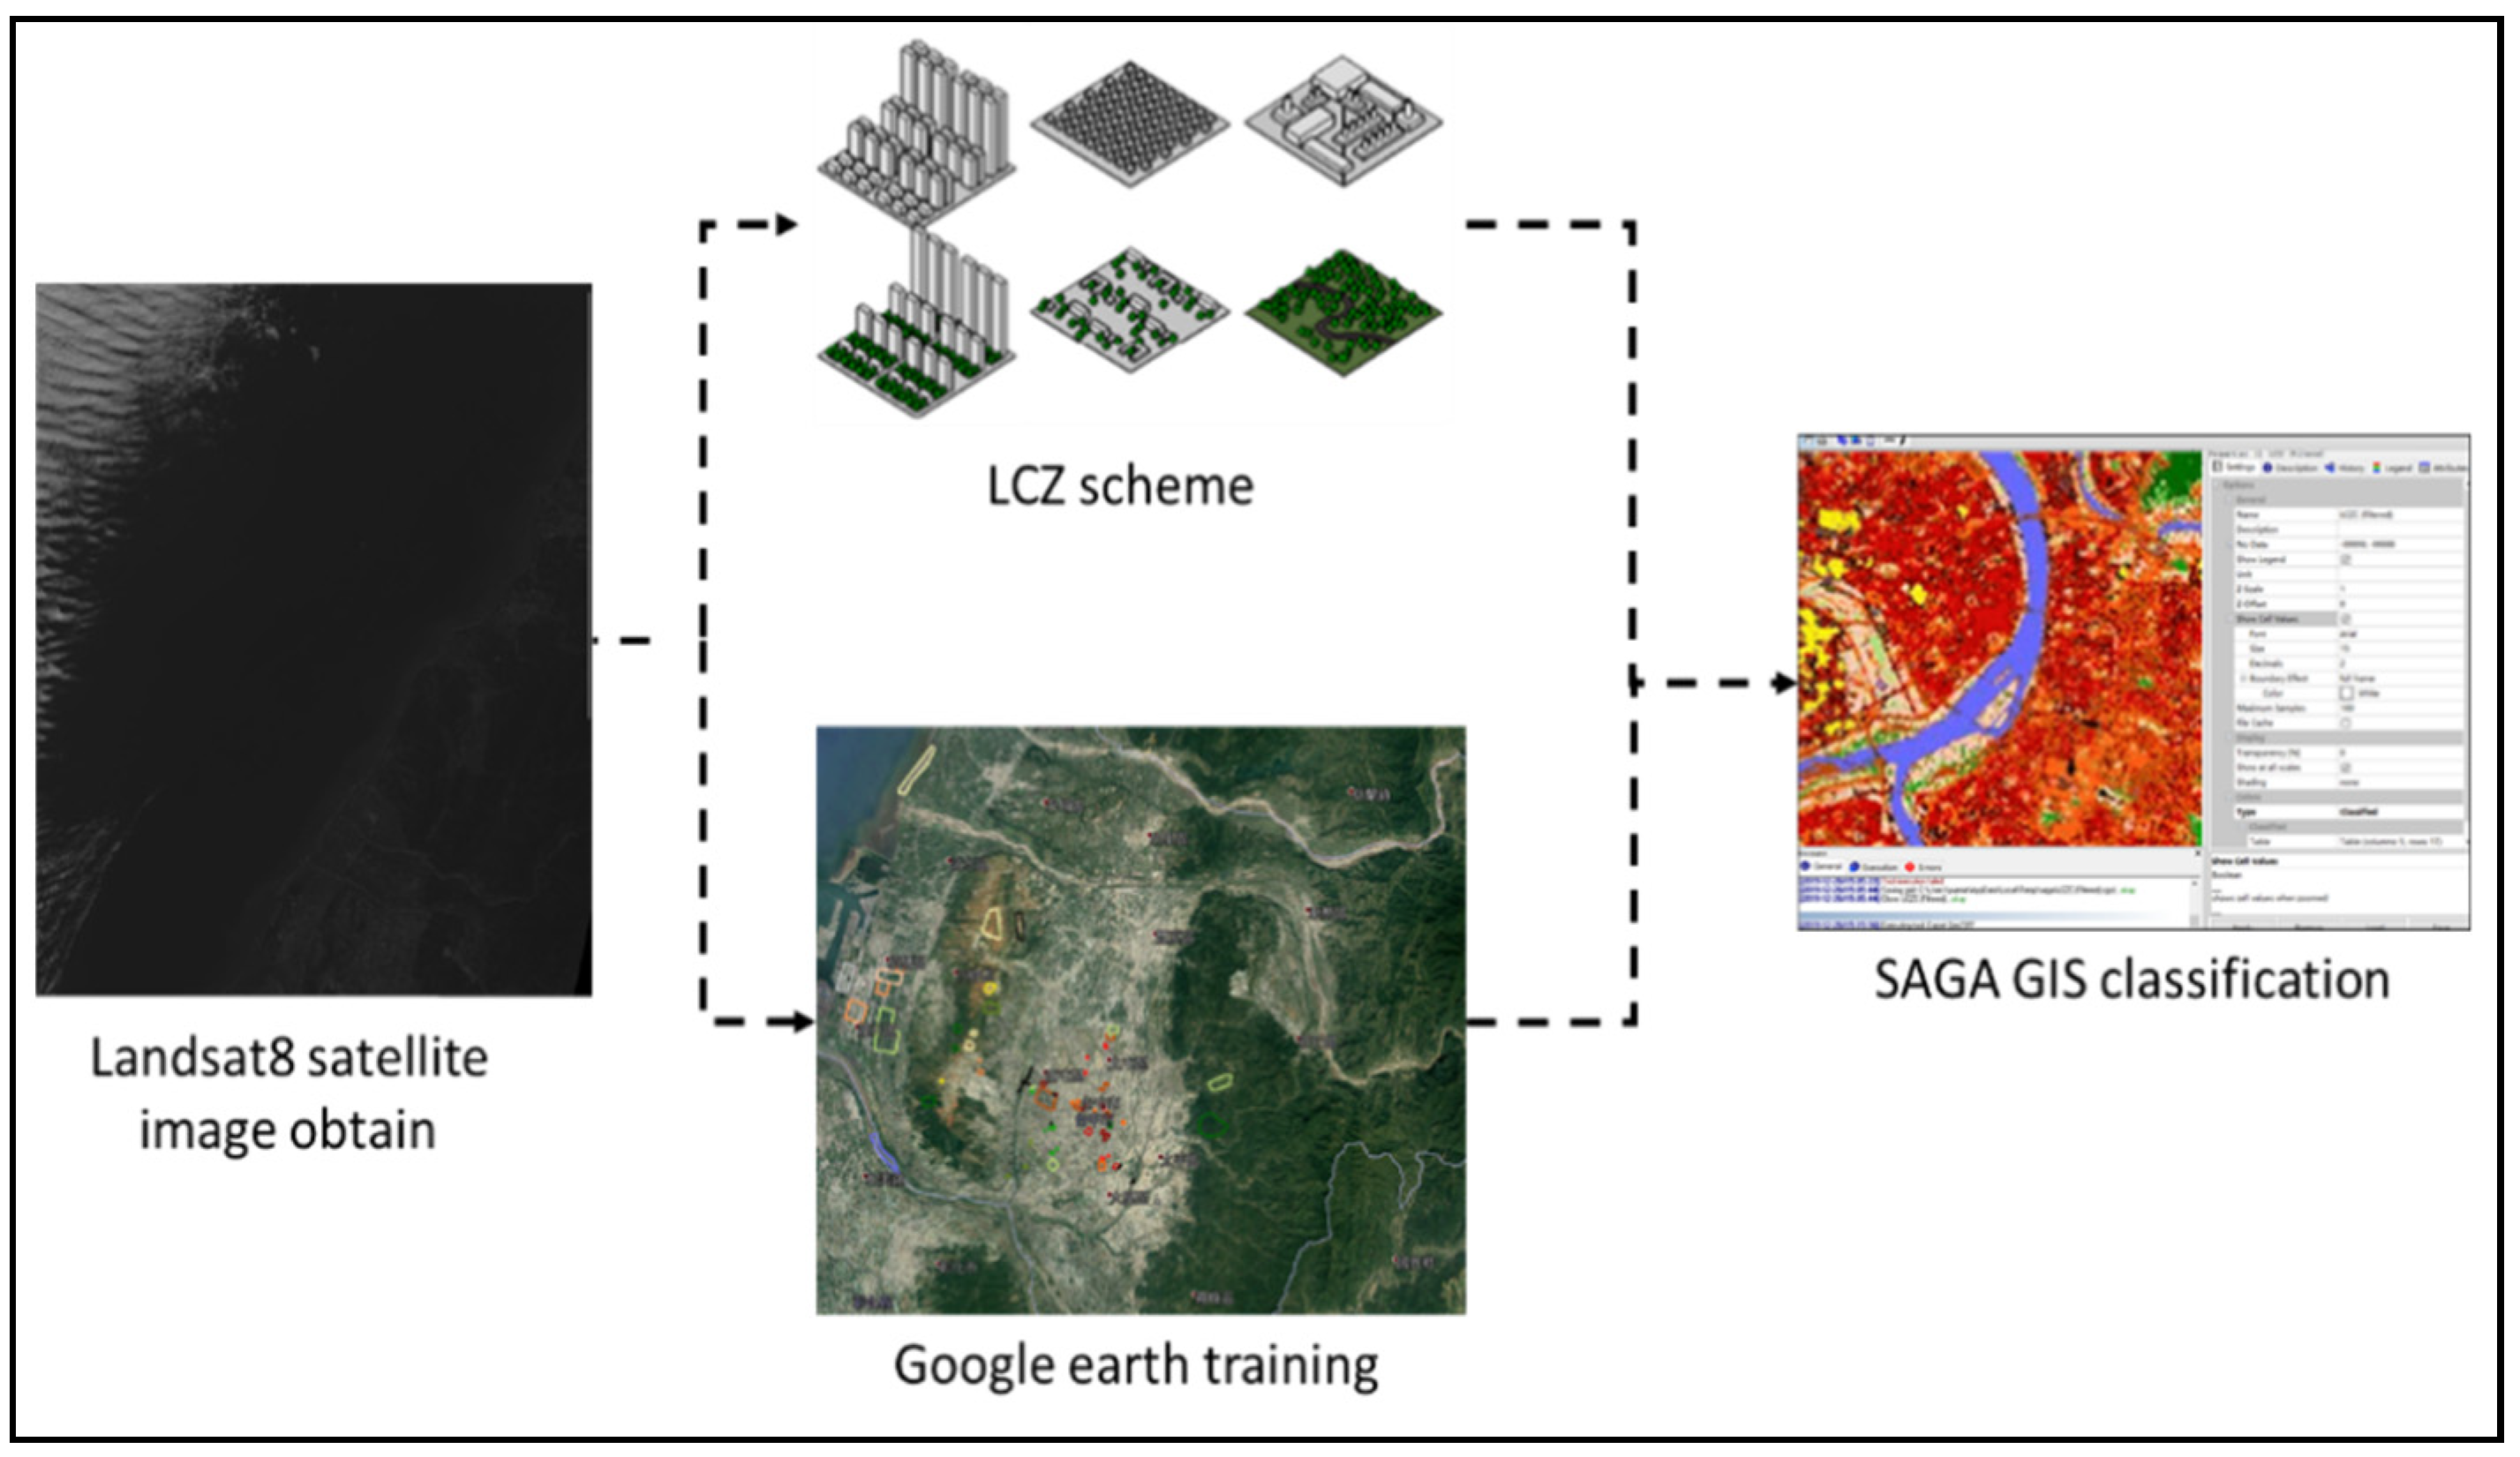
The satellite has a resolution of 30 m and carries 11 spectral bands, and passes through the same area every 16 days. The calculation result is to exclude the error value caused by the cloud and fog conditions, and use the quality band to confirm the full range of data. The classification procedure of the LCZ system is constituted by WUDAPT.
The entire system uses telemetry images as the basic reference layer, and then uses Google Earth Pro to manually select the demonstration area and provide classification software to identify surface features. According to the final classification process, the SagaGIS (2.2.0) software is used for supervised classification. The images taken by the Landsat8 satellite in this study are used as the basic layer for classification.
When classifying, you can set the classification resolution by referring to the size of the research area and the classification accuracy evaluation. In this study, Google Maps was used for repeated comparison, and the 200 m × 200 m grid size was used as the classification resolution of Taichung City LCZ in this study (
Figure 4).
2.4. Weather Research and Forecasts
2.4.1. Urban Canopy Model
In simulating the phenomenon of urban heat islands, accurate urban development values and patterns, including surface coverage, height, etc., are the key for the accuracy of the estimation. With the development of the city. Urbanization has led to many land use and land cover changes, and it will also have a significant impact on the local climate [
9].
Natural surfaces are replaced by impervious artificial materials and structures in cities, such as roads and buildings. The increase in artificial materials will change the thermodynamic properties of the surface, such as emissivity, albedo, and energy balance, reduce evaporation from vegetation and soil, and increase surface roughness to reduce urban wind speed. In the past, WRF mostly used the land use data of the United States Geological Survey and the three levels, firm, medium, and weak for simulation analysis.
Therefore, this study used LCZ’s urban development numerical information combined with WRF’s mesoscale climate prediction function and used urban types and their corresponding urban development values to simulate the urban canopy, and used the urban canopy model (UCM) and Taichung City. The urban development parameters of the core area are used to analyze the simulation results of the Taichung area.
2.4.2. Urban Canopy Parameter by LCZ
UCM includes two models: single-layer urban canopy model (SLUCM) and multi-layer urban canopy (BEP). This study used the BEP for more accurate urban climate simulation and heat island strength evaluation because it also considers the influence of vertical planes.
Factors such as building volume facades and horizontal planes such as streets and roofs, including building height, road width, roof heat capacity, building wall heat capacity, ground heat capacity, roof thermal conductivity, building wall thermal conductivity, ground thermal conductivity, roof surface albedo, building wall albedo, roof surface divergence, building wall divergence, etc., (
Table 1). And the LCZ Information can also be imported and used [
10,
11].
This study also verified the urban climate results simulated by WRF with the climate measurement network of Taichung City to confirm the accuracy of the LCZ applied to subsequent urban climate simulations. In addition, it was also conducted with traditional urban development factors, which compared the results of the wind and heat environment forecast to understand and analyze the difference between it and the actual situation.
2.5. Meteorological Observation Network
The measuring instrument used in the Taichung microclimate measurement network used in this project is an external temperature and humidity measuring instrument from the Unabiz sensor.
The measurement network, through Sigfox technology, can instantly transmit data collected by temperature and humidity instruments at various points to the online cloud for a long time, saving power and serving as an essential reference for long-term stable map data application (
Figure 5).
The stability of the system and the reliability of transmission have become more mature. The location and method of erection were divided into grids at equal intervals within the research area. There are 25 erection locations. The erection locations are mainly roads with index properties. To ensure the safety of pedestrians and vehicles during installation and maintenance; the equipment was installed at the height of 2.5 m above the ground, and in consideration of sunlight and waterproofing, a shield and waterproof cover was used together to reduce the heat storage and water ingress of the shield [
12].
Measurement errors and the components and erection methods used in the erection were sent to structural technicians for testing in the past, and it has been confirmed that this structure will not cause traffic and pedestrian dangers due to accidental factors such as strong winds and earthquakes.
3. Results
3.1. LCZ Distribution
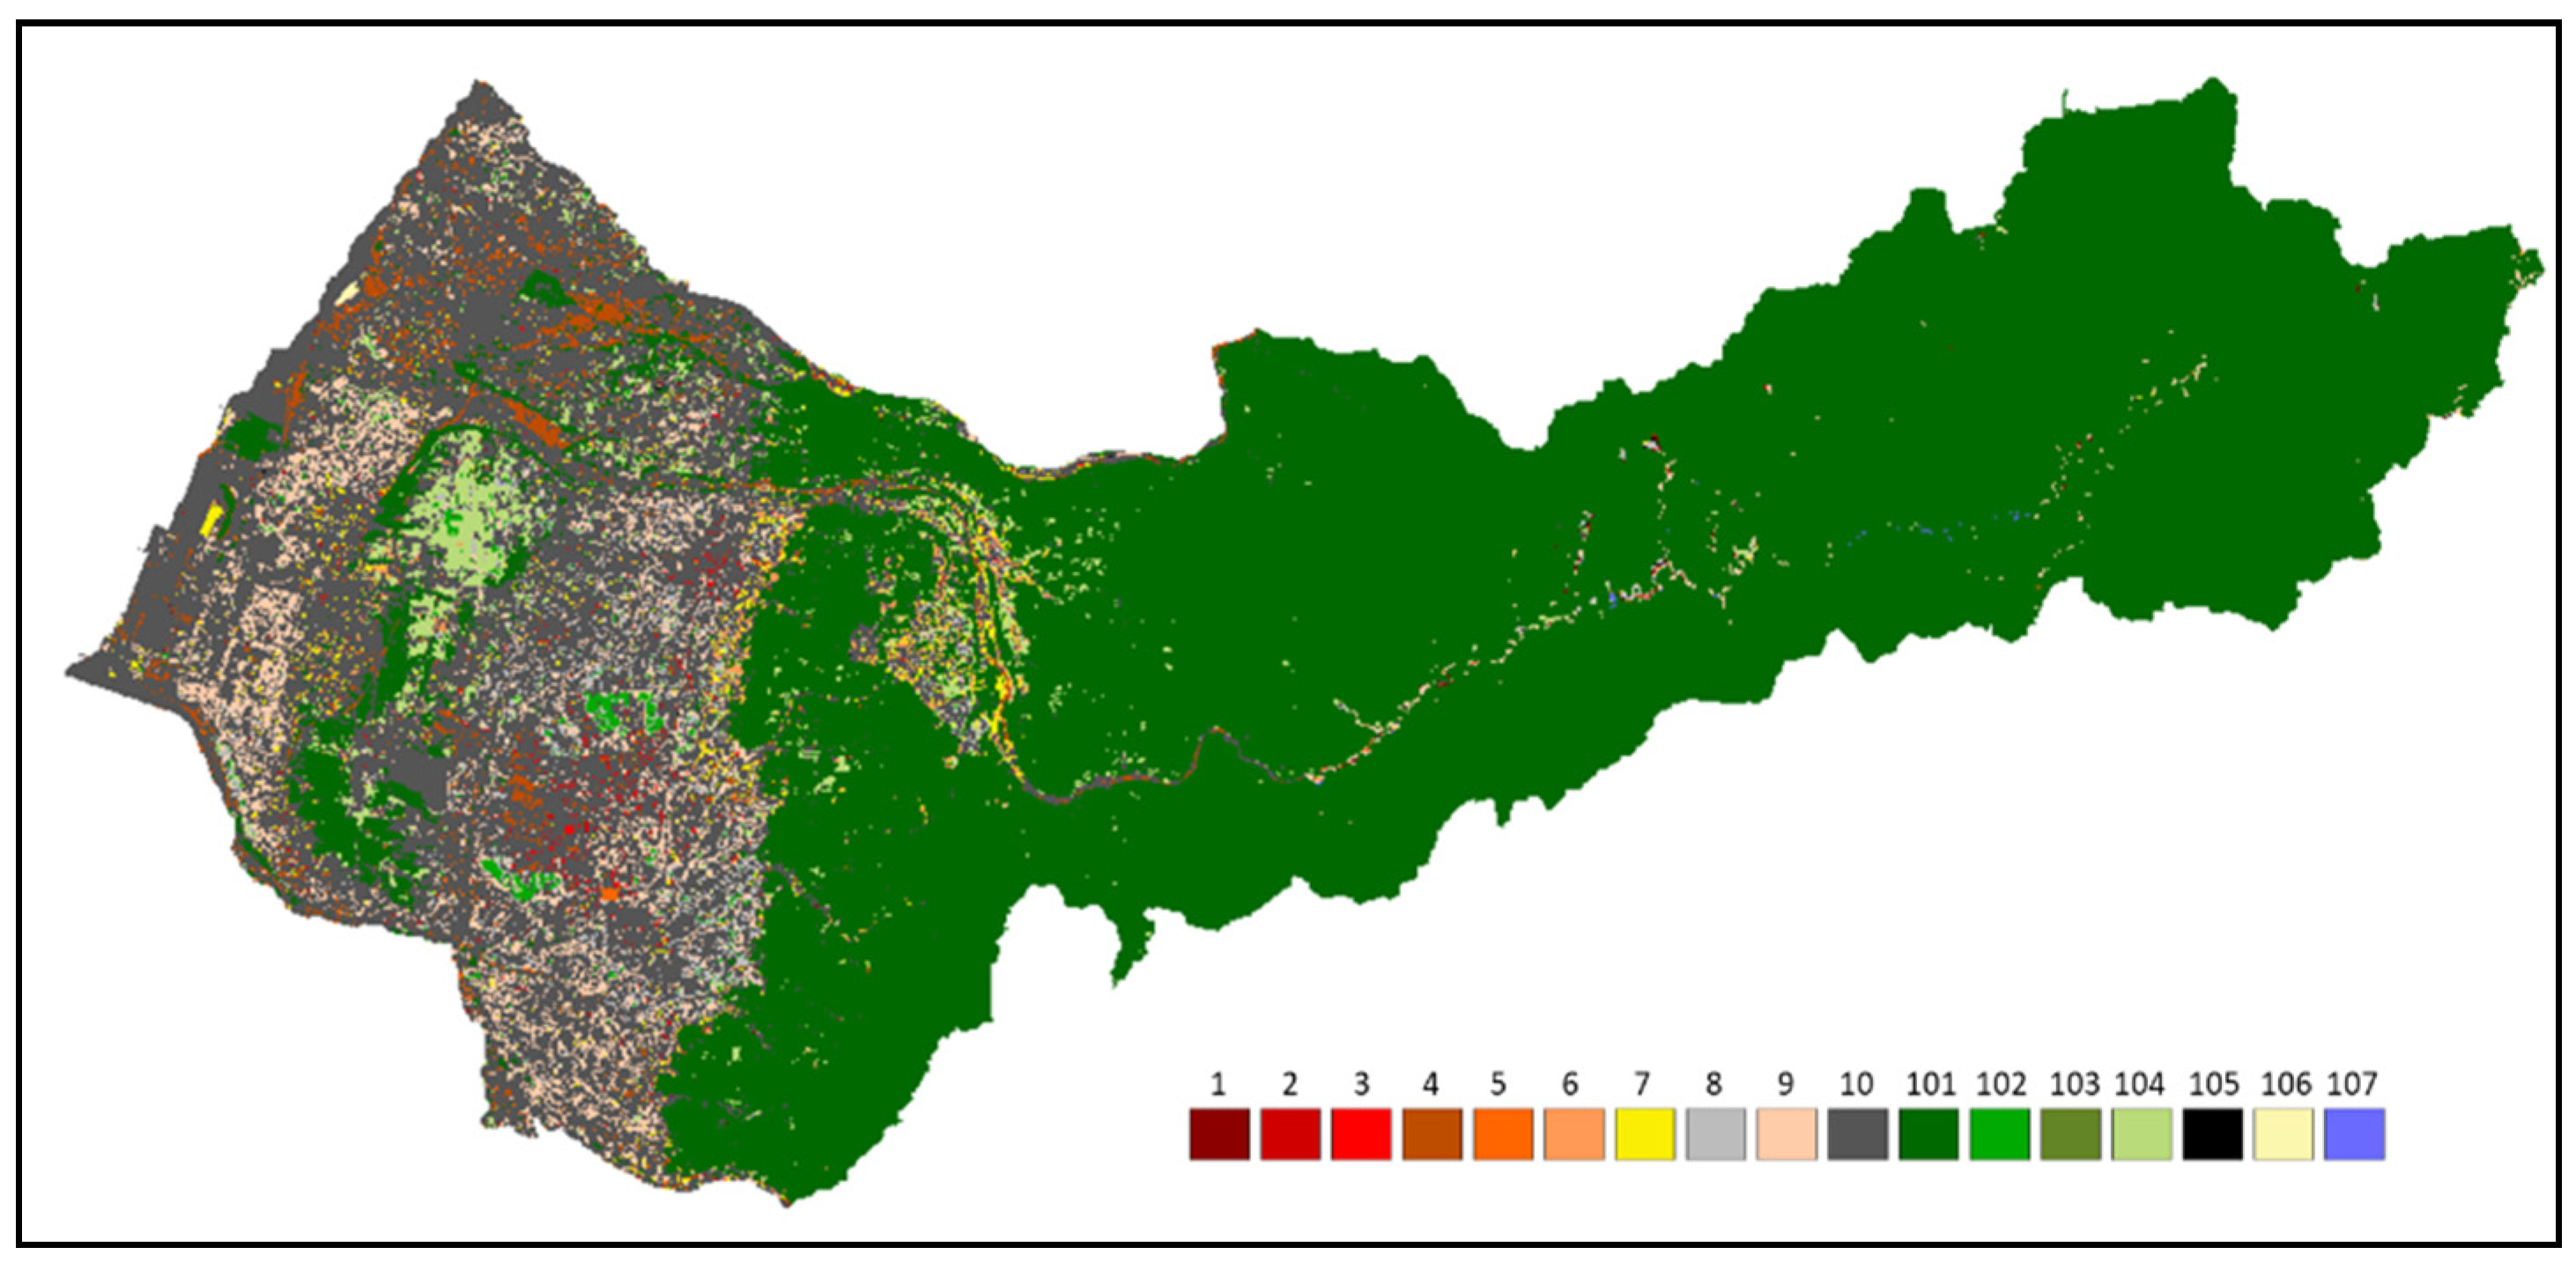
The layout of the LCZ in Taichung presents Taichung’s high-density development characteristics of the city center. The built environment in Taichung City is mainly based on LCZ2, 4, 9 and 10. This indicates that Taichung’s urban development is primarily in the form of medium and high floors.
While the eastern side is a surrounded by a mountainous area and a nature reserve, the landscape of LCZ101 is primarily forest, and the west, coastal side is industrial area, which presents another type, mostly densely distributed in LCZ9 and 10 (
Figure 6).
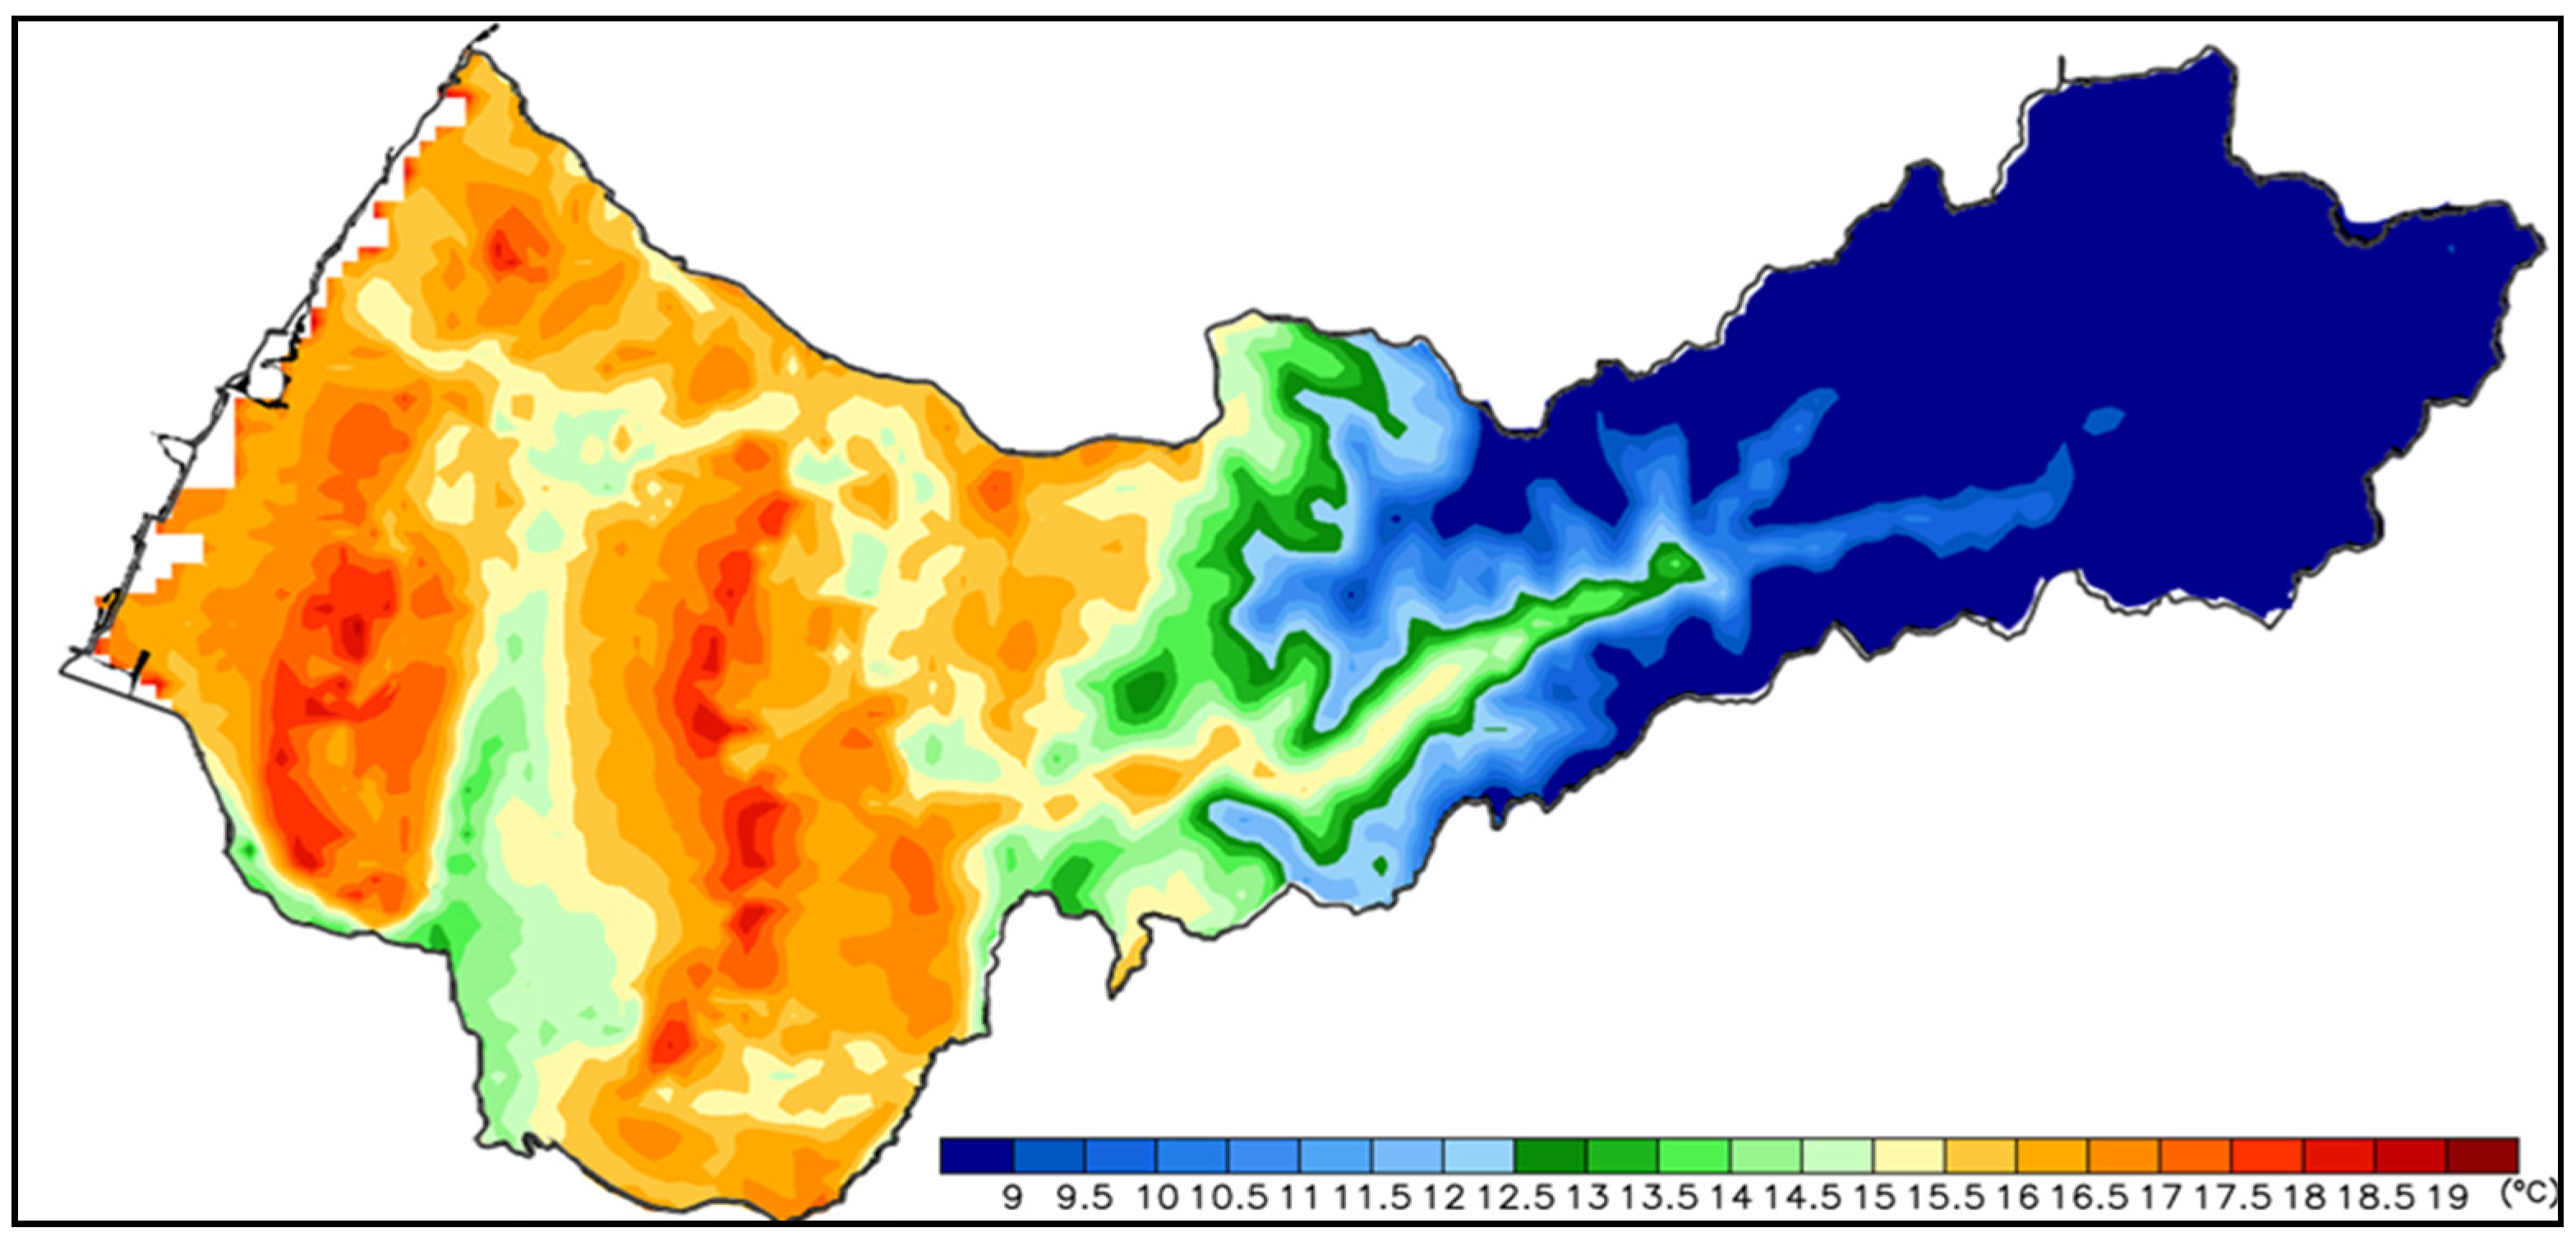
3.2. WRF Modeling Temperature Result
Using WRF combined with LCZ to simulate the average surface temperature of 2 m in December 2020, it was found that urban hot spots are mostly concentrated in the denser areas of LCZ1-3.
In addition, industrial areas such as LCZ9 and 10 also produce higher temperatures, about 18 °C–19 °C due to higher heat dissipation and building materials. The phenomenon of low temperature in natural areas, including mountainous and hilly regions, can be observed (
Figure 7).
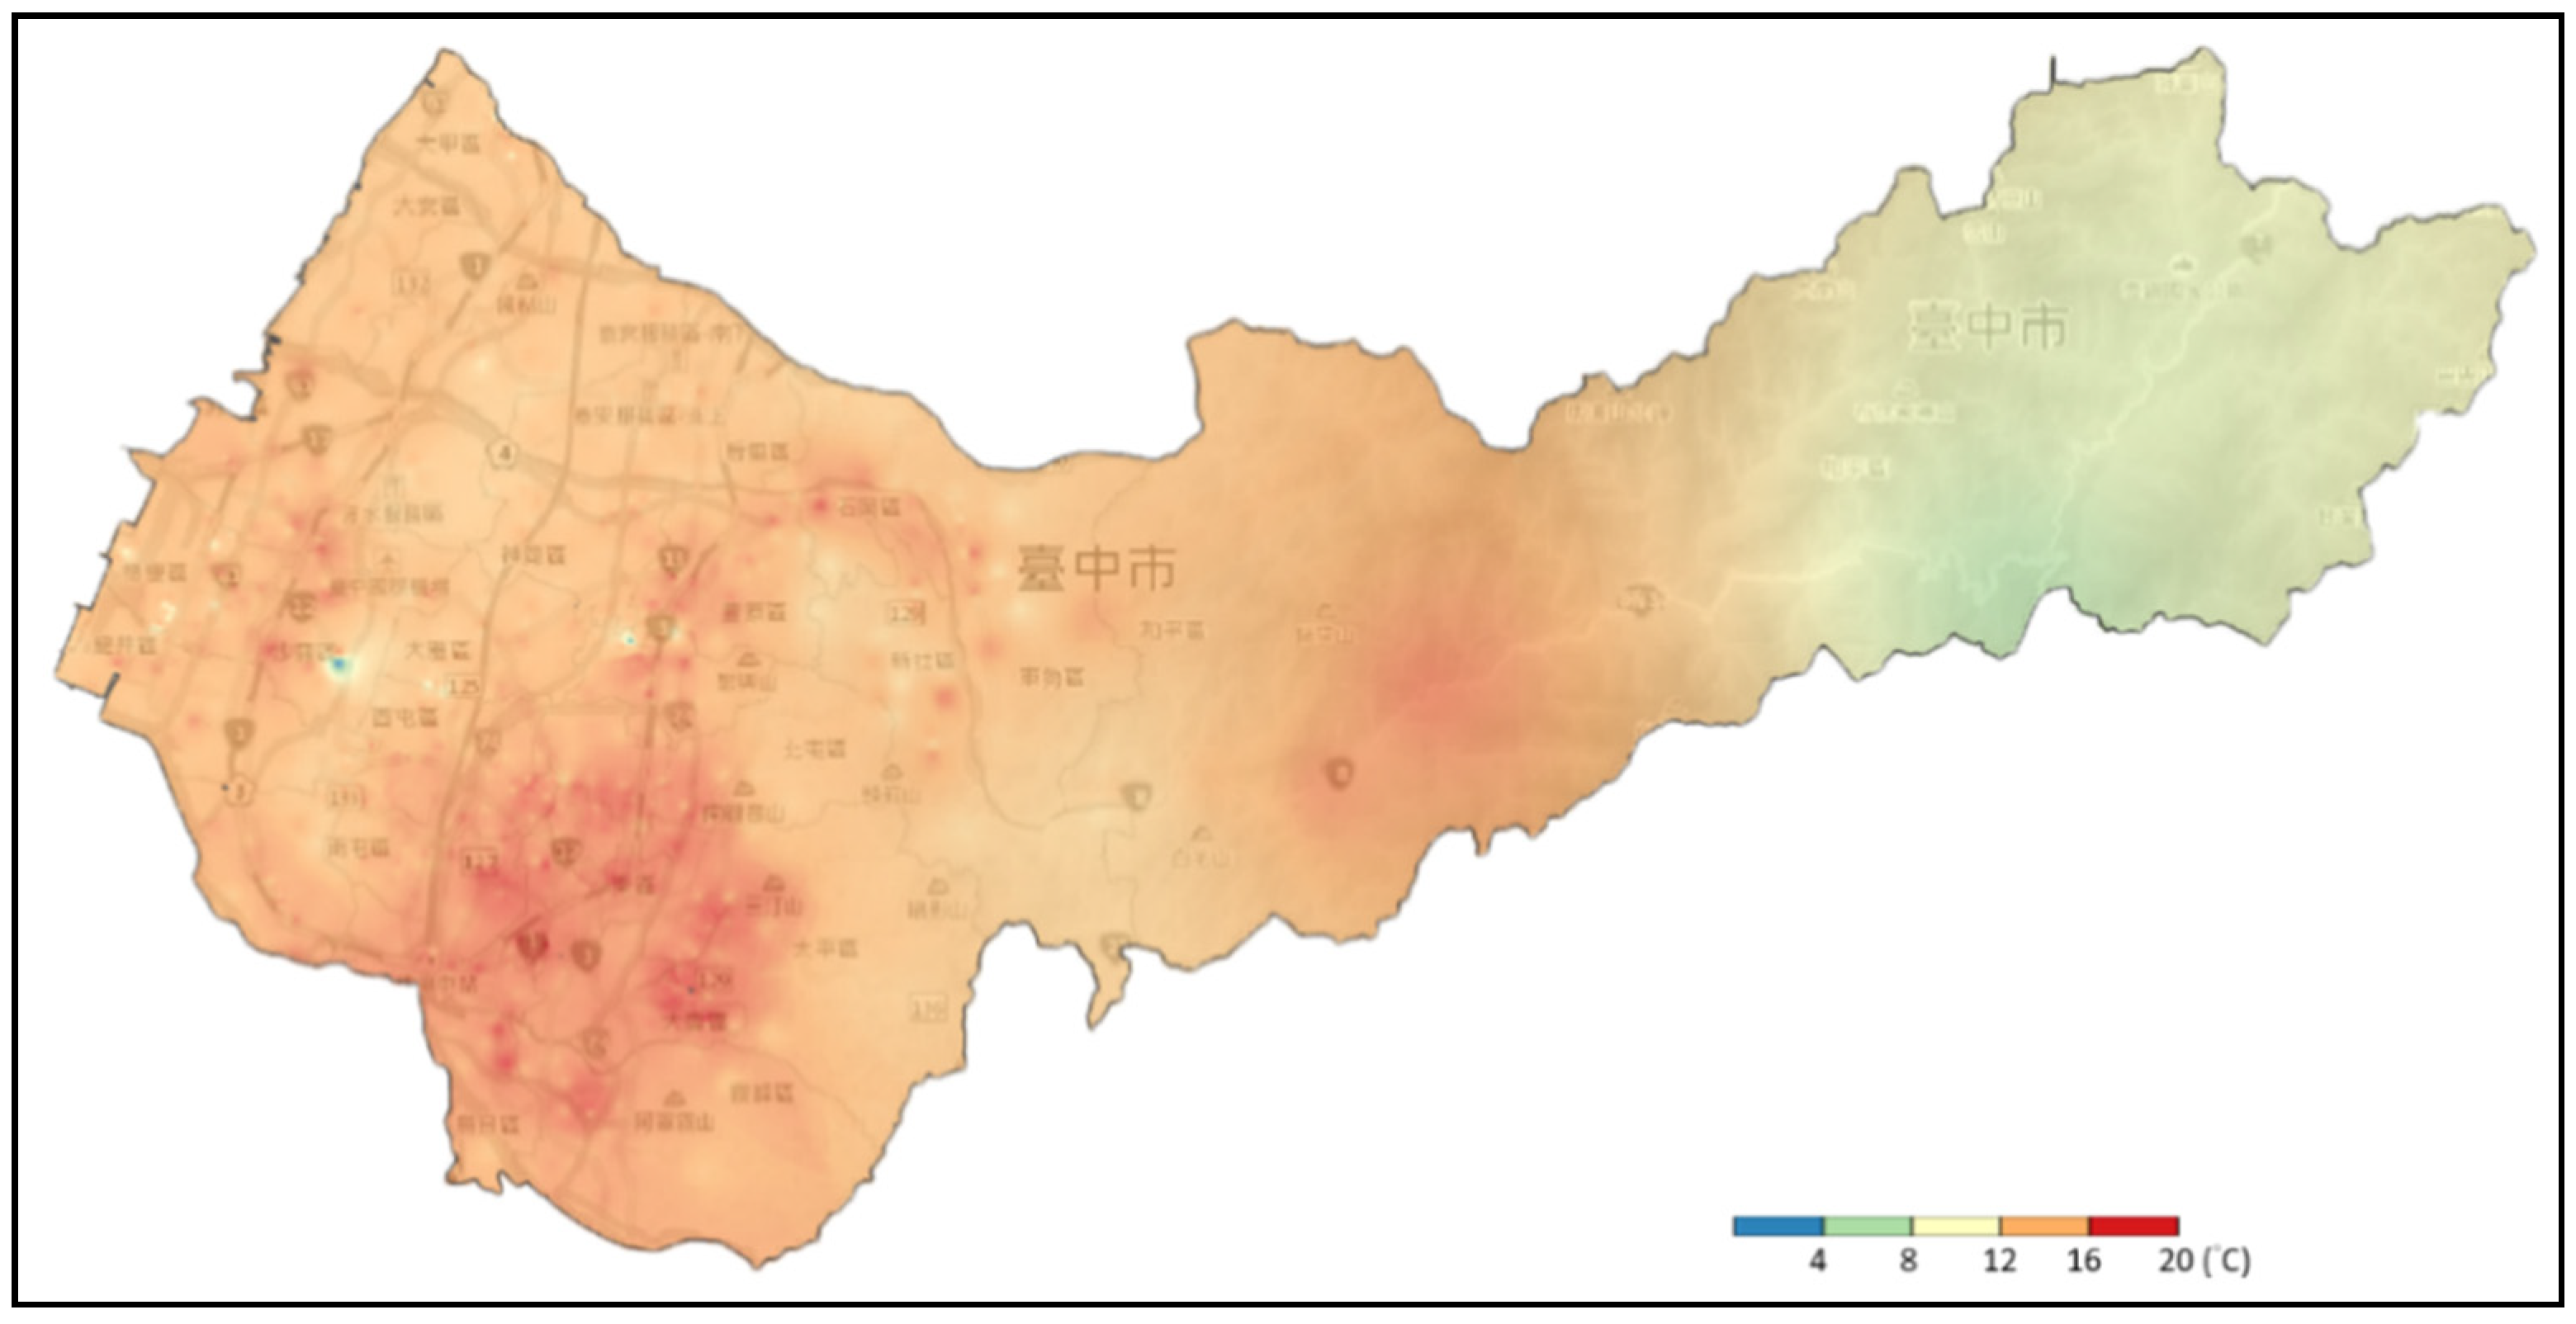
3.3. Measurement Temperature Result
The actual temperature measurement results show that the daily average temperature conditions in December 2020 are similar to the estimated conditions using the combination of WRF and LCZ.
High-temperature hot spots are mostly located in high-density residential areas in the city center. In industrial areas on the west side and the commercial regions with intensive activities, the high temperature can reach 20 °C, which is about 1 °C higher than the predicted result. Similarly, in the mountainous area, the temperature is about 8 °C, which is about 1 °C lower than the expected result (
Figure 8).
4. Conclusions
LCZ divides urban land use into ten types, and non-land use into seven types. In response to the increasing degree of urbanization and diverse land use, compared with the three simple types of urban morphology in the model, including low-density residential areas, high-density residential areas, and industrial and commercial areas, more types of urban morphology classifications are more in line with today’s social land use, the actual situation can provide more diverse urban forms. It is helpful to simulate the weather field for manufacturing urban-related issues such as the UHI phenomenon.
The three types of urban land use in the original WRF model are increased to ten categories, a new land use index is generated, and the urban parameter values correspond to each type included in the Urban canopy parameter. The settings in the urban scheme are modified to perform urban model simulation.
Future studies will attempt to incorporate the LCZ-based land use classification, provide ten types of urban land use categories, and construct the corresponding urban parameters under the LCZ classification to simulate the urban canopy model. Then provide a more refined urban classification simulation of the regional meteorological field and test the results of the urban canopy model simulation of UHI. Further, future studies will attempt to develop a set of more suitable urban land use classification methods in Taiwan, improve the incomplete part of the original land use classification, and apply it to other cities in Taiwan with related issues such as the UHI, energy consumption, and air pollution
Author Contributions
Conceptualization, Y.-C.C. and T.-P.L.; Methodology, Y.-C.C. and F.-Y.C.; Formal analysis, C.-P.Y.; Investigation, Y.-C.C. and F.-Y.C.; Writing, Y.-C.C. All authors have read and agreed to the published version of the manuscript.
Funding
This research was funded by the Ministry of Science and Technology, project number 109-“2222-E-011-009-MY2”.
Conflicts of Interest
The authors declare that we have no financial and personal relationships with other people or organizations that can inappropriately influence our work, there is no professional or other personal interest of any nature or kind in any product, service and/or company that can be construed as influencing the position presented in, or the review of, the manuscript entitled.
References
- Chen, Y.C.; Liao, Y.J.; Yao, C.K.; Honjo, T.; Wang, C.K.; Lin, T.P. The application of a high-density street-level air temperature observation network (HiSAN): The relationship between air temperature, urban development, and geographic features. Sci. Total Environ. 2019, 685, 710–722. [Google Scholar] [CrossRef]
- Lin, T.; Chen, Y.; Matzarakis, A. Urban thermal stress climatic mapping: Combination of long-term climate data and thermal stress risk evaluation. Sustain. Cities Soc. 2017, 34, 12–21. [Google Scholar] [CrossRef]
- Brousse, O.; Martilli, A.; Foley, M.; Mills, G.; Bechtel, B. WUDAPT, an efficient land use producing data tool for mesoscale models? Integration of urban LCZ in WRF over Madrid. Urban Clim. 2016, 17, 116–134. [Google Scholar] [CrossRef]
- Martilli, A.; Clappier, A.; Rotach, M.W. An urban surface exchange parameterization for mesoscale models. Bound.-Layer Meteorol. 2002, 104, 261–304. [Google Scholar] [CrossRef]
- Lin, C.Y.; Su, C.J.; Kusaka, H.; Akimoto, Y.; Sheng, Y.F.; Huang, C.; Hsu, H.H. Impact of an improved WRF urban canopy model on diurnal air temperature simulation over northern Taiwan. Atmos. Chem. Phys. 2016, 16, 1809–1822. [Google Scholar] [CrossRef] [Green Version]
- Chen, F.; Kusaka, H.; Bornstein, R.; Ching, J.; Grimmond, C.S.B.; Grossman-Clarke, S.; Loridan, T.; Manning, K.W.; Martilli, A.; Miao, S.; et al. The integrated WRF/urban modelling system: Development, evaluation, and applications to urban environmental problems. Int. J. Climatol. 2011, 31, 273–288. [Google Scholar] [CrossRef]
- Liu, C.W. NDVI-Taiwan. 2020. Available online: https://patchbyplanting.carto.com/tables/ndvi_more_than_0p5/public (accessed on 1 June 2021).
- Stewart, I.D.; Oke, T.R. Local Climate Zones for Urban Temperature Studies. Bull. Am. Meteorol. Soc. 2012, 93, 1879–1900. [Google Scholar] [CrossRef]
- Salamanca, F.; Martilli, A.; Tewari, M.; Chen, F. A study of the urban boundary layer using different urban parameterizations and high-resolution urban canopy parameters with WRF. Bull. Am. Meteorol. Soc. 2011, 50, 1107–1112. [Google Scholar] [CrossRef]
- Chen, Y.C.; Lo, T.W.; Shih, W.Y.; Lin, T.P. Interpreting air temperature generated from urban climatic map by urban morphology in Taipei. Theor. Appl. Climatol. 2019, 137, 2657–2662. [Google Scholar] [CrossRef]
- Shih, W.Y.; Ahmad, S.; Chen, Y.C.; Lin, T.P.; Mabon, L. Spatial relationship between land development pattern and intra-urban thermal variations in Taipei. Sustain. Cities Soc. 2020, 62, 102415. [Google Scholar] [CrossRef]
- Chen, Y.C.; Yao, C.K.; Honjo, T.; Lin, T.P. The application of a high-density street-level air temperature observation network (HiSAN): Dynamic variation characteristics of urban heat island in Tainan, Taiwan. Sci. Total Environ. 2018, 626, 555–566. [Google Scholar] [CrossRef] [PubMed]
| Publisher’s Note: MDPI stays neutral with regard to jurisdictional claims in published maps and institutional affiliations. |
© 2021 by the authors. Licensee MDPI, Basel, Switzerland. This article is an open access article distributed under the terms and conditions of the Creative Commons Attribution (CC BY) license (https://creativecommons.org/licenses/by/4.0/).


