Abstract
Water is an essential resource for the survival of living beings. Remote-sensing data provides the best possible way to detect water bodies and monitor change over time. With a surplus amount of remote sensing data, machine learning approaches have become an effective and efficient way to detect and monitor surface water bodies. This research focused on utilizing remote sensing and machine learning approaches to monitor changes in the surface water of Lake Okeechobee, Florida, USA. This investigation used two sources of remotely sensed data, Landsat 7, and Landsat 8, for 2002 and 2022, respectively. Two machine learning algorithms, support vector machine (SVM) and random forest (RF), were adopted, considering their power and robustness, among other factors, for supervised classification. Both algorithms provided an accuracy of over 92% and a kappa statistic exceeding 0.8. Further, we used image differencing techniques to track changes across two decades. The SVM suggested an increase of 85 km2, and RF indicated an expansion of 52 km2 in the surface water area. This study explicitly demonstrates how dynamic natural resources are, especially water sources. Thus, it can provide a foundation for research that further explores environmental assessments and sustainable water resource planning in Lake Okeechobee.
1. Introduction
Water bodies are essential for investigating hydrology, ecology, and ecosystem preservation [1]. Identifying water availability and the dynamics of its movement is important for effective water resource management. With advancements in remote sensing, detecting water bodies and assessing changes using satellite-based remote sensing imagery has emerged as a predominant method [2,3]. Change detection involves comparing data sets collected for the same area at different times to identify and understand the nature, extent, and location of the changes. Human activities, sudden natural events, or long-term environmental factors can cause these changes. Studying the changing pattern is crucial for planning and formulating action plans, restoration programs, and other hydrological analyses.
The remote sensing method has been widely used to monitor changes in water, land cover/use, vegetation, and forest. In recent years, remote sensing data sources have become indispensable tools for comprehensively analyzing surface water dynamics [4,5,6]. The surface water change detection process typically involves extracting water features from multi-date satellite images, followed by comparative analysis, to detect and characterize any observed changes [4,7]. Surface water detection using remote sensing imageries faces several challenges. First, the biggest problem is the misclassification of shadows of hills, melting ice, trees, and wet, barren sand as water when applying the threshold approach [8]. In surface water extraction, classification techniques are generally favored for their higher accuracy when contrasted with single-band methods [4]. Regarding image classification, non-parametric methods, specifically SVM and RF, have gained popularity [9]. SVM and RF demonstrate robustness against noise and overtraining, highlighting their efficacy in handling unbalanced data [10]. These techniques have proven to be highly effective for various classification-related applications.
The Lake Okeechobee Watershed Restoration Project is a part of the Comprehensive Everglades Restoration Plan (CERP) implemented in July 2016 and currently ongoing, which has been working to maintain the water flow across South Florida to preserve the ecosystems. Lake Okeechobee is a focal part of South Florida’s water supply and flood control systems; therefore, a keen understanding of its change dynamics is required. Over time, the lake has altered for several reasons, mainly anthropogenic activities, flood control, and urbanization. Furthermore, this area is a refuge for many important flora and fauna of sub-tropical regions; thus, a comprehensive assessment of changes in its surface water is necessary. This research aims to quantify surface water detection using remote sensing datasets from the Landsat image series (2002 and 2022) employing SVM and RF models. Finally, we will compare the change detection using different machine learning methods, and suitable methods to detect changes in surface water will be proposed.
2. Materials and Methods
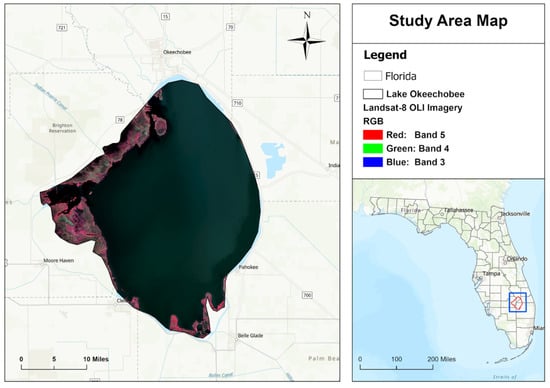
This research utilized satellite imageries from Landsat-7 and 8 from 2002 and 2022, with a cloud cover of less than ten percent. The data are freely available and were downloaded from the United States Geological Survey (USGS Earth Explorer) website. The band specifications of both Landsat-7 and Landsat-8 can be found. The acquired satellite images were processed and georeferenced using ArcGIS Pro version 3.0.3 [11]. The downloaded layers were merged into a single layer using the composite bands tools in ArcGIS Pro for analysis. Subsequently, the image was clipped using the shapefile of Lake Okeechobee (Figure 1). After these preprocessing steps, spectral indices such as the normalized difference water index (NDWI), modified normalized difference water index (MNDWI), and normalized difference vegetation index (NDVI) were calculated and combined with the composite bands for the better extraction of surface water. Random samples were collected from the Landsat image, superimposed over a high-resolution image [12], to collect reliable samples for water and non-water.

Figure 1.
Location of study area.
Once training samples were generated for both images, they were classified using classification tools based on SVM and RF models. For the SVM model, the maximum number of samples per class was 100 for classification. For the RF model, the number of trees and the maximum tree depth was chosen as 30, and the maximum number of samples per class was selected as 50. After classification was performed for both images, we created confusion matrices for accuracy assessments. Finally, we used a raster calculator for the image-differencing approach to analyze the change between the two image dates.
3. Results
3.1. Lake Status
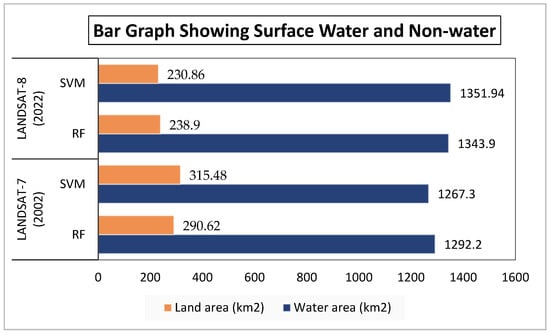
In 2002, within the study area of 1582.8 km2, land cover classification using RF indicated a water area of 1292.2 km2, while SVM classification estimated a water area of 1267.3 km2. The corresponding land areas were 290.6 km2 for RF and 315.5 km2 for SVM.
Similarly, in 2022, the RF classification identified 1344 km2 of water and 238.9 km2 of land within the same study area. Meanwhile, the SVM classification classified 1352 km2 as water and 230.9 km2 as land. Graphical representation of this description is shown in Figure 2. These findings demonstrate the dynamic changes in land and water distribution within the study area over a span of two decades.

Figure 2.
Status of lake water and land in 2002 and 2022 based on the machine learning classification approach.
3.2. Lake Dynamics
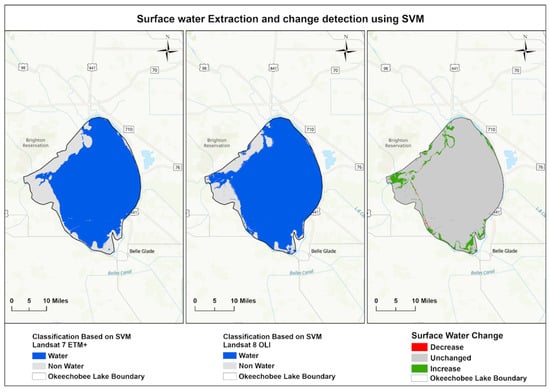
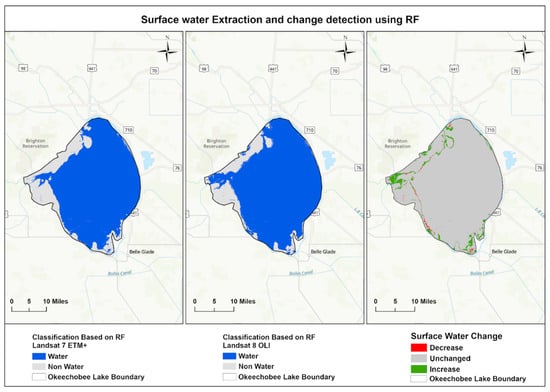
Our study generated a consistent increasing trend for surface water area. More specifically, SVM classification indicates an increase in surface water by 87.07 km2, accompanied by a decrease of 2.28 km2, while RF-based classification suggests an expansion of 60.49 km2 and a reduction of 8.65 km2. Table 1 shows the changing trends of the surface water based on two machine learning techniques.

Table 1.
This is a table for changing trends in Lake Okeechobee based on the machine learning approaches.
In addition, the change in the surface water area of Lake Okeechobee is displayed in Figure 3 and Figure 4. Here, water surface areas are shown in blue, land surface areas are shown in light grey, increased areas are shown in green, and decreased areas are shown in red. The grey color symbolizes no change in water and land surface area.

Figure 3.
Surface water extraction and change detection analysis using SVM.

Figure 4.
Surface water extraction and change detection analysis using RF.
3.3. Accuracy Assessment
The satellite-based classification and change detection study demonstrated the effectiveness of SVM and RF algorithms in classifying land cover. The classification was performed separately for Landsat-7 and 8 images, using the machine learning (SVM and RF) model with a total of 100 water and non-water training samples. An accuracy assessment of the classified images is shown in Table 2. For Landsat-7, SVM achieved an overall accuracy (OA) of 95%, while RF showed a slightly higher performance, with a 97% OA. Similarly, for Landsat-8, SVM outperformed RF, with an impressive OA of 98%, while RF obtained a still commendable OA of 97%. Landsat-8 images yielded better results than Landsat-7 due to their lower cloud cover.

Table 2.
This is a table showing the accuracy assessment of the classification.
4. Discussion
Generally, lakes in subtropical regions face significant seasonal and interannual variations in rainfall and net evapotranspiration, resulting in water-level variations [13]. Moreover, Lake Okeechobee is aggressively managed by the repeated lowering or raising of water and controlling the flow using dams and weir. The operation decision of the U.S. Army Corps of Engineers (USACE) and South Florida Water Management District (SFWMD) means that they control the water level and supply, with the intention of maintaining water quality, maintaining the downstream ecosystem, and providing a means of flood control. Hober Hoover Dike contains a levee, which controls high levels of water by releasing the water before the rainfall season starts. Less rainfall occurred in 2000 and 2001, right after flowing water was received from the lake, which could have caused the water level to significantly decrease in Lake Okeechobee in the early 2000s [14].
Ref. [15] studied the impact of three hurricanes in 2004 and 2005 and found an increased water flow with increased rainfall, the redistribution of bottom sediments, and more suspended materials in the water. From 2002 to 2022, this lake encountered multiple hurricanes, such Hurricanes Ian, Irma, and Sally. Hurricanes are responsible for rainfall and increased water inflow because the watershed area receives more rain. This was responsible for the changes in the lake’s water surface area.
Evapotranspiration and rainfall act in the opposite directions for any hydrological regime. Ref. [16] assume a 10% increase or decrease in rainfall and evapotranspiration to assess the conditions of the water level and its impact on the supporting vegetation by 2060. Unless extreme cases of rainfall decreases and evapotranspiration increases occur, there could be an unfavorable scenario for vegetation. However, two factors in Lake Okeechobee seem to have a compensating effect, i.e., the increased evapotranspiration will be likely to be compensated with increased rainfall under a climate-change scenario [16]. This suggests that a decrease in the water surface water is less likely in our study area.
Hober Hoover Dike surrounds Lake Okeechobee for flood water management; it increases sedimentation compared to the outflow from the region [16]. The same volume of water will have increased dispersion within the area because of the raised bottom in this shallow lake.
We understand that the increase in the surface area of Lake Okeechobee cannot be related to one factor, as a multitude of impacts are collectively acting upon the lake. The increased sedimentation could have raised the bottom of the lake so water spilled over the region [17]; increasing rainfall results in increased water levels, with or without storms; the anthropogenic water control system, etc., could have resulted in changes in the surface water dynamics.
This study aims to quantify the changes in the surface area of Lake Okeechobee, which we observed through the increases and decreases in surface water area. Water surface area increased by 84.64 km2 with SVM and 51.7 km2 with RF within the span of 20 years. Lakes in subtropical regions experience fluctuations in water levels on both an interannual and interseasonal basis. Thus, we must consider all the tradeoffs while managing freshwater in Lake Okeechobee.
5. Conclusions
This research demonstrated the significance of combining remote sensing data and machine learning techniques to monitor changes in Lake Okeechobee. Both the RF and SVM work well, providing an accuracy of over 92% during the classification of land cover in this research. Therefore, it can be suggested that the classification objectives are well met with those two machine learning algorithms, and the algorithms are great for studies on flat ground. The active management of water sources and hurricanes are major factors resulting in changes in the water surface. Further, this study provides valuable insights into the dynamics of water resources and lays the groundwork for future studies and informed environmental and water resource management practices.
Author Contributions
M.T.C. conceived and designed the paper. M.T.C. prepared and collected the data. M.T.C. and S.R. analyzed the data and results. M.T.C. wrote the first draft of the manuscript, and S.R. reviewed and revised the manuscript. All authors have read and agreed to the published version of the manuscript.
Funding
This research received no external funding.
Data Availability Statement
Data will be available on request.
Acknowledgments
Landsat imagery was downloaded from the U.S. Geological Survey (USGS). The research analysis was performed at the Remote Sensing lab at Florida Atlantic University. We acknowledge Caiyun Zhang for her advice and two anonymous editors.
Conflicts of Interest
The authors declare no conflict of interest.
References
- Ghasemigoudarzi, P.; Huang, W.; De Silva, O.; Yan, Q.; Power, D. A machine learning method for inland water detection using CYGNSS data. IEEE Geosci. Remote Sens. Lett. 2020, 19, 1–5. [Google Scholar] [CrossRef]
- Chandrasekar, K.; Sesha Sai, M.V.R.; Roy, P.S.; Dwevedi, R.S. Land Surface Water Index (LSWI) response to rainfall and NDVI using the MODIS Vegetation Index product. Int. J. Remote Sens. 2010, 31, 3987–4005. [Google Scholar] [CrossRef]
- Barrett, D.C.; Frazier, A.E. Automated method for monitoring water quality using Landsat imagery. Water 2016, 8, 257. [Google Scholar] [CrossRef]
- Zhang, Z.; Lu, H.; Zhao, M. Water body extraction and change detection based on multi-temporal SAR images. In MIPPR 2009: Remote Sensing and GIS Data Processing and Other Applications; SPIE: Bellingham, WA, USA, 2009; Volume 7498, pp. 725–731. [Google Scholar]
- Tang, Z.; Ou, W.; Dai, Y.; Xin, Y. Extraction of water body based on LandSat TM5 imagery–a case study in the Yangtze River. In Proceedings of the Computer and Computing Technologies in Agriculture VI: 6th IFIP WG 5.14 International Conference, CCTA 2012, Zhangjiajie, China, 19–21 October 2012; Revised Selected Papers, Part II 6. Springer: Berlin/Heidelberg, Germany, 2013; pp. 416–420. [Google Scholar]
- Li, W.; Du, Z.; Ling, F.; Zhou, D.; Wang, H.; Gui, Y.; Sun, B.; Zhang, X. A comparison of land surface water mapping using the normalized difference water index from TM, ETM+ and ALI. Remote Sens. 2013, 5, 5530–5549. [Google Scholar] [CrossRef]
- Du, Z.; Linghu, B.; Ling, F.; Li, W.; Tian, W.; Wang, H.; Gui, Y.; Sun, B.; Zhang, X. Estimating surface water area changes using time-series Landsat data in the qingjiang river basin, China. J. Appl. Remote Sens. 2012, 6, 063609. [Google Scholar] [CrossRef]
- Acharya, T.D.; Subedi, A.; Huang, H.; Lee, D.H. Classification of surface water using machine learning methods from Landsat data in Nepal. Proceedings 2018, 4, 43. [Google Scholar]
- Adam, E.; Mutanga, O.; Odindi, J.; Abdel-Rahman, E.M. Land-use/cover classification in a heterogeneous coastal landscape using RapidEye imagery: Evaluating the performance of random forest and support vector machines classifiers. Int. J. Remote Sens. 2014, 35, 3440–3458. [Google Scholar] [CrossRef]
- Breiman, L. Random forests. Mach. Learn. 2001, 45, 5–32. [Google Scholar] [CrossRef]
- Overview of Georeferencing. Overview of Georeferencing-ArcGIS Pro|Documentation. (n.d.). Available online: https://pro.arcgis.com/en/pro-app/latest/help/data/imagery/overview-of-georeferencing.htm (accessed on 10 September 2023).
- Layer: World Imagery (ID: 0). (n.d.). Services.arcgisonline.com. Available online: https://services.arcgisonline.com/arcgis/rest/services/World_Imagery/MapServer/0 (accessed on 20 September 2023).
- Abtew, W. Evaporation estimation for Lake Okeechobee in south Florida. J. Irrig. Drain. Eng. 2001, 127, 140–147. [Google Scholar] [CrossRef]
- Steinman, A.; Havens, K.; Hornung, L. The managed recession of Lake Okeechobee, Florida: Integrating science and natural resource management. Conserv. Ecol. 2002, 6, 17. [Google Scholar] [CrossRef]
- James, T.R.; Chimney, M.J.; Sharfstein, B.; Engstrom, D.R.; Schottler, S.P.; East, T.; Jin, K.R. Hurricane effects on a shallow lake ecosystem, Lake Okeechobee, Florida (USA). Fundam. Appl. Limnol. 2008, 172, 273. [Google Scholar] [CrossRef]
- Havens, K.E.; Steinman, A.D. Ecological responses of a large shallow lake (Okeechobee, Florida) to climate change and potential future hydrologic regimes. Environ. Manag. 2015, 55, 763–775. [Google Scholar] [CrossRef] [PubMed]
- Gray, P.N.; Florida, A. A brief history of Lake Okeechobee ecosystem responses to water level management. Water Manag. 2017. Available online: https://fl.audubon.org/sites/default/files/audubon_fl_history_of_lake_okeechobee_water_management_april_2017.pdf (accessed on 20 September 2023).
Disclaimer/Publisher’s Note: The statements, opinions and data contained in all publications are solely those of the individual author(s) and contributor(s) and not of MDPI and/or the editor(s). MDPI and/or the editor(s) disclaim responsibility for any injury to people or property resulting from any ideas, methods, instructions or products referred to in the content. |
© 2023 by the authors. Licensee MDPI, Basel, Switzerland. This article is an open access article distributed under the terms and conditions of the Creative Commons Attribution (CC BY) license (https://creativecommons.org/licenses/by/4.0/).