Abstract
Porous pavements are considered an alternative to increasing the city’s permeable surfaces and have great potential for rainwater harvesting. Over time, the surface layer clogs, limiting the application and use of porous pavement. This study aims to evaluate the maximum time for an intervention on a porous surface to recover its permeable properties before clogging. Through a constant load permeameter, rainwater runoff simulations were performed to measure the permeability coefficient of porous asphalt mixtures. Void content and interconnected voids were also evaluated. The parameter permeability showed a good indicator for determining when a surface layer will clog, and by taking regular measurements, the necessary intervention time to prevent it can be established. The designed porous mixture surface intervention should occur every year.
1. Introduction
The growing urbanization process in cities leads to an increase in impermeable areas, generating changes in the natural characteristics of watersheds. Consequently, the recharge of springs and groundwater is compromised, and as the volume of surface runoff increases, the risks of floods and inundations occur. An alternative for integrated rainwater management is using porous pavements and surfaces.
The pavement layer surface mainly comprises porous asphalt mixtures, produced with a high amount of air voids and a percentage of coarse aggregates to form an open-graded granulometry and allow water to flow through it. The open gradation results in higher voids (18–25%) compared to densely-graded mixtures [1,2]. On the other hand, fine aggregates contribute to mixture strength and durability, but increasing their proportion compromises the permeability, which is negligible if the void content is less than 14% [3].
Zhang et al. asserted that studies had shown the benefits of porous mixtures compared to dense ones. Due to the interconnected porosity, the water flows out of the pavement during rainfall, avoiding accumulation on the surface. The road safety improvements include increased skid resistance and reduced hydroplaning [4].
The infrastructure can introduce low-impact development models through increasing permeable areas such as green spaces, porous pavements, and water systems. These models allow rainwater to be absorbed, retained, and released to reduce runoff volume and peak flow, slow down runoff speed, replenish groundwater, and filter rainwater pollutants [5,6]. However, the water that precipitates on the pavement surface carries contaminants and powdery materials (runoff), which, over time, lead to the progressive clogging of the voids.
Due to clogging, functionality is affected, and the porous pavement (or surface) cannot facilitate drainage. Additionally, the porous surface suffers damage due to water stagnation inside. The rate of clogging depends on factors such as the pavement surface, void content, traffic load, pavement slope, maintenance measures adopted, and environmental and local conditions [7]. An evaluation of the progression of clogging can be performed in the field or laboratory using permeameters.
Porous surface pavement layers are beneficial as they contribute to stormwater management by reducing surface runoff. On the other hand, the voids in porous layers clog over time, and the permeable characteristics decrease. Because of this, road agencies avoided applying the porous surface layer to the pavement.
In order to contribute to advancing the use of porous mixtures as a pavement surface layer, the primary motivation of this study was to evaluate the clogging by simple permeability tests. Thus, permeability reduction enabled establishing the needed intervention time to restore porous mixtures permeable characteristics. This study aims to evaluate the maximum time for an intervention in a porous mixture to recover its permeable properties before clogging.
2. Methodology
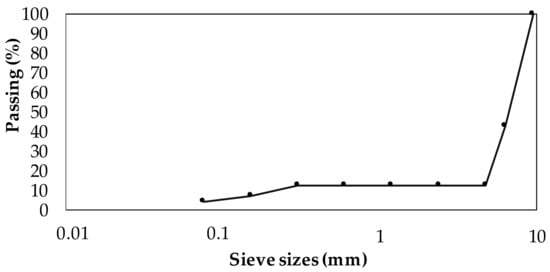
In this study, the clogging progression of a porous asphalt mixture was measured in the laboratory to evaluate the maximum intervention time for recovery of the permeable properties. The porous asphalt mixtures were produced with asphalt rubber fabricated at a Brazilian refinery (terminal blend) with 15% incorporated rubber. Aggregates of granitic origin from southern Brazil were used, whose gradation curve is shown in Figure 1.

Figure 1.
Mixture gradation curve.
The mixture design was performed according to the ASTM D 7064 standard [8] in the CGS (660 kPa, angle 1.25°, 50 gyrations) and resulted in an asphalt content of 5.0% and a void volume of 24.2%. Figure 2 presents the experimental methodology procedure.

Figure 2.
Experimental procedure.
To simulate the traffic influence on the mixture’s air void reduction, in Phase 1, the samples (100 mm in diameter; 63.5 in height on average) were moulded at different compaction levels in the Superior Performing Asphalt Pavements (SUPERPAVE) gyratory compactor (CGS) through increasing gyration numbers (50—reference, 75, 100, 150, and 200). Three samples per level were produced to perform the tests.
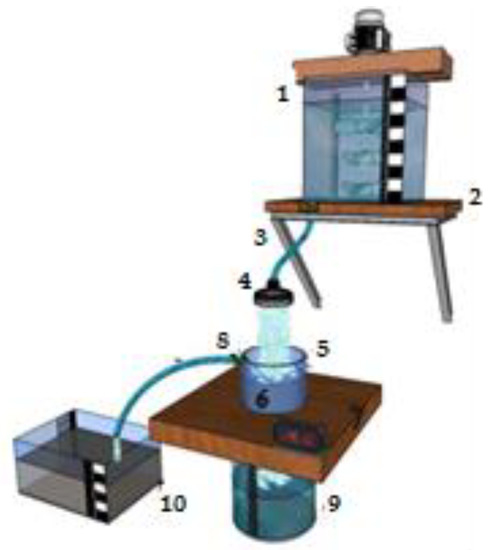
The solid material that accumulated under an overpass on a medium traffic road was collected to compose the solid particles for runoff experimentation. After drying in an oven, the solid material was selected by sieving, and the fraction retained on sieve no. 100 (0.149 mm) was used, based on the study by Fwa et al. [9]. Adjustments were made to the amount of material for the sample dimensions of this study, resulting in 3.53 grams. To promote sample clogging in the runoff solution, 3.53 grams of the solid material were added to one liter of water. The runoff solution was introduced into the reservoir (Figure 3), and the samples were submitted to simulation cycles in a constant head permeameter developed by the authors of this study (Figure 3). The permeability coefficient was calculated through Equation (1). For porous materials, Fwa et al. [9] defined a constant (n of 0.70) to minimize the significant error between readings in tests using laboratory permeameters, which were also adopted in this study.

Figure 3.
The constant-head permeameter developed in the study. Legend: (1.) Reservoir (volume 5 liters); (2.) reservoir support elevated 50 cm from the sample; (3.) hose (diameter 10 mm); (4.) plastic shower for water flow control; (5.) plastic mould in which the sample is inserted; (6.) sample with lateral waterproofing by silicone; (7.) support to fix the sample; (8.) a spillway (3/8” gauge) to keep the water level above the sample; and (9.) a water collector from the spillway.
The initial permeability coefficient (ki) was determined using water, and after five simulations with runoff solution, the final permeability coefficient (kf) was measured. For each sample, the void volume and the interconnected void volume were evaluated before and after the simulations. It was used as a criterion, which means the sample was considered clogged when the interconnected void volume reached 12%.
For each sample group, the permeability coefficient reduction (kr) was calculated as a function of the mean value distribution (Equation (4)) and the uncertainty range (Equation (5)). The maximum intervention time in months was established from the number of simulations required to reach the criteria, considering the annual precipitation average for Florianópolis (1570 mm). In this way, for this precipitation, each simulation cycle represents 261.67 mm, and one cycle corresponds to two months.
where k is the permeability coefficient (mm/s); V is the runoff speed (mm/s), given by Equation (2); i is the hydraulic gradient (dimensionless), given by Equation (3); n is the constant [9] equal to 0.7; Q is the drained volume (mm3); t is each cycle simulation time (s); A is the top surface area of the sample (mm2); H is the height of the water layer (mm); L is the sample height (mm); kr is the permeability coefficient reduction (mm/s); a and b are regression coefficients; N is the number of simulations; u is the uncertainty range; μ is the mean permeability coefficient (mm/s); and u is the standard deviation (mm/s).
k = V/in
V = Q/t × A
i = H/L
kr = a × e−bN
u = μ + u
3. Results and Discussion
3.1. Influence of Compaction Effort in the Void Reduction
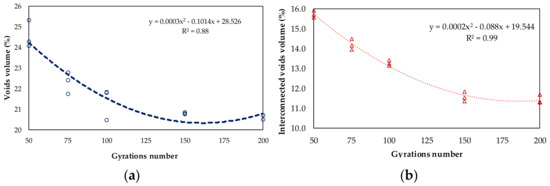
As a function of the number of gyrations, Figure 4a presents the reduction in void volume, and Figure 4b the interconnected void volume.

Figure 4.
Void reduction as a function of the number of gyrations. (a) Void volume; (b) interconnected voids.
In Figure 4, it can be observed that as the level of compaction effort increased, the void volume decreased. After 100 gyrations, the void volume tended to stabilize with average values of 21.34%, 20.76%, and 20.62% for 100, 150, and 200 gyrations, respectively (Figure 4a). The interconnected void volume reduction and the increased compaction effort indicated a decrease in permeability (Figure 4b). Similarly, there was a tendency for values to stabilize after 100 gyrations, being, on average, 13.25%, 12.63%, and 12.23% for 100, 150, and 200 gyrations, respectively.
3.2. Influence of Compaction Effort in the Permeability Coefficient Reduction
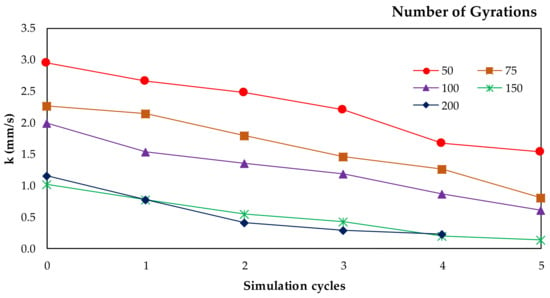
Table 1 shows the initial permeability coefficients (ki) measured before and after the final (kf) evaluated simulations. The values were normalized for the permeability coefficient reduction (kr) analysis through the obtained average (Figure 5). The uncertainty range presented a reliability of 68.3%. In Figure 5, the increase in compaction effort, which represents the traffic load over time, is reflected in the reduction in the permeability coefficient.

Table 1.
Permeability coefficients.

Figure 5.
Void reduction as a function of the number of gyrations.
In the literature, there is a lack of studies that evaluated clogging in samples submitted to different compaction efforts. Samples submitted in simulation cycles using a permeameter with more than 20% voids were less affected by clogging [9]. Lin et al. [10] asserted that the initial permeability coefficient of samples was 0.56 mm/s, and after simulations, when it reached 0.49 mm/s, the surfaces were clogged. These studies corroborated the fact that permeability tests help estimate void reduction due to clogging.
3.3. Intervention Time
Table 2 presents the regression coefficients obtained (Equation (2)) for each group of samples (number of gyrations). Table 3 shows the obtained average values of void volume, interconnected void volume, and permeability coefficients for the sample group as a function of the number of gyrations. The permeability coefficient reduction (kr) was calculated by Equation (2) when the interconnected void volume reached a value of 12%, and then the intervention time can be estimated.

Table 2.
Regression coefficients (a and b).

Table 3.
Parameters for the permeability reduction calculation.
The intervention time for the porous asphalt mixture to recover its permeable properties was proportional to the number of gyrations, reflecting that the traffic effort contributes to the reduction of permeability. For example, in Table 3, the intervention time was fourteen months for the compaction after 50 gyrations, while for 200 gyrations, it was more than seven months. To prevent clogging progression, the intervention by surface cleaning for the porous mixture studied should occur at least every year.
4. Conclusions
A porous asphalt mixture was produced to estimate the necessary intervention time for the maintenance of permeable characteristics. Samples of different compaction efforts in the CGS were submitted based on the increase in the number of gyrations (50, 75, 100, 150, and 200 gyrations) to evaluate the traffic effect over time.
The samples were tested in the laboratory by cycling rainwater (runoff solution) through a constant head permeameter developed in the study. Before and after simulations, the void volume, interconnected voids, and permeability coefficient were measured. A stabilization of void volume and interconnected void volume values was observed after 100 gyrations, indicating that higher compaction levels present slight variations. The permeability reduction of each set of samples was evaluated statistically through the uncertainty range and the analysis of experimental data.
A minimum value of 12% of the interconnected void volume was established, considering that the porous mixture was clogged. The intervention time was estimated after the pavement surface layer was open to traffic. The permeability reduction was proportional to the increase in the number of gyrations. For samples subjected to 50 gyrations, the maximum intervention time was 14 months. On the other hand, for 200 gyrations, considering the effect of traffic, the intervention time was shorter, approximately 7.6 months.
Considering the porous asphalt mixture of this study and the local annual rainfall (1570 mm), based on the evaluated parameters, it is recommended that the intervention time for surface cleaning (with water and air jets) be carried out at least each year. Moreover, it is essential for future studies that the mixture’s internal structure be analyzed to estimate the intervention time and permeable parameter measurements. Additionally, experimental stretches must be constructed and monitored for data validation. The study limitations were using the same amount of solid material in the laboratory tests and just one type of porous mixture. The following research steps should involve the development of a stormwater simulator and analysis by tomography.
Author Contributions
Conceptualization, E.S.H.G.; methodology, E.S.H.G.; formal analysis, L.P.T.; investigation, E.S.H.G.; writing—original draft preparation, E.S.H.G.; writing—review and editing, L.P.T.; supervision, L.P.T. All authors have read and agreed to the published version of the manuscript.
Funding
This research was funded by The Brazilian National Council for Scientific and Technological Development (CNPq) grant number 6813497078212769, and The APC was funded by CAPES Foundation.
Institutional Review Board Statement
Not applicable.
Informed Consent Statement
Not applicable.
Data Availability Statement
https://repositorio.ufsc.br/handle/123456789/185442 (in Portuguese) (accessed on 13 March 2023).
Acknowledgments
The first author is thankful to the CAPES Foundation (Financing Code 001) for support with a scholarship.
Conflicts of Interest
The authors declare no conflict of interest.
References
- Gupta, A.; Rodriguez-Hernandez, J.; Castro-Fresno, D. Incorporation of additives and fibers in porous asphalt mixtures: A review. Materials 2019, 12, 3156. [Google Scholar] [CrossRef] [PubMed]
- Alvarez, A.E.; Martin, A.E.; Estakhri, C. A review of mix design and evaluation research for permeable friction course mixtures. Constr. Build. Mater. 2011, 25, 1159–1166. [Google Scholar] [CrossRef]
- Taylor, P.; Ranieri, V.; Sansalone, J.J.; Shuler, S. Relationships among gradation curve, clogging resistance, and pore-based indices of porous asphalt mixes. Road Mater. Pavement Des. 2010, 11, 37–41. [Google Scholar] [CrossRef]
- Zhang, Z.; Sha, A.; Liu, X.; Luan, B.; Gao, J.; Jiang, W.; Ma, F. State-of-the-art of porous asphalt pavement: Experience and considerations of mixture design. Constr. Build. Mater. 2020, 262, 119998. [Google Scholar] [CrossRef]
- Wei, J.; He, J. Numerical simulation for analyzing the thermal improving effect of evaporative cooling urban surfaces on the urban built environment. Appl. Therm. Eng. 2013, 51, 144–154. [Google Scholar] [CrossRef]
- Huang, W.; Liu, X.; Zhang, S.; Zheng, S.; Ding, Y.; Tong, B. Performance-guided design of permeable asphalt concrete with modified asphalt binder using crumb rubber and SBS modifier for sponge cities. Materials 2021, 14, 1266. [Google Scholar] [CrossRef] [PubMed]
- Kumar, K.; Kozak, J.; Hundal, L.; Cox, A.; Zhang, H.; Granato, T. In-situ infiltration performance of diferent permeable pavements in an employee used parking lot—A four-year study. J. Environ. Manag. 2016, 167, 8–14. [Google Scholar] [CrossRef] [PubMed]
- ASTM D7064; Standard Practice for Open-Graded Friction Course (OGFC) Mix Design. American Society for Testing and Materials (ASTM): West Conshohocken, PA, USA, 2004.
- Fwa, T.F.; Lim, E.; Tan, K.H. Comparison of permeability and clogging characteristics of porous asphalt and pervious concrete pavement materials. Transp. Res. Rec. 2015, 2511, 72–80. [Google Scholar] [CrossRef]
- Lin, W.; Park, D.G.; Ryu, S.W.; Lee, B.T.; Cho, Y.H. Optimum mix design of enhanced permeable concrete–an experimental investigation. Constr. Build. Mater. 2016, 24, 2664–2671. [Google Scholar] [CrossRef]
Disclaimer/Publisher’s Note: The statements, opinions and data contained in all publications are solely those of the individual author(s) and contributor(s) and not of MDPI and/or the editor(s). MDPI and/or the editor(s) disclaim responsibility for any injury to people or property resulting from any ideas, methods, instructions or products referred to in the content. |
© 2023 by the authors. Licensee MDPI, Basel, Switzerland. This article is an open access article distributed under the terms and conditions of the Creative Commons Attribution (CC BY) license (https://creativecommons.org/licenses/by/4.0/).