1. Introduction
Hydrological frequency analyses are usually focused on univariate approaches of flood peak time series. For example, univariate analysis can be used to either design or assess the safety of most bridges and culverts, as they can be designed only with the study of the flow peaks for a given return period. In such cases, maximum water levels usually depend on flood peaks. However, it is necessary to account for the entire flood hydrograph to assess hydrological dam safety correctly [
1]. In a dam, inflow hydrographs are routed in the reservoir; therefore, outflow peak flows will be equal or smaller than inflow peak flows, depending on reservoir storage volumes, spillway length and characteristics, the operation strategy in the spillway gates, and inflow hydrograph characteristics, etc. Consequently, a univariate analysis cannot fully assess the exceedance probability of a given hydrological event and multivariate analyses are required. In addition, it is necessary to use stochastic approaches to generate a large set of hydrograph volume–peak flow pairs that keeps the statistical properties of both the marginal univariate frequency distributions and the dependence structure between variables [
2].
The hydrological safety in a dam is related to the maximum water level that the reservoir reaches in a flood event associated with a given return period. Therefore, it should be analysed with the frequency curve of maximum reservoir water levels in order to better assess hydrological dam safety. For this purpose, a large set of inflow hydrographs generated using a stochastic approach should be routed through the reservoir. In such an approach, the result will depend on several variables, such as flood peak and hydrograph volume univariate frequency curves, and the dependence structure between these variables [
3]. Therefore, it is essential to consider several variables by using a multivariate analysis to assess hydrological dam safety.
In addition, a given hydrograph shape has to be assigned to each flood peak-hydrograph volume pair in the stochastic procedure. Therefore, hydrometeorological simulations are required to characterise the catchment response in flood events and obtain feasible hydrograph shapes that can be generated. Hydrometeorological simulations are based on hyetographs that characterise precipitation depths and the temporal variability of rainfall in storms. Several design hyetograph shapes are available in the literature [
4]. Hydrograph shapes will depend on the design hyetograph selected [
5]; therefore, a design hyetograph that characterises rainfall characteristics in the catchment and simulates hydrograph shapes similar to those observed should be selected.
This paper aims to analyse a set of hyetograph shapes to assess its influence on hydrograph shapes in hydrometeorological simulations. Moreover, a hyetograph shape that will allow for calibrating flood peaks and hydrograph volumes with reasonable hydrological model parameter values will be identified. An approach based on a bivariate analysis using hydrometeorological simulations to assess hydrological dam safety will be used.
2. Case Study
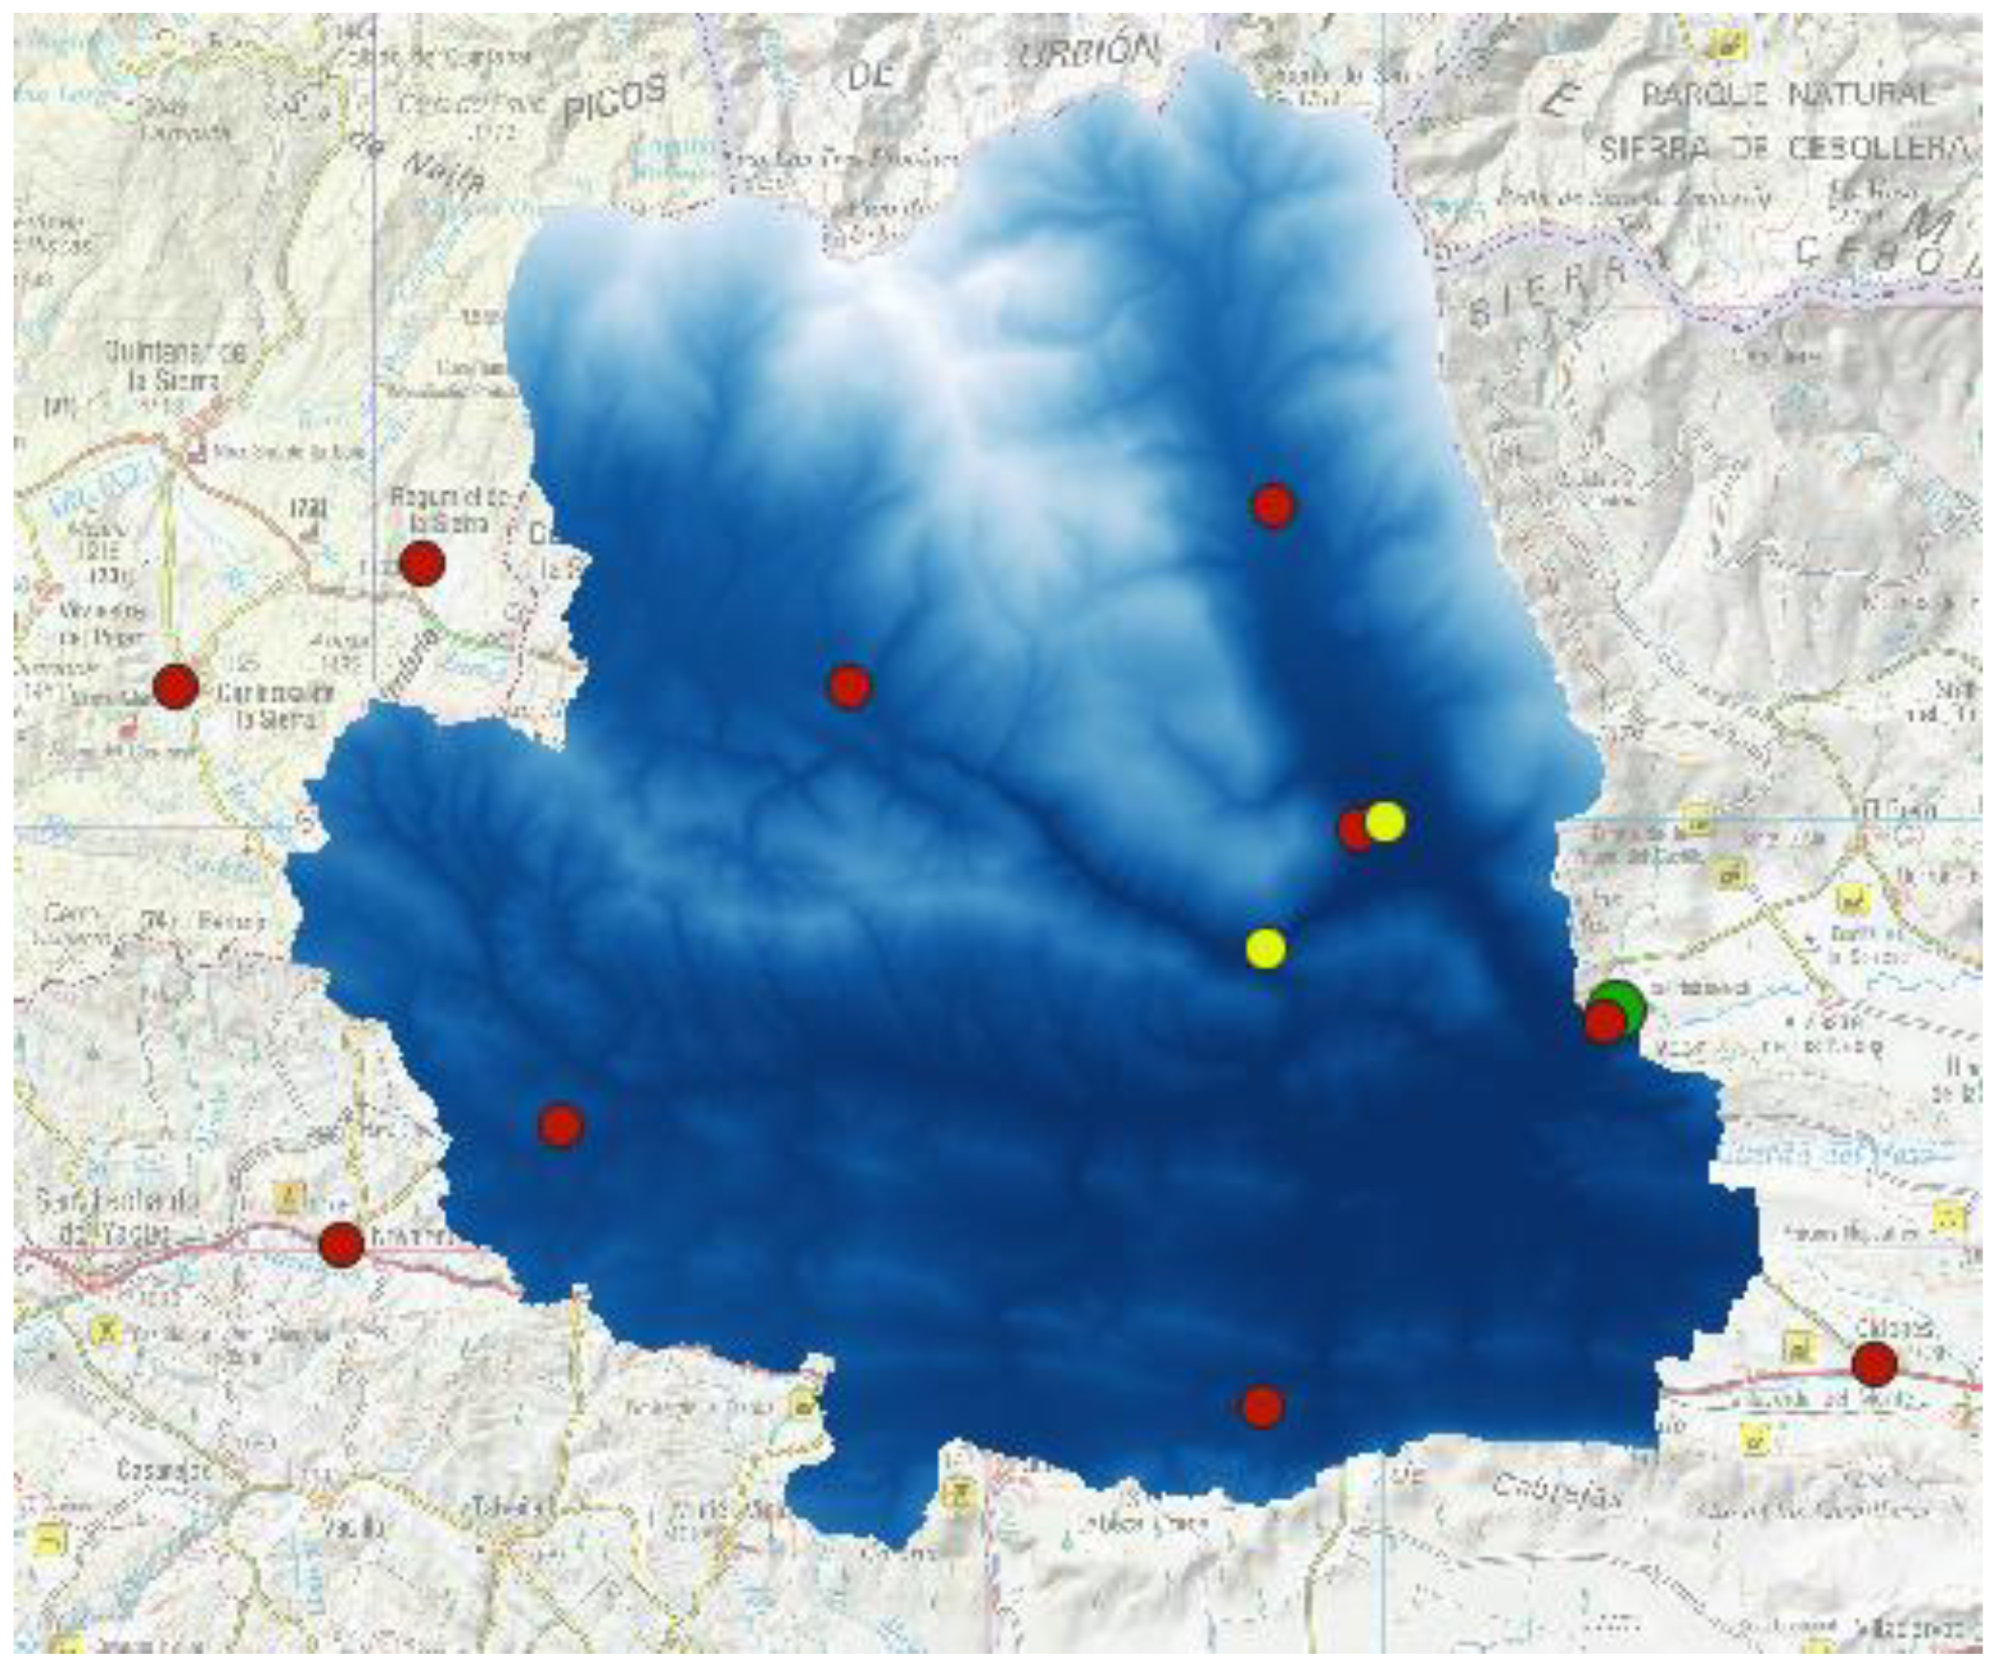
The analysis is carried out in the Cuerda del Pozo Dam located in central Spain (
Figure 1). The Dam belongs to the Douro River Basin Authority.
The catchment area that drains into the Cuerda del Pozo Dam is 547 km2. The dam is located at an altitude of 1080 m above sea level. In the catchment, the maximum altitude is 2146 m, and the mean altitude is 1315 m. The Cuerda del Pozo Dam is located on the River Douro with a height of 40.25 m. The conservation volume is 250 hm3.
A digital terrain model (DTM) with a cell size of 25 m was used to delineate the extent of the catchment and its properties. It was supplied by the Spanish
Instituto Geográfico Nacional (IGN). Daily precipitation data at ten rainfall gauging stations were supplied by the Spanish National Meteorological Agency (AEMET,
Agencia Estatal de Meteorología, in Spanish). Daily streamflow data at two gauging stations and daily reservoir storage volume and outflow releases at the Cuerda del Pozo Dam were supplied by the Centre for Hydrographic Studies of CEDEX and the
Sistema de Información del Agua of the Spanish Ministry of Environment. Hourly rainfall and streamflow data were supplied by the real-time SAIH system of the Douro River Basin Authority.
Figure 2 shows the location of the ten rainfall gauging stations (red dots), the two streamflow gauging stations (yellow dots), and the Cuerda del Pozo Dam (green dot).
3. Materials and Methods
This study is based on a stochastic procedure to generate a large set of inflow hydrographs that is routed through the Cuerda del Pozo Reservoir to assess the hydrological safety of the Cuerda del Pozo Dam. Hydrometeorological simulations are used to generate feasible hydrograph shapes that can be generated in the catchment in flood events. This study simulates the Cuerda del Pozo catchment in natural regime. The following return periods are considered in the analysis: 2, 2.5, 5, 10, 25, 50, 100, 200, 500, 1000, 2000, 5000 and 10,000 years.
The hydrometeorological simulation is based on the curve number method and the Clark unit hydrograph. The SCS curve number is used as the loss method to obtain the net rainfall [
6]. The Clark unit hydrograph is used as a transform method for characterising the runoff concentration and diffusion processes in the catchment [
7].
This study aims to find an adequate hyetograph shape to generate both the runoff volumes given by the univariate frequency curve of the hydrograph volumes and the flood peaks given by the univariate frequency curve of the flood peaks. This process presents different difficulties; therefore, a sensitive analysis is used to obtain an adequate shape of the hyetograph that leads to feasible values of the hydrological model parameters, calibrating both hydrograph volume and flood peaks.
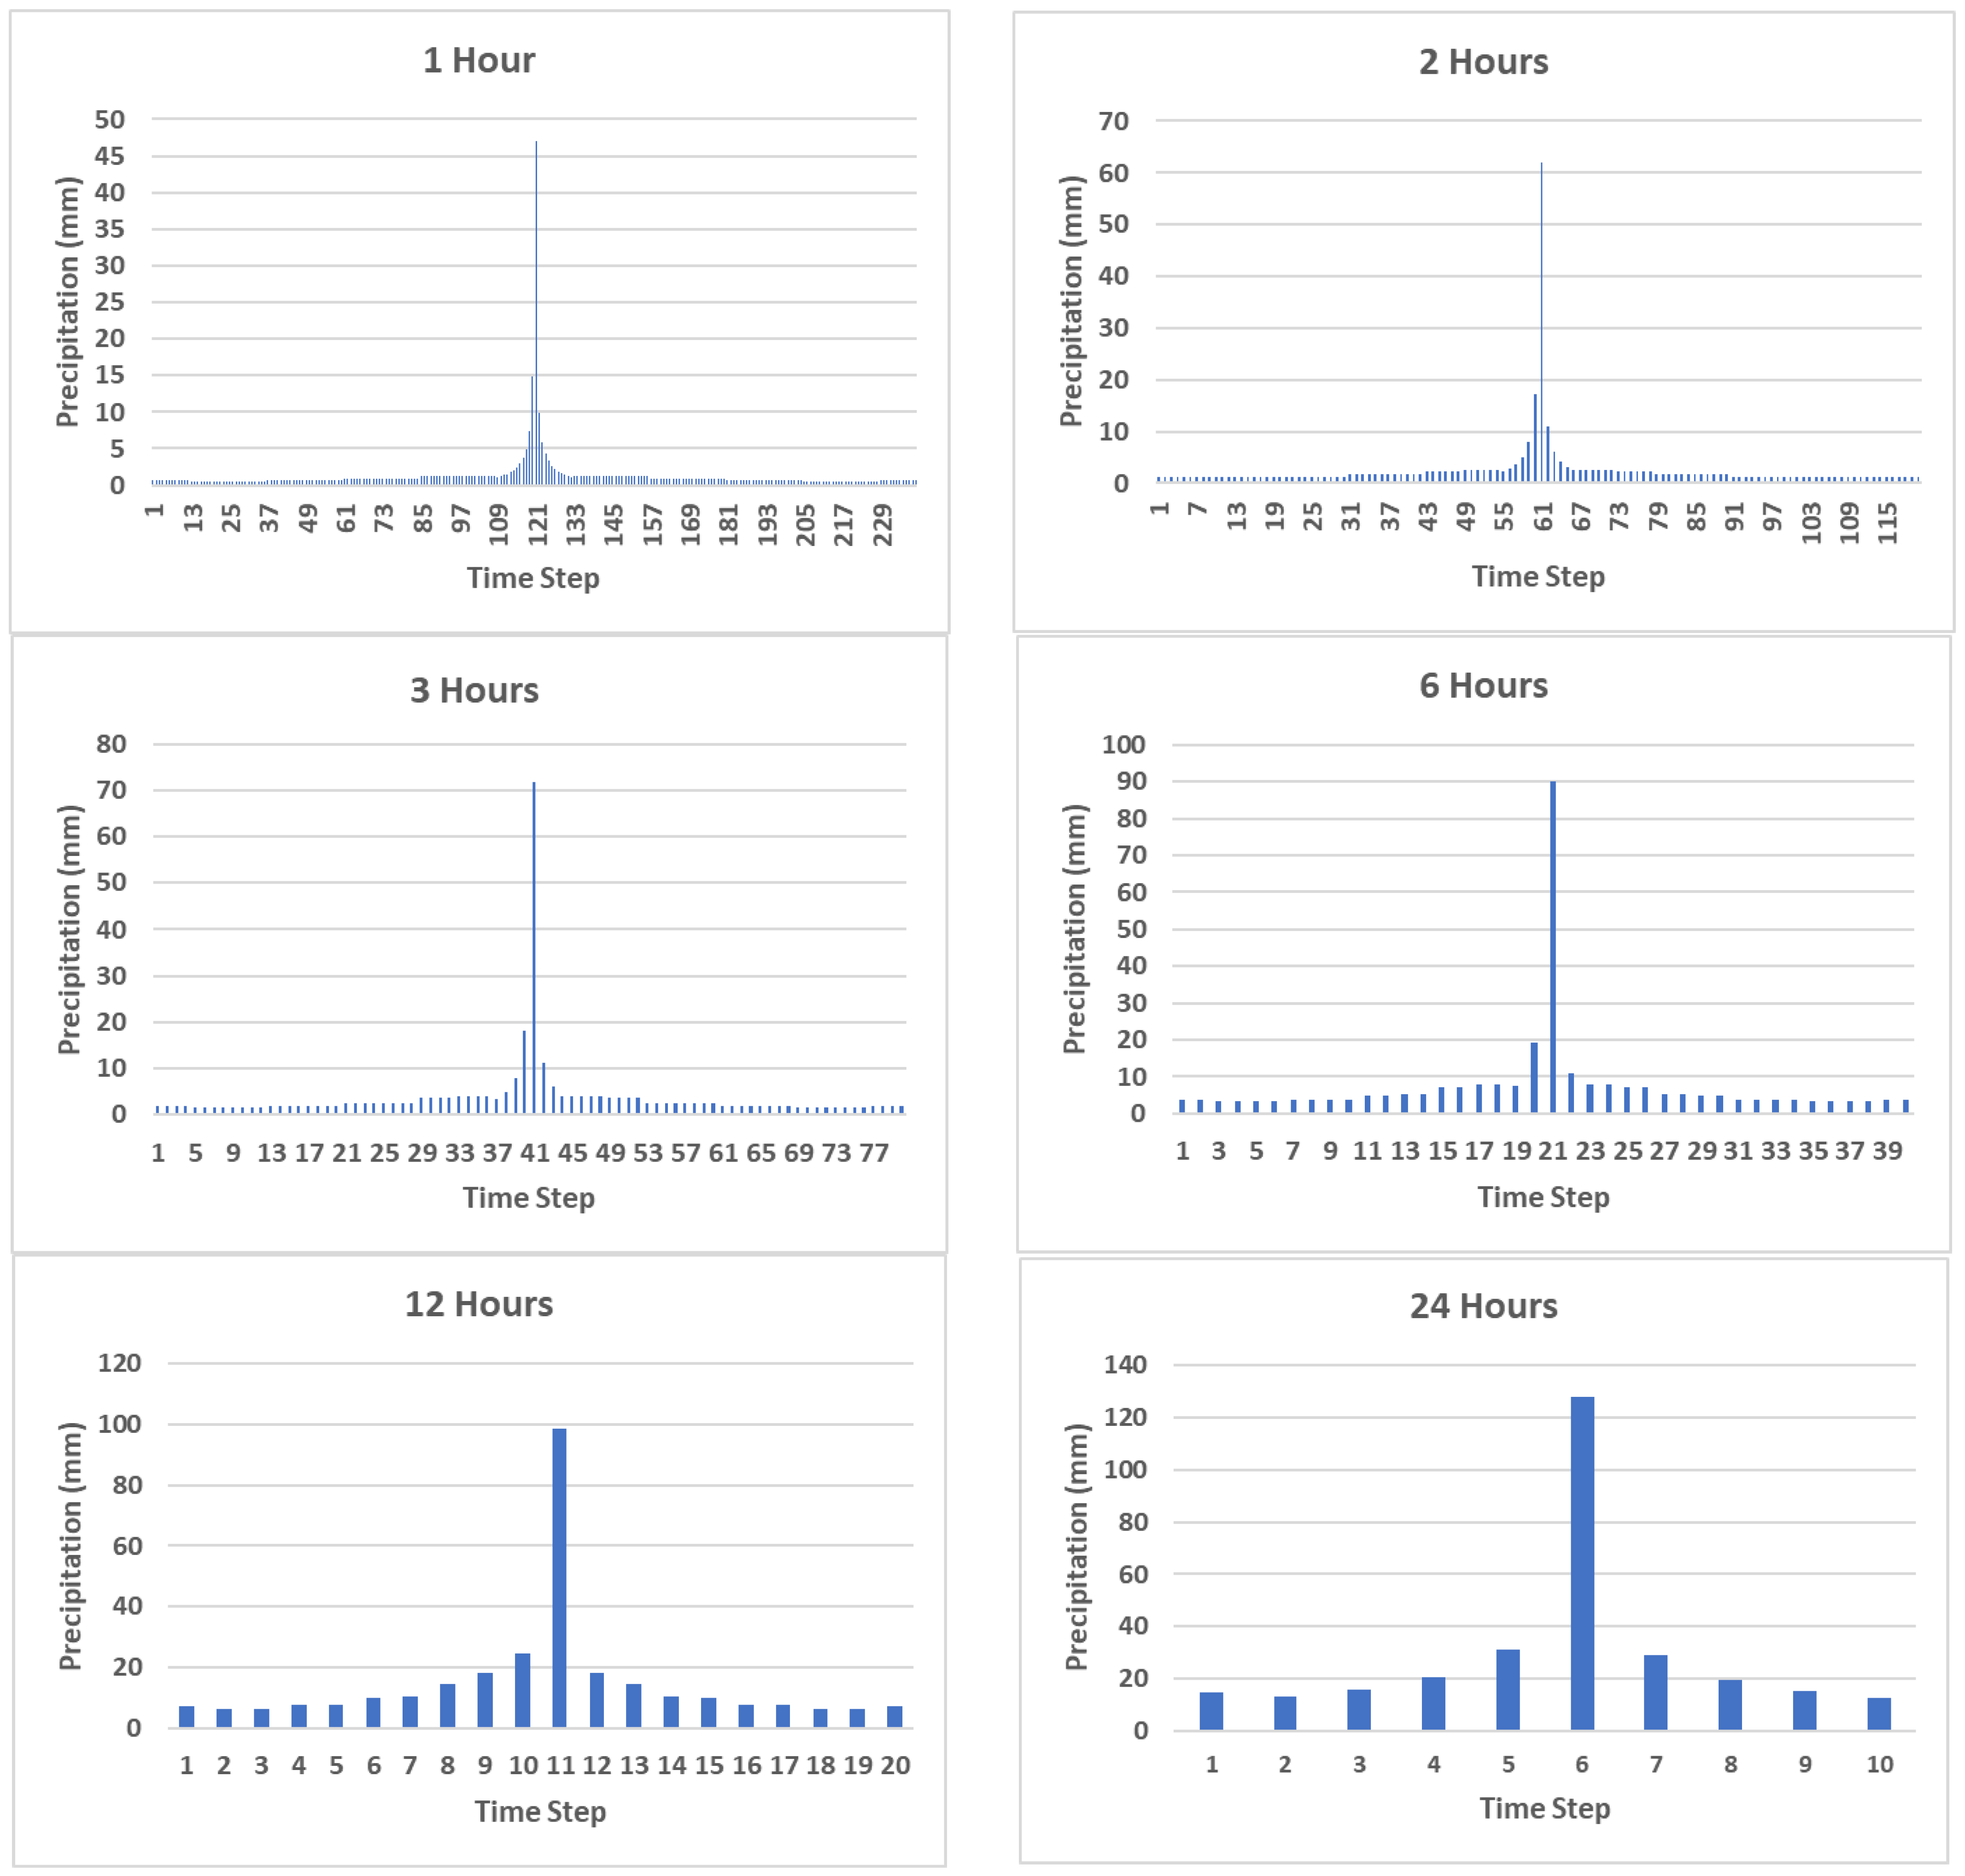
Flood hydrographs in the Cuerda del Pozo Dam are usually generated by storms with a mean duration of ten days. Therefore, 10-day hyetographs are considered in order to obtain the runoff volumes given by the univariate frequency curve of the hydrograph volumes. In this study, the Chicago hyetograph based on the intensity-duration-frequency curve is considered [
8].
In long-duration hyetographs, the time step selection is crucial, as the hydrograph shape will depend on the hyetograph time step. If a small time step is considered in a design hyetograph of several days, sharp hydrographs will be generated with peak flows that can be greater than required. Consequently, unreasonable model parameter values, that would otherwise be necessary, could be needed to smooth the concentration and diffusion processes, decreasing the simulated flood peaks. However, if a large time step is considered, smooth hydrographs could be obtained with flood peaks smaller than required. In this case, model parameter values could not be found to calibrate flood peaks.
In this study, a set of time steps will be considered in the design hyetograph to analyse its influence on the flood hydrograph shape. Time steps of 1, 2, 3, 6, 12 and 24 h are considered.
4. Results and Discussion
A return period of 1000 years has been considered for the sensitivity analysis.
Figure 3 shows the hyetographs obtained for the time steps considered in the study.
Before calibrating the model, flood hydrographs are obtained for each time step to assess the influence of the hyetograph time step on the hydrograph shape (
Figure 4). The results show that, for small time steps, sharp hydrograph shapes are obtained with high peak flows. In contrast, for large time steps, smooth hydrographs are generated with low peak flows.
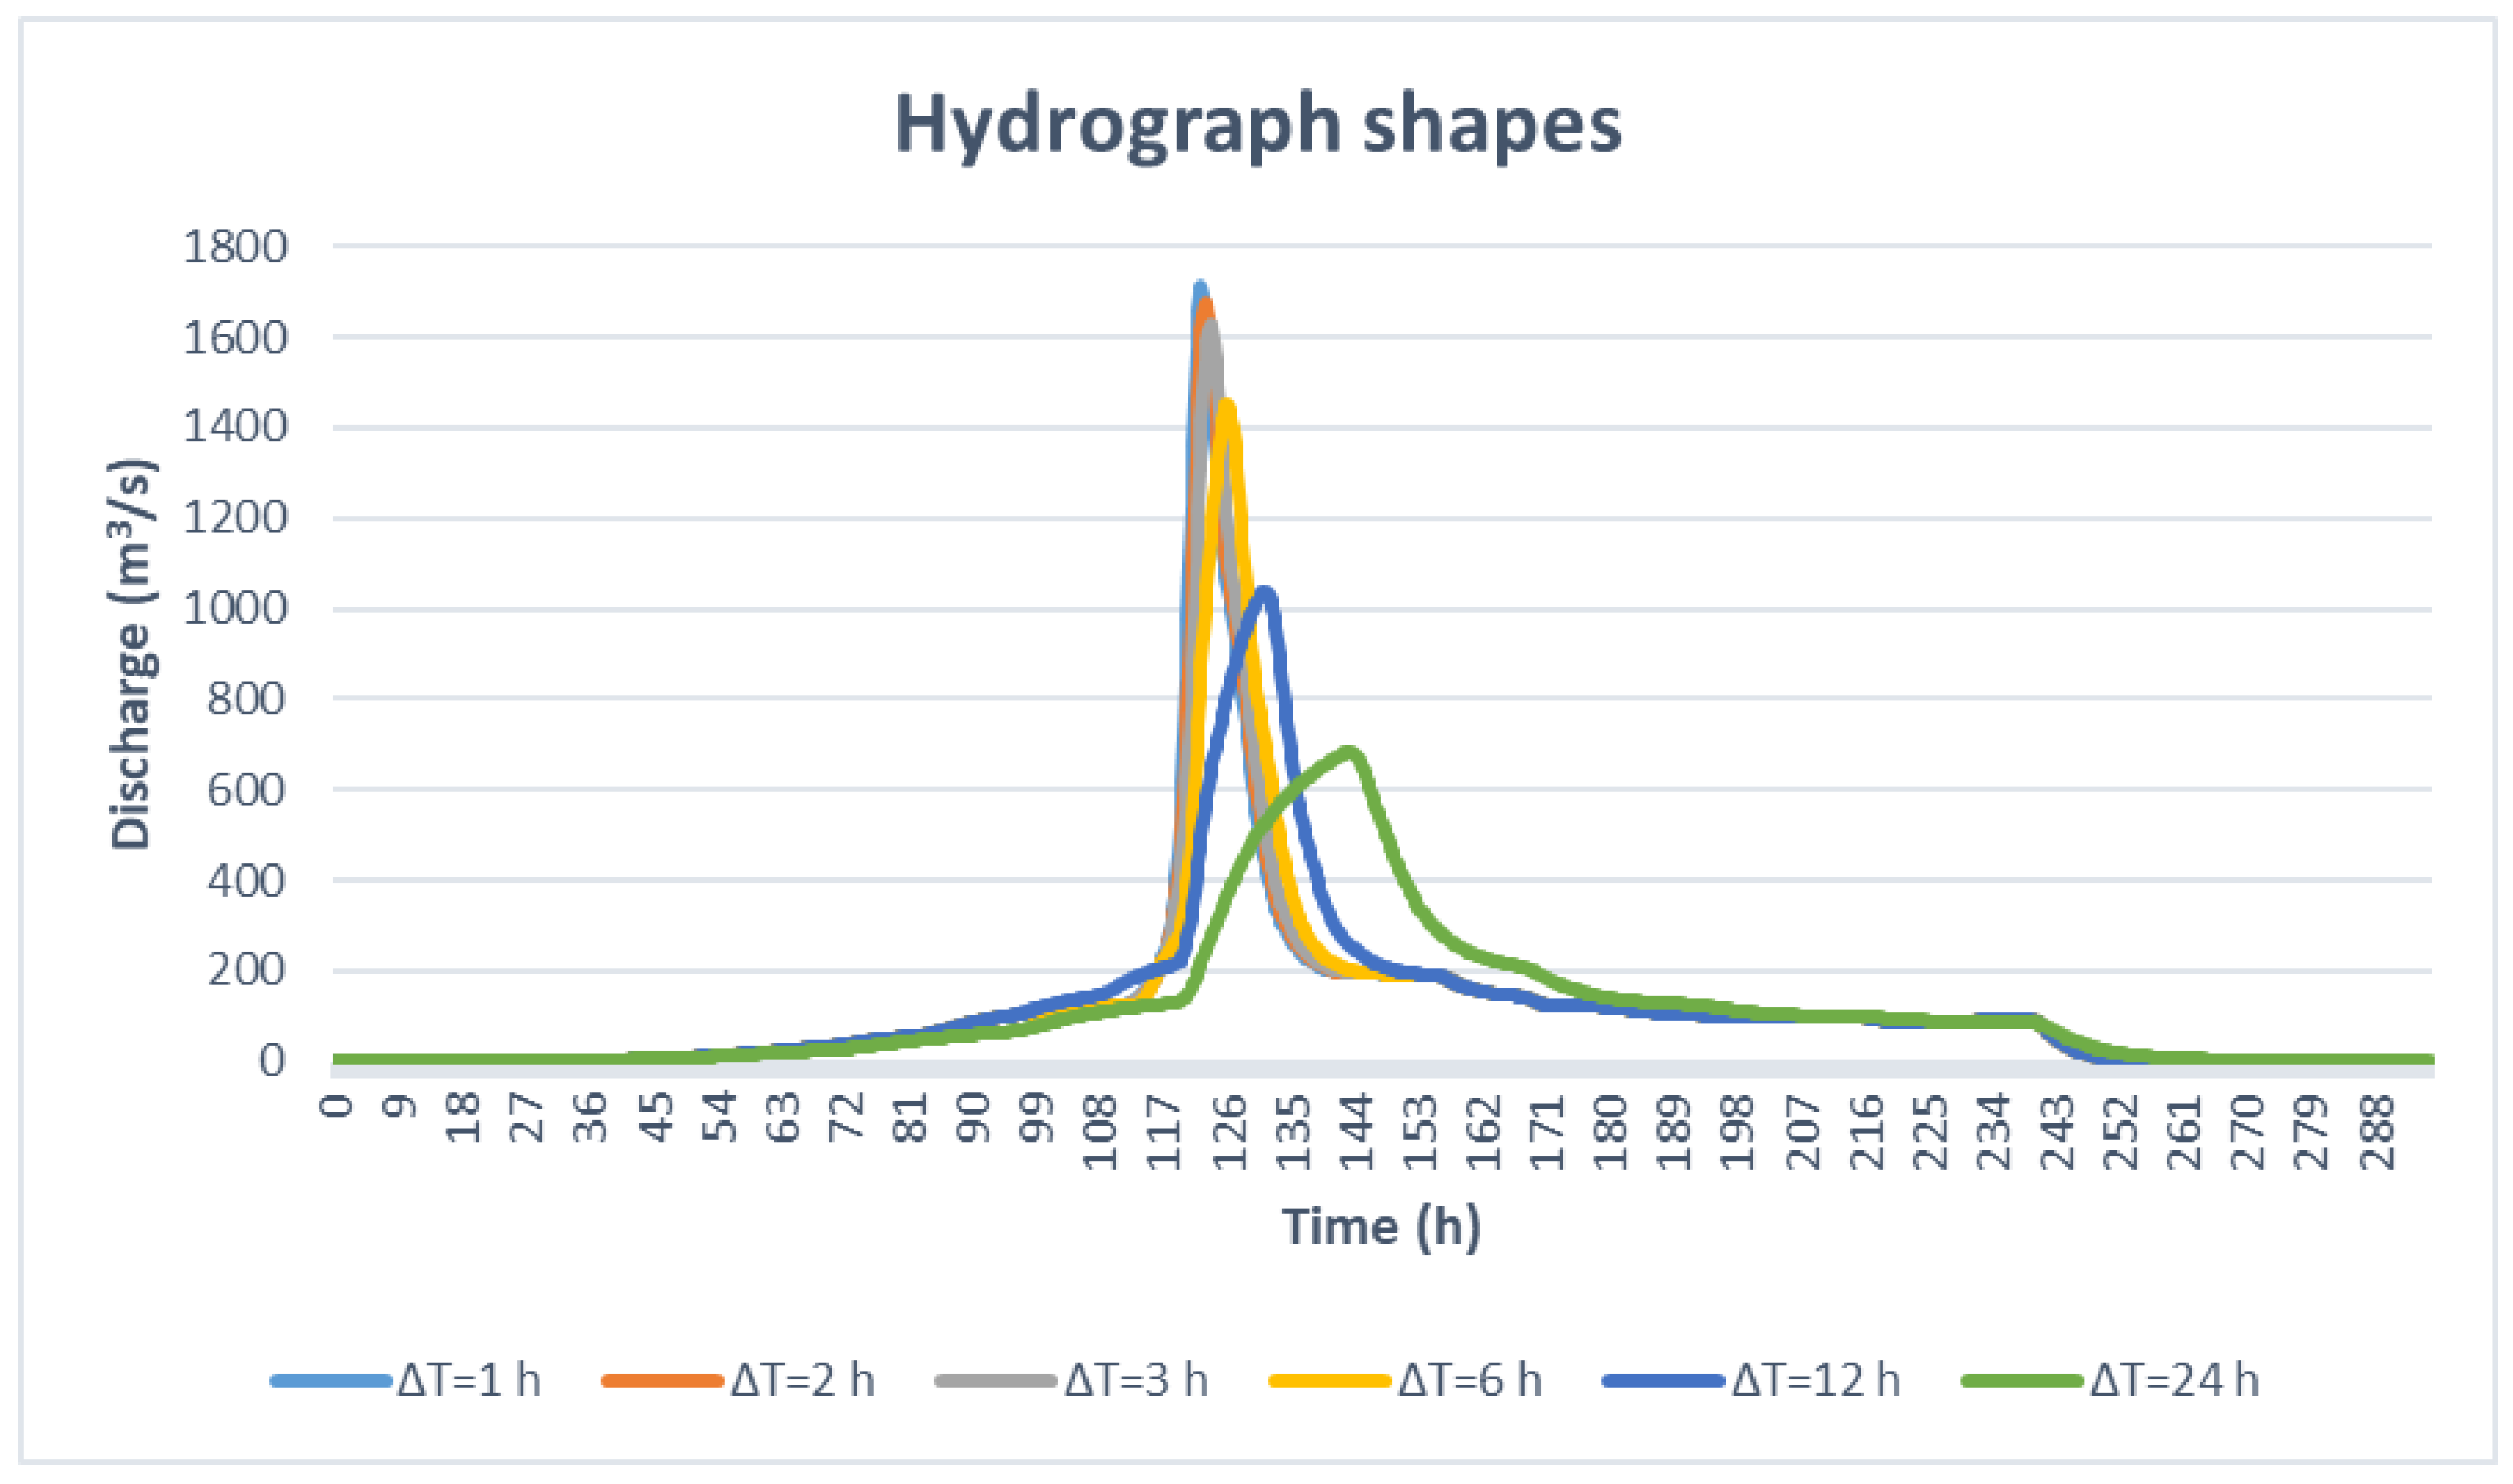
The hydrological model is calibrated to obtain the 1000-year flood peak and the hydrograph volume given by the univariate frequency curves. The peak flow is calibrated with the storage coefficient parameter (K) of the Clark unit hydrograph used as a transform method. The results are shown in
Figure 5 and
Table 1. The figure shows that, with the calibrated K parameter, similar hydrograph shapes are obtained for the time steps of 1, 2, 3, 6 and 12 h. This is not the case for the 24 h time step because the desired peak flow cannot be reached even with the lowest values of the parameter K.
In addition, in order to evaluate the results correctly, the values of the coefficient K obtained for each time step after calibrating the hydrological model are analysed. The table shows that, to obtain the desired peak flow value, high K values are required for small time steps and low K values are required for large time steps.
5. Conclusions
In flood events, hydrological dam safety should be assessed using the frequency curve of maximum reservoir water levels. For this purpose, a large set of inflow hydrographs is routed through the reservoir. Therefore, in this study in Cuerda del Pozo, a stochastic bivariate analysis based on hydrometeorological simulations is performed to assess hydrological dam safety. With this aim, a set of hyetograph shapes and their influence on the shape of the hydrographs are analysed.
The results of the study show that the flood hydrographs obtained before calibrating the hydrological model have lower peak flows and smoother shapes with each hyetograph time step increase. In addition, as the hyetograph time interval increases, the calibrated K parameter becomes smaller. However, for a hyetograph time step of 24 h, even with a very low K parameter value, the peak flow required by the univariate flood frequency curve cannot be achieved.
Author Contributions
Conceptualization, L.M.; methodology, L.M.; software, D.C.-R.; validation, D.C.-R.; formal analysis, D.C.-R.; investigation, D.C.-R. and L.M.; resources, D.C-.R. and L.M.; data curation, D.C.-R. and L.M.; writing—original draft preparation, D.C.-R.; writing—review and editing, D.C.-R. and L.M.; visualization, D.C.-R.; supervision, L.M.; project administration, L.M.; funding acquisition, L.M. All authors have read and agreed to the published version of the manuscript.
Funding
This research was supported by the project (PID2019-107027RB-I0/AEI/10.13039/501100011033) “SAFERDAMS: Assessment of the impact of climate change on hydrological dam safety” funded by the Agencia Estatal de Investigación of the Spanish Ministry of Science and Innovation.
Institutional Review Board Statement
Not applicable.
Informed Consent Statement
Not applicable.
Data Availability Statement
Acknowledgments
The authors would like to acknowledge the Spanish Instituto Geográfico Nacional (IGN) for supplying the DTM; the Spanish Agencia Estatal de Meteorología (AEMET) for supplying the daily precipitation data; the Spanish Centre for Hydrographic Studies of CEDEX and the Sistema de Información del Agua of the Spanish Ministry of Environment for supplying the daily streamflow data; and the SAIH real-time system of the River Douro Basin Authority for supplying sub-daily precipitation data.
Conflicts of Interest
The authors declare no conflict of interest.
References
- Mediero, L.; Jiménez-Álvarez, A.; Garrote, L. Design flood hydrographs from the relationship between flood peak and volume. Hydrol. Earth Syst. Sci. 2010, 14, 2495–2505. [Google Scholar] [CrossRef]
- Klein, B.; Schumann, A.H.; Pahlow, M. Copulas—New Risk Assessment Methodology for Dam Safety. In Flood Risk Assessment and Management; Schumann, A., Ed.; Springer: Dordrecht, The Netherlands, 2011. [Google Scholar] [CrossRef]
- Requena, A.I.; Chebana, F.; Mediero, L. A complete procedure for multivariate index-flood model application. J. Hydrol. 2016, 535, 559–580. [Google Scholar] [CrossRef]
- Wartalska, K.; Kaźmierczak, B.; Nowakowska, M.; Kotowski, A. Analysis of Hyetographs for Drainage System Modeling. Water 2020, 12, 149. [Google Scholar] [CrossRef]
- Alfieri, L.; Laio, F.; Claps, P. A simulation experiment for optimal design hyetograph selection. Hydrol. Process. 2008, 22, 813–820. [Google Scholar] [CrossRef]
- Mishra, S.K.; Singh, V. Soil Conservation Service Curve Number (SCS-CN) Methodology; Water Science and Technology Library (WSTL, Volume 42); Springer: Dordrecht, The Netherlands, 2003. [Google Scholar] [CrossRef]
- Ahmad, M.M.; Ghumman, A.R.; Ahmad, S. Estimation of Clark’s Instantaneous Unit Hydrograph Parameters and Development of Direct Surface Runoff Hydrograph. Water Resour. Manag. 2009, 23, 2417–2435. [Google Scholar] [CrossRef]
- Keifer, C.J.; Chu, H.H. Synthetic storm pattern for drainage design. J. Hydraul. Eng. 1957, 83, 1–25. [Google Scholar] [CrossRef]
| Disclaimer/Publisher’s Note: The statements, opinions and data contained in all publications are solely those of the individual author(s) and contributor(s) and not of MDPI and/or the editor(s). MDPI and/or the editor(s) disclaim responsibility for any injury to people or property resulting from any ideas, methods, instructions or products referred to in the content. |
© 2023 by the authors. Licensee MDPI, Basel, Switzerland. This article is an open access article distributed under the terms and conditions of the Creative Commons Attribution (CC BY) license (https://creativecommons.org/licenses/by/4.0/).


