Abstract
Due to Pakistan’s complex hydro-climatic and topographical features, drought is a severe problem. It is necessary to regionalize various topographical and hydrometeorological occurrences into uniform zones. The regionalization of clusters across Pakistan has been examined and analyzed using the hierarchical classification of principal components (HCPC). Five statistically homogenous zones were made, which were validated through the cluster validation indices. Univariate discordancy tests were run using the drought’s severity and duration as inputs. Over 12 months, drought was regionalized for SPEI time scales, indicating regional discordancy in cluster 4, while cluster 2 had a smaller number of stations, which were further adjusted to ensure homogeneity. The results of this research might be utilized to offer the fundamental information needed to develop a regional drought mitigation plan.
1. Introduction
Since its inception, Pakistan has endured droughts, on average, four out of every ten years, making them a frequent thing among significant catastrophic events. In 1998, Pakistan seems to have had its worst dry spell since 1947, which persisted until 2002 [1]. Weather patterns are directly linked to meteorological drought, which often results from inadequate precipitation over a region [2].
The country has experienced drought as a result of the highest evaporation and transpiration due to global warming. As a result, it is possible to classify the coupled behavior of elements, such as environmental, physical geography, and hydrological features, and to relate drought to factors that are not necessarily independent. In regional modeling analysis, multivariate strategies refer to a group of methods, including hydro-meteorological, climatic, and physiographic factors that must be intimately intertwined.
With a standardized precipitation and evapotranspiration index as the foundation for the k cluster analysis and tree edge removal strategies, drought regionalization was done in Pakistan from 1902 to 2015 [1].
Using PCA, the primary factors causing the deterioration in drinking water quality in Gilgit, northern Pakistan, were investigated [3]. The proper identification of contiguous zones permits a parametric estimate of drought frequency in a regional study, which may be utilized for planning and managing regional drought risk.
The rest of the studies have concentrated on topographical, climatic, and drought factors using at-site (local) multivariate analysis. On the other hand, there have not been a lot of studies performed on the local representation of drought modeling at ungauged locations. The main goal of the project is to regionalize drought using L-moments.
2. Materials and Methods
We have taken the total number of 41 rain gauge stations in Pakistan covering the whole country. The flow chart of our methodology is shown in Figure 1.
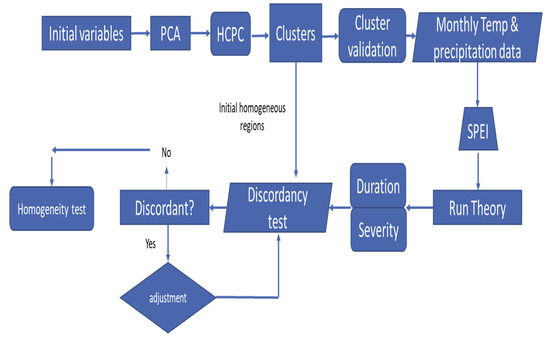
Figure 1.
Study flowchart.
3. Results
3.1. Principal Component Analysis
Each of the eight variables were normalized to have a standard deviation of one and a mean of zero. The inter-correlation matrix revealed a 0.54 correlation coefficient between mean annual precipitation (MAP) and latitude (LAT), and 0.50 between MAP and longitude (Long). Whereas latitude (LAT) and elevation are shown to have a 0.55 correlation coefficient, mean daily maximum temperature (MDMXT) and mean daily minimum temperature (MDMNT) show the strongest correlation with evapotranspiration (ET0) of about 0.8 and 0.79. Elevation (Ele), along with mean annual precipitation (MAP), longitude (Long), and relative humidity (RH), shows a moderate correlation of about 0.16 to 0.3.
3.2. Variances of Each Principal Component (PC)
The correlation matrix is used for principal component analysis. The first four principal components (PC) retained 95.2 percent of the information (variances). The first, second, third and fourth principal component retained 57.9%, 18.6%, 10.6%, and 8.1% of the information (variances) respectively. So, therefore, the major components have been chosen for cluster analysis.
The average contribution of the variables is 12.5%. A contribution higher than this is considered important in contributing to the components. Long and mean annual precipitation (MAP) contributed significantly to the second major component. RH contributed significantly to the third principal component. MAP and LONG contributed significantly to the fourth principal component. Those less important variables for understanding component variability are often excluded from evaluation in the PCA.
3.3. Hierarchal Clustering on Principal Components
The PCA data were analyzed using the HCPC approach. Clusters were initially formed by the technique of HCPC while mapping Pakistan’s geographical space to each location.
Cluster validation indices were used to aid in determining the optimal number of clusters.
3.4. Validation of Cluster Indices
Four cluster validity indices were tested to find the best group of clusters and varying permissible cluster sizes. The silhouette (S) index, the Dunn index, and the Calinski and Harabasz index all maximize their values. When there are five clusters, the DB index becomes minimal [4]. Therefore, when there were five clusters, the values of all validity indices indicated good correlations.
3.5. SPEI-12 Computation
SPEI-12 was estimated for all metrological stations in Pakistan from 1981 to 2018 in a 12-year time frame in this study. The run theory was used to quantify that “the highest mean severities and durations have been found at Badin and Jiwani stations, which are 54.93 and 33 months respectively” [5].
3.6. Discordancy and Heterogeneity Measures
By using “L-moments techniques”, discordancy and heterogeneity values were measured using R-programming. It is decided that cluster 4 has only one station, Bahawalnagar, which is “discordant” and is shifted to cluster 5 of the study area. On the other hand, there was a smaller number of stations than 5. As it is impossible for the clustering algorithm to decide the connectivity and similarities within the cluster when the number of observations is less than 5. So, after shifting the Panjgur station from cluster 5 to cluster 3, the codes were run again, and, finally, we have got the homogeneous clusters, which can be seen in the following cluster map of Pakistan.
L-moments approaches have been performed to examine discordancy and heterogeneity based on the nation’s physiographic and climatic parameters [6]. The cluster analysis findings reveal wide variation in the sites of the three groups, which are largely mountainous, but a strong similarity in the other two. The summary of “L-moments statistics” is given in Table 1 while the clusters which have been evaluated show only discordancy at cluster 4.

Table 1.
Characteristics of clusters evaluated by L-moments discordancy and heterogeneity tests.
We have performed shifting and adjusted these statistical measurements that verified the acceptable homogeneity of the five altered zones. As a result, five homogenous clusters for the study area Pakistan are shown in the Figure 2.
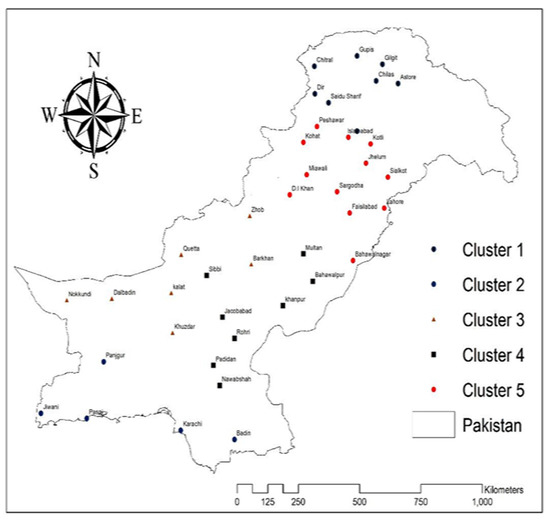
Figure 2.
Homogenous clusters map for the study area of Pakistan.
4. Conclusions
The purpose of this study was to look at the regionalization of drought characteristics in conjunction with other physiographic and climate variables. It seeks to deal with Pakistan’s complicated hydro climatic and topographical aspects. As a result, eight essential hydrologic, climatic, and physiographic criteria were chosen for the regionalization process. Drought characteristics were collected from 41 rainfall sites using the SPEI truncation level technique. The HCPC algorithm, a hybrid of Ward’s classification method, the K-means algorithm, and the PCA methodology, is explored and applied for drought regionalization in Pakistan. The cluster produced by the HCPC technique was used to calculate discordancy and homogeneity for the SPEI-12-time scale.
Author Contributions
All authors contributed equally. All authors have read and agreed to the published version of the manuscript.
Funding
This research received no external funding.
Institutional Review Board Statement
Not applicable.
Informed Consent Statement
Written informed consent has been obtained from the patient(s) to publish this paper.
Data Availability Statement
Not applicable.
Conflicts of Interest
The authors declare no conflict of interest.
References
- Jamro, S.; Dars, G.H.; Ansari, K.; Krakauer, N.Y. Spatio-temporal variability of drought in Pakistan using standardized precipitation evapotranspiration index. Appl. Sci. 2019, 9, 4588. [Google Scholar] [CrossRef]
- Kao, S.C.; Govindaraju, R.S. A copula-based joint deficit index for droughts. J. Hydrol. 2010, 380, 121–134. [Google Scholar] [CrossRef]
- Fatima, S.U.; Khan, M.A.; Siddiqui, F.; Mahmood, N.; Salman, N.; Alamgir, A.; Shaukat, S.S. Geospatial assessment of water quality using principal components analysis (PCA) and water quality index (WQI) in Basho Valley, Gilgit Baltistan (Northern Areas of Pakistan). Environ. Monit. Assess. 2022, 194, 151. [Google Scholar] [CrossRef] [PubMed]
- Hosking, J.R. L-moments: Analysis and estimation of distributions using linear combinations of order statistics. J. R. Stat. Soc. Ser. B 1990, 52, 105–124. [Google Scholar] [CrossRef]
- Rini, D.S.; Novianti, P.; Fransiska, H. Internal cluster validation on earthquake data in the province of Bengkulu. IOP Conf. Ser. Mater. Sci. Eng. 2018, 335, 012048. [Google Scholar] [CrossRef]
- Ullah, H.; Akbar, M.; Khan, F. Construction of homogeneous climatic regions by combining cluster analysis and L-moment approach based on the Reconnaissance Drought Index for Pakistan. Int. J. Climatol. 2020, 40, 324–341. [Google Scholar] [CrossRef]
Disclaimer/Publisher’s Note: The statements, opinions and data contained in all publications are solely those of the individual author(s) and contributor(s) and not of MDPI and/or the editor(s). MDPI and/or the editor(s) disclaim responsibility for any injury to people or property resulting from any ideas, methods, instructions or products referred to in the content. |
© 2022 by the authors. Licensee MDPI, Basel, Switzerland. This article is an open access article distributed under the terms and conditions of the Creative Commons Attribution (CC BY) license (https://creativecommons.org/licenses/by/4.0/).