Abstract
District heating networks are considered to be a key element for the decarbonization of Europe. The RELaTED project seeks to contribute to the decarbonization of these infrastructures with the demonstration of low temperature district heating networks. One of the demonstration sites consists of more than 50 substations within a subsection of a larger network in the city of Tartu (Estonia), where the temperature was lowered by 10 °C. To ensure the benefits of this new generation district heating network and the fulfillment of comfort requirements, data have been monitored and analyzed at the substation level in an automatic way to facilitate the inspection of every user.
1. Introduction
Limiting global warming below 2 °C implies critical actions to reduce Greenhouse Gas (GHG) emissions [1]. The European Union (EU) seeks to mitigate GHG emissions by at least 80% by 2050 relative to 1990 levels. To do so, it is mandatory to transform the energy system from a fossil-based system to a renewable-based system. At the urban scale, where approximately 80% of the global energy consumption takes place [2], it is essential to foster the development of District Heating (DH) systems. Moreover, the need to evolve into smart energy systems with a low carbon footprint is also a crucial element [3].
In recent years, the concept of Low Temperature District Heating Systems (LTDH) has emerged [4,5]. These heating systems allow for the incorporation of low-grade heat sources, the reduction of operational costs and losses, and improved performance levels in heat production plants.
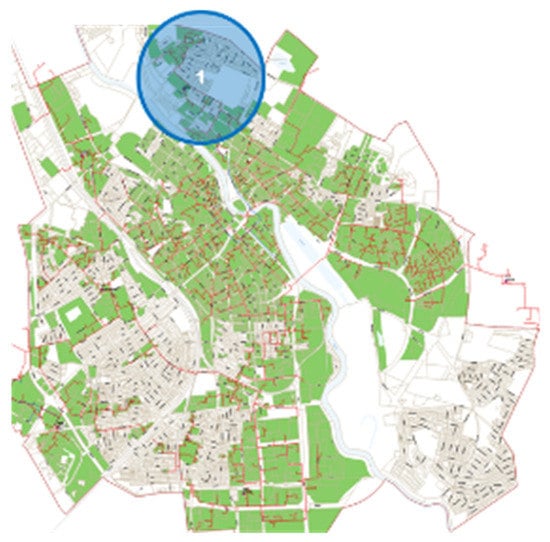
This paper reports on the activities conducted for the LTDH conversion of an existing DH network in Tartu, Estonia. Operation temperature levels were reduced in a subset of the network corresponding to the Tarkon area (marked area in Figure 1). By 2021, the demo area’s length was 5.34 km, with a peak heat load of 4.3 MW and comprising 54 consumers, including buildings with different uses: residential, commercial, educational, and offices.

Figure 1.
Tartu DH network (Estonia), with the demo area highlighted in blue.
The supply temperature curve was reduced by 10–15 °C after the installation of a mixing station equipped with the mixing and booster pumps and valves required to mix the return flow with the supply flow.
In order to ensure both the benefits of temperature reduction (economic and environmental) and the fulfillment of comfort requirements for every costumer, data have been monitored at the substation level in an automatic way to facilitate the inspection of every user. Commonly, this large set of collected data, with more than 6 different data types (mainly inlet, outlet temperature, and flows for both the primary and secondary side of the substation) from over 50 substations collected hourly, makes the inspection of the data a resource-intensive task [6], and normally, only the most important substations are carefully analyzed (bigger ones or those at the end of the line, where normally the problems are encountered). To ease the process, automatization was set up using Python.
The present document presents the methodology used and the main lessons learnt from this process.
2. Materials and Methods
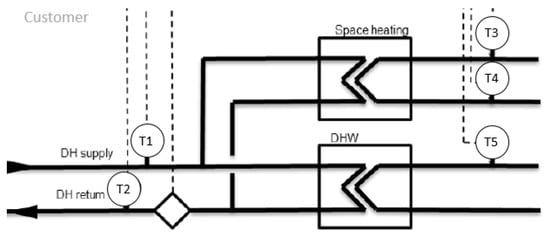
A dedicated monitoring system was deployed at the mixing chamber and substation level, as shown in Figure 2. The data are recorded hourly and are stored in a database owned by GREN Tartu (formerly AS Fortum Tartu), the DH operator.

Figure 2.
Substation configuration and meters of the Tartu DH network subset.
For this purpose, an automatic inspection of substations based on data visualization was developed in Python. Threshold levels were also defined so that the substations with improper performance were tagged for further analysis by the engineering team.
The system provides the following outputs.
2.1. Primary Side Temperatures (T1 and T2)
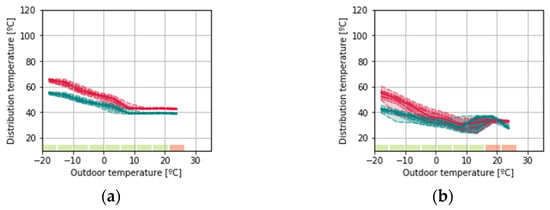
Figure 3 shows the relationship between the supply temperature (red line of the figure) and the outside air temperature. Additionally, the return temperature (blue line of the figure) is also represented to determine whether there have been any issues.

Figure 3.
Primary side temperatures of properly working substations (a) and substations with issues (b,c).
2.2. Secondary Side Temperatures (T3 and T4)
Figure 4 shows the relationship between the DH system supply temperature and the outside air temperature. Additionally, the return temperature is also represented to determine whether there have been any issues.

Figure 4.
Primary side temperatures of a properly working substation (a) and substations with issues (b).
2.3. Domestic Hot Water (T5)
Figure 5 shows the average temperature of the DHW on the customer side at the different hours of the day for those temperatures belonging to the horizontal part of the heating curve (any given outdoor temperature above 10 °C).

Figure 5.
DHW temperature of a properly working substation (a) and a substation with an issue (b).
3. Lessons Learnt
The automatic analysis of the continuously monitored data from over 50 substations draws the following conclusions:
- Data monitoring is an essential tool for DH optimization, but it is time consuming to analyze large sets of data in a traditional way.
- The automatization of data analysis is beneficial to improve the operation of the DH, allowing issues to be identified in real time.
- Automatic data analysis can be performed at a low computational cost. One year of hourly data from 54 substations were analyzed, along with the consequent production of warnings generated upon sub-optimal behavior, in less than 10 min with a laptop.
- Large DH operators often lack this kind of service, instead focusing on the analysis of the biggest consumers to optimize the service or being reactive to consumer complaints. A proactive approach to further optimize DH operation has yet to be exploited.
Author Contributions
Conceptualization, R.G.-M.; methodology, O.E., A.G.-M. and R.G.-M.; software, O.E.; formal analysis, O.E.; investigation, O.E. and A.G.-M.; field data collection: M.R. and I.H.; data curation, O.E. and A.G.-M.; writing—original draft preparation, A.G.-M. and O.E.; writing—review and editing, R.G.-M.; visualization, O.E.; supervision, A.G.-M. and R.G.-M.; project administration, R.G.-M. All authors have read and agreed to the published version of the manuscript.
Funding
This project has received funding from the European Union’s Horizon 2020 research and innovation program under grant agreement No. 768567. This publication only reflects the authors’ views, and neither the Agency nor the Commission are responsible for any use that may be made of the information contained herein.
Data Availability Statement
Due to privacy issues, data should not be shared.
Conflicts of Interest
The authors declare no conflict of interest. The funders had no role in the design of the study; in the collection, analyses, or interpretation of data; in the writing of the manuscript; or in the decision to publish the results.
References
- The Paris Agreement, UNFCCC. Available online: https://unfccc.int/process-and-meetings/the-paris-agreement/the-paris-agreement (accessed on 18 December 2019).
- European Commission Cities. Available online: https://ec.europa.eu/clima/policies/international/paris_protocol/cities_en (accessed on 19 December 2019).
- Lund, H.; Werner, S.; Wiltshire, R.; Svendsen, S.; Thorsen, J.E.; Hvelplund, F.; Mathiesen, B.V. 4th Generation District Heating (4GDH): Integrating smart thermal grids into future sustainable energy systems. Energy 2014, 68, 1–11. [Google Scholar] [CrossRef]
- Garrido Marijuan, A.; Garay, R.; Lumbreras, M.; Sánchez, V.; Macias, O.; Rozas, J.P.S.D. RELaTED Project: New Developments on Ultra-Low Temperature District Heating Networks. Proceedings 2020, 65, 8. [Google Scholar] [CrossRef]
- Garay-Martinez, R.; Sanchez Zabala, V. RELATED, A Flexible Approach to the Deployment and Conversion of DH Networks to Low Temperature, with Increased Use of Local Solar Systems. Solar District Heating, Graz, 2018. Available online: https://www.solar-district-heating.eu/wp-content/uploads/2018/06/Proceedings-SDH-2018.pdf (accessed on 20 December 2021).
- Lumbreras, M.; Garay-Martinez, R.; Garrido Marijuan, A. Energy Meters in District-Heating Substations for Heat Consumption Characterization and Prediction Using Machine-Learning Techniques. In IOP Conference Series: Earth and Environmental Science; IOP Publishing: Bristol, UK, 2020. [Google Scholar] [CrossRef]
Publisher’s Note: MDPI stays neutral with regard to jurisdictional claims in published maps and institutional affiliations. |
© 2021 by the authors. Licensee MDPI, Basel, Switzerland. This article is an open access article distributed under the terms and conditions of the Creative Commons Attribution (CC BY) license (https://creativecommons.org/licenses/by/4.0/).