Abstract
The location-allocation of nursing homes was examined by combining the entropy weight evaluation model and robust allocation model. The data of the elderly in Xuhui District in 2024 after the pandemic were used in this study. We constructed an evaluation index system by establishing the evaluation index principle of nursing homes’ location. Secondly, the polyhedral uncertainty set was used to predict the number of critical patients, and a model of robust configuration with capacity limitation and time constraints was constructed to minimize costs. The entropy weight method provided empirical results for the selection of nursing homes, and the robust configuration model ensured timely medical treatment. The feasibility and robustness of the mathematical model and solution method were verified, and the performance and advantages of the uncertain model over the deterministic model were proved.
1. Introduction
After the epidemic, health-related policies related to the lifestyle of the elderly were changed. Now, it is necessary to take the initiative to make adaptive adjustments [1]. The Geriatric Society of the Chinese Medical Association classifies the elderly into completely self-reliant, semi-self-reliant, disabled, and mentally disabled according to their physical conditions [2]. The needs for nursing homes are different for different elderly people. For example, self-care needs often focus on enriching their quality of life [3]. Although the semi-disabled, disabled, and mentally disabled elderly have different needs, they all pay attention to the intervention of medical emergency resources and the provision of professional care [4,5,6]. As far as the most urgent health needs of the elderly are concerned, services for elderly care, mainly medical care and rehabilitation nursing, are inadequate and unbalanced, and the inadequate integration of medical resources and elderly care resources is widespread, which fails to ensure the health needs of the elderly [7]. However, there has been no research on the allocation of nursing homes based on the entropy weight scoring model combined with the robust allocation model. We collected data from the nursing homes in the Xuhui District of Shanghai in China and applied the entropy weight method to screen nursing homes and build a corresponding robust allocation model for the patients of critical and emergency conditions. Large hospitals can be assigned to the selected optimal nursing homes to provide timely treatment when patients’ conditions deteriorate.
2. Model of Nursing Home Selection
The entropy weight method is used for weight calculation to determine objective weights according to the amount of information. The weight is used to effectively reduce subjective factors [8,9,10,11,12]. In this study, the entropy weight method was used to score nursing homes to further develop their medical and nursing care.
Evaluation Index System
Indicators should be selected based on their objectivity, authenticity, comprehensiveness, representativeness, and ease of use [8,13]. To ensure that the selected indicators accurately reflect the situation of the alternative nursing homes, official data is required to eliminate subjective bias. According to the principles of selecting evaluation indicators, the target, criterion, and index layers of the evaluation index system of the nursing homes were established based on factors such as service, scale, and transportation (Figure 1).
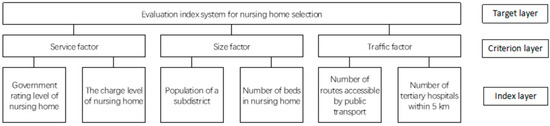
Figure 1.
Evaluation index system of nursing home selection.
The index layer included six evaluation indicators: government rating level of nursing homes, charging level of nursing homes, population number of street districts, number of beds in nursing homes, number of accessible lines of public transportation, and number of tertiary hospitals within the 5 km radius of nursing homes. In terms of service, according to the content of the “Shanghai 2023 Grade Evaluation Results of Nursing Homes in Shanghai” published by the Shanghai Civil Affairs Bureau, the standards of 5-2 and service level 5 carried the highest weights. Nursing homes ratings were used to determine their evaluation levels, with unrated homes assigned level 1. The charging standard for each nursing home was based on the lowest starting price announced online, as it is accurate and representative. Regarding scale, factors such as the district population and the number of beds in nursing homes were considered to determine the upper limit of service capacity that meets the medical and nursing needs of the resident population in each administrative area. For transportation, the number of accessible public transportation routes of nursing homes was used to measure the convenience of transportation and the accessibility of patients, and the number of tertiary hospitals within a 5 km radius of the nursing homes was used to measure the timeliness of emergency treatment for patients, ensuring medical support from nearby large-scale, high-quality tertiary hospitals in case patients’ conditions worsen.
After the evaluation index set was determined, a screening scheme of nursing homes based on the entropy weight scoring model was developed by referring to the entropy weight scoring model in previous studies. Firstly, nursing homes in the Xuhui District were selected. Secondly, the data were obtained from the public offices, including the Civil Affairs Bureau, the Public Security Bureau, and the official website of the district government, and the six evaluation indicators were converted into operable objective values. Among them, the rating level of each nursing home by the government was converted and assigned as scores: the 1–5 star rating was assigned with 1–5 points. As a charging standard, the lowest monthly starting price advertised by the nursing homes was used. The discount factor of the actual transaction price and the premium factor of value-added services were also considered. The population of the district was used as the number of permanent residents in the streets or towns where the nursing homes were located, to show the overall demand and pressure for elderly care. The number of the elderly people served at a nursing home was approximately equal to the number of beds it operated, and the number of beds was recorded by the Health Commission. The number of accessible public transport routes was estimated using the number of bus and subway lines announced by the government transport department. The number of tertiary hospitals within the 5 km radius was determined by calculating the actual distance between the nursing homes and all tertiary hospitals in the Xuhui District using the longitude and latitude coordinates. The data were converted into the original index matrix Xnm, and the information entropy and corresponding weight of each index were calculated during data standardization processing. Finally, the score of each nursing home was obtained to evaluate the merits and demerits of the nursing homes. Nursing homes with high scores were selected as the best nursing homes.
3. Mathematical Model of Nursing Home Allocation
In the entropy weight method [13], i (i ∈ I, i = 1, 2,…, n) represents the nursing homes and large high-quality tertiary hospitals configured to ensure that elderly patients with critical emergencies are treated in time. Based on the emergency materials allocation model [14], the minimum total cost was used as the input for the objective function to build an allocation model for nursing homes, with the restriction of emergency beds and time for emergency treatment in high-quality tertiary hospitals for critically ill patients in this study. For the convenience of model construction, the nursing homes established in the Xuhui District of Shanghai were assumed to meet the daily nursing and regular medical needs of all elderly individuals. The scope of nursing home services included residential areas of a street or town, and their occupancy was calculated as the sum of the number of people receiving services. Nursing homes provide daily care and routine treatment for mild or moderate elderly patients, but patients with critical emergencies need to be treated by high-quality tertiary hospitals with complete medical conditions, and the tertiary hospitals must meet the emergency treatment needs of all elderly patients with critical emergencies.
When the number of type k patients dik in nursing home i is known, the deterministic model (DM) [14,15,16] was constructed as follows. The travel cost of elderly patients with critical emergencies transferred from nursing homes to high-quality tertiary hospitals and the penalty cost of the delayed emergency treatment time were calculated using the functions of total cost minimization as Equations (1) and (2).
4. Case Studies
4.1. Data Acquisition and Analysis
Data were obtained from the Shanghai Civil Affairs Bureau. The elderly aged 60 and above accounted for 37.4% in Shanghai at the end of 2023, exceeding 5.68 million. The Xuhui District had a high aging population (with the population of the elderly over 60 being 0.35 million, accounting for 36.7%). There are 13 administrative divisions in the Xuhui District. We classified the needs of elderly care and medical treatment by street or town. There are 25 nursing homes and 8 high-quality hospitals above grade 3. The population of each street and town was obtained from the statistical data announced by the Xuhui District Public Security Bureau in 2024. The number of beds served by nursing homes was approximately equal to the number of beds operated by nursing homes, and the number of beds operated was the recorded number in the Health Commission. The number of emergency beds in a tertiary hospital was taken as the maximum capacity of the emergency treatment that the hospital provided (Table 1, Table 2 and Table 3). The distance between nursing homes and high-quality tertiary hospitals was converted from longitude and latitude coordinates to the distance between two points. Equation (3) was used to convert the two latitude and longitude coordinates to the actual distance hij between the position points i and j, where (ai, bi), (aj, bj) are the longitude and latitude coordinates of the two positions; R is the radius of the Earth, with R = 6370 km; π is 3.141593; and A is 180°.

Table 1.
Population of the Xuhui District in April 2024.
Table 2.
Coordinates and service capacity of nursing homes in the Xuhui District.
Table 3.
Coordinates and number of beds in high-quality tertiary hospital.
After obtaining the data, the entropy weight method was applied to determine four evaluation indicators, namely, the government rating level of nursing homes, the number of beds in nursing homes, the number of accessible lines of public transportation, and the number of tertiary hospitals within the 5 km radius around nursing homes as positive indicators, while the charging level of nursing homes and the population of sub-districts were determined as negative indicators. The data matrix was standardized.
After calculating pij and corresponding entropy ej using the standardized data, the information entropy and entropy weight of the size evaluation indicators were calculated. High weights were observed for the government rating level of nursing homes, the number of tertiary hospitals within 5 km, the population of a subdistrict, and the number of beds in nursing homes. The patients with critical illness were most concerned about the service quality of nursing homes, and the speed and convenience of transferring to tertiary hospitals for emergency treatment, as shown in Table 4 and Table 5.
Table 4.
Information entropy and entropy weight.
Table 5.
Entropy weighting method and ranking.
The distance ℎij between each nursing home and the high-quality tertiary hospital was obtained as shown in Table 6. Other relevant parameters included the following: ct = 20, cp = 1000, vj = 30 km/h, tE = 15 min, tL = 30 min; θ1 = 0.5, θ2 = 0.4, and θ3 = 0.1. When the uncertainty level Γk was considered, the range of variation was assumed to be the same, that is Γk = Γ, and both Γ were assumed to be integers. Regarding the robust disturbance ratio, the proportion of disturbance ξ was gradually enlarged to be 2, 5, 10, and 20%. The greater the proportion, the stronger the uncertainty. Under this assumption, the range of changes in the number of critically ill patients in each nursing home was obtained as shown in Table 7.
Table 6.
Distance from each nursing home to the large tertiary hospital (in meters).
Table 7.
Number of patients in each nursing home under different disturbance proportions.
4.2. Result Analysis
The perturbation ratio was introduced to depict the uncertainty of the number of critical emergency patients in nursing homes. The limited emergency reception capacity of the tertiary hospitals affected the optimal allocation of nursing homes, and tertiary hospitals may be affected as well. When the disturbance ratio was 2%, the configuration scheme was (2-2, 1-2, 22-2, 25-2, 11-2, 5-2, 24-2, 4-1, 10-4, 19-2), with the former representing nursing homes and the latter representing large high-quality tertiary hospitals cooperating with them. The configuration scheme is shown in Figure 2. The blue dots represent the 10 optimal nursing homes, and the orange dots represent the configured high-quality tertiary hospitals. The connection indicates the configuration relationship between them. The horizontal and vertical axes represent the longitude and latitude coordinates of each nursing home and tertiary hospital. The elderly care and medical emergency treatment of each nursing home were met, and the best nursing home cooperated with a large high-quality tertiary hospital to provide medical emergency treatment. The locations of the best nursing homes were evenly distributed, ensuring that the daily needs of elderly care and medical emergency treatment of community residents in the street or town were effectively met, and the total referral distance of critical emergency patients was shortened.
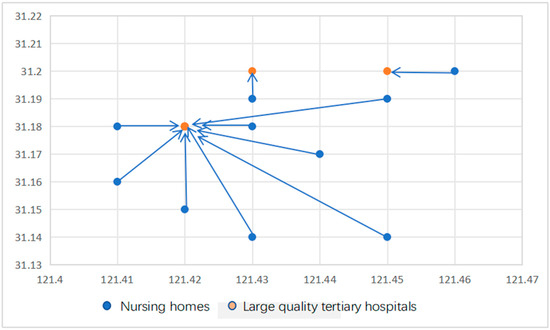
Figure 2.
Configuration scenario with disturbance ratio of 2%.
As shown in Table 8, with the uncertain number of critical emergency patients, the optimal allocation plan of high-quality tertiary hospitals to provide medical emergency treatment for critically ill patients in nursing homes was not changed. The optimal configuration scheme was neither changed with the change in the disturbance proportion, and remained optimal, which proved the validity of the model.
Table 8.
Configuration schemes between nursing homes and hospitals with different disturbance proportions.
In the Xuhui District of Shanghai, the optimal choice of nursing homes with medical characteristics and the configuration scheme of tertiary hospitals were examined. By analyzing the influence of uncertain parameter combinations on the configuration scheme and target costs, the significance of robust optimization of the model was verified.
5. Conclusions
We developed a selection method for nursing homes and their combination with high-quality tertiary hospitals in the Xuhui District of Shanghai, where the daily nursing needs and the number of medical emergency treatments were uncertain. After considering various objective influencing factors, six evaluation indexes were identified, and the best nursing homes were selected using the scoring model with the entropy weight method. The number of critical emergency patients was estimated by using the uncertainty set, and a robust configuration model was constructed with the objective function of minimizing the total cost. High-quality tertiary hospitals were configured for the best nursing homes to ensure that critical emergency patients admitted to the nursing homes can receive timely emergency treatment. The entropy weight method provided an empirical reference for the selection of nursing homes in the post-epidemic era. The robust allocation model provides a feasible reference for the allocation scheme of nursing homes and high-quality tertiary hospitals when the number of people in need of daily rehabilitation and medical emergency treatment is uncertain. Therefore, the model can be a feasible solution for establishing a reasonable and comprehensive medical support mechanism combining daily rehabilitation and medical emergency treatment for the effective control of medical emergency treatment for elderly patients with critical illness.
Author Contributions
Conceptualization, W.D. and B.Z.; methodology, W.D.; software, B.Z.; validation, B.Z.; formal analysis, W.D.; investigation, W.D.; resources, B.Z.; data curation, W.D.; writing—original draft preparation, W.D.; writing—review and editing, B.Z. All authors have read and agreed to the published version of the manuscript.
Funding
This research received no external funding.
Institutional Review Board Statement
Not applicable.
Informed Consent Statement
Not applicable.
Data Availability Statement
Links to publicly archived datasets analyzed or generated during the study are provided, including but not limited to: https://mzj.sh.gov.cn/MZ_zhuzhan23_0-2-8/20231110/76cddcd507f94cc7978308338ff12d80.html; https://mzj.sh.gov.cn/2024bsmz/20240706/73924c349f4d475a9d46b6019f1a396b.html.
Conflicts of Interest
The authors declare no conflicts of interest.
References
- Xiang, X.N.; Yang, L.; Guo, H.; He, C.Q. Current situation and development of three-level model of health care integration under the aging trend. Chin. J. Rehabil. Med. 2022, 37, 269–272. [Google Scholar]
- Sun, J.J.; Jiang, W.K.; Chen, Y.X. The elderly service system combining medical and nursing care: Policy implications and practice path. J. Beijing Sch. Adm. 2023, 2, 109–118. (In Chinese) [Google Scholar]
- Zhu, K.L.; Zhu, M.F.; Jiang, W.H. Practical exploration and countermeasures on the mode of combining medical care and nursing care. Shandong Soc. Sci. 2020, 132–137. [Google Scholar] [CrossRef]
- Zhang, S.F. Government behavior and market Mechanism in the Construction of China’s elderly care service System. Soc. Secur. Rev. 2021, 5, 129–145. [Google Scholar]
- Wu, Y.; Zhang, X.; Wang, H.Q. Exploration of comprehensive home-based care service System in urban communities in China—Learning from Japanese comprehensive care system. Dongjiang J. 2022, 39, 26–34. [Google Scholar]
- Huang, J. Integration and empowerment: Research on optimization of community embedded elderly care service model. Academia 2022, 5, 151–160. (In Chinese) [Google Scholar]
- Han, K.Q.; Shen, C. Elderly care services and common prosperity: A case study of Zhejiang Province. Soc. Secur. Res. 2023, 3–18. [Google Scholar]
- Ji, Y.; Yan, M.-F.; Liu, C. Research on robust location allocation of emergency medical points in COVID 19. J. Saf. Environ. 2023, 23, 193–204. [Google Scholar]
- Wang, G.; Shang, L.Z.; Liu, X.L. Study on causes of roadway poisoning and asphyxia by AHP-entropy weight method. China Saf. Sci. J. 2021, 7, 187. [Google Scholar]
- Ma, X.F.; Lv, Y.X. Identification and measurement of urban residents’ happiness level in response to tourism urbanization agglomeration in Zhangjiajie. J. Nat. Resour. 2020, 35, 1647–1658. [Google Scholar]
- Ding, T.; Zhai, D.-N. Evaluation of financing capacity of logistics industry based on entropy value method. Logist. Eng. Manag. 2024, 46, 182–184+172. [Google Scholar]
- Zhao, H.; Wu, C.F.; Liang, M.M. Spatial and temporal analysis of carbon emission reduction capacity in Gansu Province based on entropy method. J. Lanzhou Vocat. Tech. Coll. 2023, 39, 15–19. [Google Scholar]
- Chen, G.; Fu, J.Y. Emergency medical mobile hospital robust location problem in post-disaster under demand uncertainty. Chin. J. Manag. Sci. 2021, 29, 213–223. [Google Scholar]
- Hu, S.L.; Han, C.F.; Meng, L.P. Stochastic programming model of emergency supplies allocation considering enterprise production capacity reserve. Syst. Eng. Theory Pract. 2018, 38, 1536–1544. (In Chinese) [Google Scholar]
- Ni, W.H.; Chen, T. Location selection of emergency logistics distribution center based on clustering and center of gravity method. J. Nanjing Tech Univ. (Nat. Sci. Ed.) 2021, 43, 255–263. [Google Scholar]
- Zhu, X.L.; Wen, X.M.; Liu, H.J. Research on emergency resource allocation model of expressway traffic emergencies. Technol. Econ. Areas Commun. 2020, 22, 1–4. [Google Scholar]
Disclaimer/Publisher’s Note: The statements, opinions and data contained in all publications are solely those of the individual author(s) and contributor(s) and not of MDPI and/or the editor(s). MDPI and/or the editor(s) disclaim responsibility for any injury to people or property resulting from any ideas, methods, instructions or products referred to in the content. |
© 2025 by the authors. Licensee MDPI, Basel, Switzerland. This article is an open access article distributed under the terms and conditions of the Creative Commons Attribution (CC BY) license (https://creativecommons.org/licenses/by/4.0/).