Abstract
Urban air pollution poses a significant challenge to public health and sustainable development, particularly in mid-sized cities with limited monitoring capabilities. This study investigates the impact of Nature-Based Solutions (NBS) on air quality and Land Surface Temperature (LST) in Guimarães, Portugal. The first phase involves mapping pollutants and assessing European guidelines, traditional monitoring methods, and emerging tools such as sensors and satellite data. The findings indicate gaps in spatial coverage, emphasizing the importance of integrating data from Sentinel-3, Sentinel-5P, local sensors, and drones. These insights establish a foundation for the next phase, which involves predictive modeling of NBS, LST, and pollutants using machine learning techniques to support data-driven policy-making.
1. Introduction
Cities are increasingly facing challenges related to air pollution, identified by the World Health Organization (WHO) as one of the leading environmental risks to health and urban quality of life. Air pollution contributes to millions of premature deaths due to exposure to harmful pollutants such as particulate matter (PM2.5 and PM10), nitrogen oxides (NOx), ozone (O3), and other toxic compounds []. This issue is particularly severe in densely populated areas where industrial emissions, traffic, and climate change converge. Despite growing awareness, many cities continue to struggle with accurately assessing the environmental and social impacts of air pollution. This difficulty stems partly from the limited coverage of monitoring stations, which hampers comprehensive spatial and temporal analyses of pollution levels [].
The absence of high-resolution spatial and temporal data complicates our understanding of the environmental and social impacts of pollution, making it challenging to implement effective strategies such as low-emission zones, green spaces, and sustainable urban infrastructure. However, technologies like remote sensing, machine learning, and predictive modeling have emerged as promising solutions to address these limitations [].
Simultaneously, Nature-Based Solutions (NBS) have been researched for their beneficial effects on air quality and urban health. Green infrastructure—such as parks, vegetated corridors, and green roofs—enhances biodiversity, thermal regulation, and the reduction of pollutants, including particulate matter and greenhouse gases [,]. Numerous studies have demonstrated that NBS are effective at decreasing Land Surface Temperature (LST), particularly in densely built urban areas, using spatial analyses based on remote sensing data [,,]. Vegetation, through shading and evapotranspiration, significantly lowers LST, which can positively influence the dispersion and concentration of air pollutants []. However, there remains a shortage of studies that spatially quantify the impact of NBS on air quality while also considering LST as a mediating or moderating variable.
This study aims to assess how NBS affect urban air quality and LST in Guimarães, Portugal, by utilizing remote sensing data and machine learning. This integrated approach intends to enhance our understanding of the environmental impacts of NBS in urban contexts, thereby supporting the planning of more resilient and sustainable cities while also encouraging the use of complementary technologies to measure, record, and report air pollution data.
The research is structured in two phases. The first phase, presented in this paper, focuses on the regulatory frameworks and air quality monitoring methods in Guimarães, and also identifies suitable mapping approaches and remote sensors for pollutant detection, particularly given the small spatial scale of local NBS. To guide this initial phase, we have defined the following research questions:
- (1)
- Which air pollutants are mandatorily monitored in Guimarães, and what regulations govern this process?
- (2)
- What approaches and sensors, including those based on remote sensing, are available to measure air pollutants in urban areas, and which are most suitable for small-scale analysis?
The second phase of the study will involve applying multitemporal analyses and machine learning algorithms to model patterns of LST and air pollution, evaluating their correlation with the presence and development of NBS in the region. The guiding research question for this upcoming phase is as follows:
- (1)
- What is the impact of small-scale NBS on urban air quality, and how is it related to variations in LST?
2. Materials and Methods
2.1. Study Area
Guimarães, located in northern Portugal within the Braga district, was chosen as the study area due to its national and European leadership in sustainable urban planning. With a population of approximately 156,800 inhabitants and an average population density of 868 people per square kilometer, the city has been a model for implementing NBS since 2013, focusing on climate impact mitigation, environmental restoration, and enhancing urban quality of life (Figure 1) [].
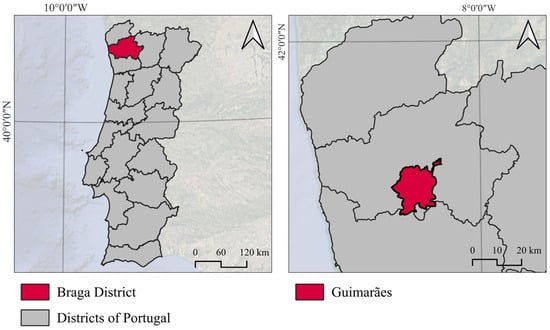
Figure 1.
The location of Guimarães, Portugal.
Recognized as the European Green Capital for 2026 and 1 of the 112 cities selected by the European Union to achieve carbon neutrality by 2030 [], Guimarães possesses unique environmental characteristics influenced by its proximity to the Atlantic Ocean (about 40 km away) and the surrounding mountainous areas. These features make the city vulnerable to rising temperatures and extreme weather events, as reported by the Portuguese Institute for Sea and Atmosphere (IPMA) []. Additionally, Guimarães has a well-established urban network and multiple NBS initiatives at both the local and global scales (Figure 2). However, the small spatial extent of these initiatives poses challenges for detection using low-resolution remote sensors.
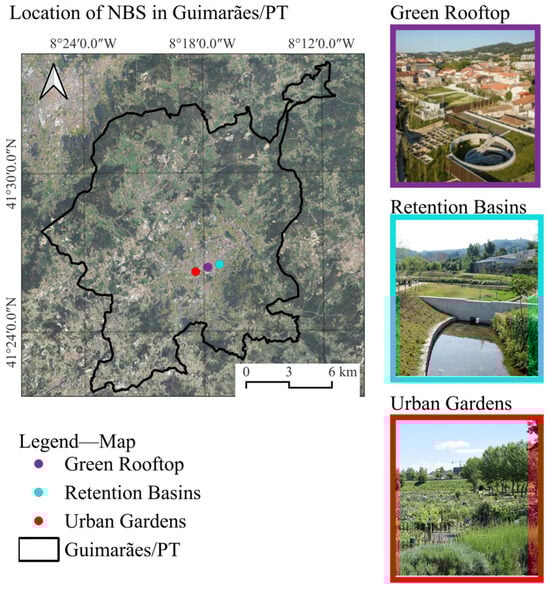
Figure 2.
The location of the NBS located in the urban area of Guimarães, Portugal.
Thus, Guimarães provides a real-world urban context with concrete environmental initiatives and accessible data, making it an ideal setting for applied analyses that can support adaptive urban planning, environmental public policies, and accurate reporting of pollution and climate data—factors that are essential for achieving climate goals.
2.2. Regulatory, Technical, and Methodological Survey of Applicable Sensors and Approaches
A document analysis was conducted to identify the primary European guidelines and regulations used to assess air quality in Guimarães, based on the Green City Accord (GCA) program, to which the city is a signatory and responsible for submitting reports []. This review allowed for the analysis of applicable directives, mandatory monitoring pollutants, reference standards, and recognized measurement methods. Additionally, a systematic review was undertaken to examine the primary approaches currently employed to measure air pollution in urban areas, encompassing both traditional methods and emerging technologies, based on scientific articles and the gray literature. The goal was to identify measurement methods that could support future validation efforts or complement the use of remote sensing data. Furthermore, strategic mapping was conducted, focusing on the main platforms and spaceborne sensors capable of detecting pollutants or correlated variables, such as Aerosol Optical Depth (AOD), which is widely used as an indirect indicator of airborne particulate matter. The aim was to determine which variables need to be measured and which available approaches and sensors are most applicable for use in the second phase of this study.
3. Results and Discussion
Due to the exploratory nature of this study, the results primarily focus on the regulatory and technical landscape that will support the upcoming modeling stage. Guimarães is a signatory of the GCA, a European Union initiative that unites cities committed to improving air and water quality, enhancing biodiversity, and reducing noise pollution and urban waste generation []. This institutional commitment strengthens the adoption of integrated environmental policies; however, its effectiveness is contingent on the local technical capacity and the diversity of the monitoring methods available.
In terms of air quality, the GCA mandates that cities monitor pollutant levels, keeping them close to or below the thresholds established by the Ambient Air Quality Directives (AAQD) 2008/50/EC and 2004/107/EC (effective until 2029), as well as the new Directive (EU) 2024/2881 (effective from 2026), along with the 2021 WHO guideline values (Table 1). The pollutants that are mandatory for monitoring include fine PM2.5, PM10, and NO2 []. These pollutants have direct health impacts: PM2.5 can penetrate deeply into the lungs and bloodstream, contributing to respiratory and cardiovascular diseases; PM10 affects the upper airways; and NO2, primarily produced by fuel combustion, exacerbates lung conditions and aids in the formation of ozone and secondary particulates [].

Table 1.
The limit values for the protection of human health under the Ambient Air Quality Directive(s) followed by the Green City Accord.
Although these pollutants are some of the most harmful to human health, the effectiveness of mitigation strategies relies on precise measurements with high spatial resolution—this is particularly challenging for mid-sized cities like Guimarães.
The new AAQD Directive (2024/2881) requires pollutants to be monitored by supersites located in urban or rural areas using standardized methods. For PM2.5 and PM10, gravimetric measurement is applied in accordance with the EN 12341:2023 standard [], while NO2 is monitored using chemiluminescence, following the EN 14211:2012 standard [,]. However, Guimarães has only one monitoring supersite, which is located in an urban area (see Figure 3). This limitation restricts the ability to capture the spatial variability of pollution, particularly in regions with distinct microclimates. This situation supports findings from studies that point out the inadequacy of traditional monitoring networks in mid-sized European cities [,].
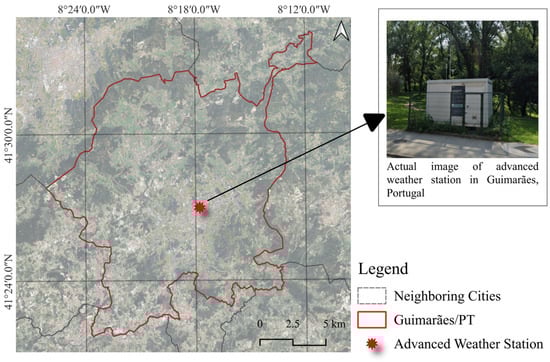
Figure 3.
The location of the advanced weather station in Guimarães, Portugal.
Although gravimetric and chemiluminescence methods are accurate [,], they have limitations regarding territorial coverage, high operational and maintenance costs, and low flexibility for network expansion [,]. These drawbacks hinder the identification of pollution hotspots and prevent a comprehensive understanding of intra-urban environmental conditions. As an alternative, studies suggest that integrating data from multiple sources—such as low-cost sensors, satellites, and modeling—provides a more resilient and effective solution [,,].
In light of this, the following review presents the main tools currently available for monitoring air pollutants (Table 2). The analysis revealed a wide range of possible approaches. It underscored the importance of integrated strategies in overcoming the limitations of traditional monitoring stations, especially in contexts like Guimarães, where many NBS are implemented on a small spatial scale and require higher-resolution sensors.
Table 2.
The approaches used to capture pollution in urban areas.
Each method has its advantages and limitations: fixed stations are accurate but offer limited coverage; low-cost sensors are affordable but less reliable; passive samplers provide good accuracy but have low temporal resolution; satellites offer broad coverage but face limitations related to observation frequency and cloud cover; drones enhance spatial coverage with good precision but have limited autonomy and are sensitive to weather conditions; and air quality modeling enables large-scale projections and analysis but requires high-quality data and continuous validation [,].
To support the interpretation of the monitoring approaches presented in Table 2, it is also important to highlight the main sensors and technologies associated with each method for assessing air quality in urban areas. Fixed monitoring stations operate with high-precision instruments, such as gravimetric and optical analyzers for particulate matter (PM2.5 and PM10), as well as specific detectors for gases like CO, NO2, SO2, O3, and volatile organic compounds (VOCs), following standards established by agencies such as the EPA and WHO [,,,]. Low-cost sensor and microsensor networks have gained prominence, using technologies such as electrochemical sensors (e.g., Alphasense NO2-B43F, SPEC Sensors 110-601), metal oxide sensors (e.g., MQ-135), and optical particle sensors (e.g., Plantower PMS5003, Alphasense OPC-N2), although they present challenges such as environmental interference and the need for frequent calibration [,]. Recent advances include photoionization detectors (PIDs), which are highly sensitive to VOCs, and MEMS sensors such as the SGP30, which enable multi-gas measurements through portable devices [,]. Passive samplers are still widely used for NO2, SO2, and O3, standing out for their cost effectiveness and operational simplicity, although they require laboratory analysis and do not provide real-time data []. In remote monitoring, satellite-based sensors such as MODIS and TROPOMI allow the detection of trace gases and aerosols on a large scale, with good spatial resolution []. UAVs have been successfully used for measurements in hard-to-reach areas, integrating multi-gas sensors (CO2, SO2, CH4, PM), as demonstrated by systems like little-RAVEN []. Finally, air quality modeling has integrated sensor data with statistical techniques and machine learning algorithms, such as linear regression, Random Forest, and neural networks, to predict pollutant dispersion and support decision-making [].
As a complement to Table 2, Table 3 outlines the main spaceborne sensors currently used to monitor atmospheric pollutants in urban areas. Understanding the capabilities and limitations of each sensor—especially in terms of pollutant type, spatial resolution, and revisit frequency—is critical for selecting appropriate tools for urban-scale studies. This comparison helps guide the methodological decisions for the next phase of this research, particularly in terms of identifying hybrid combinations of orbital and local data collection systems that can effectively capture the spatial variability of air quality in cities like Guimarães.
Table 3.
The main satellites that monitor atmospheric pollutants, with information manually collected from technical documents and the official websites of the responsible agencies (ESA, NASA, NOAA, and EUMETSAT, among others).
Satellite sensors differ significantly in terms of spatial resolution, revisit frequency, and the parameters they observe. Sentinel-5P (TROPOMI) is notable for its ability to directly monitor atmospheric pollutants, including NO2, SO2, CO, and O3, as well as its ability to provide data on aerosols, including AOD. However, it does not directly measure PM2.5 and PM10 []. On the other hand, sensors like MODIS and OMI provide long and comprehensive time series, which are useful for regional or global-scale aerosol analyses, but have lower spatial resolution [,]. Sentinel-3, through its OLCI sensor, delivers high-spatial resolution environmental products, including AOD estimates and LST, but it also does not directly measure pollutants [].
To enhance air quality monitoring capabilities in urban areas, combining complementary sensors like Sentinel-3 and Sentinel-5P is particularly effective. This approach is further strengthened when integrated with local data collected from drones, which improves spatial resolution and representativeness, especially at the microscale. These insights support the next phase of this study, which will focus on integrated modeling of air quality and LST using remote sensing and machine learning techniques.
Building on this, recent studies [,,,,] have demonstrated that the TROPOMI sensor (Sentinel-5P), despite its moderate native resolution, can be effectively applied in urban analyses through interpolation techniques, sensor fusion, or integration with local data. For example, in Bangladesh, NO2 levels were mapped at a 1 km2 resolution, identifying industrial hotspots with high spatial accuracy []; in Ukraine, kriging techniques refined TROPOMI data to 2 km grids, enabling real-time air quality alerts in cities like Kyiv []; and in the Iberian Peninsula, the fusion of Sentinel-3 and Sentinel-5P produced 300 m resolution maps of carbon productivity and pollution []. Other studies have shown the feasibility of using satellite data to detect urban air quality patterns, integrate with ground sensors for improved exposure assessment, and support data-driven decision-making in European mid-sized cities [,]. These examples confirm the effectiveness of integrated satellite-based approaches in urban pollution assessment and reinforce the methodological basis of this study, supporting the use of Sentinel-3 and Sentinel-5P in urban contexts like Guimarães, especially when complemented by local sensors and predictive modeling. However, when addressing microscale phenomena, especially in areas with complex topography or isolated pollution hotspots, satellite data may not be sufficient on its own.
To address these microscale limitations and expand observational capacity at ground level, recent advances have highlighted the role of Unmanned Aerial Vehicles (UAVs) as a crucial component of hybrid air quality monitoring systems. In this context, Unmanned Aerial Vehicles (UAVs), or drones, have emerged as a powerful complementary tool in urban air quality monitoring. Drones equipped with low-cost sensors can provide high-resolution data at multiple altitudes, allowing for spatially refined assessments of pollutants such as PM2.5, NO2, and O3 in real time [,]. In contrast to fixed monitoring stations and orbital sensors, UAVs enable targeted measurements in critical microenvironments and can fill spatial gaps in data collection, particularly in areas with complex topography or heavy traffic []. Their operational flexibility allows for their integration into dynamic, real-time mapping systems that inform policy decisions, emergency responses, and environmental planning []. This is particularly relevant for cities like Guimarães, where the spatial distribution of NBS is fragmented, and precise, site-specific monitoring is essential to evaluate their localized impacts on air quality. Therefore, integrating satellite observations with UAV-based data collection enhances both the spatial resolution and temporal responsiveness of air quality assessment, which is essential for sustainable urban governance.
4. Conclusions
This study addresses the challenges and opportunities in monitoring air quality in urban areas, with a focus on Guimarães, Portugal. Despite the municipality’s alignment with major European guidelines and its participation in initiatives such as the GCA, the findings reveal significant limitations in the local monitoring infrastructure, particularly in terms of spatial coverage.
The technical analysis conducted in this phase of the study confirms the necessity for an integrated approach that combines the accuracy of traditional monitoring methods with the enhanced spatial and temporal coverage provided by emerging technologies. To improve the detection and analysis of atmospheric pollutants, we propose the combined use of the Sentinel-3 and Sentinel-5P satellites. Additionally, incorporating drone-collected data will enhance measurement resolution and coverage, especially in critical and microscale urban areas.
The results not only deepen our technical understanding of the available monitoring tools, but also underscore the importance of integrated strategies that involve orbital data, UAV-based measurements, field sensors, and predictive modeling. This integrated multiscale approach lays a solid foundation for the next phase of the research, which will focus on forecasting the relationship between air quality, LST, and NBS using machine learning techniques. Furthermore, the anticipated outcomes may directly support urban planning efforts and public policies aimed at mitigating environmental risks on a local scale.
Author Contributions
Conceptualization, P.C.T., A.N., E.G., M.L.S.O., and E.N.B.P.; methodology, P.C.T., A.N., E.G., M.L.S.O., and E.N.B.P.; formal analysis, P.C.T. and E.N.B.P.; investigation, P.C.T. and E.N.B.P.; resources, P.C.T. and E.N.B.P.; data curation, P.C.T.; writing—original draft preparation, P.C.T.; writing—review and editing, P.C.T., A.N., E.G., M.L.S.O., and E.N.B.P.; visualization, P.C.T., A.N., E.G., M.L.S.O., and E.N.B.P.; supervision, M.L.S.O. and E.N.B.P.; project administration, M.L.S.O. and E.N.B.P.; funding acquisition, M.L.S.O. and E.N.B.P. All authors have read and agreed to the published version of the manuscript.
Funding
This research was funded by the R&D Project “New Space Portugal” (reference 02/C05i01.01/2022.C644936537-00000046), financed by the PRR—Plano de Recuperação e Resiliência—and the European Union through Next Generation EU funds, under the “Agendas para a Inovação Empresarial” incentive system. It was also supported by the PhD grants PRT/BD/154707/2023 (Paloma Toscan), PRT/BD/154704/2023 (Alcindo Neckel), and PRT/BD/154706/2023 (Emanuelle Goellner), awarded by the Atlantic International Research Center (AIR Centre) through Fundação para a Ciência e a Tecnologia (FCT). Additional funding was provided by FCT/MCTES through national funds (PIDDAC), under the R&D Unit Institute for Sustainability and Innovation in Structural Engineering (ISISE), reference UID/04029/2020, and the Associate Laboratory ARISE—Advanced Production and Intelligent Systems, reference LA/P/0112/2020.
Institutional Review Board Statement
Not applicable.
Informed Consent Statement
Not applicable.
Data Availability Statement
No new data were created or analyzed in this study. The data used for the regulatory and technical review are publicly available through the official websites of European Union agencies (such as EEA, ESA, and the European Commission), as well as the scientific literature and technical documentation cited in the manuscript.
Acknowledgments
The authors gratefully acknowledge the support and guidance provided by their academic supervisors and research institutions throughout the development of this work. The contributions of the technical staff and the collaborative environment provided by the Atlantic International Research Center (AIR Centre) and ISISE were also essential.
Conflicts of Interest
The authors declare no conflicts of interest.
References
- World Health Organization. Sustainable Development Goal Indicator 3.9.1: Mortality Attributed to Air Pollution; World Health Organization: Geneva, Switzerland, 2024. [Google Scholar]
- Ioannidis, G.; Tremper, P.; Li, C.; Riedel, T.; Rapkos, N.; Boikos, C.; Ntziachristos, L. Evaluating the Spatial Coverage of Air Quality Monitoring Stations Using Computational Fluid Dynamics. Atmosphere 2025, 16, 326. [Google Scholar] [CrossRef]
- Ramon, M.; Ribeiro, A.P.; Theophilo, C.Y.S.; Moreira, E.G.; De Camargo, P.B.; De Bragança Pereira, C.A.; Saraiva, E.F.; Dos Reis Tavares, A.; Dias, A.G.; Nowak, D.; et al. Assessment of Four Urban Forest as Environmental Indicator of Air Quality: A Study in a Brazilian Megacity. Urban Ecosyst. 2023, 26, 197–207. [Google Scholar] [CrossRef]
- Moreno, R.; Nery, A.; Zamora, R.; Lora, Á.; Galán, C. Contribution of Urban Trees to Carbon Sequestration and Reduction of Air Pollutants in Lima, Peru. Ecosyst. Serv. 2024, 67, 101618. [Google Scholar] [CrossRef]
- Pritipadmaja, G.R.; Sharma, A. Assessing the Cooling Effect of Blue-Green Spaces: Implications for Urban Heat Island Mitigation. Water 2023, 15, 2983. [Google Scholar] [CrossRef]
- Gobatti, L.; Bach, P.M.; Scheidegger, A.; Leitão, J.P. Using Satellite Imagery to Investigate Blue-Green Infrastructure Establishment Time for Urban Cooling. Sustain. Cities Soc. 2023, 97, 104768. [Google Scholar] [CrossRef]
- Agathangelidis, I.; Blougouras, G.; Cartalis, C.; Polydoros, A.; Tzanis, C.G.; Philippopoulos, K. Global Climatology of the Daytime Surface Cooling of Urban Parks Using Satellite Observations. Geophys. Res. Lett. 2025, 52, e2024GL112887. [Google Scholar] [CrossRef]
- Koc, C.B.; Osmond, P.; Peters, A. Evaluating the Cooling Effects of Infrastructure: A Systematic Review of Methods, Indicators and Data Sources. Solar Energy 2018, 166, 486–508. [Google Scholar] [CrossRef]
- Instituto Nacional de Estatística Ine. Censos XVI Recenseamento Geral Da População; VI Recenseamento Geral da Habitação: Resultados definitivos; INE: Lisboa, Portugal, 2022; ISBN 978-989-25-0619-7. [Google Scholar]
- Loureiro, I.; Ribeiro, C.A.; Sepúlveda, D. Guimarães 2030: A Governance Ecosystem. Euro-Mediterr. J. Environ. Integr. 2022, 7, 319–328. [Google Scholar] [CrossRef]
- IPMA Instituto Português Do Mar e Da Atmosfera. Boletim Sazonal Verão, 2023; Instituto Português do e da Atmosfera: Lisboa, Portugal, 2023.
- Secretariat of the Green City Accord and the European Green Capital and Green Leaf Awards. European Commission, Directorate-General for the Environment Green City Accord—1st Report 2020–2023; European Commission: Brussels, Belgium, 2025. [Google Scholar]
- World Health Organization. WHO Global Air Quality Guidelines: Particulate Matter (PM2.5 and PM10), Ozone, Nitrogen Dioxide, Sulfur Dioxide and Carbon Monoxide; World Health Organization: Geneva, Switzerland, 2021. [Google Scholar]
- EN 12341:2023; Ambient Air—Standard Gravimetric Measurement Method for the Determination of the PM10 or PM2.5 Mass Concentration of Suspended Particulate Matter. European Committee for Standardization CEN: Brussels, Belgium, 2023.
- Directive (EU) 2024/2881 of the European Parliament and of the Council of 23 October 2024 on Ambient Air Quality and Cleaner Air for Europe (Recast); European Parliament and Council of the European Union: Strasbourg, France, 2024; Volume L, pp. 1–70.
- EN 14211:2012; Ambient Air—Standard Method for the Measurement of the Concentration of Nitrogen Dioxide and Nitrogen Monoxide by Chemiluminescence. European Committee for Standardization CEN: Brussels, Belgium, 2012.
- De Vito, S.; Del Giudice, A.; D’Elia, G.; Esposito, E.; Fattoruso, G.; Ferlito, S.; Formisano, F.; Loffredo, G.; Massera, E.; D’Auria, P.; et al. Future Low-Cost Urban Air Quality Monitoring Networks: Insights from the EU’s AirHeritage Project. Atmosphere 2024, 15, 1351. [Google Scholar] [CrossRef]
- Fleischmann, G.; Aigner, P.; Ciais, P.; Denier Van Der Gon, H.; Droge, R.; Lian, J.; Narvaez Rincon, M.A.; Utard, H.; Lauvaux, T. From Political Pledges to Quantitative Mapping of Climate Mitigation Plans: Comparison of Two European Cities. Carbon Balance Manag. 2023, 18, 18. [Google Scholar] [CrossRef]
- Correia, C.; Santana, P.; Martins, V.; Mariano, P.; Almeida, A.; Almeida, S.M. Advancing Air Quality Monitoring: A Low-Cost Sensor Network in Motion—Part I. J. Environ. Manag. 2024, 360, 121179. [Google Scholar] [CrossRef]
- Fameli, K.-M.; Kladakis, A.; Efthymiou, C.; Charalampidou, C.; Sotiropoulou, M.; Antoniou, I.-M.; Papadaki, D.; Assimakopoulos, M.-N.; Assimakopoulos, V. Insights from the Development of an Innovative Air Quality Monitoring System. Int. Arch. Photogramm. Remote Sens. Spatial Inf. Sci. 2024, XLVIII-4/W10-2024, 65–70. [Google Scholar] [CrossRef]
- Ahmad, O.; Khalid, Z.; Tahir, M.; Uppal, M. Spatiotemporal Air Quality Mapping in Urban Areas Using Sparse Sensor Data, Satellite Imagery, Meteorological Factors, and Spatial Features. arXiv 2025, arXiv:2501.11270. [Google Scholar]
- Seesaard, T.; Kamjornkittikoon, K.; Wongchoosuk, C. A Comprehensive Review on Advancements in Sensors for Air Pollution Applications. Sci. Total Environ. 2024, 951, 175696. [Google Scholar] [CrossRef]
- Kunjir, G.M.; Tikle, S.; Das, S.; Karim, M.; Roy, S.K.; Chatterjee, U. Assessing Particulate Matter (PM2.5) Concentrations and Variability across Maharashtra Using Satellite Data and Machine Learning Techniques. Discov. Sustain. 2025, 6, 238. [Google Scholar] [CrossRef]
- Relvas, H.; Lopes, D.; Armengol, J.M. Empowering Communities: Advancements in Air Quality Monitoring and Citizen Engagement. Urban Clim. 2025, 60, 102344. [Google Scholar] [CrossRef]
- Geng, G.; Xiao, Q.; Liu, S.; Liu, X.; Cheng, J.; Zheng, Y.; Xue, T.; Tong, D.; Zheng, B.; Peng, Y.; et al. Tracking Air Pollution in China: Near Real-Time PM2.5 Retrievals from Multisource Data Fusion. Environ. Sci. Technol. 2021, 55, 12106–12115. [Google Scholar] [CrossRef]
- Moazami, T.N.; Svendsen, K.V.H.; Buhagen, M.; Jørgensen, R.B. Comparing PM2.5, Respirable Dust, and Total Dust Fractions Using Real-Time and Gravimetric Samples in an Exposure Chamber Study. Heliyon 2023, 9, e16127. [Google Scholar] [CrossRef] [PubMed]
- Fathy, A.; Gnambodoe-Capochichi, M.; Sabry, Y.M.; Anwar, M.; Ghoname, A.O.; Saeed, A.; Leprince-Wang, Y.; Khalil, D.; Bourouina, T. Potential of a Miniature Spectral Analyzer for District-Scale Monitoring of Multiple Gaseous Air Pollutants. Sensors 2023, 23, 6343. [Google Scholar] [CrossRef] [PubMed]
- Siddique, S.A.; Sajid, H.; Gilani, M.A.; Ahmed, E.; Arshad, M.; Mahmood, T. Sensing of SO3, SO2, H2S, NO2 and N2O Toxic Gases through Aza-Macrocycle via DFT Calculations. Comput. Theor. Chem. 2022, 1209, 113606. [Google Scholar] [CrossRef]
- Papaconstantinou, R.; Demosthenous, M.; Bezantakos, S.; Hadjigeorgiou, N.; Costi, M.; Stylianou, M.; Symeou, E.; Savvides, C.; Biskos, G. Field Evaluation of Low-Cost Electrochemical Air Quality Gas Sensors under Extreme Temperature and Relative Humidity Conditions. Atmos. Meas. Tech. 2023, 16, 3313–3329. [Google Scholar] [CrossRef]
- Zuidema, C.; Schumacher, C.S.; Austin, E.; Carvlin, G.; Larson, T.V.; Spalt, E.W.; Zusman, M.; Gassett, A.J.; Seto, E.; Kaufman, J.D.; et al. Deployment, Calibration, and Cross-Validation of Low-Cost Electrochemical Sensors for Carbon Monoxide, Nitrogen Oxides, and Ozone for an Epidemiological Study. Sensors 2021, 21, 4214. [Google Scholar] [CrossRef] [PubMed]
- Maeso-García, M.D.; Esteve-Turrillas, F.A.; Verdú-Andrés, J. Applications of the Photoionization Detector (PID) in Occupational Hygiene. Estimation of Air Changes per Hour in Premises with Natural Ventilation. Chemosensors 2021, 9, 331. [Google Scholar] [CrossRef]
- Algamili, A.S.; Khir, M.H.M.; Dennis, J.O.; Ahmed, A.Y.; Alabsi, S.S.; Ba Hashwan, S.S.; Junaid, M.M. A Review of Actuation and Sensing Mechanisms in MEMS-Based Sensor Devices. Nanoscale Res. Lett. 2021, 16, 16. [Google Scholar] [CrossRef] [PubMed]
- Feinberg, S.N.; Williams, R.; Hagler, G.; Low, J.; Smith, L.; Brown, R.; Garver, D.; Davis, M.; Morton, M.; Schaefer, J.; et al. Examining Spatiotemporal Variability of Urban Particulate Matter and Application of High-Time Resolution Data from a Network of Low-Cost Air Pollution Sensors. Atmos. Environ. 2019, 213, 579–584. [Google Scholar] [CrossRef]
- Chen, Y.; Li, D.; Karimian, H.; Wang, S.; Fang, S. The Relationship between Air Quality and MODIS Aerosol Optical Depth in Major Cities of the Yangtze River Delta. Chemosphere 2022, 308, 136301. [Google Scholar] [CrossRef]
- Karbach, N.; Bobrowski, N.; Hoffmann, T. Observing Volcanoes with Drones: Studies of Volcanic Plume Chemistry with Ultralight Sensor Systems. Sci. Rep. 2022, 12, 17890. [Google Scholar] [CrossRef]
- Wang, G.; Yu, C.; Guo, K.; Guo, H.; Wang, Y. Research of Low-Cost Air Quality Monitoring Models with Different Machine Learning Algorithms. Atmos. Meas. Tech. 2024, 17, 181–196. [Google Scholar] [CrossRef]
- Sneep, M. Sentinel-5P Level 2 Input Output Data Definition (Issue 20.0.0, Document No. S5P-KNMI-L2-0009-SD); European Space Agency: Paris, France, 2024. [Google Scholar]
- Lindsey, R.; Herring, D. MODIS Brochure; NASA Goddard Space Flight Center: Greenbelt, MD, USA, 2001.
- OMI Team Ozone Monitoring Instrument (OMI) Data User’s Guide; NASA: Washington, DC, USA, 2012.
- Aublanc, J.; Féménias, P.; Catapano, F.; Chamayou, A. Sentinel-3 SRAL/MWR Land User Handbook (Issue 1.2, Document Ref. S3MPC-STM_RP_0038); European Space Agency: Paris, France, 2024. [Google Scholar]
- Jubaer, A.; Hossain, R.; Ahmed, A.; Hossain, M.S. Factors Influencing Spatiotemporal Variability of NO2 Concentration in Urban Area: A GIS and Remote Sensing–Based Approach. Environ. Monit. Assess. 2025, 197, 167. [Google Scholar] [CrossRef]
- Savenets, M.; Oreshchenko, A.; Nadtochii, L. The System for Near-Real Time Air Pollution Monitoring over Cities Based on the Sentinel-5P Satellite Data. Visnyk V.N. Karazin Kharkiv Natl. Univ. Ser. Geol. Geogr. Ecol. 2022, 57, 195–205. [Google Scholar] [CrossRef]
- Reyes-Muñoz, P.; Kovács, D.D.; Berger, K.; Pipia, L.; Belda, S.; Rivera-Caicedo, J.P.; Verrelst, J. Inferring Global Terrestrial Carbon Fluxes from the Synergy of Sentinel 3 & 5P with Gaussian Process Hybrid Models. Remote Sens. Environ. 2024, 305, 114072. [Google Scholar] [CrossRef]
- Dhankar, S.; Singh, G.; Kumar, K. Impacts of Urbanization on Land Use, Air Quality, and Temperature Dynamics in Dehradun District of Uttarakhand, India: A Comprehensive Analysis. Front. Environ. Sci. 2024, 12, 1324186. [Google Scholar] [CrossRef]
- Al-Rawabdeh, A.; Alzu’bi, F.; Almagbile, A. Quantitative Assessment of Spatiotemporal Variability in Air Quality within the Amman-Zarqa Urban Area, Jordan. Egypt. J. Remote Sens. Space Sci. 2025, 28, 395–410. [Google Scholar] [CrossRef]
- Jaroń, A.; Borucka, A.; Deliś, P.; Sekrecka, A. An Assessment of the Possibility of Using Unmanned Aerial Vehicles to Identify and Map Air Pollution from Infrastructure Emissions. Energies 2024, 17, 577. [Google Scholar] [CrossRef]
- Yadav, P.; Porwal, T.; Jha, V.; Indu, S. Emerging Low-Cost Air Quality Monitoring Techniques for Smart Cities with UAV. In Proceedings of the 2020 IEEE International Conference on Electronics, Computing and Communication Technologies (CONECCT), Bangalore, India, 2–4 July 2020; pp. 1–6. [Google Scholar]
- Bakirci, M. Smart City Air Quality Management through Leveraging Drones for Precision Monitoring. Sustain. Cities Soc. 2024, 106, 105390. [Google Scholar] [CrossRef]
- Thakral, I.; Kumari, S.; Singh, K.K.; Aggarwal, N. Drone-Assisted Air Quality Monitoring in Urban Areas. AIP Conf. Proc. AIP Publ. 2025, 3224, 020002. [Google Scholar]
Disclaimer/Publisher’s Note: The statements, opinions and data contained in all publications are solely those of the individual author(s) and contributor(s) and not of MDPI and/or the editor(s). MDPI and/or the editor(s) disclaim responsibility for any injury to people or property resulting from any ideas, methods, instructions or products referred to in the content. |
© 2025 by the authors. Licensee MDPI, Basel, Switzerland. This article is an open access article distributed under the terms and conditions of the Creative Commons Attribution (CC BY) license (https://creativecommons.org/licenses/by/4.0/).