Abstract
Daily walking reflects the quality of life concerning physical status and its association with the risk of falls. Abnormal walking can lead to injuries and increase the likelihood of future falls. It has been found that older adults are more prone to falls than younger persons. However, there is limited research on gait analysis in older adults. Thus, we analyzed gait parameters, involving 10 participants aged between 20 and 30 years old, and 10 participants aged 50 years and older, using the Gait Analysis System (LONGGOOD Meditech Ltd., Taipei, Taiwan), which automatically positions the human body and GaitBEST. GaitBEST is used for analyzing and calculating key timing points and displacement values from the Kinect detector as it captures the location of joint points and adjusts them to the program. After the gait testing, the result is displayed immediately. Each volunteer did not have any surgery that impacted their walking and signed a written informed consent statement before the study. The volunteers walked on a straight flat surface for 4.2 m, repeating the walking test five times at a self-determined comfortable speed. Subsequently, a comparative analysis of the gait parameter outcomes was performed using a parametric test by a t-test. The results showed the balance parameters of both groups significantly differed in the head sway range (p = 0.008), head tilt range (p = 0.018), and pelvis tilt range (p = 0.003). The younger group exhibited better postural control than the other group. The spatiotemporal parameters, stride length, and step length during walking were also significantly different at p = 0.001. This indicated that the older group had shorter lengths compared to the other group, leading to a significant difference in the percentage of falls and functional loss at p = 0.021 and 0.023, respectively. The result of this study assists in examining and assessing the physical condition, preventing falls, optimizing walking efficiency, preventing injuries, and reducing the falling risk.
1. Introduction
Walking is a simple physical movement and contributes to long-term physical health when performed correctly in daily life. Walking correctly enhances overall well-being and fortifies muscles and joints. Conversely, abnormal gait patterns can lead to injuries and increase the risk of falls. As individuals age, joints deteriorate due to use [1] and result in degenerative joints combined with abnormal walking in the long term. For people aged 40 years and older, the falls of females occur 2–3 times higher than that of males [2]. Weerapong [3] found that changes in the musculoskeletal system resulting from osteoarthritis are associated with falls. Understanding the impact of abnormal walking on joint health is crucial, not only contributing to the prevention of injuries and the elevated risk of falling.
The previous studies analyzed gait patterns among patients with knee osteoarthritis compared to those with normal people. Additionally, the risk of falls among patients with conditions characterized by abnormal walking such as Parkinson’s disease was assessed in comparison to normal individuals. We studied the gait of elderly individuals with normal health compared to young adults, along with evaluating the risk of falls. To examine and evaluate gait, design walking plans, and prevent fall risks that may occur in the future, we used the Gait Analysis System (GaitBEST, LONGGOOD Meditech Ltd., Taipei, Taiwan). The walking data between the two groups of volunteers were compared to assess fall risk. The findings from this study provide a basis for further research.
2. Materials and Methods
2.1. Participants
For the gait testing, volunteers aged 20–39 years (the younger group) and those aged 50 years (the older group) and older were recruited. Each volunteer had not undergone any surgery that impacted their walking. All participants signed a written informed consent before the study. The participant’s details are presented in Table 1 and Table 2.

Table 1.
Characteristics of younger group.
Table 2.
Characteristics of older group.
2.2. Gait Analysis
GaitBEST was used in the gait test as it automatically positions the human body. It contains a Kinect detector (Three-dimension Kinect V2) that automatically tracks skeletal data and rebuilds 25 significant reference joint points without markers attaching to the skin of participants. In the detector, a sample rate of 30 Hz, Window 10 operation, i5 CPU or higher, and specialized algorithm are used [4]. GaitBEST analyzes and calculates key time points and displacement values from the Kinect detector, the location of joint points. and fits them into the program. After the gait testing, the result is displayed immediately.
The volunteers with the required qualifications walked with GaitBEST. Then, walking was analyzed using a camera and capturing the walking of volunteers on a straight flat surface for 4.2 m. The result was analyzed to show the result immediately after walking. The method was as follows.
- Walking on a straight flat surface from the starting point to the endpoint for 4.2 m (Figure 1).
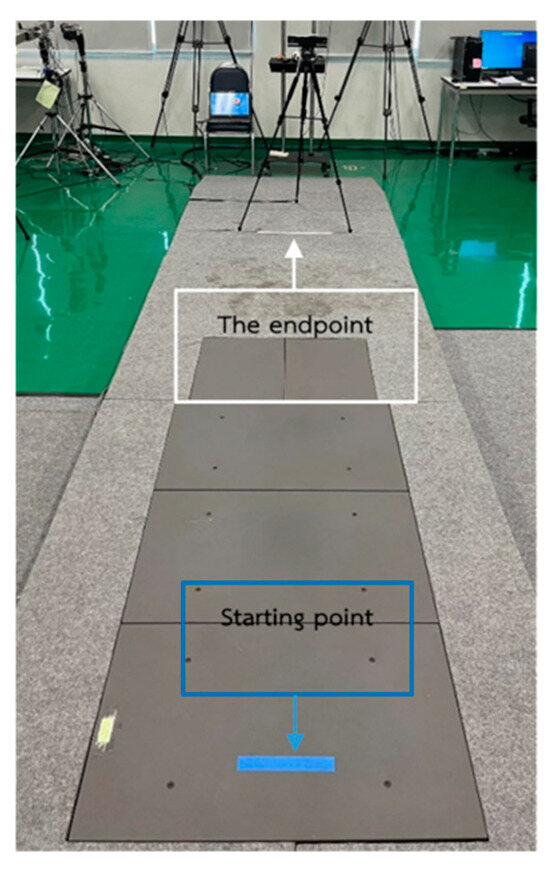 Figure 1. Straight flat floor walkways and starting and ending points for laboratory walking tests.
 - Walking at a natural pace.
- Walking with a normal and relaxed walking posture as in daily life, avoiding any stiff movements.
- Shoes and a face mask were not worn while walking.
- A plain-colored outfit with minimal patterns was worn.
- Test walking using the GaitBEST program. In the program, the Guest user account was selected to prevent the program from saving the walking data of the volunteers for a test walk.
- Walking was tested one or two times, or as per the volunteer’s preference to become familiar with the walking procedure.
- Walking was recorded GaitBEST.
- The test was repeated five times. Volunteers took a break between each test. Once they were ready, the next walking test proceeded.
We analyzed gait parameters and conducted statistical analysis by comparing walking parameters between the two volunteer groups (Figure 2).
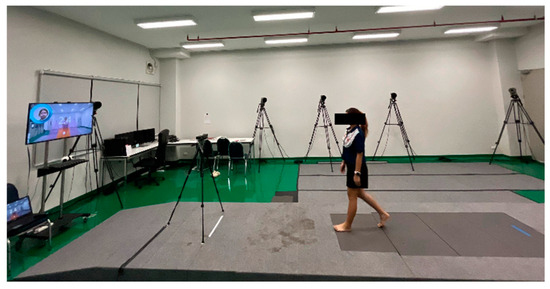
Figure 2.
Experiment with walking using the Gait Analysis System.
2.3. Statistical Analysis
Gait parameters were analyzed using a normality test. To test the normal distribution, we used the Kolmogorov–Smirnov test and the Shapiro–Wilk test. The results showed the normal distribution of the collected data. Then, a t-test was conducted to compare the walking data of the two groups. The Statistical Package for the Social Sciences (SPSS) program and Microsoft Excel were used for data analysis.
3. Results and Discussions
When comparing gait between the two groups (Table 3), balance parameters (head sway range, head tilt range, pelvis tilt range, and shoulder obliquity max) in the younger group showed better postural control compared to the older group. In terms of the spatiotemporal parameters (stride length and step length), the older group exhibited shorter lengths than the younger group, while there was no significant difference in cadence and speed, which depended on each person’s walking. Therefore, it is not conclusively clear whether the younger walked faster than the older. Both the left and right knee ranges of motion (ROM) for the older group were lower than the other group. As age increases, the ROM of the knee tends to decrease. The older group had a higher risk of falling and functional decline in daily activities.
Table 3.
Data of gait parameters obtained from experiment.
When comparing gait between the two groups, the balance of both groups during walking significantly differed. The head sway range (p = 0.008), head tilt range (p = 0.018), and pelvis tilt range (p = 0.003) showed statistically significant differences. The younger group exhibited better postural control. In terms of spatiotemporal parameters, stride length and step length during walking significantly differed between the two groups at p = 0.001. The older group had shorter lengths compared to the other group, leading to a higher percentage of falls and functional loss at p = 0.021 and 0.023 (Table 4). The balance of the younger group was better (Figure 3). Their median and mean values of the head sway range, the head tilt range, and the pelvis tilt range were higher in the range of grade 3–4, while those of the other group were in the range of grade 2–3. The head sway range of the older group was in the interquartile range (IQR), or 50% (grade 1–3), whereas the other group exhibited an IQR of grade 2–4. The head tilt range of the younger group was grade 4, and 50% of the values belonged to grades 3–5. In contrast, the older group showed an IQR of grade 2–5. A right-skewed distribution was within grades 2–3, and data density was in grades 3–5. For the pelvis tilt range, the younger possessed an IQR of grade 2–5, with the highest grade (5) within the 50% data range. For the older group, the IQR spanned grades 2𠄲3, and the highest grade was 4, with few individuals reaching grade 5.
Table 4.
Comparison of gait patterns between the two groups.
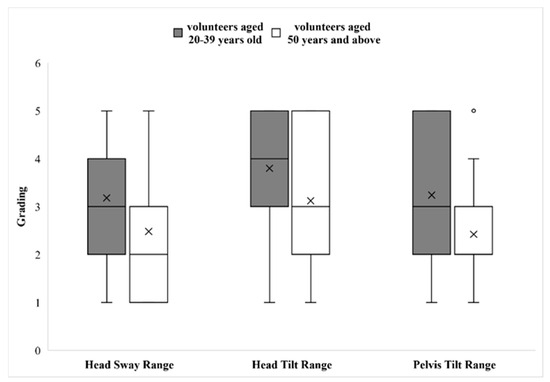
Figure 3.
Comparison of significant balance parameters, which includes head sway range, head tilt range, and pelvis tilt range between the volunteers aged 20–39 years group and volunteers aged 50 years and above group.
Figure 4 shows the median and mean values of stride length and step length which were longer for the younger group. Notably, the stride length of the older group exhibited the lowest maximum value, while the minimum value was higher than that of the younger group. The data within the range from Q1 to the median had a higher frequency than that within the range from the median to Q3, which exhibited greater data variability. The younger group had significantly longer lengths compared to the older group.
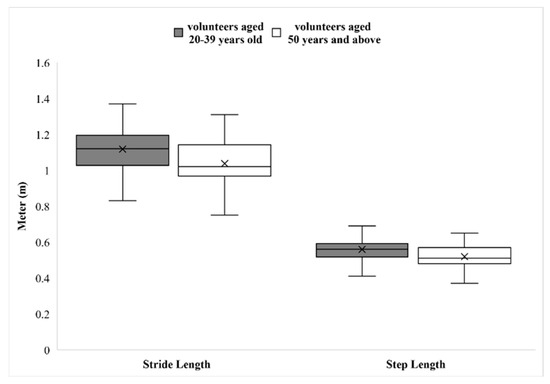
Figure 4.
Comparison of the significant spatiotemporal parameters, which includes stride length and step length between the volunteers aged 20–39 years group and volunteers aged 50 years and above group.
The percentage of the risk of falling in the younger group was lower than in the older group. One individual exhibited an abnormal value, which could potentially be an outlier resulting from stiff walking during the experiment (Figure 5). On the other hand, in the older group, there was a higher risk. Several individuals in this group exhibited significantly elevated risks, indicating potential outliers. This suggested increased susceptibility to falls. However, the minimum risk was lower than in the younger group. This implied the presence of individuals with good health or normal walking patterns. The functional loss between the two groups exhibited significant differences, as notably the older group had higher values and abnormal values. However, several participants in this group exhibited good health. Conversely, the younger group had only one abnormal value. For such outliers, careful observation and assessment of participants’ walking patterns were essential. If stiff walking was detected, participants were encouraged to walk in a manner to prevent the occurrence of outliers.
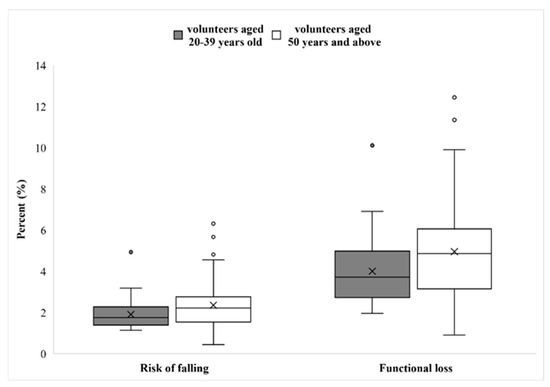
Figure 5.
Comparison of the significant health risk score parameters, which includes the risk of falling and functional loss between the volunteers aged 20–39 years group and volunteers aged 50 years and above group.
The older group showed a slower walking speed, less step length, and less stride length. The stride length of patients with osteoarthritis is reduced compared to healthy people [6,7]. Patients with Parkinson’s disease showed decreased stride length, step length, and speed, which are hallmarks of falling and are associated with an increased risk of falling [4]. Falls are associated with aging with stride length being one of the significant parameters associated with falling. Thus, stride length can be used to assess fall risk [8], and step length can used to identify falls between older fallers and non-fallers [9,10]. Older fallers have short steps and less stability in walking [11]. The balance parameters of the younger group had a higher grade (the higher the grade, the healthier) and declined in postural stability resulting in reduced walking stability, which coincided with Ref. [12]. Balance is related to weakness, which is an important predictor of falls [12]. The risk of falling (%) and functional loss (%) of the older group had higher values than those of the younger group. Reference [13] showed that when the function of the body decreased, falls increased.
4. Conclusions
The walking patterns between the two groups were different in walking efficiency, performance, and overall mobility. There was a higher likelihood of falls for the older group, which can result in injuries, disabilities, or loss of functionality. The findings of this study are beneficial for surveillance, fall prevention, and guiding the design of walking interventions. Enhancing walking efficiency is crucial to minimize the risk of future falls and associated injuries, contributing to improved overall well-being. In the future, it is necessary to utilize the parameters obtained from walking analysis to investigate gait patterns in patient groups. This can contribute to a further understanding of walking abnormalities in specific populations for the development of targeted interventions or treatments to improve gait and overall mobility. The Gait Analysis System needs to be studied to increase the reliability of the data and for patients with knee osteoarthritis, which has not been studied yet.
Author Contributions
Conceptualization, W.S. and T.S.; methodology, T.S. and W.S.; software, T.S.; validation, T.S.; formal analysis, T.S.; investigation, T.S.; resources, W.S. and T.S.; data curation, W.S. and T.S.; writing—original draft preparation, T.S.; writing—review and editing, T.S.; visualization, T.S.; supervision, W.S.; project administration, T.S.; funding acquisition, W.S. All authors have read and agreed to the published version of the manuscript.
Funding
This research received no external funding.
Institutional Review Board Statement
Not applicable.
Informed Consent Statement
Informed consent was obtained from all subjects involved in the study.
Data Availability Statement
All data obtained by the gait test of participants in the author’s laboratory are presented in the contribution.
Acknowledgments
This work was supported by Pattana Lee from Blue Oak Co., Ltd. for his supporting the Gait Analysis System in this study. The first author was supported by a grant from the Graduate School, Srinakharinwirot University, Thailand.
Conflicts of Interest
The authors declare no conflicts of interest.
References
- Worawit Louthrenoo. Osteoarthritis; Thanabaan Printing: Chiang Mai, Thailand, 2003. [Google Scholar]
- Wirot Kawinwongkovit. Knee Osteoarthritis; Department of Orthopedics, Faculty of Medicine, Mahidol University: Bangkok, Thailand, 2012. [Google Scholar]
- Weerapong, S. Relationship between osteoarthritis and the risk of falls in the elderly: A case study of Kang Aen, Prasat, Surin, Thailand. Srinagarind Med. J. 2018, 33, 57. [Google Scholar]
- Lai, Y.-R.; Lien, C.-Y.; Huang, C.-C.; Lin, W.-C.; Chen, Y.-S.; Yu, C.-C.; Cheng, B.-C.; Kung, C.-T.; Kung, C.-F.; Chiang, Y.-F.; et al. Clinical Disease Severity Mediates the Relationship between Stride Length and Speed and the Risk of Falling in Parkinson’s Disease. J. Pers. Med. 2022, 12, 192. [Google Scholar] [CrossRef] [PubMed]
- Kwak, S. Are only p-values less than 0.05 significant? A p-value greater than 0.05 is also significant! J. Lipid Atheroscler. 2023, 12, 89. [Google Scholar] [CrossRef] [PubMed]
- Esrafilian, A.; Karimi, M.T.; Amiri, P.; Fatoye, F. Performance of subjects with knee osteoarthritis during walking: Differential parameters. Rheumatol. Int. 2013, 33, 1753–1761. [Google Scholar] [CrossRef] [PubMed]
- Weidow, J.; Tranberg, R.; Saari, T.; Kärrholm, J. Hip and knee joint rotations differ between patients with medial and lateral knee osteoarthritis: Gait analysis of 30 patients and 15 controls. J. Orthop. Res. 2006, 24, 1890–1899. [Google Scholar] [CrossRef] [PubMed]
- Ruiz-Ruiz, L.; Jimenez, A.R.; Garcia-Villamil, G.; Seco, F. Detecting Fall Risk and Frailty in Elders with Inertial Motion Sensors: A Survey of Significant Gait Parameters. Sensors 2021, 21, 6918. [Google Scholar] [CrossRef] [PubMed]
- Liebherr, M.; Schubert, P.; Schiebener, J.; Kersten, S.; Haas, C.T. Dual-tasking and aging—About multiple perspectives and possible implementations in interventions for the elderly. Cogent Psychol. 2016, 3, 1261440. [Google Scholar] [CrossRef]
- Sherrington, C.; Fairhall, N.; Wallbank, G.; Tiedemann, A.; Michaleff, Z.A.; Howard, K.; Clemson, L.; Hopewell, S.; Lamb, S. Exercise for preventing falls in older people living in the community. Cochrane Database Syst. Rev. 2019, 54, 885–891. [Google Scholar] [CrossRef] [PubMed]
- Nascimento, M.D.M.; Gouveia, É.R.; Gouveia, B.R.; Marques, A.; Martins, F.; Przednowek, K.; França, C.; Peralta, M.; Ihle, A. Associations of gait speed, cadence, gait stability ratio, and body balance with falls in older adults. Int. J. Environ. Res. Public Health 2022, 19, 13926. [Google Scholar] [CrossRef] [PubMed]
- Delbaere, K.; Close, J.C.; Heim, J.; Sachdev, P.S.; Brodaty, H.; Slavin, M.J.; Kochan, N.A.; Lord, S.R. A Multifactorial Approach to Understanding Fall Risk in Older People. J. Am. Geriatr. Soc. 2010, 58, 1679–1685. [Google Scholar] [CrossRef] [PubMed]
- Rodríguez-Molinero, A.; Herrero-Larrea, A.; Miñarro, A.; Narvaiza, L.; Gálvez-Barrón, C.; León, N.G.; Valldosera, E.; de Mingo, E.; Macho, O.; Aivar, D.; et al. The spatial parameters of gait and their association with falls, functional decline and death in older adults: A prospective study. Sci. Rep. 2019, 9, 8813. [Google Scholar] [CrossRef] [PubMed]
Disclaimer/Publisher’s Note: The statements, opinions and data contained in all publications are solely those of the individual author(s) and contributor(s) and not of MDPI and/or the editor(s). MDPI and/or the editor(s) disclaim responsibility for any injury to people or property resulting from any ideas, methods, instructions or products referred to in the content. |
© 2024 by the authors. Licensee MDPI, Basel, Switzerland. This article is an open access article distributed under the terms and conditions of the Creative Commons Attribution (CC BY) license (https://creativecommons.org/licenses/by/4.0/).