Abstract
In this study, we proposed a non-destructive testing and evaluation (NDT&E) method for assessing the micro-scale fatigue damage of carbon-fiber-reinforced plastic (CFRP) structures. The process involves evaluating the thermophysical properties of the material, specifically the thermal diffusivity and specific heat capacity . To measure these properties, we employed the laser-induced periodic heating method using lock-in thermography, which is suitable for anisotropic composite materials. Our fatigue experiments revealed that the thermal diffusivity decreased and the specific heat capacity increased with the increase in fatigue cycles. We attribute these trends to the thermal resistance caused by the change in composite microstructure and the degradation of the matrix resin. These findings are discussed in detail, with implications for assessing CFRP structures and potential future research directions.
1. Introduction
Carbon-fiber-reinforced plastic (CFRP) has superior specific strength, corrosion resistance, and fatigue tolerance. CFRP has been used in major structures in the aerospace, wind energy, and automotive industries. In particular, the turbine blades of wind-power generation are required to operate for over 20 years due to high construction costs. Accurate fatigue life estimation is essential for such a long-term operation. Fatigue damage of CFRP is classified into macroscale damage, such as delamination and transverse cracking, and microscale damage, such as fiber breakage, interface delamination between the fiber and resin, and void formation in a resin. Microscale damage is accumulated in the early stage of fatigue. There are limited methods to evaluate its occurrence under unloaded conditions, except for using large equipment such as synchrotron radiation X-ray computed tomography. Quantifying microscale fatigue damage and evaluating fatigue progression of structures will lead to the estimation of the remaining fatigue life. We assume that the thermal diffusivity decreases in CFRP because microscale damage generates a small thermal resistance. In addition, we assume that the specific heat capacity increases because of the free volume generation in the resin [1]. Our research group has developed a method to measure and without contact by using a lock-in thermography (LIT)-based laser periodic heating method [2]. Using this technique, we have proposed a new approach to evaluate fatigue damage based on the measurement of the changing rate of and [3,4]. This paper reports the results of the changing rate of and with fatigue load cycles on a single CFRP fatigue specimen.
2. Materials, Theory, and Methods
2.1. Materials
The CFRP laminate plate used for the measurement was made of T700SC/#2592 prepreg with a [0/903]s stacking sequence. The sample size was 160 mm × 10 mm × t1.19 mm. The tensile–tensile fatigue test was conducted at 1 Hz using a fatigue testing machine (EHF-LV020K1A, Shimadzu Corporation, Kyoto, Japan). Thermal property measurement was performed at 103, 104, 104.5, and 105 load cycles. The maximum stress was 200 Mpa, which is 80% of the stress when the first transverse crack appeared during the static load test. To assess the density of transverse cracks, the side surface of the sample was polished, and images were captured using a digital optical microscope (VHX-2000, Keyence, Osaka, Japan). Figure 1a shows the experimental apparatus for the fatigue test.
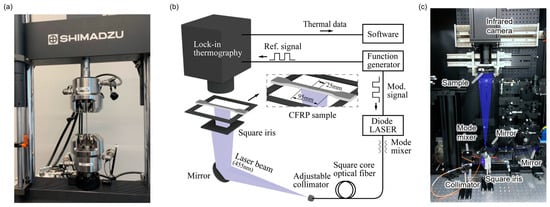
Figure 1.
(a) Fatigue test machine (EHF-LV020K1A, Shimadzu Corporation). (b) Schematic diagram of the measurement apparatus. (c) Photo of the experimental set-up.
2.2. Theory
A quasi-steady heat conduction model was introduced to obtain the 2D distribution of the effective thermal diffusivity in the out-of-plane direction [2]. The model was derived by solving the 1D unsteady heat conduction equation along the out-of-plane direction of the sample (z-axis), which is expressed as follows:
where is the AC temperature, is the input heat rate per unit area, is the thermal conductivity, , is the angular frequency, is the heating frequency, is the thickness of the sample, and is the thermal diffusivity. Since oscillates at the same harmonics of , then amplitude and phase at are shown as follows:
Since the actual measurement includes noise in the temperature response, the amplitude and phase were obtained by using digital lock-in processing for the temperature response of Equation (1). Then, Equation (2) was curve-fitted to the measured data in the frequency domain with changing as a parameter. By applying this procedure to all pixels, mapping results can be obtained according to the number of detectors in the infrared camera. Thermal conductivity can be calculated using the following equation by measuring the input heat flux dependence of the temperature amplitude .
Finally, volumetric heat capacity was obtained using the following equation:
The density of the sample was measured using the Archimedes method, which was then used to calculate the average specific heat capacity of the sample. The analysis flow to obtain the spatial distribution of thermal properties is shown in Figure 2.
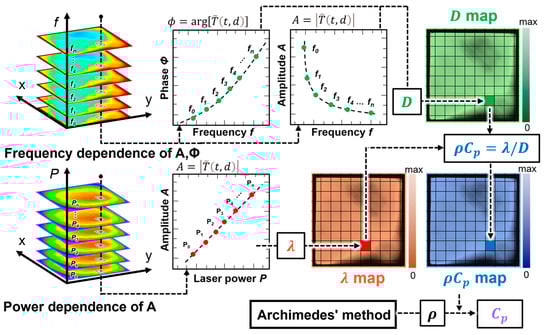
Figure 2.
Analysis flow to obtain the spatial distribution of , .
2.3. Methods
The measurement apparatus is shown in Figure 1b,c. The quasi-steady-state temperature response was measured using an LIT system (ELITE, Thermo Fisher Scientific) equipped with a cooled-type infrared camera, which has a 640 × 512-pixel focal-plane-array photon detector, and digital lock-in processing was conducted to obtain AC temperature amplitude and phase lag. In this device configuration, 95 mm wide area on the rear surface of the sample was uniformly heated. The infrared camera’s observation range is 25 mm wide on the sample surface. Therefore, heat flow hardly occurs in the longitudinal direction of the sample within the observation range. For thermal diffusivity measurements, the laser power was set to 5000 mW, the heating frequency was set to 0.30 Hz to 0.54 Hz, and 13 points were measured at 0.02 Hz intervals. For thermal conductivity measurements, the heating frequency was set to 0.30 Hz, and laser power intensity was set to 3200 mW to 4200 mW at 100 mW intervals. To increase the absorptivity and emissivity on the front and rear surfaces of the sample, they were black-coated using a black-body spray. Thermal properties were measured using the measurement system shown in Figure 1 for each loading cycle in the fatigue test, with the sample being removed from the testing machine. The sample for the unloaded measurement was cut from the same molded plate as the fatigue test sample.
3. Results and Discussion
Figure 3a shows the spatial distributions of and after 104.5 cycles. The distribution exhibits a pattern along the longitudinal direction. This behavior is also observed in unloaded specimens and is caused by localized differences in fiber content at the 90-degree layer. On the other hand, the distribution shows a uniform pattern compared to . This is because the difference in between carbon fibers and epoxy resin is smaller than the difference in [2]. Figure 3b shows the changes in and due to the loading cycle. The density difference measured using the Archimedes method before and after loading was 0.13%. Therefore, the change in is mainly governed by changes in . The error bars represent the 1 standard deviation within the dashed lines in Figure 3a. The density of transverse cracks initiated between 103 and 104 cycles. Consequently, 104 cycles were considered as the endpoint of the early stage of fatigue, and the relative difference from the unloaded specimen was calculated. As a result, the decrease rate in compared to the unloaded sample was a maximum of 1.1%. The magnitude of the decrease rate was comparable to that reported in [3]. On the other hand, increased by a maximum of 8.6% compared to the unloaded sample. Therefore, the measurement of values was suggested to be effective in quantifying the initial fatigue state. However, the increase in observed in the epoxy resin during fatigue testing was 4.9% [4], indicating that the CFRP results exceeded that value. For future works, we will conduct experiments in a vacuum environment, where thermal losses can be neglected, and verify reproducibility.
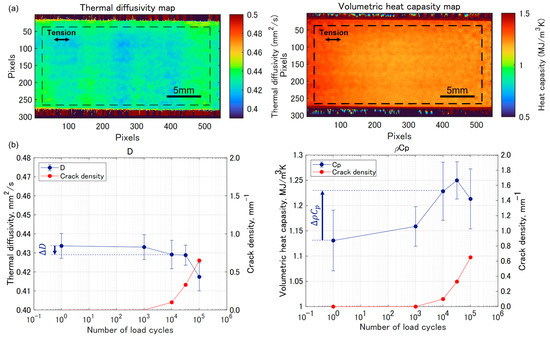
Figure 3.
(a) Spatial distribution of and . (b) Load cycle dependence of thermal properties.
4. Conclusions
This paper measured changes in thermal diffusivity and volumetric heat capacity in a single CFRP sample under fatigue loading. As a result of the measurement, thermal diffusivity decreased by up to 1.1%, and volumetric heat capacity increased by up to 8.6% compared to the unloaded sample. In the future, we aim to quantify the changes in thermal properties due to fatigue loading based on data accumulation and multidirectional verification.
Author Contributions
Conceptualization, R.F., J.K. and H.N.; Sample fabrication, M.J.M.F., S.A. and N.K.; methodology, R.F.; writing—original draft preparation, R.F.; writing—review and editing, H.N.; funding acquisition, J.K., H.N. and S.O. All authors have read and agreed to the published version of the manuscript.
Funding
This research was funded by JST-Mirai Program (ID 20349575).
Institutional Review Board Statement
Not applicable.
Informed Consent Statement
Not applicable.
Data Availability Statement
The data will be made available with a reasonable request to the corresponding author.
Conflicts of Interest
The authors declare no conflict of interest.
References
- Nieto Simavilla, D.; Schieber, J.D.; Venerus, D.C. Evidence of Deformation-Dependent Heat Capacity and Energetic Elasticity in a Cross-Linked Elastomer Subjected to Uniaxial Elongation. Macromolecules 2018, 51, 589–597. [Google Scholar] [CrossRef]
- Alasli, A.; Fujita, R.; Nagano, H. Thermophysical Properties Mapping of Composites by Lock-in Thermography: Applications on Carbon Fiber Reinforced Plastics. Int. J. Thermophys. 2022, 43, 176. [Google Scholar] [CrossRef]
- Fujita, R.; Katsukura, K.; Nagano, H. Early-Stage Fatigue Evaluation of CFRP Laminates Using Microscale Lock-in Thermography Based on Laser-Spot-Periodic-Heating Method. Infrared Phys. Technol. 2022, 126, 104323. [Google Scholar] [CrossRef]
- Kudo, N.; Fujita, R.; Oya, Y.; Sakai, T.; Nagano, H.; Koyanagi, J. Identification of Invisible Fatigue Damage of Thermosetting Epoxy Resin by Non-Destructive Thermal Measurement Using Entropy Generation. Adv. Compos. Mater. 2023, 1–17. [Google Scholar] [CrossRef]


Disclaimer/Publisher’s Note: The statements, opinions and data contained in all publications are solely those of the individual author(s) and contributor(s) and not of MDPI and/or the editor(s). MDPI and/or the editor(s) disclaim responsibility for any injury to people or property resulting from any ideas, methods, instructions or products referred to in the content. |
© 2023 by the authors. Licensee MDPI, Basel, Switzerland. This article is an open access article distributed under the terms and conditions of the Creative Commons Attribution (CC BY) license (https://creativecommons.org/licenses/by/4.0/).