Abstract
The air quality in modern cities and urban areas is strongly affected by chemical pollutants such as toxic gases, volatile organic compounds, and particulate matter. They are monitored by governmental agencies using regulatory monitoring stations, which are highly accurate, but also very expensive, bulky, and maintenance demanding. There is a compulsory need to monitor air quality at high spatial–temporal resolution in smart cities for public health protection and environmental sustainability. Properly calibrated low-cost and low-accuracy sensors are usually deployed in stationary and mobile nodes for urban air quality monitoring. A simple indicator of the current status of urban air pollution is the Air Quality Index (AQI) used to communicate the pollution level under the time-changing trend of a specific pollutant. In this study, continuous measurements have been performed in the city of Bari (southern Italy) by electrochemical gas sensors (NO2, O3, CO), optical particle counters (OPC) for particulate matter (PM10), and NDIR infrared sensors (CO2), including microsensors for temperature and relative humidity. The sensors have been installed in stationary nodes located in urban sites and in a mobile node mounted on a public bus moving on urban routes. AQI data gathered by the low-cost sensors have been compared with reference instrumentations as a case study of citizen science.
1. Introduction
Urban air quality is a major issue for public health, especially in cities and metropolises. Many worldwide cities do not meet the requirements for cleaner air as reported in the UN Environment Program Report 2016 [1]. For now, air pollution remains as the number one environmental cause of premature deaths in the European Union as reported in the European Environment Agency (EEA) Report 2023 [2]. In addition, millions of Europeans suffer from respiratory and cardiovascular diseases caused by air pollution. NO2, O3, SO2, and Particulate Matter (PM) are identified as key elements affecting quality of life and mortality rates, as reported in the World Health Organization (WHO) Report 2006 [3]. The economic costs of air pollution in the European Union are well over €20 billion a year. To mitigate these negative effects of air pollution on human health, the environment, and ecosystems, the European Commission adopted an Ambient Air Quality Directive (2008/50/EC) [4] that fixed stringent thresholds for any pollutant.
Climate change monitoring is crucial to implement abatement strategies of greenhouse gases and CO2 emissions for a low-carbon footprint in sustainable cities. In recent years, low-cost sensor systems and sensor networks [5,6,7,8] for air quality monitoring have been demonstrated in real-world scenarios for performance assessment, environmental awareness, personal exposure, compliance, legislative purposes, and decision support.
The Air Quality Index (AQI) is an essential measure of air pollution evaluation. It describes the degree of air pollution and its impact on health, so its accurate measurements and predictions are significant [9,10].
This study aims to assess the sensor network performance in terms of the AQI for urban air quality monitoring in the city of Bari (southern Italy) with 30-month long-term measurements (1 July 2015–31 December 2017). The sensor data are compared to the public environmental reference data to evaluate the accuracy and data quality objective of the European Air Quality Directive (2008/50/EC) for “Indicative Measurements”.
2. Materials and Methods
2.1. Air Sensors Used and Electronics
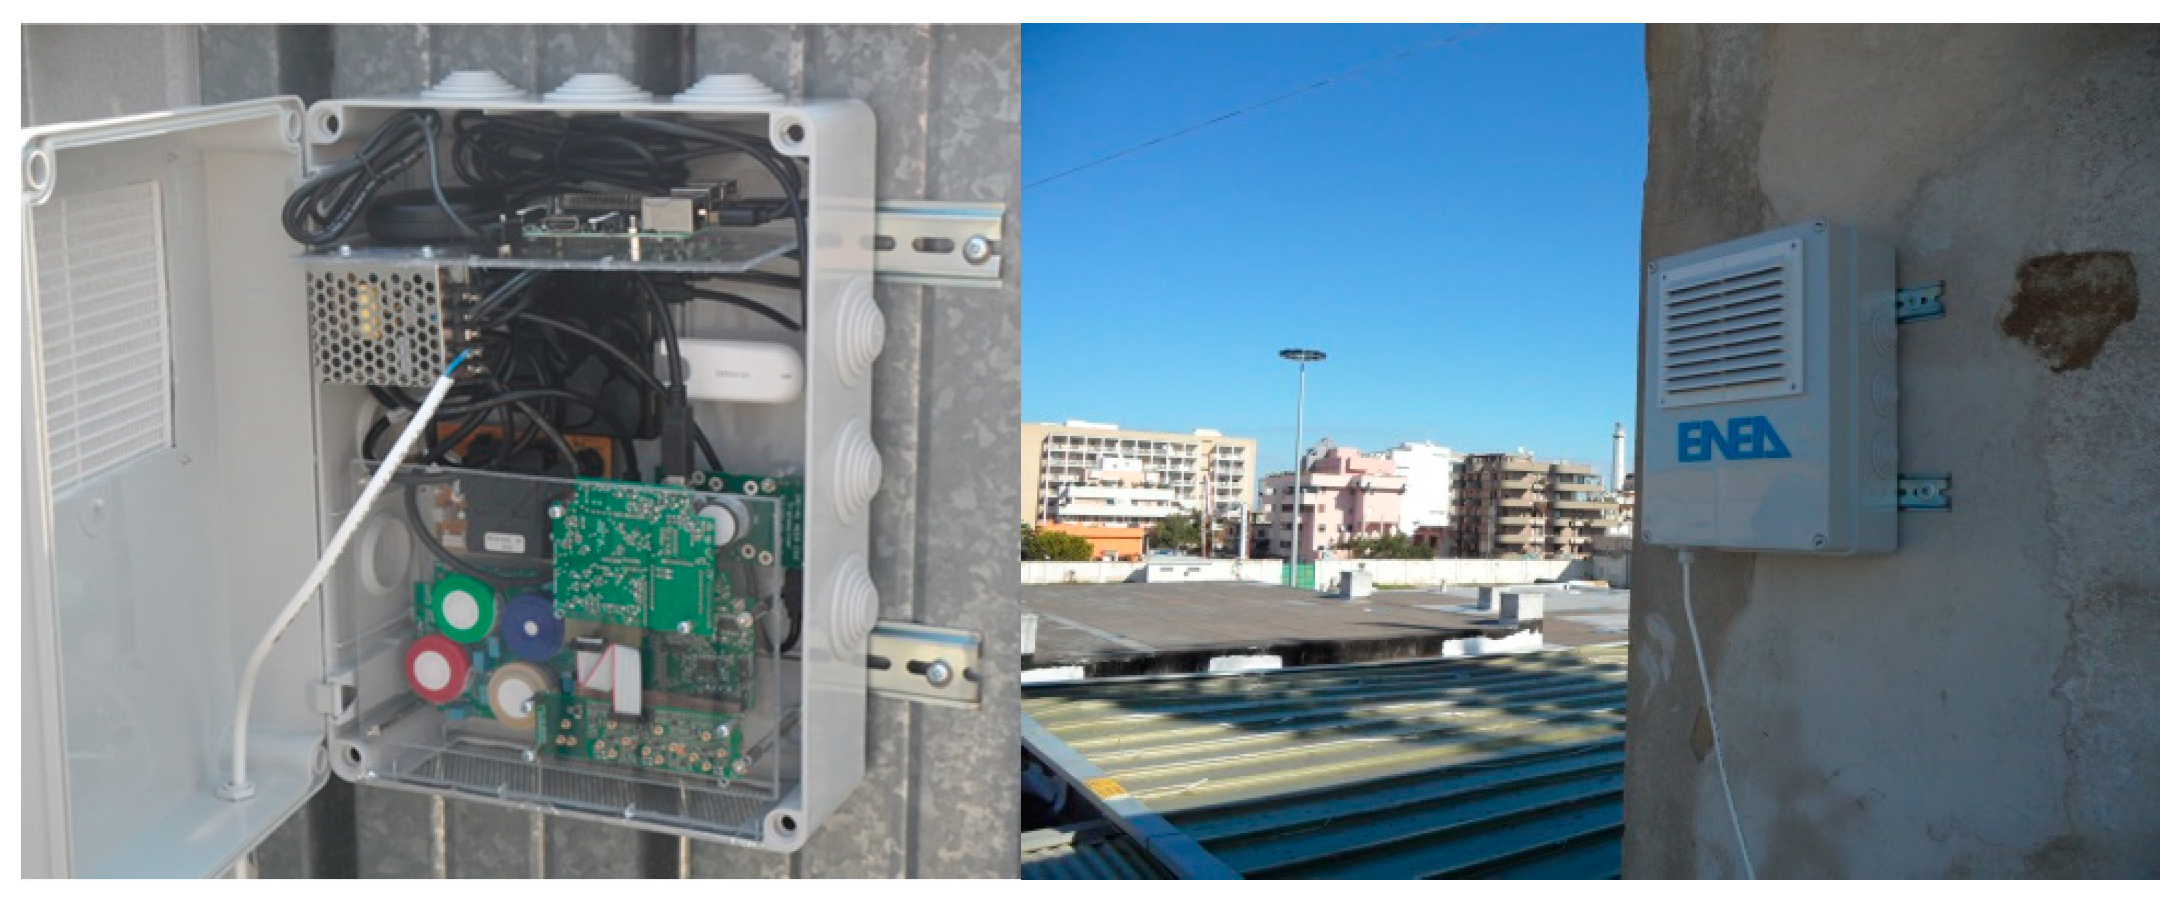
The AIRBOX sensor nodes, shown in Figure 1, were designed to be small in size (23 cm width × 30 cm height × 10 cm depth), thermoplastic weatherproof (IP 65/66), able to operate in a stand-alone manner, and connected to power. Each node includes a suite of low-cost sensors: 3 electrochemical gas sensors: NO2, O3, CO; 1 near dispersive infra-red (NDIR) sensor: CO2; 1 particulate matter sensor: PM10; 1 temperature (T) sensor, and 1 relative humidity (RH) sensor. The components are listed in Table 1. These sensors were selected due to their low power consumption (<10 mW for electrochemical sensors, and <60 mW for NDIR sensors) and their low-voltage operation (3.3–5.0 Vcc), including good sensitivity and low limit of detection at ppb or µg/m3 level of environmental interest.

Figure 1.
AIRBOX sensor nodes, developed by ENEA, deployed for air quality monitoring.

Table 1.
List of air quality and environmental sensors installed in each AIRBOX sensor node.
The sensor node incorporated a Raspberry Pi-based computer (Model B+) (Raspeberry PI Ltd, Cambridge, UK) with 4 USB ports, 1 Ethernet port, and 512 Mb RAM using the open-source operating system Linux for data acquisition management by an SD card (2 Gb) for on-board data logging. The remote node used a GPRS modem (Key HSPA Huawei E303) (Huawei, Guangdong, China) with a SIM ard, operated by a public provider, to transmit data to a central server (Dell, Model PowerEdge R320, 6 core-Intel Xeon, 16 Gb RAM, 6 disks by 500 Gb in raid5 configured) (Dell Inc, Round Rock, TX, USA) with a pack sampling rate to be configured properly. Additionally, a Wi-Fi key (Edimax USB 2.0, 802.11, 2.4 GHz, 150 Mbit/s) (Edimax Ltd, Irvine, CA, USA) was installed for city operation covered by a digital network. Finally, a global positioning system (GPS) receiver (Garmin, Model GPS 18× USB) (Garmin Ltd, Olathe, KS, USA) was used for convenient deployment, mainly for mobile sensing purposes.
A sensor network based on 11 AIRBOX nodes (10 stationary and 1 mobile mounted on public bus) was deployed for urban air quality monitoring in the city of Bari (southern Italy). The sensor nodes were distributed in urban sites (offices, buildings, streets) near to Air Quality Monitoring Stations (AQMS) by ARPA-Puglia, the regional agency for environmental monitoring. A virtual private network (VPN) was implemented to communicate by secure digital certificate with each remote node using TCP/IP protocol. Also, a global information system (GIS) was designed and realized to manage the visualization of air sensor network data. Moreover, in-field calibration by co-location of sensors and related reference equipment was realized to convert sensor output voltage into concentration and assess the error of the deployed sensors.
2.2. Definition of Air Quality Index (AQI) and Classification Rate
The “Air Quality Index” (AQI) is an indicator for reporting daily air quality using simple and effective figures of merit. It states how clean or unhealthy the air is, and what associated health effects may be a concern. The standardization of information is a challenge: different international organizations (e.g., US EPA, EEA, etc.) and national environmental agencies use a proper standard for the air quality index. In order to benchmark data, we adopt the AQI standard defined by US EPA [9]. For each pollutant, an air quality index is defined as follows:
The air pollution thresholds, regulated by the EU Air Quality Directive, used in the mentioned AQI formula are reported in Table 2.
Table 2.
Thresholds of air pollution for some significant pollutants, regulated by the EU Air Quality Directive (2008/50/EC), as used in the AQI formula.
The AQI in the US EPA standard is divided into 5 classes from 0 (clean air) to higher than 150 (heavy pollution): each class is associated with a risk for health and a color for visualization. When AQI exceeds the value of 100, the threshold has been overpassed to indicate a worse alarm situation. The US EPA AQIs classification is reported in Table 3.
Table 3.
Air Quality Index (AQI): categories and risks for health by US EPA classification [9].
Furthermore, the “Classification Rate” (C), expressed as a percentage of the correct assignments of the health risk class (symbolized by a color) divided by the total monthly cases, has been measured individually for each air pollutant and for each sensor node. Generally, the Classification Rate indicates the number of correct assignments in the risk class, by comparison of the AQI measured by both sensor and reference analyzer. The higher C, the better the performance of the sensor to classify the air pollutant in the specific site. For each compound, the Classification Rate, C (%), is defined as follows:
3. Results and Discussion
3.1. Air Quality Index by Stationary Sensor Nodes
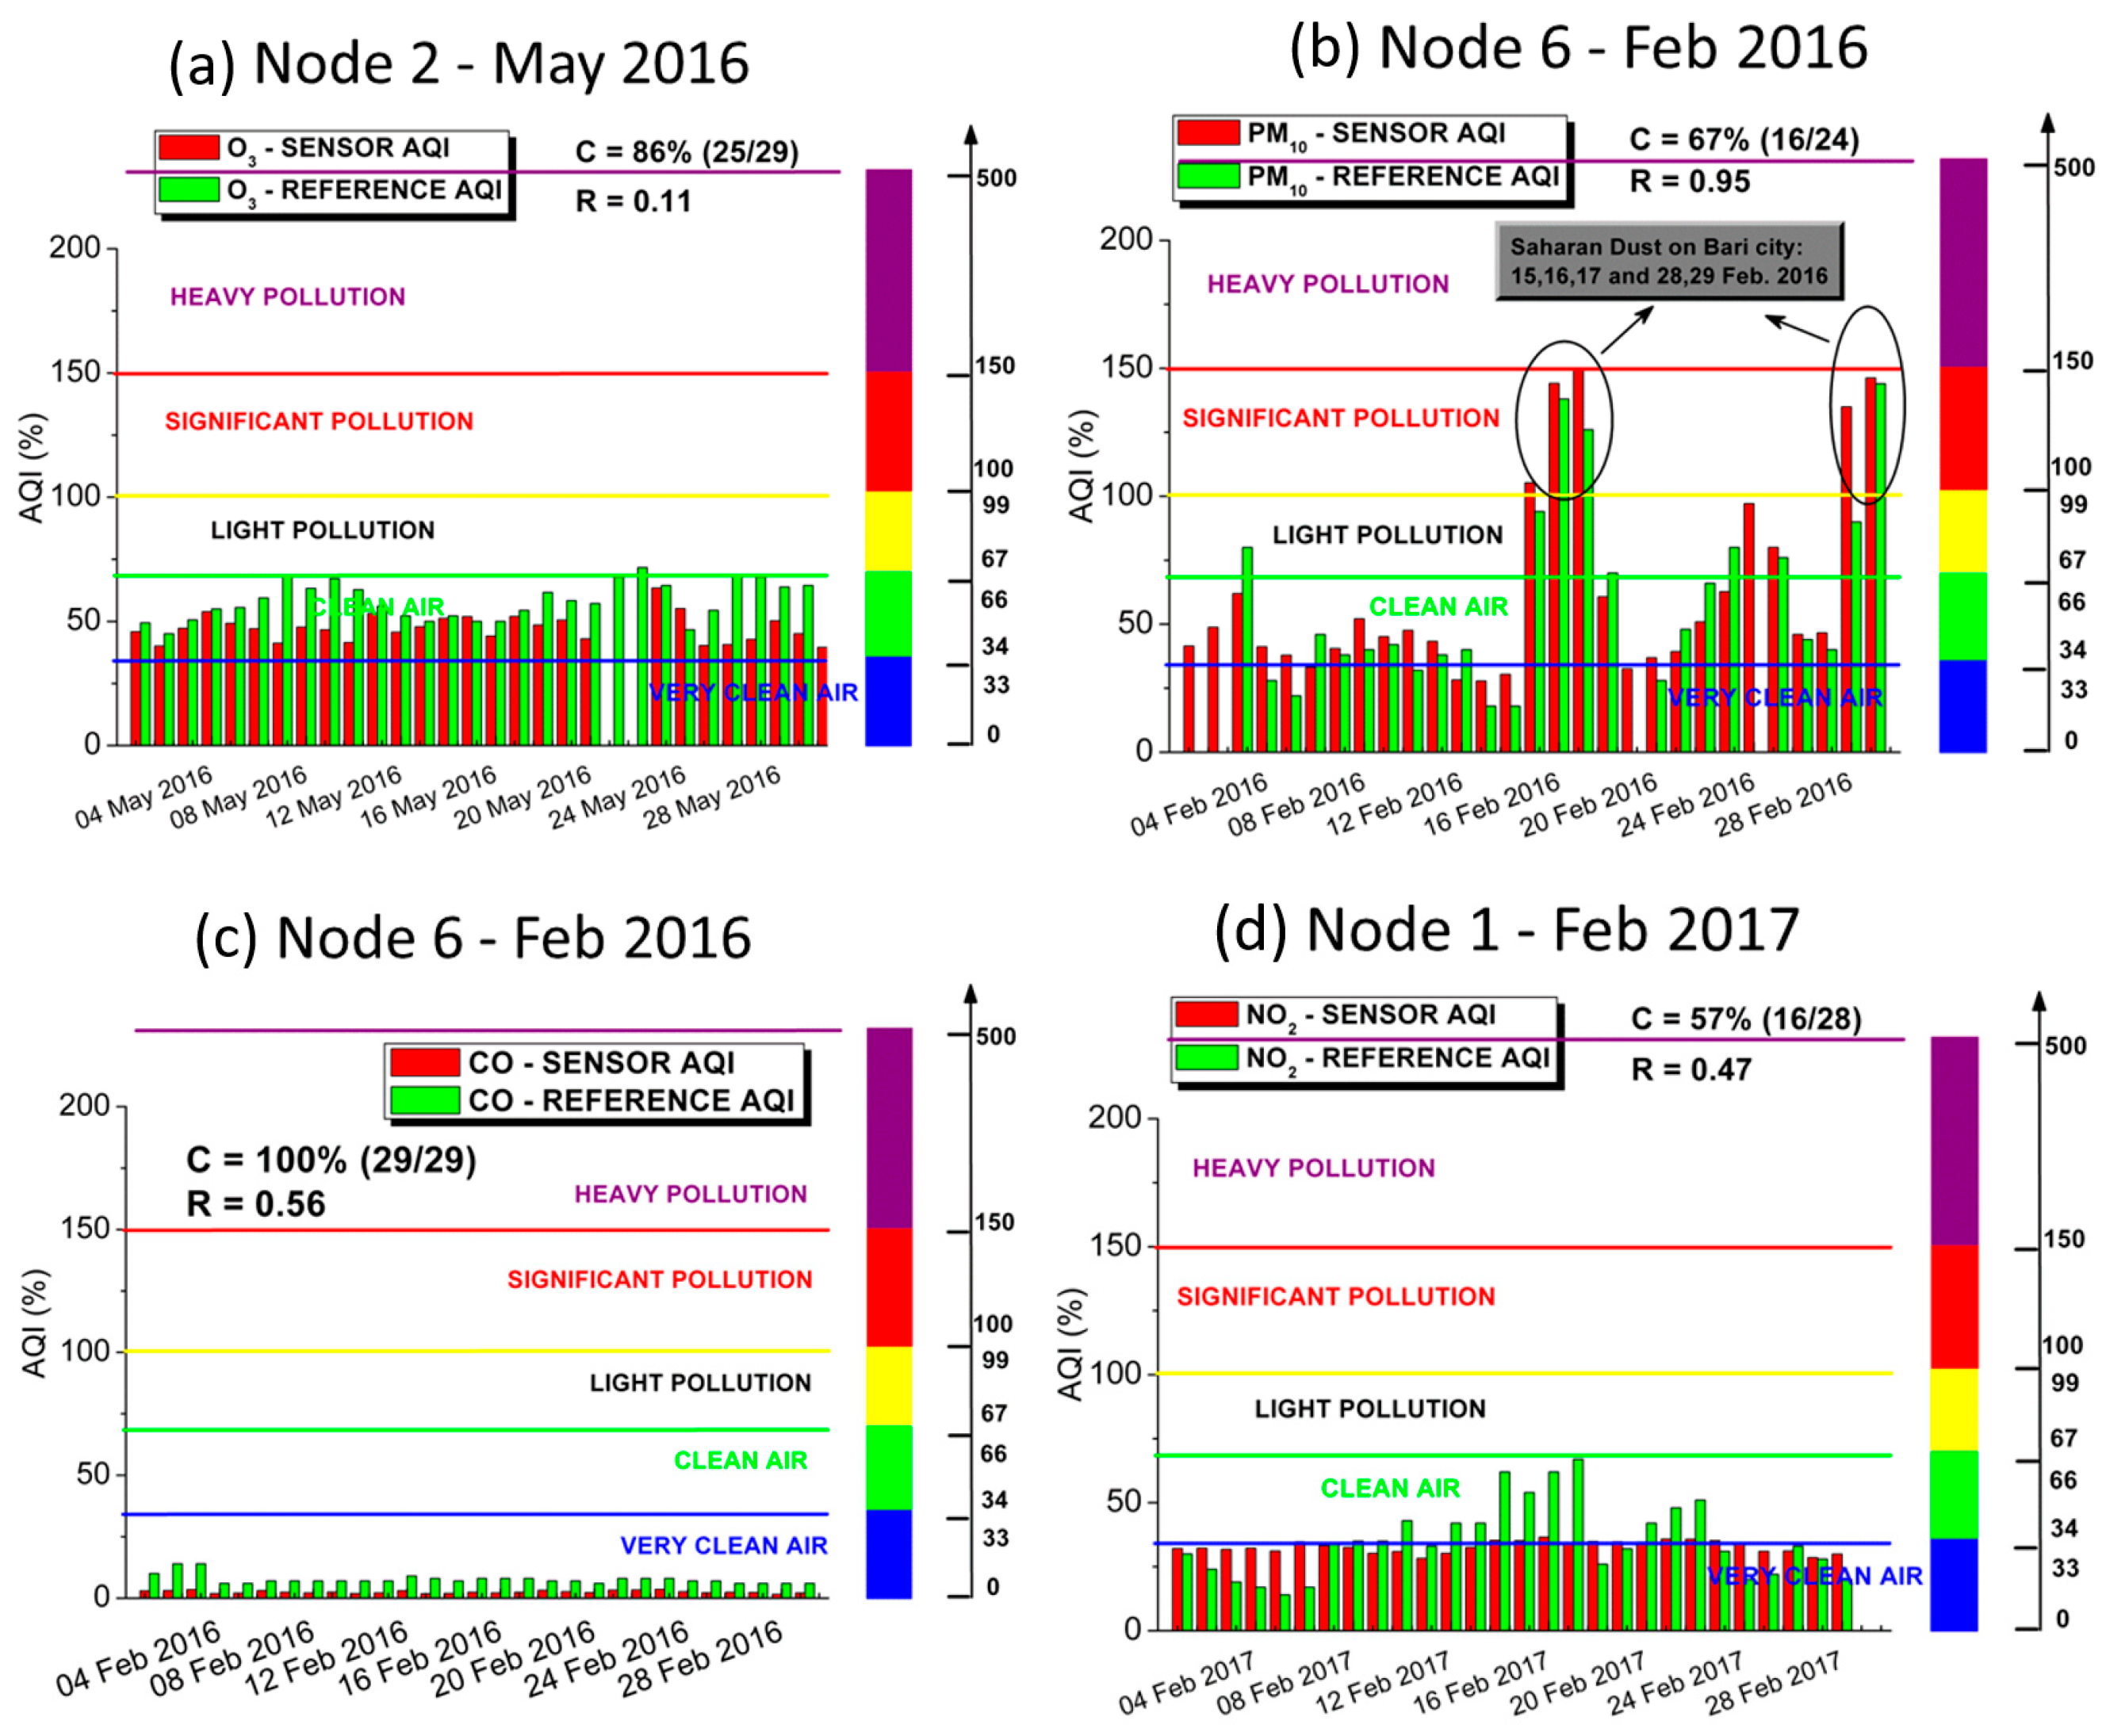
Figure 2 shows the AQI monthly trend of the PM10, O3, NO2, and CO, respectively, for some selected nodes during specific months of the experimental campaign in Bari city. The daily AQI, measured by a node sensor, was compared to the official AQI, referenced by the closest Air Quality Monitoring Station (AQMS) with available monitoring of the local environmental agency (ARPA-Puglia). The results of the sensor–versus–analyzer assessment are reported in Table 4. The Correlation Coefficient (R) and the Classification Rate (C), expressed as percentages of the correct assignment of the health risk class (symbolized by a color shown in Table 3) divided by the total monthly cases, have been measured individually for each air pollutant. The higher the R and C, the better the performance of the sensor to measure the air quality index.
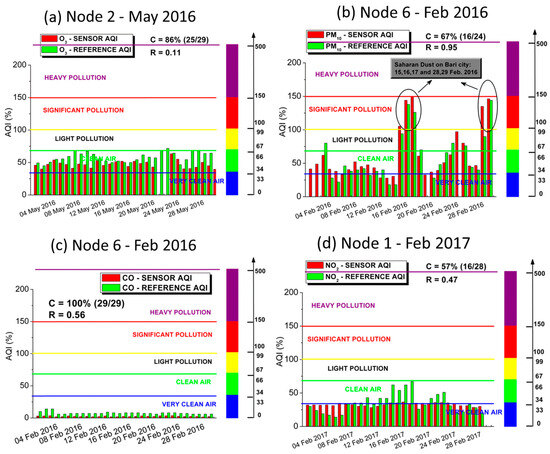
Figure 2.
AQI for PM10, NO2, O3, and CO, as measured by the AIRBOX sensor node installed on specific sites in Bari city during indicated months of the campaign, as compared to AQI measured by ARPA-Puglia reference analyzers.
Table 4.
Comparison of the monthly AQI for individual pollutants (PM10, O3, NO2, CO) as measured by a single sensor and compared to AQI measured by the closest air quality station of the ARPA-Puglia monitoring network, operated in Bari during the campaign in 2016 and 2017.
Generally, the PM10 AQI exhibits the highest R values ranging from 0.80 (Node 6—AIRPORT, May 2017) to 0.95 (Node 6—AIRPORT, Feb. 2016), and high C values ranging from 17% (Node 2—ENEA, May 2017) to 70% (Node 6—AIRPORT, May 2017). This means that the PM10 AQI is properly classified with high correlation. In contrast, the O3 and NO2 AQI exhibit lower R values ranging from 0.11 (O3, Node 1—ENEL, Feb. 2017; and O3, Node 2—ENEA, May 2016) to 0.47 (NO2, Node 1—ENEL, Feb. 2017) and high C values ranging from 33% (NO2, Node 2—ENEA, May 2016) to 86% (O3, Node 2—ENEA, May 2016). The C (61% and 86%) of the O3 AQI is usually higher than C (33% and 57%) of the NO2 AQI. This demonstrates a higher performance of the O3 sensor compared to the NO2 sensor in the individual AQI measure. Finally, the CO AQI exhibits low R values ranging from 0.14 (Node 2—ENEA, Feb. 2016) to 0.56 (Node 6—AIRPORT, Feb. 2016), and the highest C values are 100% for all four test cases. This means that the CO AQI is properly classified with low correlation.
3.2. Air Quality Index by Mobile Sensor Node
A mobile AIRBOX sensor system based on low-cost sensors was mounted on a public bus (AMTAB) running in Bari (Italy) for urban air quality monitoring. By exploiting this cost-effective sensor system, it is possible to use a mobile node on a public bus to achieve fine-grained monitoring, because when a public bus is moving, it can conduct environmental measurements at different locations in an urban micro-climate monitoring scenario to enhance citizens’ environmental awareness by mobile sensor nodes at high spatial and temporal resolutions. Figure 3 shows typical CO, NO2, O3, PM10, and CO2 AQI trends measured on 9 November 2015 by a mobile sensor node installed on a public bus circulating in Bari. The colors (blue, green, yellow, red, and purple) of the marked positions are correlated to the risk classification of air pollution for human health, as agreed in the EPA AQI standard [9] for each pollutant (see Table 3). The mobile AQI has been compared to the AQI measured by air quality monitoring stations (AQMS) installed in Bari. The AQI measured by a mobile sensor for CO, NO2, and O3 indicates clean air and very clean, air mainly with the colors blue and green, while the AQI for PM10 exhibits a mix of risk categories (colors) properly overlapping the stationary AQI stations. Finally, the mobile AQI for CO2 shows a significant level (red), but no comparison with a reference analyzer is available.
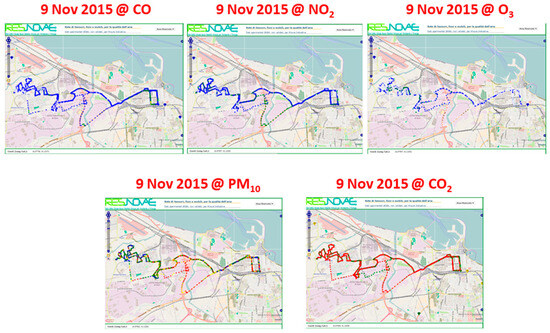
Figure 3.
Typical CO, NO2, O3, PM10, and CO2 Air Quality Index (AQI) trend (1 min average on 9 November 2015) of the mobile sensor node installed on the roof of a public bus (AMTAB) circulating in Bari (southern Italy). Blue—Clean air Excellent; Green—Clean air Good; Yellow—Light pollution; Red—Significant pollution; Purple—Heavy pollution.
4. Conclusions
In this study, we have demonstrated the feasibility of a sensor network based on 11 nodes (10 stationary and one mobile, operating onboard a public bus), distributed in the city of Bari (southern Italy) over a metropolitan area of 24 km2, for urban air quality monitoring during a 30-month long-term campaign of continuous measurements.
The Air Quality Index (AQI) of PM10, NO2, O3, and CO was compared using a sensor and reference analyzer of the closest AQMS of the local environmental agency. The results show a high correlation coefficient (R = 0.80–0.95) with excellent performance for PM10. On the contrary, a lower performance has been measured for O3 (R < 0.2), NO2 (R < 0.5), and CO (R < 0.6). However, a high Classification Rate for the AQI has been measured for CO (C = 100%), PM10 (C < 70%), O3 (C < 86%), and NO2 (C < 60%) exhibiting a correct classification of the health risk class associated to a proper color, as categorized by the US EPA standard [9]. Moreover, the AQI is tool that can easily show air quality through mobile sensing such as a proven sensor node mounted on a public bus circulating in the city to locally map the air pollution level in near real-time at high spatial–temporal resolution.
Author Contributions
Conceptualization, M.P. (Michele Penza), D.S. and V.P.; methodology, M.P. (Michele Penza), M.P. (Mario Prato), S.D. and G.C.; software, D.S., M.P. (Mario Prato), V.P. and S.D.; validation, D.S., M.P. (Mario Prato) and S.D.; formal analysis, M.P. (Michele Penza); investigation, D.S., V.P., M.P. (Mario Prato), S.D. and G.C.; resources, M.P. (Michele Penza); data curation, V.P., M.P. (Mario Prato) and S.D.; writing-original draft preparation, M.P. (Michele Penza); writing-review and editing, M.P. (Michele Penza); visualization, S.D., V.P. and M.P. (Mario Prato); supervision, M.P. (Michele Penza); project administration, M.P. (Michele Penza); funding acquisition, M.P. (Michele Penza). All authors have read and agreed to the published version of the manuscript.
Funding
This research was partially funded by MIUR—Italian Ministry of High Schools, University and Research, grant number PON04a2_E—Networks, Buildings, Streets: New Challenging Targets for Environment and Energy (RES-NOVAE).
Institutional Review Board Statement
Not applicable.
Informed Consent Statement
Not applicable.
Data Availability Statement
Not applicable.
Acknowledgments
The authors would like to acknowledge the support of COST Action TD1105—European Network on New Sensing Technologies for Air Pollution Control and Environmental Sustainability (EuNetAir, 2012–2016). The authors would like to thank the Municipality of Bari, via the city energy manager, for hosting some sensor nodes during the 30-month experimental campaign.
Conflicts of Interest
The authors declare no conflict of interest.
References
- United Nations Environment Programme (UNEP) Frontiers 2016 Report. Emerging Issues of Environmental Concern; UNEP: Nairobi, Kenya, 2016; ISBN 978-92-807-3553-6.
- European Environment Agency (EEA). Air Quality in Europe—2023 Report. Available online: https://www.eea.europa.eu/publications/europes-air-quality-status-2023 (accessed on 20 July 2023).
- World Health Organization. Air quality guidelines for particulate matter, ozone, nitrogen dioxide and sulfur dioxide. In Global Update 2005. Summary of Risk Assessment; World Health Organization: Geneva, Switzerland, 2006. [Google Scholar]
- Ambient Air Quality and Clean Air for Europe—EU Directive 2008/50/EC. Available online: http://eur-lex.europa.eu/legal-content/EN/TXT/PDF/?uri=CELEX:32008L0050&from=en (accessed on 20 July 2023).
- Penza, M.; Suriano, D.; Pfister, V.; Prato, M.; Cassano, G. Urban air quality monitoring with networked low-cost sensor-systems. Proceedings 2017, 1, 573–577. [Google Scholar]
- Williams, R.; Duvall, R.; Kilaru, V.; Hagler, G.; Hassinger, L.; Benedict, K.; Rice, J.; Kaufman, A.; Judge, R.; Pierce, G.; et al. Deliberating performance targets workshop: Potential paths for emerging PM2.5 and O3 air sensor. Atmos. Environ. X 2019, 2, 100031. [Google Scholar] [PubMed]
- Borrego, C.; Costa, A.M.; Ginja, J.; Amorim, M.; Coutinho, M.; Karatzas, K.; Sioumis, T.; Katsifarakis, N.; Konstantinidis, K.; De Vito, S.; et al. Assessment of air quality microsensors versus reference methods: The EuNetAir joint exercise. Atmos. Environ. 2016, 147, 246–263. [Google Scholar] [CrossRef]
- Spinelle, L.; Gerboles, M.; Villani, M.G.; Aleixandre, M.; Bonavitacola, F. Field calibration of a cluster of low-cost commercially available sensors for air quality monitoring. Part B: NO, CO and CO2. Sens. Actuators B Chem. 2017, 238, 706–715. [Google Scholar] [CrossRef]
- US Environmental Protection Agency. Air Quality Index—A Guide to Air Quality and Your Health; U.S. Environmental Protection Agency: Washington, DC, USA, 2014.
- Penza, M.; Suriano, D.; Villani, M.G.; Spinelle, L.; Gerboles, M. Towards air quality indices in smart cities by calibrated low-cost sensors applied to networks. In Proceedings of the IEEE Sensors 2014, Valencia, Spain, 2–5 November 2014; pp. 2012–2017. [Google Scholar]

Disclaimer/Publisher’s Note: The statements, opinions and data contained in all publications are solely those of the individual author(s) and contributor(s) and not of MDPI and/or the editor(s). MDPI and/or the editor(s) disclaim responsibility for any injury to people or property resulting from any ideas, methods, instructions or products referred to in the content. |
© 2023 by the authors. Licensee MDPI, Basel, Switzerland. This article is an open access article distributed under the terms and conditions of the Creative Commons Attribution (CC BY) license (https://creativecommons.org/licenses/by/4.0/).