Abstract
There is a well-known problem of video sequence analysis when it is necessary to identify and localize areas of abnormal movement of objects. This is necessary to attract the attention of the operator in the process of work or when analyzing the archive of video recordings. One of the solutions is based on tracklet analysis using short segments of the object’s trajectory that characterize its movement over a certain period of time, and then analysis of activity in various areas of the frame. Since the construction of the tracklet and trajectory is based on the optical flow, the quality and performance of the algorithm significantly depend on the choice and configuration of methods for detecting and tracking feature points. We have analyzed various combinations of these methods using the examples of test videos of normal and abnormal activity in a pedestrian zone. The necessity of a preliminary analysis of the methods used when setting up a video surveillance system to solve specific tasks is shown. Suitable combinations of methods are proposed.
1. Introduction
Currently, the number of surveillance cameras are installed indoors and outdoors to monitor various aspects of industrial and public safety is actively increasing. Previously, viewing cameras and determining emergency situations were usually assigned to the operator, who had to activate an alarm or perform other active actions. Even when there were relatively few cameras, most often records of the incident were extracted from the archive later, if there was information available about where and when to look. Now, when there are so many cameras that the operator is not able to control them all, video surveillance systems of varying degrees of complexity are in great demand, from systems that are able to detect movement in the frame to those that can determine some complex emergency situations [1].
In this paper, the detection of anomalies in a video based on a sparse optical flow is considered. Here, the input data is a sequence of extracted video frames, and the output data is an area or a set of areas in the frame where abnormal movement occurs.
There are several approaches to anomalies detection, which are based on a grid pattern [2], global pattern [3], trajectories [4], etc. Each of them has advantages and disadvantages, but they are all relatively computationally complex. There are slightly simpler algorithms that perform just as well.
This paper considers the implementation of the method based on the analysis of local binary tracklets [5], which requires detection of feature points and construction of a trajectory for them using the optical flow method.
2. Related Works
2.1. Feature Points Detection Methods
To detect features, algorithms are designed to determine the points of a sharp change of an image value in more than one direction.
Harris corner detector [6] uses image change in a sliding window of a certain size when it is shifted relative to a given point in any direction.
GFTT (Good Features To Track) [7] works on the same principle, but it calculates the measure of features differently, defining it as the minimum of two eigenvalues in the matrix of pixels of a sliding window—if both are large enough, the window shift strongly affects both directions. FAST [8] performs pixel comparisons with those lying on a circle with a radius of 3 pixels, and this is a special point if 12 pixels in the circle are noticeably different from the central one. AGAST [9] uses an approach with a binary decision tree so that each point can be checked in literally two comparisons, significantly speeding up the procedure. MSER [10] creates several binary (black and white) images with different thresholds, using areas that change slightly when a threshold changes as features.
SIFT descriptor-based detector [11] uses Gaussian filter smoothing to simulate different scales of the image and more efficiently highlight feature points on both large and small objects. BRIEF [12] develops the idea of SIFT, significantly simplifying the calculation of feature points descriptors. ORB [13] is a newer alternative to the SIFT and BRIEF detector; it uses the TreeFAST detector and another descriptor to effectively describe feature points. BRISK [14] raises the quality of successful matching even higher at different scales using the AGAST detector and taking into account additional maxima on each of the octaves of Gaussians when comparing. Method KAZE [15] avoids the disadvantages of Gaussian filter and achieves high localization accuracy and distinctiveness. AKAZE [16] speeds up KAZE using a more computationally efficient FED (Fast Explicit Diffusion) platform. AKAZE uses rotation and scaling invariant M-LDB [16] as a descriptor.
2.2. Methods of a Local Optical Flow Construction
To track feature points, in particular, to build an optical flow between frames, several tracking methods have been developed. The basis of the most famous Lucas–Kanade algorithm [17] is the assumption that the value of pixels of one object varies slightly between frames, and using the least squares method, it finds a position that minimizes the discrepancy between the pixel values in neighboring frames.
The method of G. Farneback [18] applies the decomposition of the change in image intensities around a singular point in the Taylor series to the second term using a weight function to approximate the values of neighboring pixels. Based on an extensive analysis of the available data, a new modification of the Lucas–Kanade method—the RLOF [19] algorithm—was created. It uses a modified Hampel estimate with robust characteristics.
2.3. Anomaly Detection Algorithms
Let us also discuss the existing algorithms for abnormal behavior in a video sequence detection. Optical flow is directly widely used for behavior analysis [20,21], but is not able to analyze spatial relations. Particle flow [22] copes with the task a little better, but it is unable to fully analyze objects in space. Methods based on local spatio-temporal features, in the form of gradients [23] and motion histograms [24], can be applied to the analysis of poorly structured scenes (crowded scene for example). Methods based on tracklets (for example, [25,26]) are well suited to detecting short-term anomalies and analyzing dense crowds. In trajectory methods, tracking algorithms track the trajectory of an object, after which it is analyzed through clustering of string kernels [27], single-class SVM [28] or semantic scene learning [29]. Methods based on global patterns analyze the entire sequence using a dense optical flow [30]. There are Gaussian Mixture Model (GMM)-based methods [31], models of social interactions [3], or Principal Component Analysis (PCA) [32] and several others. Grid pattern-based methods split the frame into blocks (grid cells) and perform block-based analysis. There are methods based on the reconstruction of sparse textures [2], motion context descriptor [33] or spatio-temporal Laplace maps. In [34,35] hierarchical sparse coding is applied, and in [36] multilevel sparse coding is utilized, on top of which SVM is applied for classification.
3. The Tracklet Analysis Algorithm
In order to study the influence of feature points detection and tracking algorithms on anomaly detection algorithm quality, we selected the LBT [5] (Local Binary Tracklet analysis). The overall pipeline is shown in the Figure 1.
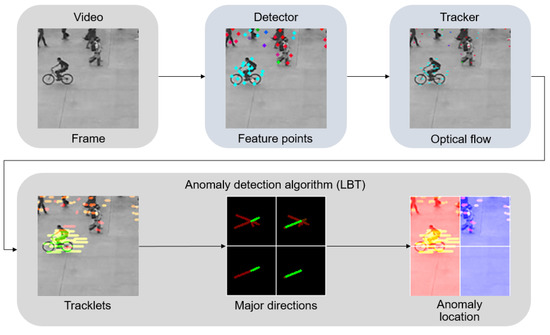
Figure 1.
Data pipeline of the LBT algorithm.
The input is an ordered set of images extracted from the video sequence. Then, using one of the detectors described in Section 2.1, the detection of feature points is performed. Then, the tracking of points between frames is performed using one of the tracking algorithms (or trackers), e.g., Lucas–Kanade or RLOF, as described in Section 2.2. According to tracking results, the trajectory of a point is sequentially formed, and its last section with a length of a given number of points (parameter) is used as a tracklet for anomalies detection. Too short tracklets, as well as those where there is a sharp change in velocity or direction, are discarded as unreliable. We assume that the objects that give rise to the tracklets have some inertia. Then, if during the time period specified for the analysis, the point abruptly changed the direction or velocity, there is a tracking failure. Next, the anomaly detection is performed. To achieve this, the frame is evenly divided by a grid into a given number of areas horizontally and vertically (the number of areas is a parameter) and a certain number of characteristic directions are identified for each of the areas. If a new characteristic direction of movement appears in the area or the magnitude of the characteristic speed of movement changes significantly (the threshold is a parameter), then the algorithm designates this area of the frame as abnormal.
4. Experiments
4.1. Test Datasets
When selecting test datasets for the analysis of optical flow anomalies, datasets UMN [37] and UCSD [38] were found. For an experimental study of the algorithm, a video sequence from an UMN dataset was chosen, where a group of people run away, simulating a panic (UMN sequence in the tests). A sequence was also selected from the UCSD dataset, where vehicles are present in the pedestrian zone (the Ped sequence in the tests). Examples of the appearance of frames from both sequences are shown in the Figure 2.
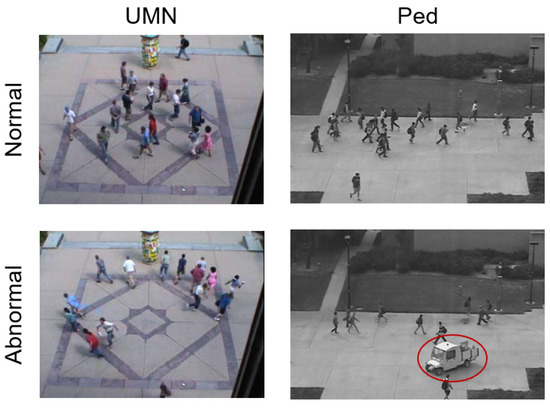
Figure 2.
Examples of frames from selected video sequences.
4.2. Quality Metrics
To evaluate the influence of algorithms on the quality and performance, it is necessary to determine quality metrics. In the case of performance, the calculation was performed as follows. During the processing of a sequence of frames, the time required for processing was calculated and then divided by the frame number in the video sequence. Thus, the average duration for one frame is obtained, from which we determine the number of frames processed per second (FPS). The following approach was chosen to determine the quality. Once the task (to draw attention to a certain moment in the video, or to the certain camera at some point in time) was selected, the markup was implemented for each frame as a whole. A sequence of values was compiled for all frames, whether an anomaly was present or absent in the frames. The output of the algorithm is designed in the same format. Thus, it is possible to calculate the number of successfully detected abnormal frames (TP, true positive), erroneously detected abnormal frames (FP—false positive, type II errors) and erroneously rejected abnormal frames (FN—false negative, type I errors). Based on these data, it is possible to calculate the metrics of accuracy, completeness and F1-score (1) as a harmonic mean.
It is also possible to build a Precision–Recall Curve (PRC) and the area under this curve (Precision and Recall-Area Under Curve, PR-AUC). Methods for plotting this curve and calculating the area under it are presented in a variety of packages; for example, in this case, the version from the python library scikit-learn [39] was used.
For tracklets and feature points, some characterizing parameters can also be proposed. Despite the fact that for each feature point, only a small set of the last points of the trajectory is used for analysis, the total number of frames on which the point is successfully tracked is calculated for comparison of algorithms. Then, this indicator is averaged over all frames of the video and tracklets. In this way, the average lifetime of the tracklet is obtained, which shows the overall robustness of tracking using a given method. The number of detected and tracked feature points on each frame is also summed after the removal of those whose position does not change, provided that a significantly higher threshold (several thousand, for example) is detected. The value is averaged by the frames quantity in the sequence and the average number of detected points is obtained. It characterizes how well each of the algorithms detects feature points.
4.3. Configuring Algorithm Parameters
Before analyzing the dependence of performance and quality on the choice of algorithm, it was necessary to pre-configure the parameters of the algorithms used. Note that chosen videos and the algorithms themselves ensure the practical absence of interdependence, so parameters of the points detection, tracking and anomaly detection algorithms can be configured sequentially.
At the first stage, with fixed parameters of the algorithms for detecting and tracking feature points, the parameters of the algorithm for anomalies detection in the optical flow were configured. To evaluate the performance of the algorithm in descending order of priority, the following metrics were used: F1-score, PR-AUC, FPS, and the average lifetime of the tracklet (higher value equal to better result for all metrics) and the average number of detected points (with the same maximum for all methods). According to the research results, we found that the number of cells for analysis has the main influence. With a value of the parameter “8 cells vertically by 12 horizontally”, the maximum of accuracy is obtained. Neither the maximum length of the tracklet nor the discretization of the direction histogram have a significant effect; these parameters were selected according to maximal accuracy and FPS. At the second stage, the parameters of each of algorithms for feature points detection and tracking were configured. In total, two algorithms for feature points tracking were considered: Lukas–Kanade (LK) and RLOF, described above in Section 2.2. Also eight classical algorithms for feature points detection were evaluated: GFTT, FAST, AGAST, SimpleBlob, SIFT, MSER, KAZE, and AKAZE, all described in Section 2.1. For each of the algorithms permissible limits of parameter changes were selected based on the information provided in the corresponding article. After that, the grid search for the best combinations of parameters for each algorithm was performed. Thus, sets of the best parameters for each of the algorithms were obtained to compare them with each other.
4.4. Comparison of Detection and Tracking Algorithms
Using configured methods for detecting and tracking feature points, as well as a customized anomaly detection algorithm, a study of the quality metrics described above was conducted. It was determined that choice of method has practically no effect on the maximal length of the trajectory; therefore, this parameter was discarded during the study of the results. Average number of detected points also does not directly depend on the method of feature points detection and does not correlate with quality. For any method, it can be changed depending on the requirements of the tracking algorithm or optical flow anomalies detection algorithm. For this reason, this parameter has also been omitted in this study. The summary tables of the results for the Lukas–Kanade tracking algorithm (Table 1) and RLOF tracking algorithm (Table 2) are shown below.

Table 1.
Results for Lukas–Canade method.
Table 2.
Results for RLOF method.
According to these tables, it is possible to conclude which method of detecting feature points is best suited for anomaly detection task. To do this, we present normalized graphs of the PR-AUC and FPS parameters for all combinations of the dataset and the tracking method (see Figure 3). The F1-score graph, with exclusion of insignificant details, coincides with the PR-AUC graph and is therefore omitted here.
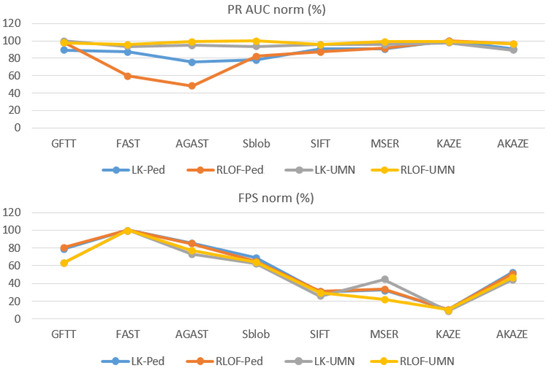
Figure 3.
Normalized PR-AUC and FPS graphs.
From the graphs shown, demonstrating the ratio of quality metrics of different pairs of the tracking method and the dataset when using a particular detector, several conclusions can be drawn. The most significant difference between the methods is observed in the resulting FPS, but the dataset and chosen tracker does not have significant effect on relative values. Therefore, in general, when the algorithm must work faster, it is recommended to use one of the detectors from the left part of the figure—GFTT, FAST, AGAST or SimpleBlob. For the UMN dataset, due to the relative simplicity of the problem being solved, the choice of detector did not have a significant impact on quality. For the Ped dataset, the FAST and AGAST detectors showed slightly lower quality as simpler methods. We also noted that the quality of the algorithm when tracking points by the RLOF method depends on detected feature points and detector quality more than when using the Lukas–Kanade method. Comparison based on absolute values of quality metrics (Table 1 and Table 2) shows the absence of significant differences in quality when using different trackers. For some items, a quality is higher when using RLOF. FPS differs insignificantly, by units and fractions of percent, so there is almost no difference between trackers for this indicator. The Lukas–Kanade method works faster, while RLOF is a little slower, but more accurate for a number of detectors. There is a possibility that the absence of significant differences in quality for detection methods is because of the selected dataset or quality metrics. The study of this set of methods on other tasks may become the goal of further research.
5. Conclusions
This paper considered several well-known algorithms for feature points detection and tracking and for anomaly detection in an optical flow constructed from a video sequence. After performing the analytical review, we chose algorithms: LBT for anomaly detection in optical flow; GFTT, FAST, AGAST, SimpleBlob, SIFT, MSER, KAZE, and AKAZE for detecting feature points; RLOF and Lucas–Kanade for feature points tracking. In the course of the study on the selected video sequences, significant differences in the performance of the algorithm were revealed depending on the selected feature point detector. There was no difference in quality, except for the FAST and AGAST detectors, which performed worse than the others on the Ped dataset with vehicles in the crowd. For use in such scenes, GFTT, SimpleBlob and AKAZE can be recommended as better methods in terms of FPS, precision and robustness. Tracking methods both have almost the same quality. The Lukas–Kanade tracking method has better performance and is more robust to poor quality of feature points; therefore, it can be recommended for use in scenes similar to considered dataset. In further research on this topic we plan to expand the variety of video sequences for analyzing methods, as well as to study existing neural network algorithms for feature points detection and tracking, and other methods for optical flow anomalies detection.
Author Contributions
Conceptualization, I.F. and Y.R.; methodology, Y.R.; software, Y.R.; validation, Y.R., I.F. and E.S.; formal analysis, Y.R. and I.F.; investigation, Y.R.; data curation, Y.R. and I.F.; writing—original draft preparation, I.F.; writing—review and editing, E.S.; visualization, I.F.; supervision, E.S. All authors have read and agreed to the published version of the manuscript.
Funding
The work was carried out as the part of the state task of the Russian Ministry of Education and Science for 2023 “Research of methods for creating self-learning video surveillance systems and video analytics based on the integration of technologies for spatiotemporal filtering of video stream and neural networks” (FNRG 2022 0015 1021060307687-9-1.2.1 №075-01595-23-00).
Institutional Review Board Statement
Not applicable.
Informed Consent Statement
Not applicable.
Data Availability Statement
Not applicable.
Conflicts of Interest
The authors declare no conflict of interest.
References
- Rezaee, K.; Rezakhani, S.M.; Khosravi, M.R.; Moghimi, M.K. A survey on deep learning-based real-time crowd anomaly detection for secure distributed video surveillance. Pers. Ubiquitous Comput. 2021, 1–17. [Google Scholar] [CrossRef]
- Xu, J.; Denman, S.; Sridharan, S.; Fookes, C.; Rana, R. Dynamic texture reconstruction from sparse codes for unusual event detection in crowded scenes. In Proceedings of the 2011 Joint ACM Workshop on Modeling and Representing Events, Scottsdale, AZ, USA, 30 November 2011; pp. 25–30. [Google Scholar]
- Mehran, R.; Oyama, A.; Shah, M. Abnormal crowd behavior detection using social force model. In Proceedings of the 2009 IEEE Conference on Computer Vision and Pattern Recognition, Miami, FL, USA, 20–25 June 2009; pp. 935–942. [Google Scholar]
- Zhou, B.; Wang, X.; Tang, X. Understanding collective crowd behaviors: Learning a mixture model of dynamic pedestrian-agents. In Proceedings of the 2012 IEEE Conference on Computer Vision and Pattern Recognition, Providence, RI, USA, 16–21 June 2012; pp. 2871–2878. [Google Scholar]
- Ravanbakhsh, M.; Mousavi, H.; Nabi, M.; Marcenaro, L.; Regazzoni, C. Fast but not deep: Efficient crowd abnormality detection with local binary tracklets. In Proceedings of the 2018 15th IEEE International Conference on Advanced Video and Signal Based Surveillance (AVSS), Auckland, New Zealand, 27–30 November 2018; pp. 1–6. [Google Scholar]
- Harris, C.; Stephens, M. A combined corner and edge detector. In Proceedings of the Alvey Vision Conference, Manchester, UK, 31 August–2 September 1988; Volume 15, pp. 10–5244. [Google Scholar]
- Shi, J. Good features to track. In Proceedings of the 1994 Proceedings of IEEE Conference on Computer Vision and Pattern Recognition, Seattle, WA, USA, 21–23 June 1994; pp. 593–600. [Google Scholar]
- Rosten, E.; Drummond, T. Machine learning for high-speed corner detection. In Proceedings of the European Conference on Computer Vision, Graz, Austria, 7–13 May 2006; Springer: Berlin/Heidelberg, Germany, 2006; pp. 430–443. [Google Scholar]
- Mair, E.; Hager, G.D.; Burschka, D.; Suppa, M.; Hirzinger, G. Adaptive and generic corner detection based on the accelerated segment test. In Proceedings of the European Conference on Computer Vision, Crete, Greece, 5–11 September 2010; Springer: Berlin/Heidelberg, Germany, 2010; pp. 183–196. [Google Scholar]
- Matas, J.; Chum, O.; Urban, M.; Pajdla, T. Robust wide-baseline stereo from maximally stable extremal regions. Image Vis. Comput. 2004, 22, 761–767. [Google Scholar] [CrossRef]
- Lowe, D.G. Distinctive image features from scale-invariant keypoints. Int. J. Comput. Vis. 2004, 60, 91–110. [Google Scholar] [CrossRef]
- Calonder, M.; Lepetit, V.; Strecha, C.; Fua, P. Brief: Binary robust independent elementary features. In Proceedings of the European Conference on Computer Vision, Crete, Greece, 5–11 September 2010; Springer: Berlin/Heidelberg, Germany, 2010; pp. 778–792. [Google Scholar]
- Rublee, E.; Rabaud, V.; Konolige, K.; Bradski, G. ORB: An efficient alternative to SIFT or SURF. In Proceedings of the 2011 International Conference on Computer Vision, Barcelona, Spain, 6–13 November 2011; pp. 2564–2571. [Google Scholar]
- Leutenegger, S.; Chli, M.; Siegwart, R.Y. BRISK: Binary robust invariant scalable keypoints. In Proceedings of the 2011 International Conference on Computer Vision, Barcelona, Spain, 6–13 November 2011; pp. 2548–2555. [Google Scholar]
- Alcantarilla, P.F.; Bartoli, A.; Davison, A.J. KAZE features. In Proceedings of the European Conference on Computer Vision, Florence, Italy, 7–13 October 2012; Springer: Berlin/Heidelberg, Germany, 2012; pp. 214–227. [Google Scholar]
- Alcantarilla, P.F.; Solutions, T. Fast explicit diffusion for accelerated features in nonlinear scale spaces. IEEE Trans. Patt. Anal. Mach. Intell. 2011, 34, 1281–1298. [Google Scholar]
- Lucas, B.D.; Kanade, T. An iterative image registration technique with an application to stereo vision. In Proceedings of the 7th International Joint Conference on Artificial Intelligence, Vienna, Austria, 23–29 July 2022. [Google Scholar]
- Farnebäck, G. Two-frame motion estimation based on polynomial expansion. In Proceedings of the Scandinavian Conference on Image Analysis, Halmstad, Sweden, 29 June–2 July 2003; Springer: Berlin/Heidelberg, Germany, 2003; pp. 363–370. [Google Scholar]
- Senst, T.; Eiselein, V.; Sikora, T. Robust local optical flow for feature tracking. IEEE Trans. Circuits Syst. Video Technol. 2012, 22, 1377–1387. [Google Scholar] [CrossRef]
- Su, H.; Yang, H.; Zheng, S.; Fan, Y.; Wei, S. The large-scale crowd behavior perception based on spatio-temporal viscous fluid field. IEEE Trans. Inf. Forensics Secur. 2013, 8, 1575–1589. [Google Scholar] [CrossRef]
- Benabbas, Y.; Ihaddadene, N.; Djeraba, C. Motion pattern extraction and event detection for automatic visual surveillance. EURASIP J. Image Video Process. 2010, 2011, 163682. [Google Scholar] [CrossRef]
- Li, T.; Chang, H.; Wang, M.; Ni, B.; Hong, R.; Yan, S. Crowded scene analysis: A survey. IEEE Trans. Circuits Syst. Video Technol. 2014, 25, 367–386. [Google Scholar] [CrossRef]
- Kratz, L.; Nishino, K. Tracking pedestrians using local spatio-temporal motion patterns in extremely crowded scenes. IEEE Trans. Pattern Anal. Mach. Intell. 2011, 34, 987–1002. [Google Scholar] [CrossRef] [PubMed]
- Cong, Y.; Yuan, J.; Liu, J. Abnormal event detection in crowded scenes using sparse representation. Pattern Recognit. 2013, 46, 1851–1864. [Google Scholar] [CrossRef]
- Lewandowski, M.; Simonnet, D.; Makris, D.; Velastin, S.A.; Orwell, J. Tracklet reidentification in crowded scenes using bag of spatio-temporal histograms of oriented gradients. In Proceedings of the Mexican Conference on Pattern Recognition, Querétaro, Mexico, 26–29 June 2013; pp. 94–103. [Google Scholar]
- Zhou, B.; Wang, X.; Tang, X. Random field topic model for semantic region analysis in crowded scenes from tracklets. In Proceedings of the CVPR 2011, Colorado Springs, CO, USA, 20-25 June 2011; pp. 3441–3448. [Google Scholar]
- Brun, L.; Saggese, A.; Vento, M. Dynamic scene understanding for behavior analysis based on string kernels. IEEE Trans. Circuits Syst. Video Technol. 2014, 24, 1669–1681. [Google Scholar] [CrossRef]
- Piciarelli, C.; Micheloni, C.; Foresti, G.L. Trajectory-based anomalous event detection. IEEE Trans. Circuits Syst. Video Technol. 2008, 18, 1544–1554. [Google Scholar] [CrossRef]
- Song, X.; Shao, X.; Zhang, Q.; Shibasaki, R.; Zhao, H.; Cui, J.; Zha, H. A fully online and unsupervised system for large and high-density area surveillance: Tracking, semantic scene learning and abnormality detection. ACM Trans. Intell. Syst. Technol. (TIST) 2013, 4, 1–21. [Google Scholar] [CrossRef]
- Popoola, O.P.; Wang, K. Video-based abnormal human behavior recognition—A review. IEEE Trans. Syst. Man Cybern. Part C (Appl. Rev.) 2012, 42, 865–878. [Google Scholar] [CrossRef]
- Yuan, Y.; Feng, Y.; Lu, X. Statistical hypothesis detector for abnormal event detection in crowded scenes. IEEE Trans. Cybern. 2016, 47, 3597–3608. [Google Scholar] [CrossRef] [PubMed]
- Lee, Y.J.; Yeh, Y.R.; Wang, Y.C.F. Anomaly detection via online oversampling principal component analysis. IEEE Trans. Knowl. Data Eng. 2012, 25, 1460–1470. [Google Scholar] [CrossRef]
- Cong, Y.; Yuan, J.; Tang, Y. Video anomaly search in crowded scenes via spatio-temporal motion context. IEEE Trans. Inf. Forensics Secur. 2013, 8, 1590–1599. [Google Scholar] [CrossRef]
- Yu, K.; Lin, Y.; Lafferty, J. Learning image representations from the pixel level via hierarchical sparse coding. In Proceedings of the CVPR 2011, Colorado Springs, CO, USA, 20–25 June 2011; pp. 1713–1720. [Google Scholar]
- Zhao, B.; Li, F.-F.; Xing, E.P. Online detection of unusual events in videos via dynamic sparse coding. In Proceedings of the CVPR 2011, Colorado Springs, CO, USA, 20–25 June 2011; pp. 3313–3320. [Google Scholar]
- Xu, K.; Jiang, X.; Sun, T. Anomaly detection based on stacked sparse coding with intraframe classification strategy. IEEE Trans. Multimed. 2018, 20, 1062–1074. [Google Scholar] [CrossRef]
- Ma, K.; Doescher, M.; Bodden, C. Anomaly Detection in Crowded Scenes Using Dense Trajectories; University of Wisconsin-Madison: Madison, WI, USA, 2015. [Google Scholar]
- Mahadevan, V.; Li, W.; Bhalodia, V.; Vasconcelos, N. Anomaly detection in crowded scenes. In Proceedings of the 2010 IEEE Computer Society Conference on Computer Vision and Pattern Recognition, San Francisco, CA, USA, 13–18 June 2010; pp. 1975–1981. [Google Scholar]
- Pedregosa, F.; Varoquaux, G.; Gramfort, A.; Michel, V.; Thirion, B.; Grisel, O.; Blondel, M.; Prettenhofer, P.; Weiss, R.; Dubourg, V.; et al. Scikit-learn: Machine learning in Python. J. Mach. Learn. Res. 2011, 12, 2825–2830. [Google Scholar]
Disclaimer/Publisher’s Note: The statements, opinions and data contained in all publications are solely those of the individual author(s) and contributor(s) and not of MDPI and/or the editor(s). MDPI and/or the editor(s) disclaim responsibility for any injury to people or property resulting from any ideas, methods, instructions or products referred to in the content. |
© 2023 by the authors. Licensee MDPI, Basel, Switzerland. This article is an open access article distributed under the terms and conditions of the Creative Commons Attribution (CC BY) license (https://creativecommons.org/licenses/by/4.0/).