Abstract
Quick User Datagram Protocol Internet Connection (QUIC) is a modern transport protocol leveraging the User Datagram Protocol (UDP) to improve latency, security, and mobility. In this study, we analyzed QUIC traffic by uploading a 10 MB file under varied maximum transmission unit (MTU), bandwidth, and segment size conditions. Interarrival times (IAT) at both client and server were captured and analyzed using ordering points to identify the clustering structure (OPTICS) clustering and Markov modelling. Transition matrices and eigenvalue spectra revealed steady states, convergence behavior, and spectral gaps. The results showed that parameter variations significantly affected the traffic state diversity and flow dynamics, optimizing QUIC performance in real-world deployments.
1. Introduction
Quick User Datagram Protocol Internet Connection (QUIC) is a modern transport layer protocol designed to enhance the performance, security, and reliability of Internet communications. Developed by Google and later standardized by the Internet Engineering Task Force (IETF), QUIC combines key transport and security functionalities into a single protocol framework, leveraging UDP instead of the transmission control protocol (TCP) to optimize latency and connection resilience. Its integration of multiplexed streams, congestion control, and cryptographic security have positioned QUIC as the foundation for hypertext transfer protocol (HTTP)/3 and other emerging network applications. Key functions of QUIC include the following.
- Connection establishment and zero-round-trip time (RTT) handshake: QUIC reduces the connection setup time by integrating the handshake with transport layer security (TLS) 1.3, enabling encrypted connections in a single round trip. For repeat connections, QUIC supports 0-RTT resumption, minimizing latency for recurrent communication sessions.
- Multiplexed streams without head-of-line (HoL) blocking: unlike TCP, which enforces strict in-order delivery, QUIC supports multiple independent streams within a single connection. This prevents HoL blocking, where packet loss in one stream delays the delivery of other data, leading to smoother web browsing and real-time communication.
- Connection migration and stateless reset: QUIC connections are identified by connection identification (IDs) instead of internet protocol (IP) addresses, allowing seamless migration between networks (e.g., switching from Wi-Fi to mobile data) without requiring a new handshake. Additionally, QUIC enables stateless resets, allowing servers to discard inactive connections efficiently.
- Congestion and flow control: QUIC implements sophisticated congestion control algorithms, such as cubic congestion control (CUBIC) and bottleneck bandwidth and round-trip (BBR) propagation time, to optimize throughput and minimize packet loss. Flow control mechanisms prevent buffer overflow by dynamically adjusting window sizes based on network conditions.
- Encryption and security: all QUIC packets, except initial handshake messages, are encrypted using Transport Layer Security (TLS) 1.3. This enhances privacy, prevents traffic tampering, and protects against attacks like injection and spoofing. QUIC also obfuscates transport headers, making it more resilient against passive traffic analysis.
- Error correction and reliability: while QUIC operates over UDP, it includes features traditionally associated with TCP, such as automatic retransmissions and acknowledgment mechanisms. Forward error correction (FEC) is used to further enhance reliability in lossy networks.
- Improved Web performance: QUIC’s low-latency design significantly enhances page load times and video streaming experiences. By minimizing handshake delays and avoiding HoL blocking, QUIC reduces buffering and ensures smoother media delivery.
- Enhanced mobile connectivity: With support for connection migration, QUIC ensures uninterrupted communication when switching between network interfaces, making it ideal for mobile applications and IoT deployments.
- Optimized cloud and CDN services: content delivery networks (CDNs) benefit from QUIC’s efficient transport mechanisms, leading to a reduced server load, improved cache efficiency, and better scalability.
- Better performance in high-loss networks: QUIC’s adaptive retransmission strategies and advanced congestion control make it well-suited for high-latency and lossy environments, such as satellite networks and wireless communication.
By integrating these functions and services, QUIC represents a significant evolution in transport layer protocols, paving the way for more efficient and secure Internet communication.
In addition to Markov modeling, the cluster-based analysis of interarrival times provides information on QUIC traffic patterns. By applying unsupervised learning techniques, we identified distinct traffic states, classified congestion levels, and optimized flow management strategies in this study. Clustering methods, such as k-means, Gaussian mixture models (GMM), and hierarchical clustering, were used to reveal hidden structures in the interarrival time series for anomaly detection and traffic classification. The results provide basic information on optimizing QUIC performance in deployments, improving adaptive retransmission strategies, and designing efficient load-balancing mechanisms for high-speed networks.
We developed an integrated method for QUIC traffic analysis by combining Markov models and cluster-based techniques to study interarrival time (IAT) dependence on different parameters. The developed method helps understand QUIC’s transport dynamics to enhance protocol optimizations and network performance.
This article contains the following parts: Section 2 discusses the related work with the performance analysis of the QUIC mechanism and Markov modeling. Section 3 gives details of the analysis methodology. In Section 4, we present the network traffic measurement scenario and analysis results of the sampled time series. In the end, we conclude and list ideas to continue this research.
2. Related Works
In this study, we referred to the performance evaluation methods of QUIC and the Markov model.
2.1. Performance Analysis of QUIC Service
Google’s evolving QUIC protocol using inferred state machines and tests in diverse environments was analyzed in Ref. [1]. QUIC often outperforms TCP but struggles on mobile networks. Therefore, automated tools and broader evaluations were proposed to enhance QUIC’s performance and fairness. QUIC is considered a low-latency encrypted transport protocol by Google, marking a major shift in Internet transport [2]. QUIC-capable IPs tripled to 617.59 K since 2016, with Google and Akamai leading. QUIC accounts for up to 9.1% of traffic, largely driven by Google’s adoption. The advances in Internet transport protocols were reviewed in Ref. [2], focusing on evolving congestion control (including machine learning (ML)-based methods), new user-space protocols, including QUIC, stream control transmission protocol (SCTP) and datagram congestion control protocol (DCCP), and multipath transport solutions such as multipath TCP (MPTCP) [3]. These protocols are used to meet modern network demands beyond TCP’s capabilities.
The XLINK-based multi-path QUIC video transport system was tested on 3M+ Taobao short-video plays [4]. QUIC improved the quality of experience (QoE), robustness, smoothness, and latency while minimizing content delivery network (CDN) costs. XLINK cut chunk delay by up to 50%, frame latency by 32%, and rebuffering by 67%, with only 2.1% extra traffic. It has been examined how the maximum transmission unit (MTU) size, bandwidth, and UDP segment size affect looped UDP communication efficiency [5]. Using nonstationary multi-resolution analysis on 1080 uploads of a 10 MB file, three traffic modes and distinct behaviors in zero-crossing rates were identified: empirical, variational, and decomposition modes.
2.2. Markov-Based Modeling of Network Traffic
A Markov chain-based anomaly detection method was used to identify intrusions in computer systems [6]. Learned from normal behavior data, the model detects anomalies with low support probabilities. Tests on Solaris audit data showed 100% detection and 0% false alarms, demonstrating high effectiveness. A simple Markov modulated Poisson process (MMPP)-based Internet traffic model that approximates long-range dependence (LRD) characteristics in traces was proposed [7]. Based on sessions, flows, and packets, five intuitive parameters are used to replicate traffic behavior over relevant time scales. The model aligns well with real queuing behavior, making it useful for IP network design, planning, and performance analysis.
The hidden Markov model (HMM) was also used for analyzing Internet traffic at the packet level, focusing on inter-packet time (IPT) and packet size (PS) [8]. The model effectively captures dependencies and dynamics in traffic from diverse sources (SMTP, HTTP, network games, and messaging), demonstrating strong prediction and traffic simulation capabilities and low computational complexity. The model has the potential for traffic classification and understanding application-specific behavior. Various network traffic models highlight their strengths and limitations in capturing traffic characteristics. No single model fits all networks. For heavy-tailed traffic, models such as Pareto are preferred, while others, such as Markov models, may fail for high-speed networks. Therefore, efficient models are required to balance accuracy, simplicity, and tractability.
There are internet traffic-sharing challenges in information and communication technology (ICT), addressing congestion, connectivity issues, and cybercrime [9]. The Markov chain model enables service quality, traffic distribution, and solutions, including state probability, share loss, call attempts, and multi-operator environments, to optimize performance. Aceto et al. presented a Markov modeling approach for characterizing and predicting mobile app traffic [10]. They explored traffic patterns to provide a basis for network and service management and a predictive model to understand the traffic behaviors of mobile applications and improve network efficiency and performance.
High-speed networks often employ complex protocols and mechanisms, such as congestion control and flow control, to ensure the timely and secure delivery of data. These algorithms contribute to the non-stationarity of network dynamics. High-speed networks are strong nonlinear systems, as their data throughput is not directly proportional to the input load. With the nonlinear behavior of the network, small changes in the input traffic cause a significant impact on the network performance. One of the main sources of non-linearity is congestion, which leads to packet loss or delay and non-linear behavior. Furthermore, the complexity of network protocols, especially the flow control required due to resource constraints, causes nonlinearity. From this aspect, the QUIC mechanism requires evaluation based on mixed methods of classical statistics and new artificial intelligence-based solutions.
3. Methodology
The OPTICS clustering algorithm applied was able to determine groups of similar values inside each IAT time series. A Markov chain serves the evaluation of the spectral gap dependence on the network traffic parameters.
3.1. Adaptive Clustering: OPTICS
The OPTICS algorithm is a density-based clustering technique that extends the density-based spatial clustering of applications with noise (DBSCAN) to overcome its sensitivity to a single global distance threshold. Instead of forming a fixed number of clusters based on a predefined density, OPTICS generates an ordered representation of the data’s clustering structure, which allows the discovery of clusters of varying densities. The algorithm uses core distance (CD) and reachability distance (RD) to reorder the indices of points close to each other. Elements between adjacent vertices of RD belong to the same cluster. One of the two key parameters of the algorithm is the maximum threshold (ε) of neighborhood size, but it does not fix clusters based on it. The other is the minimum points (MinPts), which defines the minimum number of points required in a neighborhood for a point to be classified as a core point. The main steps of the OPTICS algorithm are as follows.
- Neighborhood identification: each data point is evaluated to determine whether it is a core point based on MinPts and its ε-neighborhood.
- Priority queue processing: the algorithm processes points in increasing order of their RD, maintaining a queue that dynamically expands clusters as new core points are discovered.
- Reachability plot construction: instead of assigning direct clusters, OPTICS constructs a reachability plot, which is a 1D visualization where clusters appear as valleys (Figure 1).
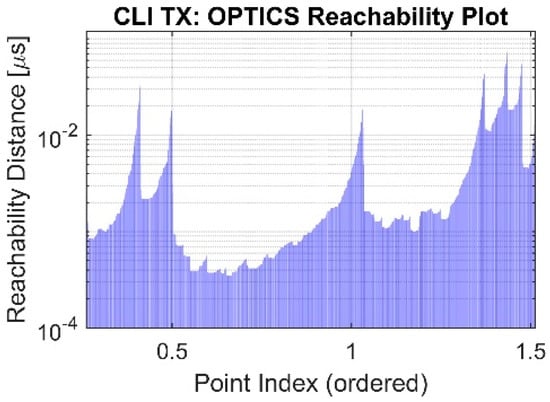 Figure 1. Reachability metric of OPTICS clustering algorithm.
The OPTICS algorithm was used to find clusters of varying densities and capture hierarchical structures, as it is less sensitive to ε compared with DBSCAN. OPTICS is widely used in geospatial analysis, anomaly detection, and network traffic analysis.
3.2. Markov Chain Modelling
A Markov chain is a stochastic process with the Markov property (Equations (1) and (2)):
for all t. The state space is and transitions are governed by the transition matrix P.
For stationary distributions, satisfies the following.
The mixing time is given by the reciprocal of the spectral gap as follows.
where is the second-largest eigenvalue of P. The hitting time is the expected steps to reach from .
If P is irreducible and aperiodic, the chain converges to at .
where is the total variation norm.
In Markov chains, state transition matrices, or more generally, linear systems and time series analysis, the eigenvalues of a matrix present the dynamics and stability of the system. Eigenvalues with large absolute values (~1) indicate slow mixing or the persistence of certain states. In a Markov chain, if an eigenvalue is close to 1, the system retains memory of its past for longer. The largest eigenvalue of a stochastic matrix is always 1, corresponding to the stationary distribution. Small absolute values (~0) correspond to fast-decaying modes. These states or modes lose influence quickly and die out over time. In a transition matrix, these correspond to transient or rarely visited state sequences. Complex eigenvalues suggest oscillatory or cyclical behavior in the system. The magnitude still indicates the decay rate, but the angle (argument) determines the rotation frequency. This is observed in multi-periodic systems, feedback processes, or systems with quasi-periodic transitions. This is relevant in the QUIC time series. Positive real eigenvalues typically indicate stable and non-oscillatory convergence to equilibrium. If close to 1, convergence is slow. If small, convergence is fast. This is typical for Markov models without cyclic behavior. Negative real eigenvalues indicate an alternating sign behavior, i.e., transitions flip back and forth between states (e.g., on–off behavior). If close to −1, it implies a strong alternation or oscillation between states. If the state matrix has complex eigenvalues, this supports multi-periodic or cyclical communication behavior. A large spectral gap indicates fast mixing; a small spectral gap means that state dependencies persist longer. Clusters in OPTICS mapping to Markov states with high persistence (large |λ|) indicate distinct operational phases of the transport protocol.
4. Results and Discussion
We executed file transfers transmitted by QUIC mechanisms. The same 10 MB file was uploaded from a client machine to the server under different environmental conditions in repeated form (Figure 2). Measurement of the traffic was executed on both sides, server and client network interface cards (NIC). Server time stamps in the time axis are marked with red circles. Yellow circles show sampling times at the client. There are short feedback acknowledgement (ACK) signals transmitted back to the client. Data frames have green color, ACK signals are colored as magenta. On the timeline IEEE 802.3 (Ethernet) frames are represented as rectangles. Green frames move in upward, magenta frames move downward directions. A set of data frames form a network layer (IP) packet, and a group of IP packets create a transport layer (UDP) protocol data unit, called segment.
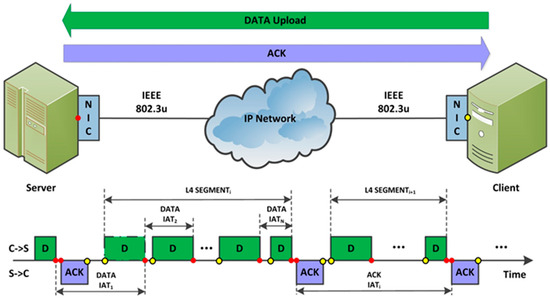
Figure 2.
Measurement of QUIC traffic. Red and yellow circles identify the server and client time stamps, respectively.
4.1. Measurement of QUIC Traffic
The elements of the independent parameter triple include the following: (1) the maximum frame size of the client machine’s network card; (2) the application-level data-transfer rate relative to the channel transfer rate; (3) the UDP segment size.
The IAT at the client (CLI Tx) and the server (SER Rx) were sampled by tcpdump utility. The possible values of the independent network parameters are as follows.
MTU[i] = 1260 + 40∙i [B], i = 1, 2, …, 6
Bw[j] = 37 + 3∙j [%], j = 1, 2, …, 21
SSize[k] = 1 + 3∙k [kB], k = 1, 2, …, 19
Therefore, the Ethernet maximum frame size was between 1300 and 1500 bytes, the application-level data transfer rate was between 40 and 100%, and the UDP segment was between 4 and 58 kB with increments defined in the equations. In contrast to Ref. [5], we measured the timestamp and size of the transmitted Ethernet frames in both directions, not only on the server but also on the client. During a total number of 6 × 21 × 19 = 2396 copies, the measurement time accuracy was 1 μs, and the frame length is an integer multiple of a byte.
QUIC implements flow control at two levels. In stream-level flow control, each stream within a QUIC connection has its flow control limits, allowing independent management of data flow. This ensures that blocking on one stream (e.g., due to congestion or application behavior) does not block others. In addition to per-stream limits, QUIC applies a global flow control limit for the entire connection to prevent the receiver from being overwhelmed. QUIC uses the following frame types to manage flow control:
- (1)
- MAX_DATA: increases the connection-level data limit;
- (2)
- MAX_STREAM_DATA: increases the data limit for a particular stream;
- (3)
- DATA_BLOCKED: sent by the sender if it wants to send but is blocked by connection-level limits;
- (4)
- STREAM_DATA_BLOCKED: sent if blocked by stream-level limit.
The sender is only allowed to send data up to the advertised limits. When the receiver processes data, it increases the limits, effectively giving the sender more credit. The flow control window is adjusted dynamically based on application and system behavior. This allows adaptive behavior in response to resource availability or changing application requirements. Because QUIC operates on top of UDP, and is independent from the transport layer service, flow control in multiplexed streams is used per stream without incurring head-of-line blocking across streams, unlike TCP.
4.2. Markov Chain and Steady State of Transition Matrix
The OPTICS algorithm creates dynamic clusters of the IAT time series on both sides: CLI Tx and SER Rx. The IAT clusters are presented in Figure 3a,d. The width of the clusters depends dynamically on the values. In this measurement, the number of IAT CLI Tx clusters is three, with a relatively large range in the clusters. At the reception side, the same traffic is grouped into eight clusters, some of which have a very thin range. The corresponding Markov transition matrix with the steady states is shown in Figure 3b,e, respectively. At the CLI Tx, two clusters ( and ) are important, and the third one has negligible probability. At the SER Rx state, has a 0.545 steady probability, and the rest of the states converge back to .
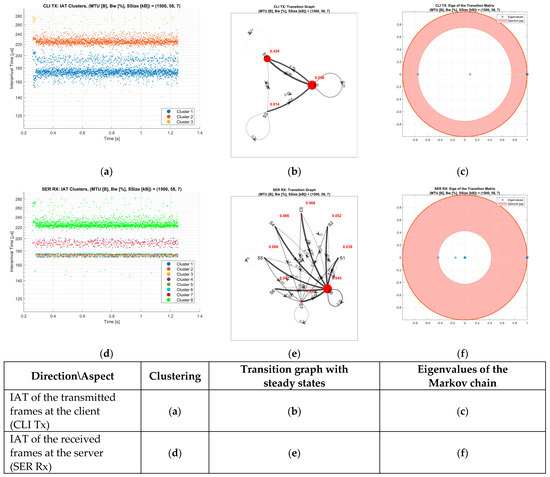
Figure 3.
Properties of IAT time series. Measurement case:
Very low transition probabilities exist between the other pairs of states (Figure 3e). The number of eigenvalues of the transition matrix enables the diversity of the IAT time series. At the CLI Tx, we have two eigenvalues inside the unitary circle. The largest eigenvalue is always 1, because of the convergence of the Markov transition matrix. The spectral gap is the distance between the absolute values of the first two eigenvalues. On the CLI Tx side, we have just two subunitary eigenvalues.
Both are real, and and the spectral gap is small providing oscillation with a slow convergence rate to the steady state. This proves close similarities between the states and . At the SER Rx, there are eight real eigenvalues, except for the second and third eigenvalues, and the majority of them are close to zero. allows a larger spectral gap and a faster convergence rate to the steady state. Another measurement example has a smaller bandwidth and larger segment size (Figure 4). In this case, we do not have just real, but complex eigenvalues at both sides as well. The number of clusters (states) at the CLI Tx and the SER Rx are six and nine, respectively. The second and third eigenvalues are complex conjugate on both sides.
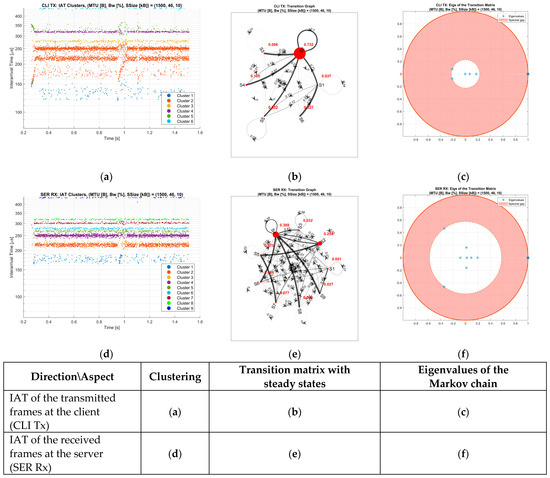
Figure 4.
Properties of the IAT time series. Measurement case:
At CLI Tx these eigenvalues have small absolute values, providing a large spectral gap and probability (0.732) of state (Figure 4b,c). At SER Rx, the | offers a relatively considerable spectral gap with a significant steady-state probability of and of 0.254 and 0.369, respectively.
We determine the spectral gap in three series of cases by setting two of the orthogonal parameters constant and letting the third change. As a function of the value of the third parameter, we obtain the dependence of the spectral gap. The spectral gap range is divided into three equal intervals, represented by three horizontal bands.
Just one of the MTUs makes a zero spectral gap () at the CLI Tx (Figure 5a). For all of SER Rx, the spectral gap is larger than 0.5 for each MTU. The parameter Bw makes two times zero the spectral gap at the CLI Tx, but at the SER Rx, except for one, all are greater than 0.5. For and , the spectral gap is similar at the transmitter and receiver sides (Figure 5b). A strong similar dependence of the spectral gap at the CLI Tx and SER Rx provides the segment size parameter.
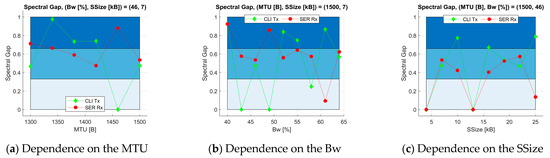
Figure 5.
Properties of the Markov chain spectral gap.
A zero spectral gap is provided at both communication sides for and . A strong correlation exists for each segment size, except for , where the transmitter keeps fast convergence to the steady state, but the receiver has a low spectral gap (Figure 5c). For , the spectral gap behaves in the opposite way at the client and the server. The routers and switches of the IEEE 802.2u local area network infrastructure between the communication sides lead to this property.
The rest of the SSize values provide a spectral gap larger than 0.4. We should note that nothing more significant than 0.8 increases the spectral gap for any value.
5. Conclusions
We demonstrate that combining the Markov model with cluster-based analysis enables an understanding of QUIC transport dynamics. By analyzing interarrival times under varying MTU, bandwidth, and segment size conditions, it is found that these parameters influence the flow behavior, state diversity, and convergence to steady states. The spectral gap is a key indicator of stability and responsiveness in traffic patterns. The results are important for tuning QUIC implementations to enhance adaptive flow control and optimize performance in complex network environments. By incorporating real-time QUIC traffic from diverse network environments and deep learning models with Markov-based clustering, the anomaly detection and traffic prediction abilities can be enhanced further. Additionally, by exploring the impact of QUIC’s congestion control variants (e.g., BBR vs. CUBIC) on the spectral gap behavior, adaptive flow management and protocol optimization can be significantly enhanced.
Author Contributions
Conceptualization, Z.G., M.B.G. and G.T.; methodology, Z.G., M.B.G. and G.T.; software, Z.G. and M.B.G.; validation, Z.G. and G.T.; formal analysis, G.T.; investigation, Z.G., M.B.G. and G.T.; resources, Z.G.; data curation, Z.G., M.B.G. and G.T.; writing—original draft preparation, Z.G., M.B.G. and G.T.; writing—review and editing, Z.G. and G.T.; visualization, Z.G., M.B.G. and G.T.; supervision, Z.G., M.B.G. and G.T.; project administration, Z.G.; funding acquisition, Z.G. All authors have read and agreed to the published version of the manuscript.
Funding
This research received no external funding.
Institutional Review Board Statement
Not applicable.
Informed Consent Statement
Not applicable.
Data Availability Statement
Data is contained within the article.
Acknowledgments
This research was supported by the QoS-HPC-IoT Laboratory and project TKP2021-NKTA of the University of Debrecen, Hungary. Project no. TKP2021-NKTA-34 has been implemented with the support provided by the Ministry of Culture and Innovation of Hungary from the National Research, Development and Innovation Fund, financed under the TKP2021-NKTA funding scheme. Another supporting project was OMAA 116öu7 of the Austro-Hungarian Action Foundation. The authors have reviewed and edited the output and take full responsibility for the content of this publication.
Conflicts of Interest
The authors declare no conflicts of interest.
Abbreviations
The following abbreviations are used in this manuscript:
| QUIC | Quick UDP Internet Connections |
| RTT | Round-Trip Time |
| HoL | Head-of-Line |
| IAT | Interarrival Time |
| OPTICS | Ordering Points To Identify the Clustering Structure |
| MTU | Maximum Transfer Unit |
| Bw | Bandwidth |
| SSize | Segment Size |
| CLI Tx | Client Transmit Ethernet frames |
| SER Rx | Server Receive Ethernet frames |
References
- Kakhki, A.M.; Jero, S.; Choffnes, D.; Nita-Rotaru, C.; Mislove, A. Taking a long look at QUIC: An approach for rigorous evaluation of rapidly evolving transport protocols. In Proceedings of the 2017 Internet Measurement Conference, London, UK, 1–3 November 2017; pp. 290–303. [Google Scholar]
- Rüth, J.; Poese, I.; Dietzel, C.; Hohlfeld, O. A First Look at QUIC in the Wild. In Passive and Active Measurement, PAM 2018; Beverly, R., Smaragdakis, G., Feldmann, A., Eds.; Lecture Notes in Computer Science; Springer: Cham, Switzerland, 2018; Volume 10771. [Google Scholar]
- Polese, M.; Chiariotti, F.; Bonetto, E.; Rigotto, F.; Zanella, A.; Zorzi, M. A Survey on Recent Advances in Transport Layer Protocols. IEEE Commun. Surv. Tutor. 2019, 21, 3584–3608. [Google Scholar] [CrossRef]
- Zheng, Z.; Ma, Y.; Liu, Y.; Yang, F.; Li, Z.; Zhang, Y.; Zhang, J.; Shi, W.; Chen, W.; Li, D.; et al. XLINK: QoE-driven multi-path QUIC transport in large-scale video services. In Proceedings of the 2021 ACM SIGCOMM 2021 Conference, Virtual, 23–27 August 2021; pp. 418–432. [Google Scholar]
- Gál, Z.; Terdik, G. On the patterns of the nonstationary datagram based fast communication processes. Ann. Math. Inform. 2023, 58, 41–55. [Google Scholar] [CrossRef]
- Ye, N. A Markov chain model of temporal behavior for anomaly detection. In Proceedings of the 2000 IEEE Systems, Man, and Cybernetics Information Assurance and Security Workshop, West Point, NY, USA, 6–7 June 2000; p. 169. [Google Scholar]
- Muscariello, L.; Mellia, M.; Meo, M.; Marsan, M.A.; Cigno, R.L. Markov models of internet traffic and a new hierarchical MMPP model. Comput. Commun. 2005, 28, 1835–1851. [Google Scholar] [CrossRef]
- Dainotti, A.; Pescapé, A.; Rossi, P.S.; Palmieri, F.; Ventre, G. Internet traffic modeling by means of Hidden Markov Models. Comput. Netw. 2008, 52, 2645–2662. [Google Scholar] [CrossRef]
- More, S.; Shukla, D. Review on Internet Traffic Sharing Using Markov Chain Model in Computer Network. 2018. Available online: https://link.springer.com/chapter/10.1007/978-981-10-7641-1_7 (accessed on 13 May 2025).
- Aceto, G.; Bovenzi, G.; Ciuonzo, D.; Montieri, A.; Persico, V.; Pescapé, A. Characterization and Prediction of Mobile-App Traffic Using Markov Modeling. IEEE Trans. Netw. Serv. Manag. 2021, 18, 907–925. [Google Scholar] [CrossRef]
Disclaimer/Publisher’s Note: The statements, opinions and data contained in all publications are solely those of the individual author(s) and contributor(s) and not of MDPI and/or the editor(s). MDPI and/or the editor(s) disclaim responsibility for any injury to people or property resulting from any ideas, methods, instructions or products referred to in the content. |
© 2025 by the authors. Licensee MDPI, Basel, Switzerland. This article is an open access article distributed under the terms and conditions of the Creative Commons Attribution (CC BY) license (https://creativecommons.org/licenses/by/4.0/).