Proceeding Paper

Tailoring the Optical and Sensing Properties of Sol–Gel Niobia Coatings via Doping with Silica and Noble Metal Nanoparticles †

1
Institute of Optical Materials and Technologies “Acad. J. Malinowski”, Bulgarian Academy of Sciences, Akad. G. Bonchev Str., Bl. 109, 1113 Sofia, Bulgaria
2
National Centre of Excellence Mechatronics and Clean Technologies, 8 Kliment Ohridski Blvd, 1756 Sofia, Bulgaria
3
Faculty of Physics, University of Sofia, 5 James Bourchier Blvd., 1164 Sofia, Bulgaria
*
Author to whom correspondence should be addressed.
Presented at the 4th Coatings and Interfaces Online Conference, 21–23 May 2025; Available online: https://sciforum.net/event/CIC2025.
Eng. Proc. 2025, 105(1), 4; https://doi.org/10.3390/engproc2025105004
Published: 14 August 2025

Abstract

Nb2O5 (niobia) coatings were prepared by spin coating of niobium sol, synthesized using niobium chloride as the precursor and ethanol and water as solvents, followed by high-temperature annealing. Doping of the films was achieved by incorporating commercially available SiO2 (Ludox) and noble metal nanoparticles (NPs) into the sol prior to its deposition. Various sizes of Pt (5 and 30 nm), Ag (10, 20, and 40 nm), and Au (5, 10, and 20 nm) NPs were used to enhance sensing behavior of coatings. After annealing, films were subjected to chemical etching to remove the silica phase. This process generated porosity within the films, which in turn enabled the tailoring of both their optical and sensing properties. It was demonstrated that both the type and size of the incorporated nanoparticles significantly influenced the sensing behavior. The most effective enhancement was observed with the addition of 10 nm AuNPs. Optical characterization indicated that 10 nm AuNPs had a minimal effect on the optical properties. In contrast, doping with 20 nm AuNPs led to a reduction in the refractive index and an increase in Urbach energy. No significant alteration in the optical band gap due to doping was observed.

1. Introduction

Niobium pentoxide (Nb2O5, or niobia) is an n-type semiconductor with an optical band gap typically ranging from 3.2 eV to 4.0 eV. It is both thermally and chemically stable, exhibiting strong resistance to corrosion in acidic and alkaline environments [1], which makes it suitable for a wide range of applications in advanced technology fields. Owing to its relatively large band gap, niobia is transparent in the visible and near-infrared (NIR) spectral ranges, which in combination with its high refractive index (greater than 2.2 in the visible range) makes Nb2O5 an attractive material for optical applications such as optical waveguides [2], interference filters [3], and electrochromic devices [4]. Additionally, its high refractive index allows for tailoring of optical properties, further expanding its potential application areas. Niobia was also used as a filler within a niobium oxide matrix in order to increase the corrosion resistance, contact angle, and mechanical strength [5].
Similar to many other metal oxides, Nb2O5 is a promising material for gas-sensing applications [6,7,8]. The adsorption of gas molecules on the surface of the sensing material can induce measurable changes in its electrical conductivity. It is well established that the sensitivity of a sensing medium is strongly influenced by the synthesis method employed. Among various approaches, the sol–gel method stands out as a simple, cost-effective, and low-temperature deposition technique that can be conducted under ambient conditions. In the sol–gel process, the material is synthesized from small precursor molecules in solution (sol), building an integrated network (gel) guided by two key reactions: hydrolysis and condensation. In the former process, reactive Nb–OH groups are formed, while the condensation step results in the creation of bridging oxygen bonds within the niobia matrix. The sol–gel route is also suitable for preparation of mixed metal oxides, which can enhance the surface acidity and redox properties of the resulting composite, thereby improving its catalytic and sensing performance [9,10,11]. Furthermore, sol–gel synthesis has the flexibility to produce porous Nb2O5 materials using both soft and hard templating strategies [12,13,14]. Nowadays it is well understood that porosity plays a paramount role in gas sensing, as it increases the specific surface area of the material and facilitates gas diffusion, yielding an increased interaction between the gas molecules and the sites of the sensing medium, thus enhancing the sensor’s overall performance.
An effective strategy for further increasing the number of active sites in Nb2O5 is doping with nanoparticles (NPs). Studies have shown that NPs can generate a large number of oxygen vacancies, thereby enhancing both the catalytic activity for oxidation reactions and the electrochemical properties of the material [15,16,17,18,19]. Since gas sensing relies on interactions between gas molecules and active sites located on the surface and within the bulk of the sensing material, it is reasonable to expect that NP doping will also lead to improved sensitivity.
In our previous studies, we demonstrated that high-quality dense and porous Nb2O5 films can be successfully prepared using sol–gel synthesis combined with the spin-coating technique [12,13,14]. To induce porosity, we employed commercially available block copolymers (Pluronic®) and silica nanoparticles (Ludox®) as sacrificial templates. These templates were removed from the niobia matrix either by thermal annealing (in the case of Pluronic®) [12,13] or by selective etching following preliminary annealing (in the case of Ludox®) [14].
In this study, we prepared sol–gel-derived Nb2O5 coatings co-doped with SiO2 (silica) and noble metal nanoparticles. Silica doping was accomplished by means of Ludox®, a commercially available colloidal solution of silica nanospheres with an average diameter of 13 ± 2 nm [14]. Noble metal doping was achieved using colloids of gold (Au), silver (Ag), and platinum (Pt), with particle sizes ranging from 5 to 40 nm. For all samples, the sol-to-Ludox ratio was fixed at 20:1, based on prior results indicating this ratio as optimal for gas-sensing performance [14]. The Ludox-to-nanoparticle ratio was varied (1:1, 1:3, and 1:4) to control the concentration of noble metal NPs within the films. The films were deposited using the spin-coating technique and subsequently annealed at 320 °C for 30 min. Silica was then selectively removed by etching in a very dilute aqueous solution of nitric and hydrofluoric acids, creating porosity within the films by leaving voids in the silica bed. The optical and gas-sensing properties of the films were investigated to reveal their dependences on the type and size of the incorporated nanoparticles. These effects are systematically presented and discussed in the following sections.

2. Materials and Methods

2.1. Preparation of Doped Nb2O5 Thin Films

The combination of sol–gel and spin-coating methods was implemented for deposition of Nb2O5 thin films on silicon wafer substrates. NbCl5 (99%, Sigma-Aldrich, Saint Louis, MO, USA) was used as a precursor. In the first step of sol preparation, 0.400 g NbCl5 and 0.6 mL ethanol (96%, Chempur, Piekary Śląskie, Poland) were sonicated for 30 min. For proper dissolution, the temperature in the ultrasound bath should not exceed 25–30 °C. To meet this requirement, we kept the sol in refrigerated water and periodically added ice to the bath. Next, 3 mL of ethanol and 0.17 mL of distilled water were added to the sol, after which the mixture was subjected to sonication for 30 min. Subsequently, 2.7 mL of ethanol was introduced, and the resulting dispersion was filtered through a membrane with a pore size of 450 nm. Finally, an additional 2 mL of ethanol was added to the filtrate. The solution was aged for 24 h at ambient conditions prior to thin film deposition. We have already demonstrated that Nb2O5 films prepared from a 24 h aged Nb sol exhibit a higher refractive index compared to films derived from either a non-aged sol or a sol aged for a longer period [20].
For silica doping, the commercially available product Ludox® (LUDOX® AS-30 colloidal silica, Grace, Worms, Germany) was used. This is a stabilized colloidal solution containing SiO2 spheres with a weight concentration of 30 wt% and a particle diameter of approximately 13 nm. For noble metal nanoparticle doping, stabilized aqueous colloids were employed, including gold nanoparticles (AuNPs) with diameters of 5, 10, and 20 nm; silver nanoparticles (AgNPs) with diameters of 10, 20, and 40 nm; and platinum nanoparticles (PtNPs) with diameters of 5 and 30 nm.
To prepare both undoped and doped coatings, Ludox was mixed with distilled water or metal NP dispersions at ratios of 1:1, 1:3, and 1:4, respectively. Proper amounts of these mixtures were then added to the pre-prepared niobium sol, keeping the volume ratio of Nb sol-to-Ludox at 20-to-1. The specific recipes for the preparation of coatings are detailed in Table 1.
Thin films were prepared by the method of spin coating (Laurell WS-650MZ-23NPPB spin coater, North Wales, PA, USA) at rotation and acceleration rates of 4000 rpm and 1500 rpm/s, respectively. A short initial step (1.5 s) at a low spin rate (500 rpm) was included before reaching the targeted spinning rate to enhance the uniform spreading of the liquid across the substrate. After deposition, the samples were annealed for 30 min at a temperature of 320 °C in order to create the niobia matrix.
To enable potential application of the films in sensing, porosity was introduced by immersing them for 100 s in a solution consisting of 0.3 mL nitric acid (Chempur, Poland), 0.5 mL hydrofluoric acid (Chempur, Poland), and 109.2 mL distilled water. This step selectively removed the SiO2 nanoparticles, thereby creating free volume within the films.

2.2. Characterization of Films

Transmission electron microscopy (TEM) (JEOL JEM 2100, JEOL Ltd., Tokyo, Japan) and selected area electron diffraction (SAED) were used to study the morphology and structure of the films, respectively, while high-resolution transmission electron microscopy was applied for nanoparticle examination. Two different sample preparation techniques were applied in the course of the TEM investigation. In the first, the films were deposited onto sodium chloride (NaCl) substrates, annealed, and then immersed in distilled water. As the NaCl substrate dissolved, the film detached and floated on the water’s surface. It was then carefully retrieved and transferred onto a copper microscope grid. In the second preparation technique, films deposited onto Si substrates were detached from them by gentle scratching and transferred onto a carbon-covered microscope grid.
The optical constants—refractive index (n), extinction coefficient (k), and film thickness (d)—were determined by nonlinear curve fitting of reflectance spectra measured in the 320–900 nm spectral range, where film absorption is negligible. To calculate the optical band gap of the films, the absorption coefficient (α) was measured ellipsometrically in the 200–400 nm spectral range, where absorption is significant. These measurements were performed using a phase-modulated ellipsometer UVISEL 2 (Horiba Jobin Yvon, Horiba France SAS—Lyon, France).
The potential application of coatings in vapor sensing was demonstrated by measuring their reflectance spectra using a UV-VIS-NIR spectrophotometer (Cary 05E, Varian, Australia) under different ambient conditions: air, argon, and acetone vapors delivered by a home-made system [21]. To eliminate the influence of varying ambient conditions, we purged the sample chamber with dry argon gas prior to the acetone vapor test, continuing until the signal stabilized. The refractive index change, due to absorption and condensation of the analyte (acetone vapors) within the pores, was then calculated using the previously developed iso-line method [22].

3. Results and Discussion

In this study, we prepared Nb2O5 films doped with both noble metal nanoparticles (NPs) and SiO2 NPs, the latter sourced from the commercially available product Ludox. Gold (Au), silver (Ag), and platinum (Pt) nanoparticles of various sizes (ranging from 5 to 40 nm; see Table 1) were used. For all samples, the Nb sol-to-Ludox ratio was fixed at 20:1, as our previous investigations [14] have shown that this ratio yields the highest sensitivity to acetone vapors. As shown in Table 1, the type, the size, and the concentration of nanoparticles were systematically varied. As the concentration of NPs increased, the volume of Nb sol and Ludox was reduced, maintaining a total volume (Nb sol + Ludox + NPs + H2O) of 1000 μL in all cases. To study the influence of metal NP doping on the sensing behavior of Nb2O5–SiO2 films, we also prepared a series of control films without metal nanoparticles (designated NbSi1, NbSi2, and NbSi3), maintaining the same 20:1 Nb sol-to-Ludox ratio. The only difference among these control samples was the amount of added water, adjusted to match the amount of NP dispersion in the doped samples. In such a way, it was ensured that the thickness difference between doped and undoped films remained negligible, allowing for a reliable comparison of their sensing performance. The last column of Table 1 displays the masses of NbCl5, Ludox, and NPs in 1 mL of prepared solution used for deposition of each coating.

3.1. Introducing Porosity in Niobia Thin Films

As previously mentioned, after annealing, the films undergo selective dissolution of the SiO2 nanoparticles to introduce porosity. Following each etching step, the film’s reflectance spectrum is measured, and its refractive index and thickness are determined. The films are considered as an effective medium comprising three phases—Nb2O5, SiO2 and free space (air). Employing Bruggeman effective medium approximation relating the volume fractions and dielectric constants of these phases, we calculated the temporal dependences of the volume fractions of each phase [14]. The results are presented in Figure 1a.
It can be observed that during the first 30 s of etching, the film composition remains unchanged. Beyond this point, the volume fraction of SiO2 begins to decrease, while the free volume (air) increases, indicating the onset of silica dissolution. After 120 s, SiO2 is completely removed from the film; however, the free volume continues to grow. A slight decrease in the niobia volume fraction suggests minor dissolution of Nb2O5 as well.
Figure 1b shows the film thickness as a function of etching time. It is seen that the film thickness remains nearly constant up to 210 s of etching, indicating structural stability. After 240 s, however, the film thickness decreases from 158 nm to 124 nm, indicating the beginning of matrix destruction. Etching beyond this point leads to a drastic decrease in the film thickness and complete damage to the film.
Although Figure 1a presents the temporal evaluation of volume fractions of phases in the particular sample NbSi1, the same behavior is expected for NbSi2 and NbSi3 samples. This is because the dissolution process is primarily governed by the Nb sol-to-Ludox ratio and is largely independent of the film thickness. Furthermore, a similar behavior is anticipated in the metal NP-doped films, as their only difference from the NbSi series is the presence of a small amount of noble metal nanoparticles, which do not influence the etching process.

3.2. Selection of Nanoparticle Type and Size

To optimize the type and size of metal nanoparticles, we prepared films doped with Au (5, 10, and 20 nm), Ag (10, 20, and 40 nm), and Pt (5 and 30 nm) nanoparticles, as listed in Table 1. Two identical films were deposited from each type. The volume ratio between Nb sol and Ludox is 20-to-1, while that between Ludox and NPs is 1-to-1. After annealing for 30 min at 320 °C, the films are immersed for 100 s in an etching solution composed of a very diluted aqueous mixture of nitric and hydrofluoric acids to selectively remove the silica phase. The concentration of etching solution is the same as that used for the films in Figure 1. This process generates porosity within the films. The sensing properties of these films were investigated by measuring their reflectance spectra in different environments: air, argon, and acetone vapors. When the ambient environment changes from argon to acetone, acetone vapors penetrate the film’s porous structure and condense within. This results in an increase in the film’s refractive index, which in turn alters the reflectance spectrum. By measuring the change in reflectance (ΔR), we can estimate the corresponding change in refractive index (Δn). The latter is preferable for comparing different samples, as it is independent of film thickness, allowing for a more reliable evaluation of sensing performance. However, determining Δn from ΔR is not straightforward, as there is no analytical expression for Δn-vs.-ΔR dependence. To overcome this, we developed an original method based on calculating iso-lines of theoretical reflectance change (ΔRth) in the n-d plane for various values of refractive index change (Δnth). The actual Δn is then determined as the value of Δnth that yields the measured ΔR at the point defined by the film’s refractive index (n) and thickness (d). A major advantage of the iso-line method is that it overcomes the significant difficulties associated with numerical differentiation (∂R/∂n) near the peaks of the reflection spectra when Δn is calculated from ΔR. In these regions, the first derivative (∂R/∂n) approaches zero, causing Δn to increase rapidly and resulting in large uncertainties in its determination. The iso-line method has no inherent limitations in its application. Its uncertainty is comparable to that of other numerical methods and primarily depends on the accuracy of the input parameters (n, k, and d) as well as the experimental precision of the reflectance (R) measurements. Further details about this method can be found elsewhere [22].
The calculated values of Δn for all studied samples using the iso-line approach are presented in Figure 2 along with the error bars calculated as the standard deviation from the average value of two samples.
Figure 2 shows that the refractive index change (Δn) is nearly the same for the undoped films and those doped with Pt (5 and 30 nm), Ag (10, 20, and 40 nm), and Au (5 nm) nanoparticles. However, a significant increase in sensitivity is observed when Au nanoparticles with sizes of 10 and 20 nm are used. Therefore we decided to continue the study by optimizing the AuNP doping concentration.

3.3. Doping with Au Nanoparticles (10 and 20 Nm) with Different Concentrations

The next step of our investigation focuses on films doped with previously selected gold nanoparticles (AuNPs) with sizes of 10 and 20 nm, incorporated at different concentrations. The volume ratio between Nb sol and Ludox remains fixed at 20:1, while the ratio between Ludox and AuNPs varies from 1:1 to 1:3 and 1:4 (see Table 1).

3.3.1. TEM Investigation

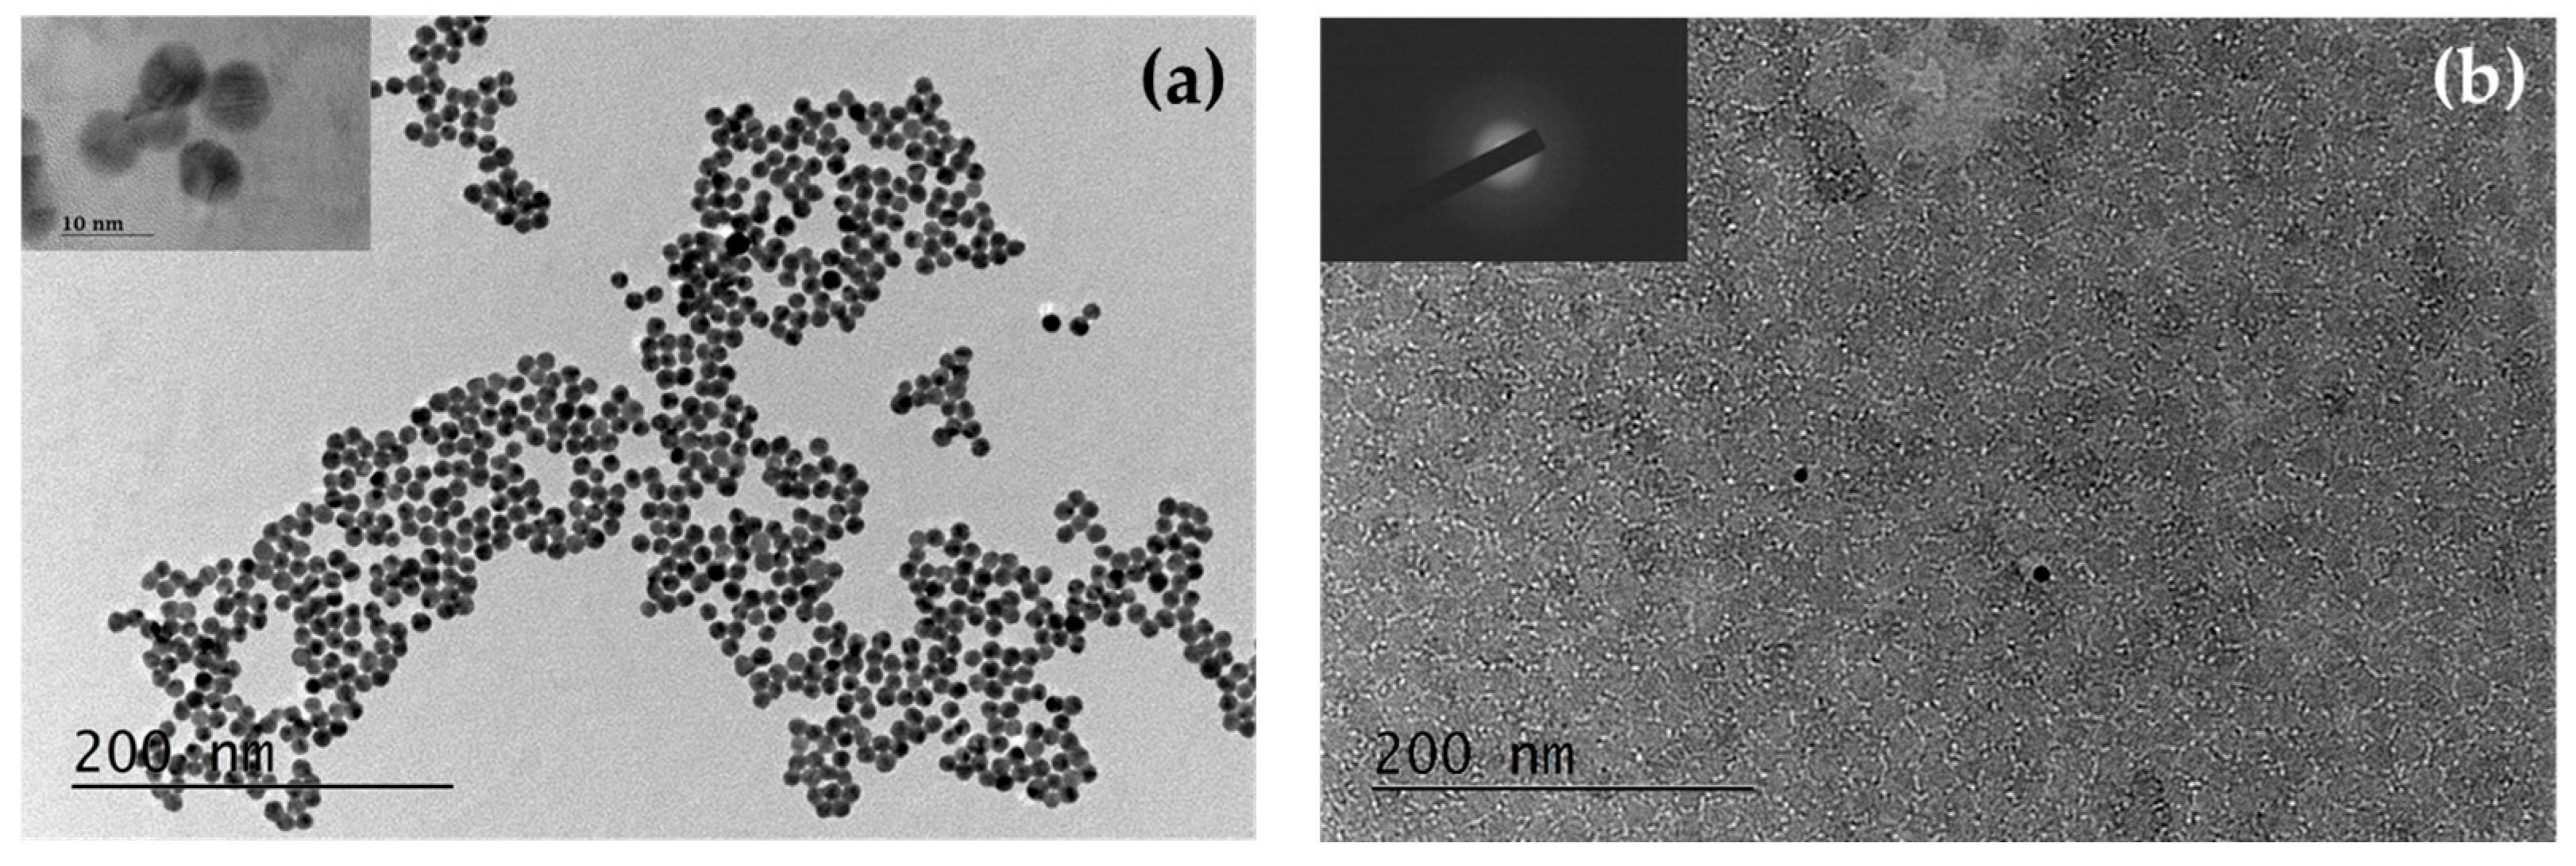
A TEM picture of AuNPs with an average diameter of 10 nm is presented in Figure 3a, where a high-resolution picture of AuNPs is presented as an inset as well. Both pictures confirm the average diameter of 10 nm and show spherical shapes. NPs are well separated and there is no aggregation. The film’s morphology (sample Au1b in Table 1) is illustrated with a TEM picture in Figure 3b. It is seen that the Ludox particles are uniformly distributed across the surface of the films. Since the pores are formed at the locations of these particles after etching, this suggests a uniform pore distribution as well. Because of the low NP concentration in the film, only two nanoparticles are seen at this magnification (40k) on the film’s surface. From our previous studies of Nb2O5 films doped with SiO2 NPs, we know that the films are amorphous [14]. The SAED (selected area electron diffraction) picture presented in Figure 3b as an inset confirms the amorphous status of AuNP-doped samples.

3.3.2. Refractive Index and Optical Band Gap

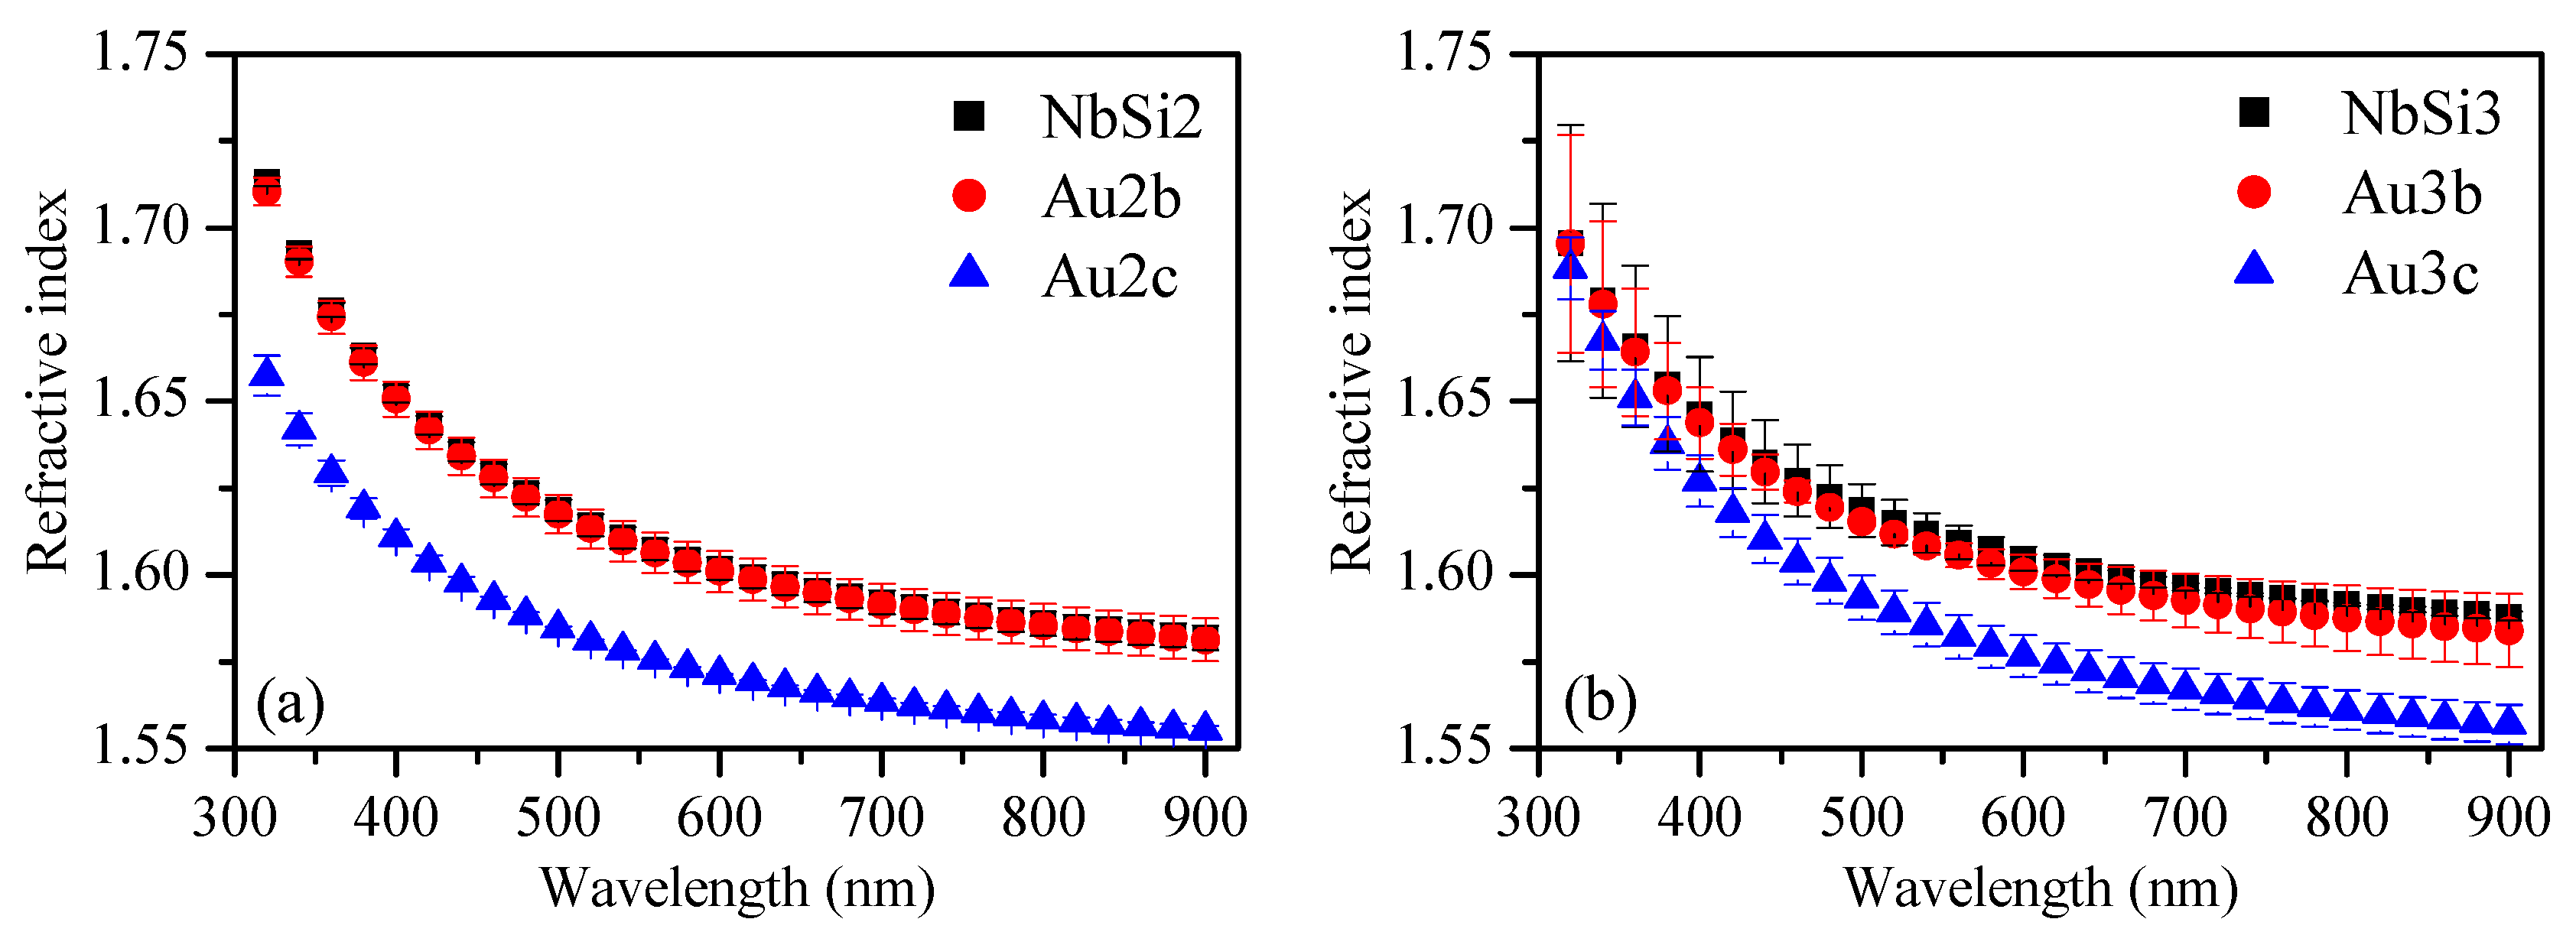
Figure 4 presents the dispersion curves of the refractive index (n), i.e., wavelength dependence of n, for Nb2O5/Ludox films doped with AuNPs of 10 and 20 nm at Ludox-to-AuNP ratios of 1:3 (Figure 4a) and 1:4 (Figure 4b). For comparison, the dispersion curves of undoped samples are also included. The error bars in Figure 4 are calculated as a standard deviation from the average value of two samples deposited at identical experimental conditions. The refractive index values at a wavelength of 600 nm are presented in Table 2. The results for both doped and undoped samples with a 1:1 ratio of Ludox to AuNPs are similar and therefore are not shown in Figure 4.
When the films are doped with 10 nm AuNPs, no significant change in the refractive index is observed compared to undoped samples, and this behavior is consistent across all three Ludox-to-AuNP ratios. In contrast, incorporation of 20 nm AuNPs results in a slight decrease in refractive index for the 1:3 and 1:4 ratios. However, the refractive index values for these two samples are similar within the margin of experimental error, indicating that there is no clear evidence of refractive index dependence on AuNP concentration.
Two possible reasons can explain the observed decrease in refractive index. The first relates to the optical properties of gold: in the visible spectral range, particularly at wavelengths above 550 nm, the real part of gold’s complex refractive index is very low (n < 0.5) [23]. As a result, incorporating Au nanoparticles into the films can lower their effective refractive index. The second possible reason is an increase in the film porosity upon incorporation of larger AuNPs (20 nm). These larger particles may introduce voids and nano-cracks during film formation, leading to a reduction in the overall density and thus the refractive index of the doped films.
The next step of optical characterization concerns the determination of the absorption coefficient, optical band gap and Urbach energy. Figure 5 shows absorption coefficient as a function of wavelength for undoped Nb2O5/Ludox films and films doped with 20 nm AuNPs. It is seen from Figure 5a that doping leads to an overall enhancement in the optical absorption of the films, which is expected due to the strong light absorption properties of gold nanoparticles embedded within the Nb2O5 matrix.
Two spectral ranges can be distinguished where the absorption coefficient exhibits different behavior. In the high-energy range, it is described by the power function (Equation (1)):
α = ( E E g ) m E ,
where Eg is the optical band gap, E is the photon energy and m is a parameter related to the type of the transition between valence and conduction bands. For Nb2O5, m = 2, indicating indirect allowed transitions [24]. Figure 5b shows the so-called Tauc plot where the squared product of alfa and E is plotted versus E. The optical band gap is determined from the linear part of the curve at (αE)1/2 = 0. The calculated band gap values are 3.55 eV for the undoped film and 3.58 eV for the film doped with 20 nm AuNPs, indicating minimal change in the fundamental absorption edge upon doping. To assess whether 0.03 eV is a significant difference, we calculated the errors in Eg arising from uncertainties in the calculated extinction and absorption coefficients. The results show that a 10% error in k leads to a shift of 0.02 eV in Eg. This shift increases to 0.03 eV when a 30% error in k is assumed. Therefore, the observed 0.03 eV change in Eg due to doping is comparable to the potential experimental uncertainty.
In the low-energy region, the absorption coefficient exhibits an exponential dependence on photon energy (Equation (2)), allowing for the estimation of the Urbach energy (EU) from the slope of the linear part of the curve ln (α/α0) versus E:
α = α 0 e x p E E U
The calculated EU values are 38 meV for the undoped film and 58 meV for the AuNP-doped sample. Similarly to the case of Eg, we calculated the errors in EU due to experimental errors in k and α. However, in contrast to the Eg case, a 30% error in k has a negligible effect on the Urbach energy, causing only a 0.4 meV shift in EU. The increase in Urbach energy suggests higher structural disorder in the doped film, likely due to the incorporation of gold nanoparticles. Localized surface plasmon resonance (LSPR) can contribute to the increased disorder at the nanoparticle–matrix interface by enhancing local electromagnetic fields [25,26]. Additionally, LSPR may induce local heating or bond rearrangement, further increasing structural disorder, which can manifest as a higher Urbach energy. Scattering from nanoparticles extends the optical path length within the sample, thereby enhancing light absorption and amplifying the absorption tail [27]. Since the latter is related to the Urbach energy, it is reasonable to expect that scattering may contribute to its increase as well.

3.3.3. Sensing

The sensing methodology is described in detail in Section 3.2. Briefly, niobia coatings doped with SiO2 and Au nanoparticles are placed in a quartz cell inside a spectrophotometer, and their reflectance spectra (R) are measured both before and during exposure to acetone vapors. The change in reflectance (ΔR) is then used to calculate the refractive index change (Δn) resulting from analyte absorption, using a previously developed iso-line method [22]. It is noteworthy to emphasize that, when comparing the sensing performance of different materials, Δn is a more reliable parameter than ΔR due to the fact that reflectance (R) is a periodic function of the film thickness (d) and can vary significantly with small changes in d. In contrast, the refractive index (n) is an intrinsic material property and is generally independent of the film’s thickness.
Figure 6 presents the calculated changes in refractive index (Δn) resulting from the exposure of the films to acetone vapor. The error bars in Figure 6 are calculated as a standard deviation from the average value of two samples deposited at identical experimental conditions. All samples show enhanced sensitivity after doping with 10 nm compared to the undoped films. The highest response is observed for Ludox-to-NP ratios of 1:1 and 1:3. Surprisingly, when bigger nanoparticles (20 nm AuNPs) are used, an improvement over the undoped sample is evident only at the 1:1 ratio. At higher nanoparticle loadings, the sensor response decreases, indicating a diminishing effect with increasing concentrations of larger nanoparticles.
The size-dependent enhancement of the sensing properties can be attributed to the higher surface area provided by 10 nm AuNPs compared to 20 nm AuNPs. This increased surface area offers more active sites for interaction with acetone molecules, both on the surface and within the volume of the Nb2O5 coating, leading to a higher overall response. Based on this logic, 5 nm AuNPs should theoretically provide even more active sites than 10 nm AuNPs due to their greater surface-to-volume ratio. However, as shown in Figure 2, the response of films doped with 5 nm AuNPs is similar to that of undoped films, indicating insignificant improvement in sensing performance. Two possible explanations for this behavior can be proposed: (i) Due to their small size, 5 nm AuNPs may agglomerate during annealing, thereby reducing their effective surface area. (ii) The size of the 5 nm AuNPs is comparable to the pore size of the Nb2O5 coating, which may allow them to penetrate into the pores and partially block gas diffusion pathways, ultimately decreasing the number of accessible active sites and reducing the overall sensing response.

4. Conclusions

Transparent niobium pentoxide (Nb2O5) films were successfully fabricated using the sol–gel technique in conjunction with spin coating. To introduce varying porosity into the films, silica nanoparticles were incorporated, and controlled etching durations were applied. The incorporation of metal nanoparticles (NPs) into the Nb2O5 matrix revealed a strong dependence of sensing performance on NP type and size. A significant increase in sensitivity was observed with the addition of gold nanoparticles (AuNPs) of 10 and 20 nm. In contrast, platinum (Pt) NPs (5 and 30 nm), silver (Ag) NPs (10, 20, and 40 nm), and smaller AuNPs (5 nm) did not yield any notable improvement in sensing characteristics. Doping the Nb2O5 films with 20 nm AuNPs resulted in a reduction in the refractive index from 1.60 to 1.57. This decrease was attributed to two factors: (i) the low real part of the refractive index of gold, which lowers the effective refractive index of the doped films, and (ii) an increase in film porosity due to the incorporation of the larger 20 nm AuNPs. Additionally, the Urbach energy increased from 38 meV in the undoped film to 58 meV in the doped sample, indicating enhanced structural disorder or a higher density of defect states due to scattering or local surface plasmon resonance effects. No significant alteration in the optical band gap was detected, indicating that fundamental electronic transitions remain largely unaffected.

Author Contributions

Conceptualization, T.B. and R.G.; methodology, T.B. and R.G.; software, T.B., R.G., G.A., P.T., V.P. and G.Z.; validation, T.B., V.P., G.Z. and P.T.; formal analysis, V.P., G.Z., P.T., B.G. and K.L.; investigation, V.P., G.Z., P.T., B.G. and K.L.; resources, T.B., K.L. and B.G.; data curation, T.B., P.T., V.P., G.Z., B.G. and K.L.; writing—original draft preparation, T.B.; writing—review and editing, T.B., R.G. and B.G.; visualization, T.B. and B.G.; supervision, T.B. and R.G.; project administration, T.B. and R.G.; funding acquisition, T.B. All authors have read and agreed to the published version of the manuscript.

Funding

This research was funded by the Bulgarian National Science Fund (BNSF) under Project KP-06-COST/29 (2024) and COST Action CA21159.

Institutional Review Board Statement

Not applicable.

Informed Consent Statement

Not applicable.

Data Availability Statement

Not applicable.

Acknowledgments

Research equipment from Distributed Research Infrastructure INFRAMAT, part of the Bulgarian National Roadmap for Research Infrastructures, supported by the Bulgarian Ministry of Education and Science, was used in this investigation. TB and BG acknowledge Project BG16RFPR002-1.014-0006 National Centre of Excellence Mechatronics and Clean Technologies funded by the European Regional Development Fund under Research Innovation and Digitization for Smart Transformation program 2021–2027.

Conflicts of Interest

The authors declare no conflicts of interest. The funders had no role in the design of the study; in the collection, analyses, or interpretation of data; in the writing of the manuscript; or in the decision to publish the results.

References

  1. Mahne, H.; Berger, L.; Martin, D.; Klemm, V.; Slesazeck, S.; Jakschik, S.; Rafaja, D.; Mikolajick, T. Filamentary resistive switching in amorphous and polycrystalline Nb2O5 thin films. Solid State Electron. 2012, 72, 73–77. [Google Scholar] [CrossRef]
  2. Saito, Y.; Shiosaki, T. Second harmonic generation in Nb2O5 thin-film optical waveguide deposited on LiTaO3 substrate by RF magnetron sputtering. Jpn. J. Appl. Phys. 1992, 31, 3164. [Google Scholar]
  3. Fredell, M.; Winchester, K.; Jarvis, G.; Locknar, S.; Johnson, R.; Keevers, M. Ultra-wide broadband dielectric mirrors for solar collector applications. In Proceedings of the SPIE OPTO, San Francisco, CA, USA, 24 February 2017. [Google Scholar]
  4. Ozer, N.; Rubin, M.D.; Lampert, C.M. Optical and electrochemical characteristics of niobium oxide films prepared by sol-gel process and magnetron sputtering A comparison. Sol. Energy Mater. Sol. Cells 1996, 40, 285–296. [Google Scholar] [CrossRef]
  5. Eduok, U. Niobia Nanofiber-Reinforced Protective Niobium Oxide/Acrylate Nanocomposite Coatings. ACS Omega 2020, 5, 30716–30728. [Google Scholar] [CrossRef]
  6. Wang, Z.; Hu, Y.; Wang, W.; Zhang, X.; Wang, B.; Tian, H.; Wang, Y.; Guan, J.; Gu, H. Fast and highly-sensitive hydrogen sensing of Nb2O5 nanowires at room temperature. Int. J. Hydrogen Energy 2012, 37, 4526–4532. [Google Scholar] [CrossRef]
  7. Lombardo, L.; Grassini, S.; Parvis, M.; Donato, N.; Gullino, A. Ethanol breath measuring system. In Proceedings of the IEEE International Symposium on Medical Measurements and Applications (MeMeA), Bari, Italy, 1 June–1 July 2020. [Google Scholar]
  8. Lombardo, L.; Grassini, S.; Parvis, M.; Donato, N.; Gullino, A. Niobium Pentaoxide Thin-Film Gas Sensor for Portable Acetone Sensing. In Proceedings of the International Conference on Advanced Technologies, Systems and Services in Telecommunications (TELSIKS), Nis, Serbia, 20–22 October 2021. [Google Scholar]
  9. Liu, J.; Zuo, S.; Lin, S.; Shan, B.; Zhou, X.; Zhao, J.; Qi, C.; Yang, P. Promoting the performance of Nb2O5 by doping transition metal oxide for catalytic degradation of monochlorobenzene and toluene. J. Mater. Res. Technol. 2023, 25, 3642–3653. [Google Scholar] [CrossRef]
  10. Tao, H.; Li, J.; Ma, Q.; Chen, Z.; Zhang, X.; Quan, Y.; Peng, Y.; Qi, C. Synthesis of W-Nb-O solid acid for catalytic combustion of low-concentration monochlorobenzene. Chem. Eng. J. 2020, 382, 123045. [Google Scholar] [CrossRef]
  11. Jin, Y.; Quan, Y.; Liu, J.; Qi, C.; Pan, P.; Shan, B.; Luo, H.; Peng, Y. Controlled synthesis of niobium and rare earth mixed oxides for catalytic combustion of chlorinated VOCs in the synthesis process of polyether polyol and polyurethane. J. Solid State Chem. 2022, 313, 123318. [Google Scholar] [CrossRef]
  12. Georgiev, R.; Christova, D.; Georgieva, B.; Babeva, T. Organic framework engineering in mesoporous Nb2O5 thin films used as an active medium for organic vapors sensing. Proc. SPIE 2018, 10691, 1069128. [Google Scholar]
  13. Georgiev, R.; Chorbadzhiyska, Y.; Pavlov, V.; Georgieva, B.; Babeva, T. Optical Detection of VOC Vapors Using Nb2O5 Bragg Stack in Transmission Mode. Photonics 2021, 8, 399. [Google Scholar] [CrossRef]
  14. Pavlov, V.; Georgiev, R.; Lazarova, K.; Georgieva, B.; Babeva, T. Hard-Templated Porous Niobia Films for Optical Sensing Applications. Photonics 2023, 10, 167. [Google Scholar] [CrossRef]
  15. Raba, A.; Barba-Ortega, J.; Joya, M. Effects of the presence of a metal doping agent in the properties of the Nb2−xMxO5 (M = Mn, Fe, and Ni) system. Int. J. Appl. Ceram. Technol. 2018, 15, 1577–1583. [Google Scholar] [CrossRef]
  16. Zeng, M.; Wu, Y.; Wang, Y.; Zhang, Z.; Fu, X.; Dai, W. Silver nanoparticle-enhanced photocatalytic CO2 reduction over Ag/Nb2O5 under UV–vis light irradiation. Appl. Catal. A Gen. 2023, 666, 119412. [Google Scholar] [CrossRef]
  17. Dien, L.X.; Truong, Q.D.; Murayama, T.; Chinh, H.D.; Taketoshi, A.; Honma, I.; Haruta, M.; Ishida, T. Gold Nanoparticles Supported on Nb2O5 for Low-Temperature CO Oxidation and as Cathode Materials for Li-ion Batteries. Appl. Catal. A Gen. 2020, 603, 117747. [Google Scholar] [CrossRef]
  18. Boruah, B.; Gupta, R.; Modaka, J.M.; Madras, G. Enhanced photocatalysis and bacterial inhibition in Nb2O5 via versatile doping with metals (Sr, Y, Zr, and Ag): A critical assessment. Nanoscale Adv. 2019, 1, 2748–2760. [Google Scholar] [CrossRef]
  19. Antonini, L.M.; Adamski, J.; Bernardi, F.; Aguzzoli, C.; Hübler, R.; Malfatti, C.F. Photoactivity of nanostructured porous Nb2O5: Effect of Pt, Ta, Cu, and Ti impregnation. Int. J. Ceram. Eng. Sci. 2022, 4, 379–390. [Google Scholar] [CrossRef]
  20. Lazarova, K.; Vasileva, M.; Marinov, G.; Babeva, T. Optical characterization of sol-gel derived Nb2O5 thin films. Opt. Laser Technol. 2014, 58, 114–118. [Google Scholar] [CrossRef]
  21. Lazarova, K.; Awala, H.; Thomas, S.; Vasileva, M.; Mintova, S.; Babeva, T. Vapor Responsive One-Dimensional Photonic Crystals from Zeolite Nanoparticles and Metal Oxide Films for Optical Sensing. Sensors 2014, 14, 12207–12218. [Google Scholar] [CrossRef]
  22. Georgiev, R.; Georgieva, B.; Lazarova, K.; Vasileva, M.; Babeva, T. Sol–gel tantalum pentoxide thin films with tunable refractive index for optical sensing applications. Opt. Quant. Electron. 2020, 52, 437. [Google Scholar] [CrossRef]
  23. Babeva, T.; Kitova, S.; Konstantinov, I. Photometric methods for determining the optical constants and the thicknesses of thin absorbing films: Criteria for precise and unambiguous determination of n, k, and d in a wide spectral range. Appl. Opt. 2001, 40, 2682–2686. [Google Scholar] [CrossRef]
  24. Falk, G.; Borlaf, M.; Bendo, T.; Novaes de Oliveira, A.P.; Rodrigues Neto, J.B.; Moreno, R. Colloidal Sol–Gel Synthesis and Photocatalytic Activity of Nanoparticulate Nb2O5 Sols. J. Am. Ceram. Soc. 2016, 99, 1968–1973. [Google Scholar] [CrossRef]
  25. Moon, C.W.; Choi, M.-J.; Hyun, J.K.; Jang, H.W. Enhancing photoelectrochemical water splitting with plasmonic Au nanoparticles. Nanoscale Adv. 2021, 3, 5981–6006. [Google Scholar] [CrossRef]
  26. Ibrahem, M.A.; Rasheed, B.G.; Mahdi, R.I.; Khazal, T.M.; Omar, M.M.; O’Neill, M. Plasmonic-enhanced photocatalysis reactions using gold nanostructured films. RSC Adv. 2020, 10, 22324–22330. [Google Scholar] [CrossRef] [PubMed]
  27. Kim, D.; Kim, Y. Extinction effect of gold nanocatalysts on photocatalytic activities under plasmonic excitation. Catalysts 2021, 11, 413. [Google Scholar] [CrossRef]
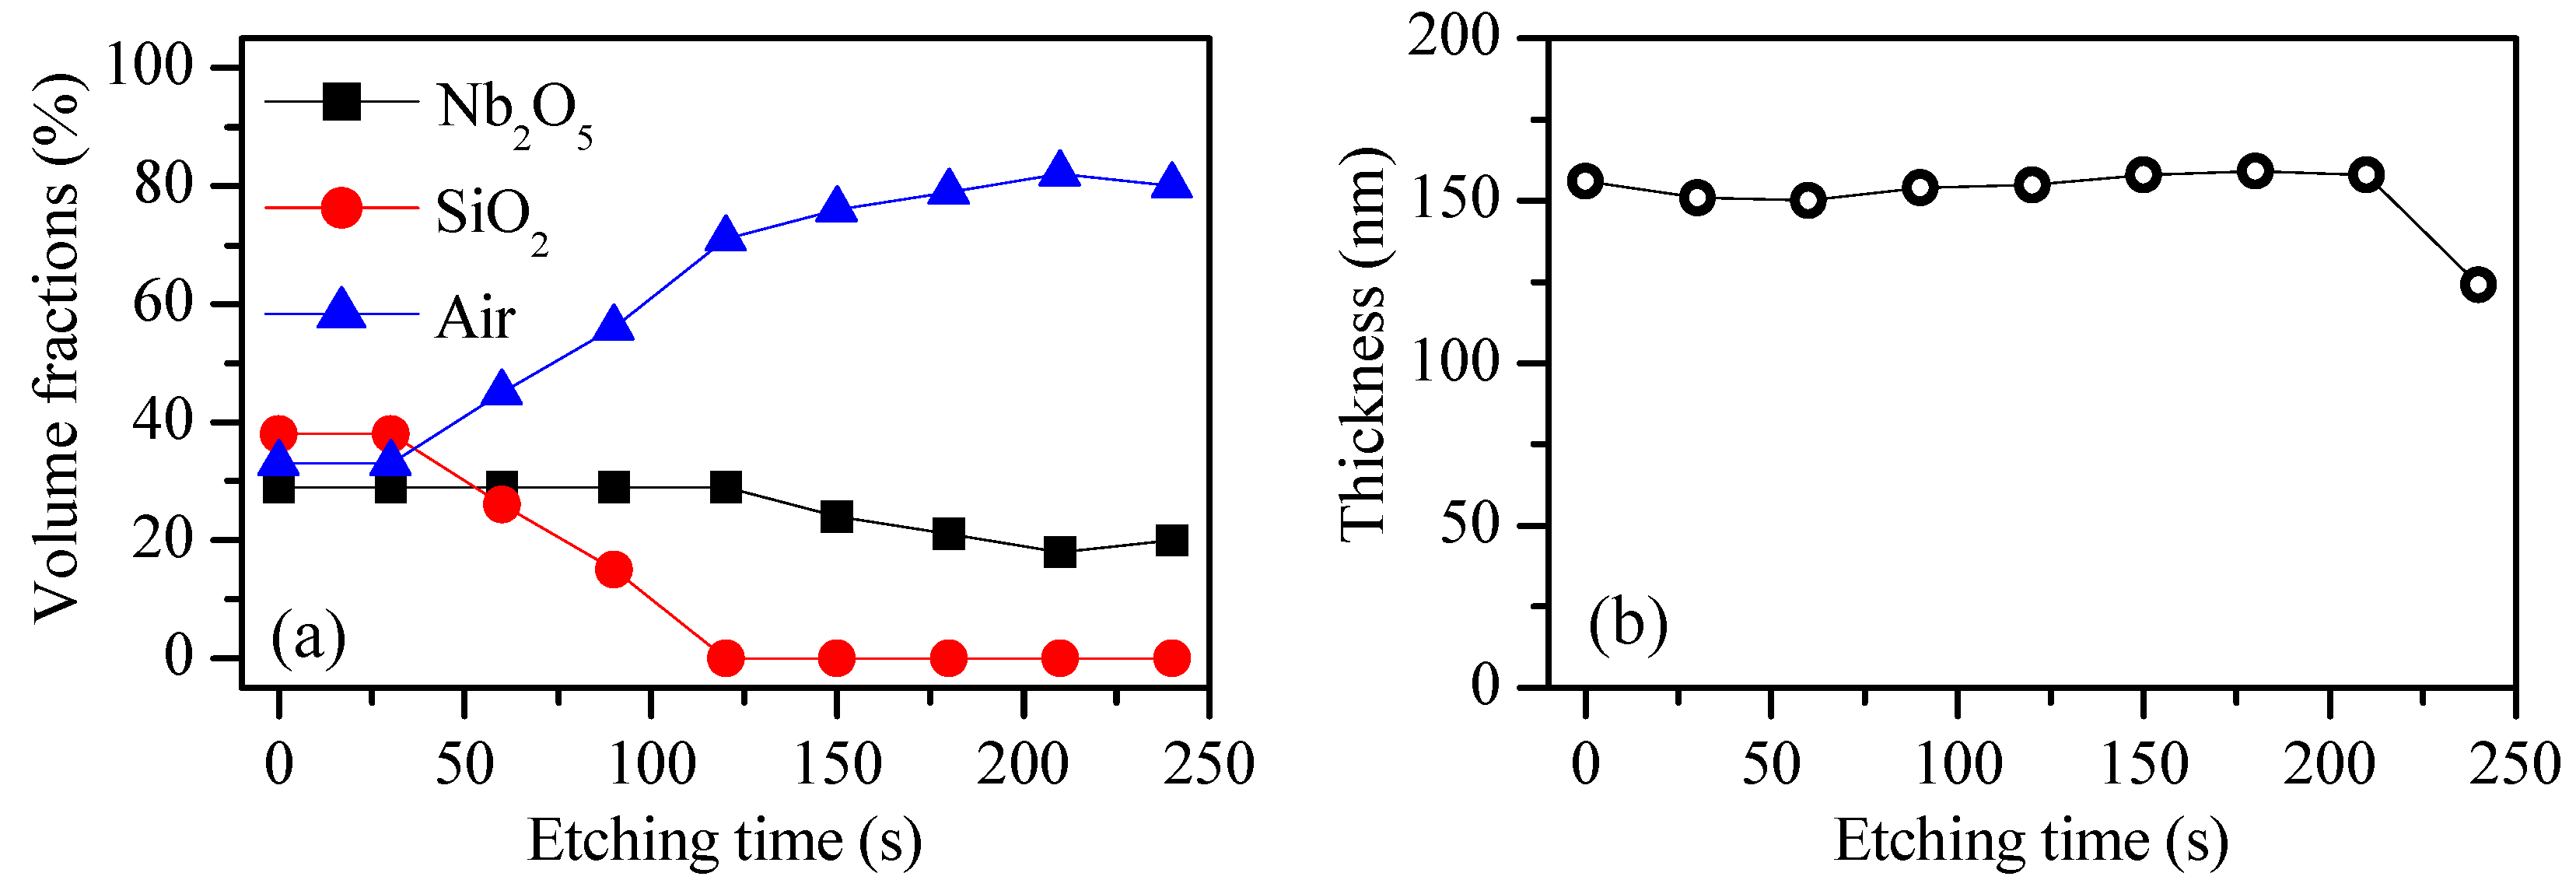
Figure 1. Volume fractions of Nb2O5, SiO2 and free volume (air) in the undoped film (NbSi1) as a function of etching time (a) and thickness of the film as a function of etching time (b).
Engproc 105 00004 g001
Figure 2. Calculated values of refractive index change (Δn) due to exposure to acetone vapors of the denoted samples described in detail in Table 1. The error bars are calculated as a standard deviation from the average value of two samples.
Engproc 105 00004 g002
Figure 3. (a) Transmission electron microscopy (TEM), and high-resolution TEM pictures as an inset, of gold nanoparticles (AuNPs) with an average diameter of 10 nm; (b) TEM picture, and SAED (selected area electron diffraction) as an inset, of a thin Nb2O5 film doped with both SiO2 nanoparticles (Ludox) and 10 nm AuNPs (see Table 1, sample Au1b).
Engproc 105 00004 g003
Figure 4. Dispersion curves of the refractive index for Nb2O5/Ludox thin films (NbSi2 and NbSi3 from Table 1) and Nb2O5/Ludox films doped with Au nanoparticles (AuNPs) of 10 nm (Au2b and Au3b) and 20 nm (Au2c and Au3c) at Ludox-to-AuNP ratios of 1:3 (a) and 1:4 (b). The error bars are calculated as a standard deviation from the average value of two samples.
Engproc 105 00004 g004
Figure 5. Dispersion curves of absorption coefficient (a) and Tauc plot (b) for Nb2O5/Ludox thin films (sample NbSi3 from Table 1) and films doped with 20 nm Au nanoparticles (AuNPs) (sample Au3c) at a Ludox-to-AuNP ratios of 1:4.
Engproc 105 00004 g005
Figure 6. Calculated values of refractive index change (Δn) due to exposure to acetone vapors of thin niobia coatings doped with SiO2 nanoparticles (Ludox) (series NbSix, x = 1, 2, 3 in Table 1) denoted as undoped and coatings doped with both SiO2 and gold nanoparticles (AuNPs) with sizes of 10 and 20 nm (series Auxb and Auxc, x = 1, 2, 3, Table 1). The x-axis values present the volume ratios of Ludox to water and Ludox to NPs in undoped and AuNP-doped coatings, respectively. The error bars are calculated as a standard deviation from the average value of two samples.
Engproc 105 00004 g006
Table 1. Description of the samples used in this study and the exact recipes for their preparation.
SampleNb Sol (μL)Ludox (μL)NPs (μL)NPs TypeNPs Size (nm)H2O (μL)NbCl5 (g):Ludox (g):NPs (g)
NbSi190945.50--45.54.27 × 10−2:1.37 × 10⁻²:0
NbSi2833.341.70--1253.90 × 10−2:1.25 × 10⁻²:0
NbSi3800400--1603.74 × 10−2:1.20 × 10⁻²:0
Au1a90945.545.5Au504.27 × 10−2:1.37 × 10⁻²:9.1 × 10⁻⁷
Au1b90945.545.5Au1004.27 × 10−2:1.37 × 10⁻²:9.1 × 10⁻⁷
Au1c90945.545.5Au2004.27 × 10−2:1.37 × 10⁻²:9.1 × 10⁻⁷
Au2b833.341.7125Au1003.90 × 10−2:1.25 ×10⁻²:2.5 × 10⁻⁶
Au2c833.341.7125Au2003.90 × 10−2:1.25 × 10⁻²:2.5 × 10⁻⁶
Au3b80040160Au1003.74 × 10−2:1.20 × 10⁻²:3.2 × 10⁻⁶
Au3c80040160Au2003.74 × 10−2:1.20 × 10⁻²:3.2 × 10⁻⁶
Ag1a90945.545.5Ag1004.27 × 10−2:1.37 × 10⁻²:9.1 × 10⁻⁷
Ag1b90945.545.5Ag2004.27 × 10−2:1.37 × 10⁻²:9.1 × 10⁻⁷
Ag1c90945.545.5Ag4004.27 × 10−2:1.37 × 10⁻²:9.1 × 10⁻⁷
Pt1a90945.545.5Pt504.27 × 10−2:1.37 × 10⁻²:4.6 × 10⁻⁸
Pt1b90945.545.5Pt3004.27 × 10−2:1.37 × 10⁻²:4.6 × 10⁻⁸
Table 2. Refractive index values at a wavelength of 600 nm with errors calculated as a standard deviation from the average value of two samples for undoped Nb2O5/Ludox films and films doped with Au nanoparticles (AuNPs) of size 10 nm and 20 nm at Ludox-to-AuNP ratios of 1:1, 1:3, and 1:4.
SampleNo AuNPsAuNPs 10 nmAuNPs 20 nm
1:11.600 ± 0.0081.600 ± 0.0081.600 ± 0.004
1:31.602 ± 0.0031.601 ± 0.0061.571 ± 0.001
1:41.605 ± 0.0031.601 ± 0.0051.577 ± 0.005
Disclaimer/Publisher’s Note: The statements, opinions and data contained in all publications are solely those of the individual author(s) and contributor(s) and not of MDPI and/or the editor(s). MDPI and/or the editor(s) disclaim responsibility for any injury to people or property resulting from any ideas, methods, instructions or products referred to in the content.