Abstract
The aim of this study was to evaluate the influence of factors determining the state of danger heat stress on the udder and thigh temperature of dairy cows. Heat stress was classified by measuring the temperature–humidity index (THI). Surface temperatures in the areas of interest were measured using infrared thermography (IRT). The correlation coefficient between THI and thigh surface temperatures ranged from 0.67 to 0.87. The correlation coefficient between udder surface temperature and THI was 0.81. The rate of increase in thigh surface temperature ranged from 0.33 to 0.45. The rate of increase in udder surface temperature was 0.64. The results showed that under danger heat stress, the surface temperature of the udder and thigh was strongly affected and the cows’ body showed a strong tendency to cool down.
1. Introduction
The issues of feeding humanity from a modern perspective are of strategic importance. The sustainable increase in the population poses a number of challenges to the food industry. The production of milk and dairy products plays a decisive role in the food security of the population globally. Realities and developments create a need for a constant increase in milk production. Modern standards also place serious demands on the quality of production. All of this directly corresponds to healthcare and improving the quality of life and well-being of cows raised for milk. These realities favor the introduction of digital technologies and innovations in livestock farming. It has been known for many years that body temperature is a physiological factor directly corresponding to health status, and its measurement is part of many diagnostic practices. Most of the processes occurring in organisms release heat, which contributes to their heat balance, and maintaining it is of life-sustaining importance. Any deviation from normal temperature levels may signal a health problem []. This makes temperature tracking particularly important in monitoring health status []. For many years, this has been performed in cows by measuring rectal temperature. This is a laborious and slow process that is invasive and further stresses the cows. In recent decades, infrared thermography has become established as a method for measuring surface temperature from a distance. Its speed and harmlessness make it suitable for working with animals. Surface temperature distribution models based on infrared thermography have been created and are used for health monitoring in smart farming []. There is current research showing the successful use of infrared thermography in detecting hoof inflammation, lesions, and lameness in dairy cows []. Achievements are also known in the assessment and monitoring of inflammatory processes in the udder and in the diagnosis of early stages of mastitis in cows raised for milk [,,]. Infrared thermography is entering agriculture very successfully and in combination with other innovative technologies. Together with unmanned flying objects, it works to help farmers by helping to monitor pastures and classify grass stands [,]. Infrared technologies are involved in assessing the quality of agricultural produce []. As a remote method, thermography allows for temperature measurements when the measurement object is far away and unreachable with conventional measurement methods and also provides sufficient distance to ensure the safety of the measuring operator when necessary [].
Heat stress in dairy cows is a serious problem causing major financial losses []. It is classified using the temperature–humidity index (THI) [] and is directly dependent on a certain ratio between relative air humidity and ambient temperature, making it dangerous for all cows on the farm where the relevant factors are present.
All of this gives me reason to use infrared thermography in my research as an auxiliary tool for measuring surface body temperature.
The aim of this study is to investigate the impact of danger heat stress on the temperature of important organs such as the udder and thighs, which are responsible for milk production and locomotion of these massive animals.
2. Materials and Methods
2.1. Infrared Thermography
Infrared thermography is a remote method for detecting sources of thermal radiation and monitoring surface temperature distribution in the measurement object. It is based on optical radiometry and finds many different applications. This method uses Planck’s law of blackbody radiation, a form of which is shown in the following equation:
where M(λ, T) represents the spectral radiance at wavelength λ, T is the absolute temperature, c is the speed of light (3.0 × 10⁸ m/s), h is Planck’s constant (6.626 × 10⁻³⁴ J⋅s) and k is Boltzmann’s constant (1.381 × 10⁻²³ J/K). According to this law, any body that has a temperature other than absolute zero constantly emits in the infrared spectrum. This radiation is electromagnetic and its spectrum depends on the surface temperature of the object.
In this study, a FLIR E40 thermal camera was used to monitor surface temperatures in the areas of interest. The camera has 19,200 pixels (160 × 120) infrared resolution, a temperature range of −4 °F to 1202 °F (−20 °C to 650 °C), a field of view 25° × 19°, a minimum focus distance of 1.3 ft/0.4 m, a frame rate of 60 Hz, a thermal sensitivity (N.E.T.D.) of <0.07 °C at 30 °C, and a spectral range of 7.5 to 13 μm []. To obtain surface temperature values from thermal images, we used the specialized FLIR TOOLS software [].
2.2. THI
The temperature–humidity index is a parameter indicating the quantitative value of the joint influence of relative air humidity and ambient air temperature on living objects. It was introduced last century and allows for the assessment of the risk of heat stress []. Many ways are known to calculate it, some of which can be expressed by a mathematical equation []. THI values are also used to classify heat stress conditions [].
In the study, the temperature–humidity index values were measured manually using a Kestrel device.
2.3. Setup
The study was conducted during the spring and summer season from May to August on a free-stall dairy farm for Holstein–Friesian cattle, located in the temperate climate zone in the region of Southeast Bulgaria. Measurements of all parameters were taken simultaneously twice a day, once in the morning at ten o’clock and once in the afternoon at 5 o’clock. Considering the objectives of the study, in order to meet the classification conditions for danger heat stress, I used only the results where the THI values were between 79 and 83. In this range, heat stress is classified as a Danger [].
The udder is the largest organ in cows. It works constantly, its main role being the production of milk, and heat is released during these processes. In addition, it is slightly hairy and suitable for thermographic measurements of surface temperature. Cows are large animals with a lot of mass and therefore possess serious physical strength. The thighs are a part of the body that is responsible for getting up from a lying position and moving cows. Because of this, the skin in this area covers serious muscle groups. Their work also generates heat. These considerations guided me in this study to focus on the surface temperature of these two organs and to investigate how the combination of environmental factors that determine the state of danger heat stress affect their temperature.
In order to understand how the temperature–humidity index, which should correspond to a state of danger heat stress, affects the surface temperature of these organs, the correlation coefficients between THI values and the minimum, average and maximum surface temperatures in the thigh area were calculated. Correlation coefficients between THI values and udder surface temperature were also calculated. In order to understand the rate of increase in surface temperatures in the area of interest depending on the increase in the values of the temperature–humidity index, the slope function for surface temperatures in the areas of interest was calculated.
2.4. Colour Illustrations
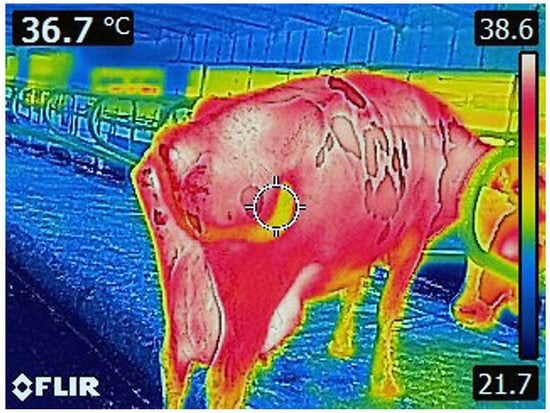
Figure 1 shows a thermographic image of a cow participating in the study and under conditions of danger heat stress.

Figure 1.
Thermal image of a cow participating in the study with a THI value above 79.
3. Results
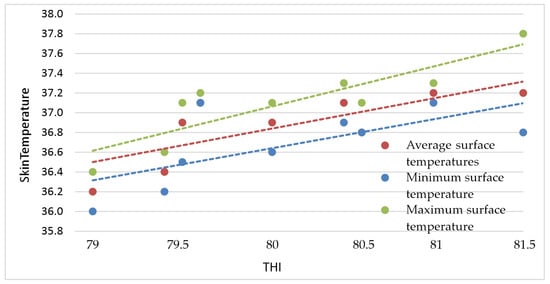
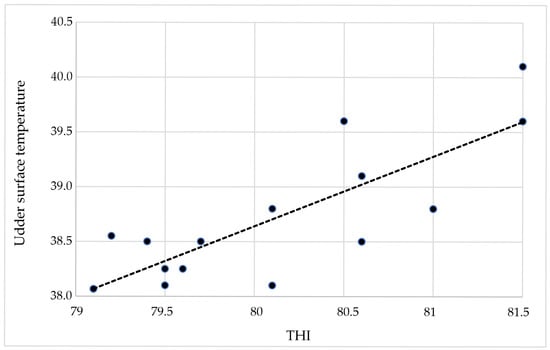
The correlation coefficient between the values of the temperature–humidity index and the minimum skin surface temperatures in the thigh area is 0.67. The correlation coefficient between the values of the temperature–humidity index and the average skin surface temperatures in the thigh area is 0.75. The correlation coefficient between the values of the temperature–humidity index and the maximum skin surface temperatures in the thigh area is 0.87. The correlation coefficient between the measured values of the temperature–humidity index and the udder surface temperature is 0.81. The rate (function slope) of increase in udder surface temperature depending on the increase in THI values is 0.64. The rate of increase of minimum surface temperatures in the thigh area as a function of increasing THI values is 0.33. The rate of increase of average surface temperatures in the thigh area as a function of increasing THI values is 0.34. The rate of increase of maximum surface temperatures in the thigh area as a function of increasing THI values is 0.45.
An example of some ordered values of the temperature–humidity index and their corresponding measured values of the minimum, average and maximum surface temperatures in the thigh area and surface temperatures of the udder are shown in Table 1.

Table 1.
Measured THI values and their corresponding udder surface temperatures and thigh area surface temperatures.
Figure 2 visualizes the values of the temperature–humidity index indicating a state of danger heat stress and their corresponding measured minimum, average and maximum values of the surface temperature of the skin of the cows in the thigh area.

Figure 2.
The ascending values of the temperature–humidity index and their corresponding measured values of the minimum (in blue), average (in red) and maximum (in gray) surface temperatures in the thigh area.
Figure 3 shows the temperature-humidity index values corresponding to a state of danger heat stress and the corresponding measured udder surface temperatures (For more information, see Appendix A)

Figure 3.
The values of the temperature–humidity index corresponding to a state of danger heat stress and the corresponding measured udder surface temperatures are visualized.
4. Conclusions
An overview of the results shows that the correlation coefficient between THI values and maximum surface temperatures in the thigh area is the largest, compared to the average and minimum. This indicates that the heat load is high and that with increasing THI the body of the cows approaches its limit of ability to dissipate its increased temperature into the surrounding space, consequently, its ability to cool down decreases. These high correlation values indicate that the skin in the thigh area covering strong muscles that release heat during their work has a serious role in the heat exchange processes of the cow’s body and the environment in conditions of strong heat stress. The correlation coefficient between THI values and surface temperature of the udder is also high and indicates that in this range of THI the temperature of the organ responsible for milk production is very much influenced by the strong heat stress. The increase in the rate of increase in surface temperature in the thigh area, from the minimum to the average and maximum measured values, as a function of the increase in THI, probably indicates that with increasing heat load, the body increases its tendency to dissipate excess heat into the surrounding space.
The results of the study show that if automated systems for early detection of heat stress are developed, based on the methods used, it will be possible to detect it early. This would reduce losses and increase animal welfare and humane treatment. All this would increase food security, which is a strategic goal.
In conclusion, I would like to note that the complexity of these studies, their importance, and the need for strict protocols for their conduct, arising from the factors that influence them, create the need to conduct additional studies in order to improve them.
Funding
This investigation was funded by the Bulgarian Ministry of Education and Science (MES) in the frames of the Bulgarian National Recovery and Resilience Plan, Component “Innovative Bulgaria,” the Project № BG-RRP-2.004-0006-C02 “Development of research and innovation at Trakia University in service of health and sustainable well-being”.
Institutional Review Board Statement
Not applicable.
Informed Consent Statement
Not applicable.
Data Availability Statement
Data are available upon reasonable request to the author.
Conflicts of Interest
The author declare no conflicts of interest.
Abbreviations
The following abbreviations are used in this manuscript:
| THI | Temperature–humidity index |
| UST | Udder surface temperature |
| N.E.T.D. | Noise-equivalent temperature difference |
Appendix A
In Figure 3, some values of the temperature–humidity index correspond to more than one value of udder surface temperature, since for some cows the measured values of the temperature–humidity index coincided.
References
- Jhora, F.U.; Mairizwan. Skin temperature monitoring with an instrument infrared sensors measuring based on direction and distance. J. Phys. Conf. Ser 2021, 1876, 012023. [Google Scholar] [CrossRef]
- Lahiri, B.; Bagavathiappan, S.; Jayakumar, T.; Philip, J. Medical applications of infrared thermography: A review. Infrared Phys. Technol. 2012, 55, 221–235. [Google Scholar] [CrossRef] [PubMed]
- Poikalainen, V.; Praks, J.; Veermäe, I.; Kokin, E. Infrared temperature patterns of cow’s body as an indicator for health control at precision cattle farming. Agron. Res. Biosyst. Eng. 2012, SI 1, 187–194. [Google Scholar]
- Hristov, H.; Penev, T. Investigating the possibilities of infrared thermography for the detection of hoof problems in dairy cows. In Proceedings of the 5th International Conference on Communications, Information, Electronic and Energy Systems (CIEES), Veliko Tarnovo, Bulgaria, 20–22 November 2024. [Google Scholar] [CrossRef]
- Machado, N.A.F.; Da Costa, L.B.S.; Barbosa-Filho, J.A.D.; De Oliveira, K.P.L.; De Sampaio, L.C.; Peixoto, M.S.M.; Damasceno, F.A. Using infrared thermography to detect subclinical mastitis in dairy cows in compost barn systems, ELSEVIER. J. Therm. Biol. 2021, 97, 102881. [Google Scholar] [CrossRef] [PubMed]
- Quirino, C.R.; Jardim, J.G.; Nogueira, L.M.; González, A.R.M.; Madella- Oliveira, A.F. Infrared thermography to map the udder health status of zebuine dairy cows. Trop. Subtrop. Agroecosyst. 2022, 25, #016. [Google Scholar] [CrossRef]
- Korelidou, V.; Simitzis, P.; Massouras, T.; Gelasakis, A.I. Infrared Thermography as a Diagnostic Tool for the Assessment of Mastitis in Dairy Ruminants. Animals 2024, 14, 2691. [Google Scholar] [CrossRef] [PubMed]
- Petrova, T.; Marinov, M.; Petrov, Z. Study of an Index for Assessing Grass Quality in Pastures Using RGB Images Obtained by Unmanned Aerial Vehicle. In Proceedings of the 2024 23rd International Symposium INFOTEH-JAHORINA (INFOTEH), East Sarajevo, Bosnia and Herzegovina, 20–22 March 2024; pp. 1–6. [Google Scholar] [CrossRef]
- Dimitrov, K.; Saliev, D.; Damyanov, I.; Laskov, L.; Valkovski, T. Infrared Thermal Monitoring of Intelligent Grassland via Drone. In Proceedings of the 2021 XXX International Scientific Conference Electronics (ET), Sozopol, Bulgaria, 15–17 September 2021; pp. 1–4. [Google Scholar] [CrossRef]
- Todorova, M.; Veleva, P.; Atanassova, S.; Georgieva, T.; Vasilev, M.; Zlatev, Z. Assessment of Tomato Quality through Near-Infrared Spectroscopy—Advantages, Limitations, and Integration with Multivariate Analysis Techniques. Eng. Proc. 2024, 70, 34. [Google Scholar] [CrossRef]
- Zhao, Y.; Bergmann, J.H.M. Non-Contact Infrared Thermometers and Thermal Scanners for Human Body Temperature Monitoring: A Systematic Review. Sensors 2023, 23, 7439. [Google Scholar] [CrossRef] [PubMed]
- St-Pierre, N.R.; Cobanov, B.; Schnitkey, G. Economic losses from heat stress by US livestock industries. J. Dairy Sci. 2003, 86, E52–E77. [Google Scholar] [CrossRef]
- Whittier, J.C. Hot Weather Livestock Stress; MU Extension-University of Missouri: Vernon, MO, USA, 1993. [Google Scholar]
- FLIR E40 E-Series InfraRed Camera. Available online: http://media.hiscoinc.com/Volume2/d110001/medias/docus/201/Flir%20Commercial%20Systems%20Inc-18204_FLIRE40-TDS_VD.pdf (accessed on 1 May 2025).
- Teledyne FLIR. Available online: https://www.flir.eu/ (accessed on 1 May 2025).
- Zimbelman, B.; Rhoads, R.P.; Rhoads, M.L.; Duff, G.C.; Baumgard, L.H.; Collier, R.J. A Re-evaluation of the Impact of Temperature Humidity Index (THI) and Black Globe Humidity Index (BGHI) on Milk Production in High Producing Dairy Cows. In Proceedings of the Western Dairy Management Conference, Reno, NV, USA, 11–13 March 2009; pp. 113–125. [Google Scholar]
- Dikmen, S.; Hansen, P.J. Is the temperature-humidity index the best indicator of heat stress in lactating dairy cows in a subtropical environment? J. Dairy Sci. 2009, 92, 109–116. [Google Scholar] [CrossRef] [PubMed]
Disclaimer/Publisher’s Note: The statements, opinions and data contained in all publications are solely those of the individual author(s) and contributor(s) and not of MDPI and/or the editor(s). MDPI and/or the editor(s) disclaim responsibility for any injury to people or property resulting from any ideas, methods, instructions or products referred to in the content. |
© 2025 by the author. Licensee MDPI, Basel, Switzerland. This article is an open access article distributed under the terms and conditions of the Creative Commons Attribution (CC BY) license (https://creativecommons.org/licenses/by/4.0/).