Perspective

Perspective for the Safe and High-Efficiency Storage of Liquid Hydrogen: Thermal Behaviors and Insulation

1
Cryogenic Center, Hangzhou City University, Hangzhou 310015, China
2
Zhejiang Key Laboratory of Refrigeration and Cryogenic Technology, Institute of Refrigeration and Cryogenics, Zhejiang University, Hangzhou 310027, China
*
Authors to whom correspondence should be addressed.
Hydrogen 2024, 5(3), 559-573; https://doi.org/10.3390/hydrogen5030031
Submission received: 28 June 2024 / Revised: 14 August 2024 / Accepted: 28 August 2024 / Published: 29 August 2024

Abstract

:
Liquid hydrogen is a promising energy carrier in the global hydrogen value chain with the advantages of high volumetric energy density/purity, low operating pressure, and high flexibility in delivery. Safe and high-efficiency storage and transportation are essential in the large-scale utilization of liquid hydrogen. Aiming at the two indicators of the hold time and normal evaporation rate (NER) required in standards, this paper focuses on the thermal behaviors of fluid during the no-vented storage of liquid hydrogen and thermal insulations applied for the liquid hydrogen tanks, respectively. After presenting an overview of experimental/theoretical investigations on thermal behaviors, as well as typical forms/testing methods of performance of thermal insulations for liquid hydrogen tanks, seven perspectives are proposed on the key challenges and recommendations for future work. This work can benefit the design and improvement of high-performance LH2 tanks.

1. Introduction

Large-scale utilization of hydrogen energy is recognized as one of the optimal solutions to achieving net-zero emissions by the major economies. According to the report published by the International Energy Agency (IEA) [1], global hydrogen use reached a historical high of 95 million tons (Mt) in 2022 with a nearly 3% increase year-on-year. As a promising energy carrier, hydrogen can be paired with energy storage systems to overcome the limitations of intermittency of renewable energy, playing an increasing role in the transition from fossil-fuel-dominated energy to renewable energy for the global energy structure [2,3].
Such a transition to hydrogen energy requires the development of sustainable and substantial hydrogen value chains [4]. Storage and transportation of hydrogen are vital for the hydrogen value chain. The storage and transportation of hydrogen in the form of liquid hydrogen (LH2) have the advantages of large volumetric energy density, low operating pressure, as well as high purity, among the current methods [5,6,7]. The LH2 has flexible delivery methods, including tanks, transport trailers, and ships, as shown in Figure 1 [8,9,10,11], to meet the demand for different distances and scales. As the capacity and efficiency of hydrogen liquefaction around the world are improving, LH2 becomes the most economical selection, with a transport distance from 4000 km to 8000 km and a transport capacity of hydrogen above 0.8 Mt/yr [12], making LH2 a prospective energy carrier in the large-scale utilization of hydrogen energy [13].
LH2 is a cryogen with a normal boiling point of 20.3 K at 101,325 Pa and can be regarded as well-approximated pure para-hydrogen, since the concentration of para-hydrogen takes up more than 99.8% [14]. The temperature difference between LH2 and the ambient surroundings (300 K) is as high as 280 K, bringing about an inevitable heat leak into the LH2 tank [15] to generate boil-off gas. Due to the fact that hydrogen has a wide flammability range from 4.1% to 74.8% when exposed to the air [16], the LH2 has to be stored in a no-vented process to prevent the flammable boil-off gas from venting out of the tank. During the no-vented storage process, the heat leak is the main cause of pressure continuously building up (i.e., self-pressurization). The thermal behaviors [17] caused by the heat leak, such as temperature stratification and buoyancy flows, can accelerate the pressure rise, leading to a reduction in hold time 18. To guarantee large-scale safe storage of LH2, some standards [18,19,20] make the requirements of the total heat leak into the tank and the hold time of the tank.
The thermal insulation performance of LH2 tanks is described by the normal evaporation rate (NER) 18 with the following expression [21]:
N E R = Q ˙ φ ρ l V t a n k γ
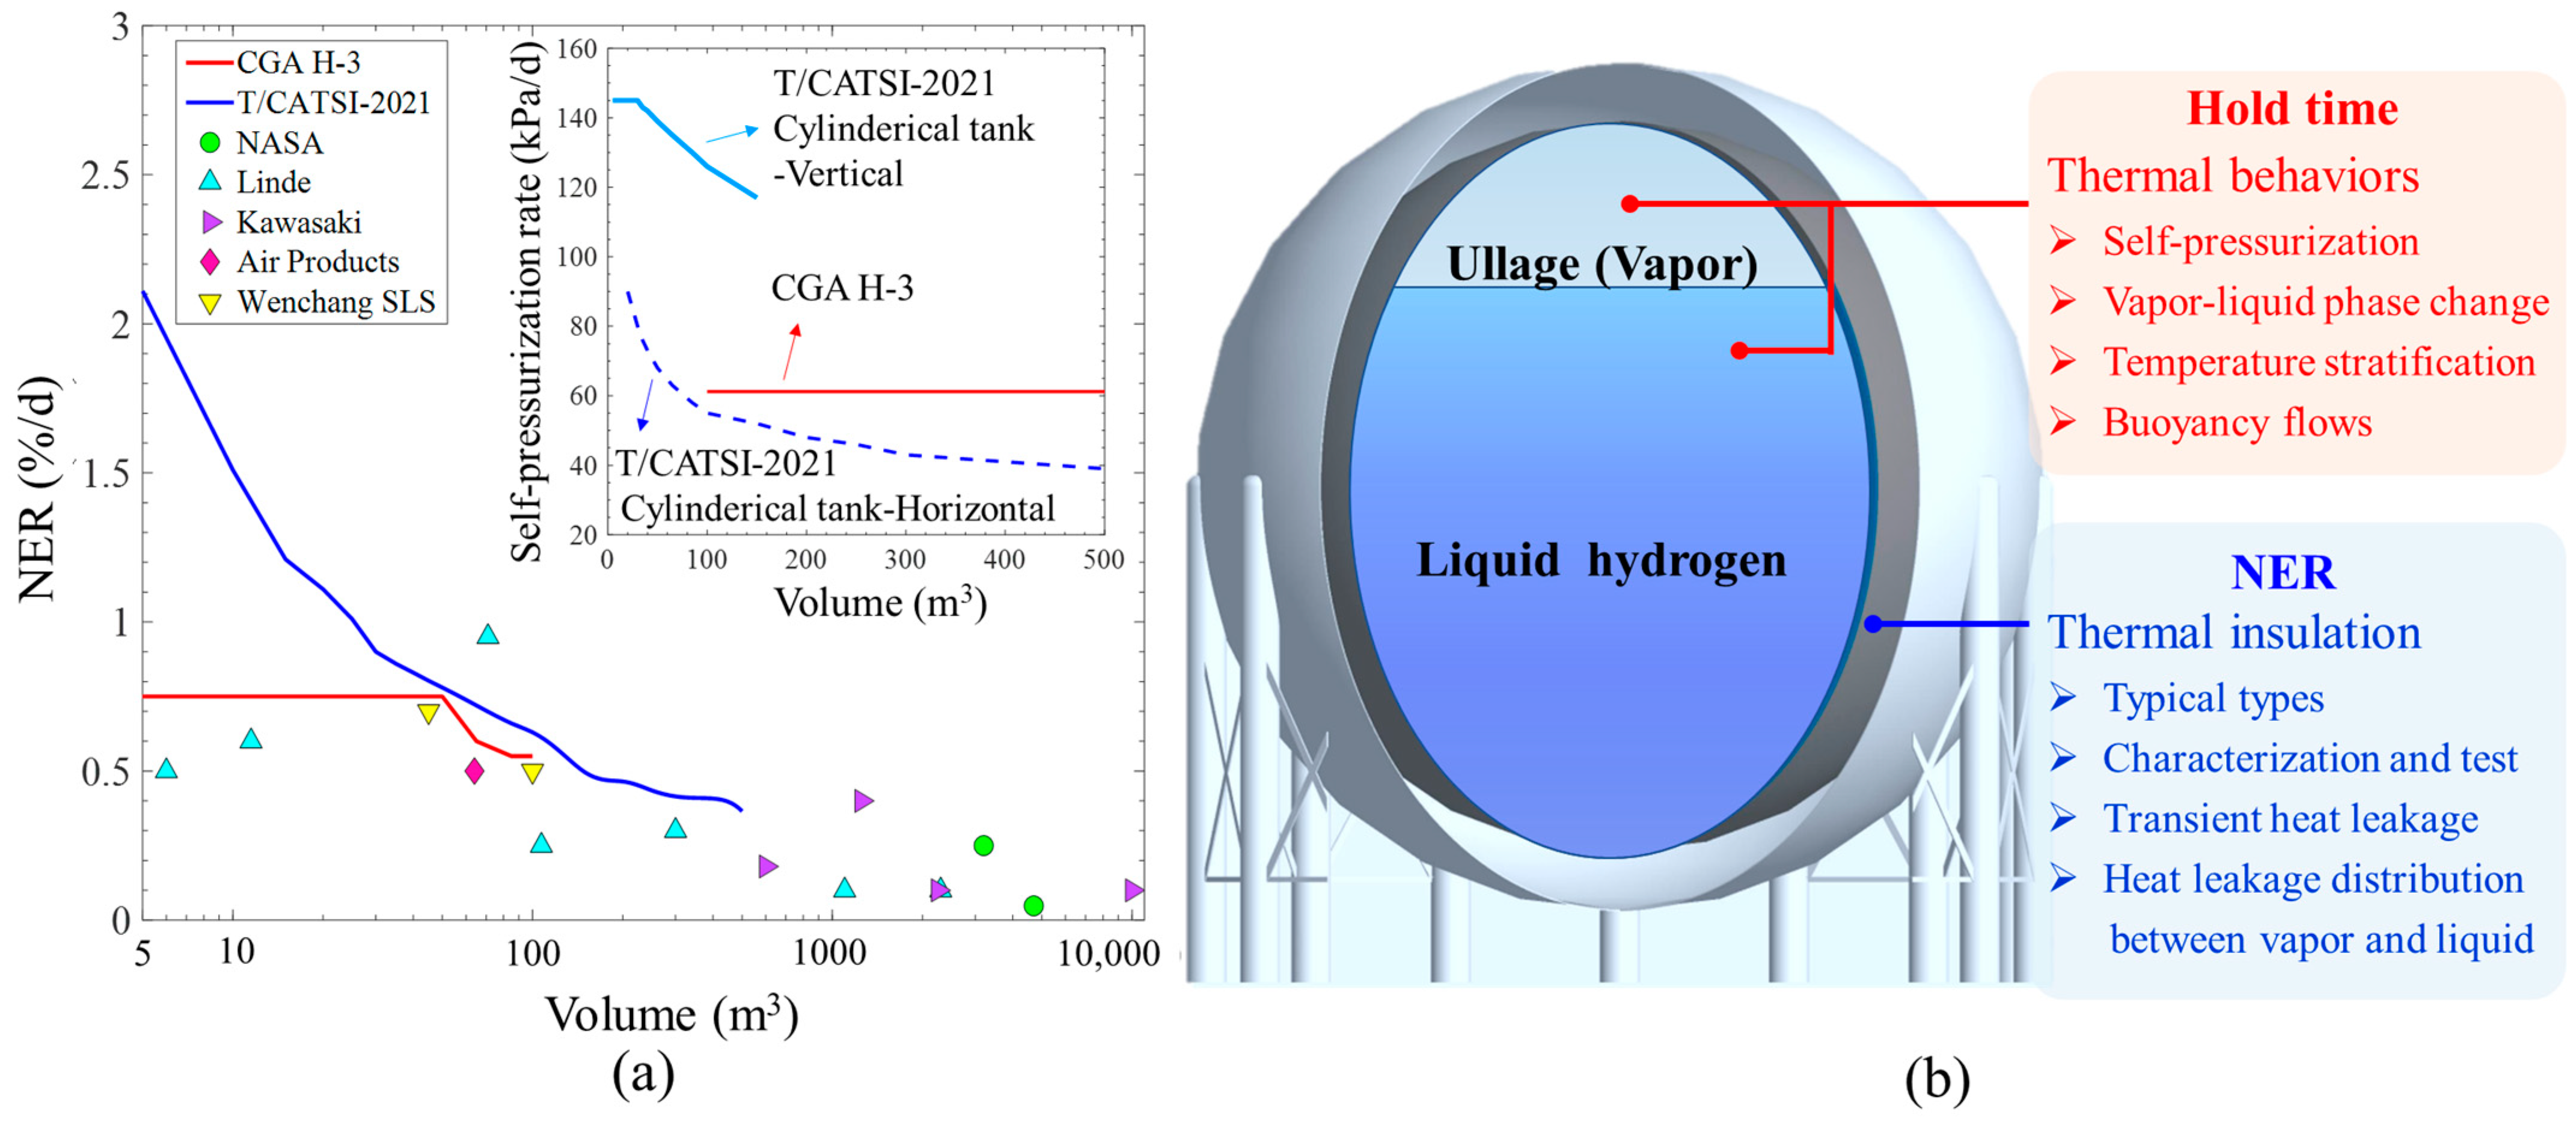
where φ is the liquid fill ratio, ρ l is the liquid density, V t a n k is the volume of the tank, γ is the latent heat of vaporization, and Q ˙ is the total heat leak into the LH2 tank. When the geometric structure of the tank is fixed, the total heat leak Q ˙ as well as the NER can be determined by measuring the steady boil-off rate. Therefore, the NER in Equation (1) can be used to describe the relative boil-off losses per day in the tank. Besides, the hold time can be reflected by the self-pressurization rate. Typical values of NER and self-pressurization rate for LH2 tanks with different volumes are summarized in Figure 2a.
Both standardized and tested NERs continue to reduce as the volume of tanks increases in Figure 2a [8,10,18,19,22,23,24,25,26]. For tanks with a volume smaller than 500 m3, the NER is normally less than 0.5%/d. When the tank volume is in the range of 5 m3 to 500 m3, the NER not only changes with the volume but also relates to the shape of the tanks. For example, a spherical tank and a cylindrical tank will have different NERs and will have different self-pressurization rates as a matter of course. In addition, even if two cylindrical tanks have the same NER [27], a significant difference occurs in the self-pressurization rate between a vertical tank and a horizontal tank. Hence, the standards have requirements for both NER and self-pressurization rate indicators for a specific LH2 tank.
It should be noted that the standardized values of NER and self-pressurization rate show a difference among these standards [18,20] in Figure 2a, which demonstrates that more efforts should be made to reveal the mechanism during the no-vented storage of LH2. In light of this, this paper presents an overview of the research status and proposes perspectives for future work on thermal behaviors and thermal insulation structures of LH2 storage based on an analysis of two indicators, which are the hold time and NER required by the standards. This work can be of benefit in the design of high-performance LH2 tanks.

2. Thermal Behaviors during the No-Vented Storage of Liquid Hydrogen

A series of complex thermal behaviors in the LH2 tank, including self-pressurization, vapor-liquid phase change, temperature stratification, temperature evolution, and buoyancy flows, are caused by heat leaks [17]. Because the hold time is dependent on the self-pressurization rate, the clarification of self-pressurization has priority in investigating the thermal behaviors during the no-vented storage of LH2 [28]. These thermal behaviors can be correlated by the real gas equation of state in the vapor shown, as follows: [29]:
d p v d t = m ˙ p v Ω ρ v + p v T v T v t + p v z v D z v D t + p v T v v v · T v p v · v v
where p v , ρ v , T v , z v , and v v denote the pressure, density, temperature, compressibility factor, and velocity vector of the vapor, m ˙ denotes the interfacial mass transfer flux by vapor-liquid phase change, and Ω denotes the interfacial area density [30]. It is noted that Equation (2) is valid for describing the no-vented storage of LH2 with fixed initial conditions (i.e., initial liquid fill ratio, pressure, and temperature distribution) but needs to be modified when describing the chill-down, filling/venting processes or with sloshing. The terms on the right side of Equation (2) as well as the velocity vector ( v v ) can describe the effect of vapor–liquid phase change, temperature evolution of vapor, nonideality of vapor, temperature stratification, compressibility, and buoyancy flows on the self-pressurization rate, respectively. This section first presents an overview of experimental/theoretical studies on the thermal behaviors during the no-vented storage of LH2 and then proposes perspectives and outlooks for future work.

2.1. Overview of Experimental Investigation

Despite that hydrogen has been successfully liquefied over a century [31], the mechanism of the self-pressurization process in LH2 tanks has not been revealed, since the pressure evolution is not only correlated with other thermal behaviors caused by the heat leak [32], but also affected by the shape/size of the tanks [33], initial pressure, temperature, and liquid fill ratios [34]. Unlike other cryogens, such as liquid nitrogen or liquid helium [35,36,37,38], the published tests conducted in LH2 no-vented storage (summarized in Table 1) are very limited due to the high cost and safety risks. More detailed information can be found in reference [17].
Table 1. Summary of the experimental investigations on the self-pressurization process in LH2 tanks.
Exp.Tank ShapeVolume (m3)Time (s, h)Liquid Fill Ratio (%)/Heat Flux (W/m2) (a)Measurement ContentAccuracies
[39]Spherical20838 h54.2%, 84.7%/1.9
-
Pressure build-up;
-
Temperature evolution of fluid;
±1.38 kPa
±0.83 K
[33,40]Spherical0.00637; 0.09195222–2720 s31.6–79.8%/53–202
-
Pressure build-up;
-
Temperature evolution of fluid;
-
Temperature distribution of fluid.
±13.8 kPa
±0.5 K
[34,41]Spherical4.9512–20 h29–83%/0.35–3.5
-
Pressure build-up;
-
Temperature distribution of fluid;
-
Temperature evolution of the fluid and solid wall;
±0.01 kPa
±0.3 K
[42,43]Cylindrical18.096.9–18.37 h25–90%/0.526–1.514 (b)
-
Pressure build-up;
-
Temperature evolution of fluid;
±0.13 kPa
[44,45]Cylindrical0.021.75 h14%/14.8
-
Pressure build-up of the tank transported by sea;
-
Temperature evolution of fluid;
-
Liquid level variation.
[46]Cylindrical31.10.53–2.28 h25–70%/63.52–164.76 (c)
-
Pressure build-up;
-
Temperature distribution of fluid with various insulation forms;
-
Liquid fill ratio changes with time.
±0.69 kPa
±1 K
(a) Heat flux is estimated from the ratio between the total heat leakage and surface area. (b) Converted by measured heat leakage and geometric structure in reference [42,43]. (c) Converted by measured heat leakage and geometric structure in reference [46].

2.2. Status of Theoretical Investigation

Experiments can provide reliable measurements of the pressure, temperature distribution, and liquid level changes with time under fixed geometry and heat leak boundary; however, it is not easy to directly observe the flow fields and interfacial mass transfer between vapor and liquid phases. Given this, theoretical studies become an effective complement to experimental studies in revealing the mechanism and achieving accurate prediction of thermal behaviors during the no-vented storage process of LH2.
Theoretical investigations have focused on establishing analytical equations among several discretized nodes (cells) and developing numerical models for describing the transient thermal behaviors for the LH2 no-vented storage process. According to the modeling comprehensiveness of thermal behaviors [29], models can be classified into three categories: thermal equilibrium model (TEM), non-thermal equilibrium model (NTEM), and computational fluid dynamics model (CFD model), as summarized in Table 2.
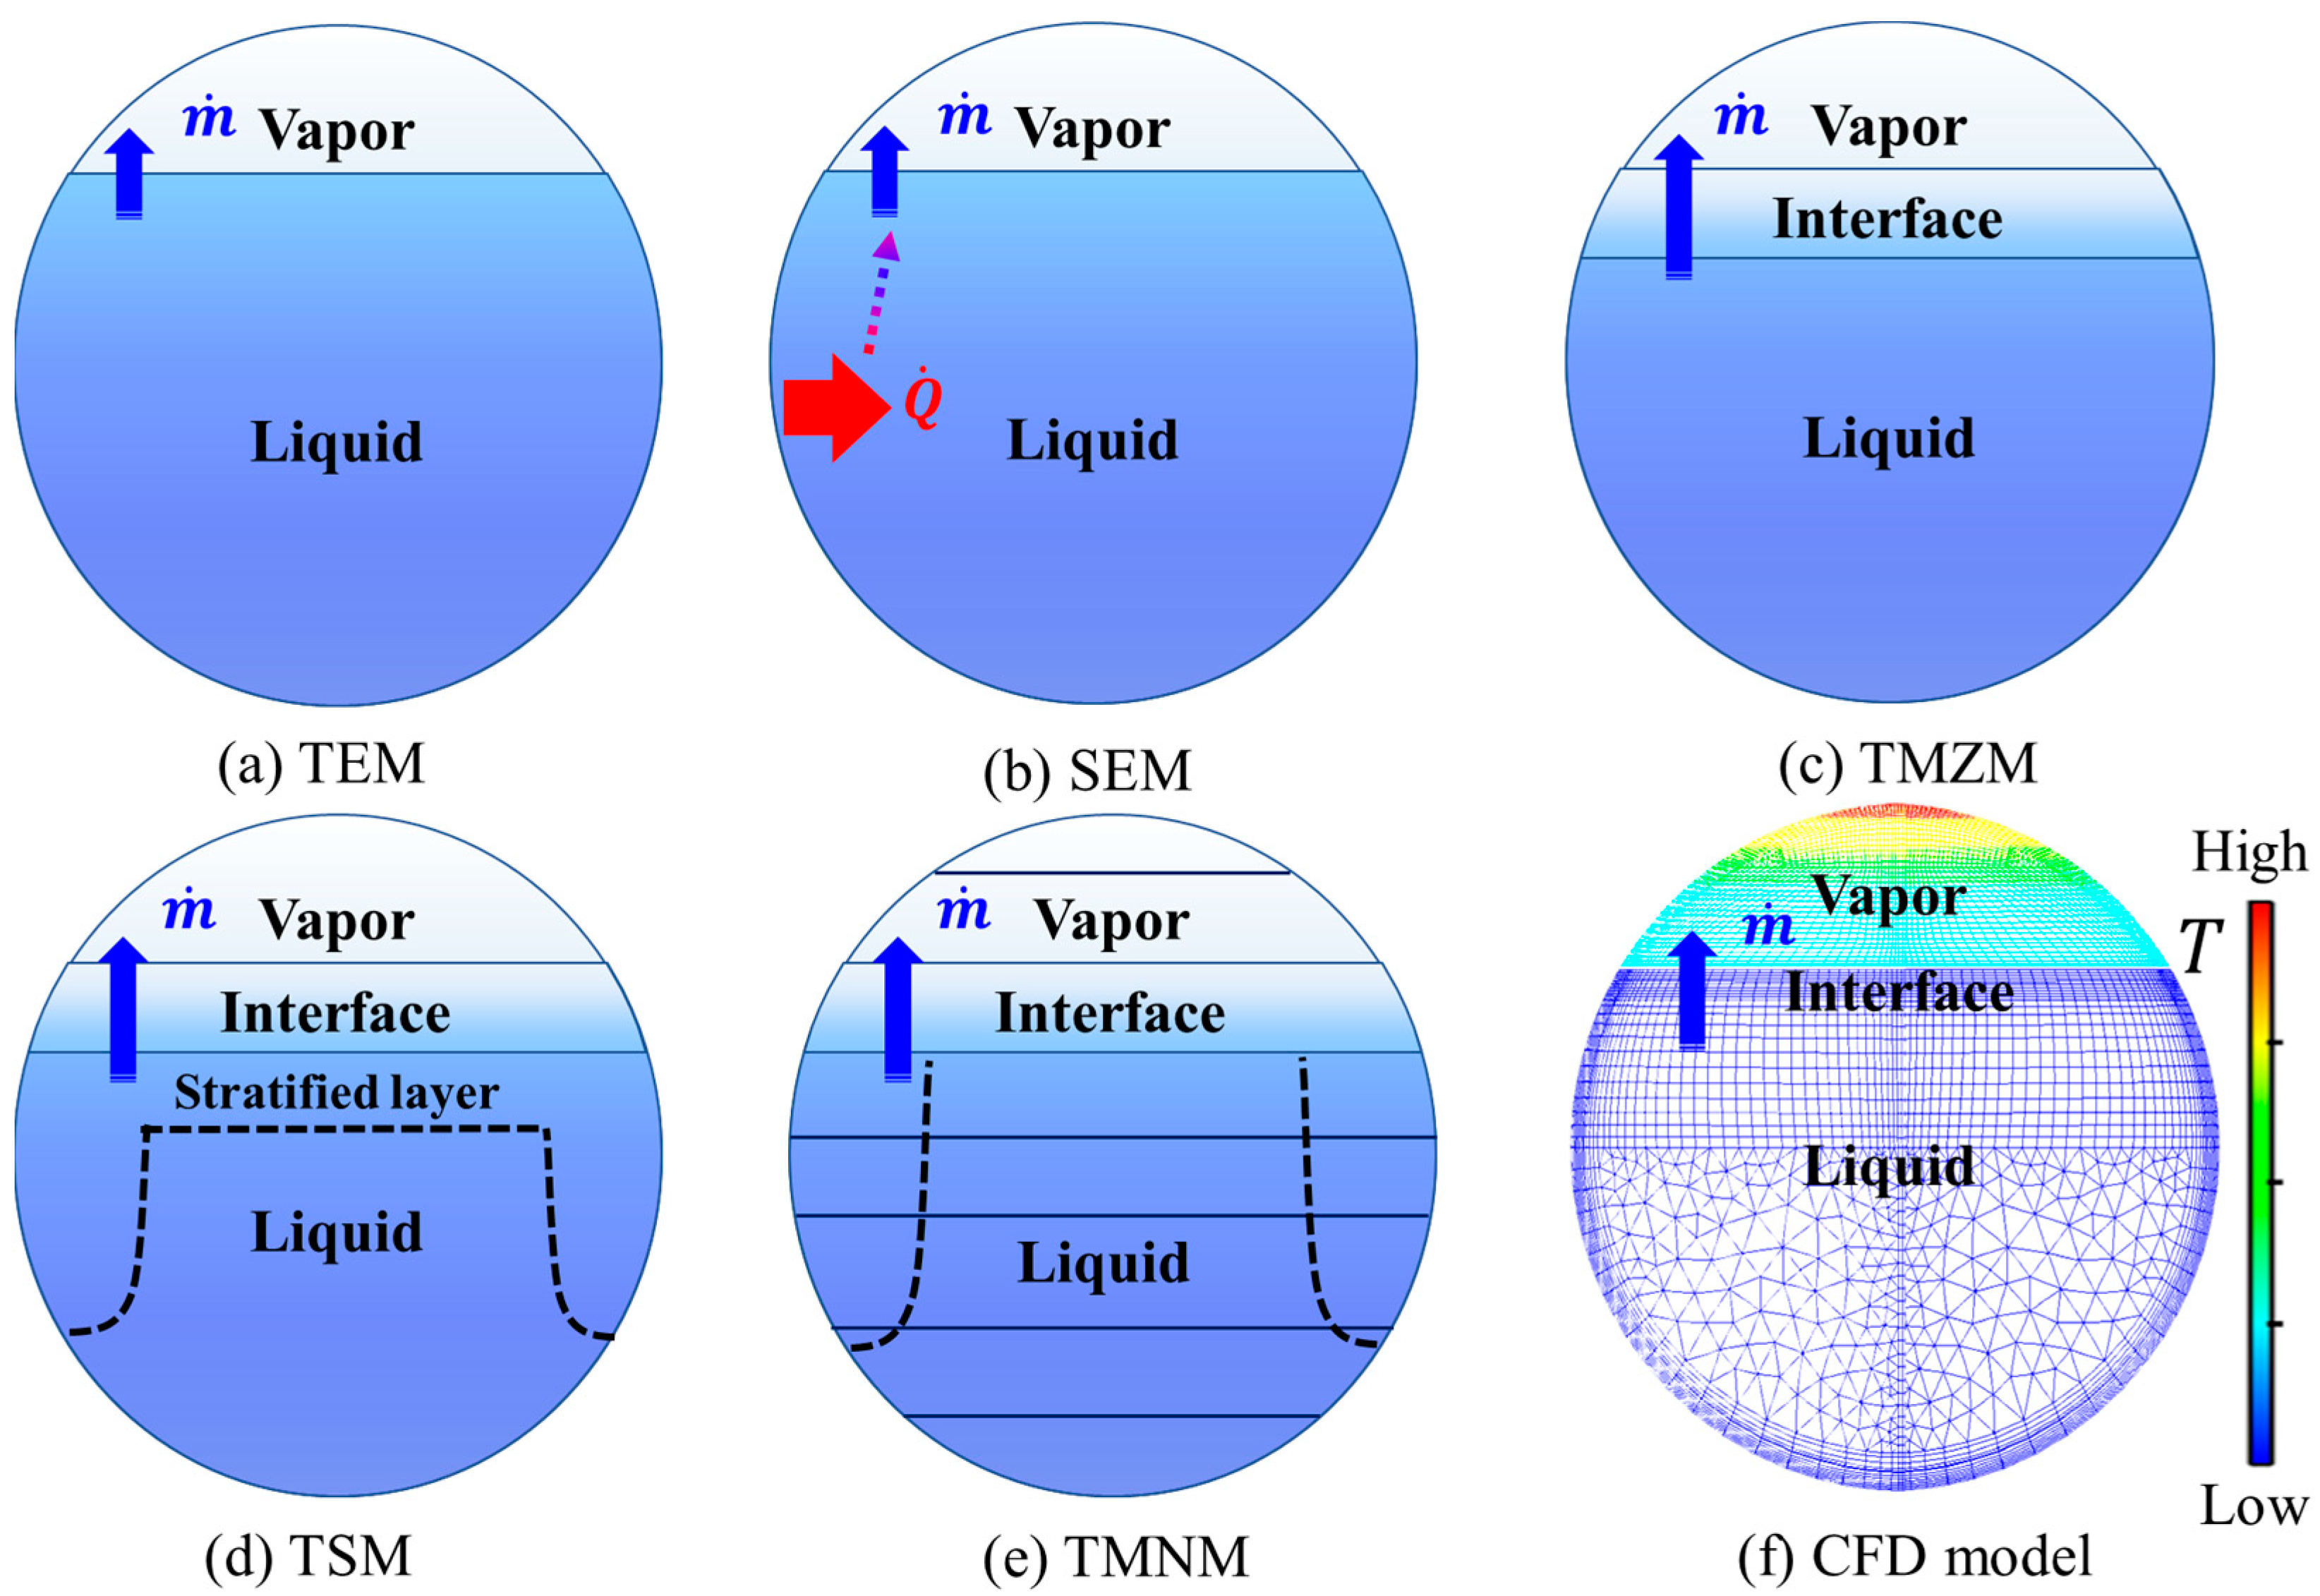
Figure 3 displays the schematics of six thermal models listed in Table 2 for describing the thermal behaviors of the LH2 no-vented storage process. As a single-node model, TEM [47] formulates the mass and energy conservation equations in the fluid region by assuming the vapor and liquid phases to be in a saturation and equilibrium state. Due to not considering the existence of temperature stratification in the LH2 tank [48], the prediction of pressure build-up from TEM showed a large deviation from tested data [49]. Therefore, more attention has been paid to developing the NTEM that takes the non-equilibrium mass and energy exchange between the vapor and liquid into account.
Table 2. Models for describing the thermal behaviors of LH2 during its no-vented storage process.
ModelClassificationNode (Cell) NumberAdvantagesLimitations
TEM -1A clear description of the no-vented storage process in thermodynamicsAssuming no temperature difference existed between vapor and liquid phases
NTEMSEM [48]2Estimation of the maximum self-pressurization rateThe temperature of the liquid phase is regarded as a constant
TMZM [27,49,50,51]3Incorporating the temperature difference between vapor and liquid phases and interfacial mass transferLack of consideration of temperature stratification in the vapor and liquid
TSM [52,53]3~5Incorporating the boundary layer zone and thermal stratification in the liquidLack of consideration of temperature stratification in the vapor
TMNM [54,55]≥4Discretization of vapor, liquid, and boundary layer zone with more nodesSimplification of modeling flow fields
CFD model [56,57]≥5000Multi-scale and multi-dimensional description of thermal behaviors for no-vented storage of LH2Time-consuming for thermal design and prediction;
The selection of some sub-models remains a disagreement
TEM: Thermal equilibrium model; NTEM: Non-thermal equilibrium model; SEM: Surface evaporated model; TMZM: Thermal multi-zone model; TSM: Thermal stratified model; TMNM: Thermal multi-node model; CFD model: Computational fluid dynamics model.
As listed in Table 2, the NTEMs include the surface evaporation model (SEM) [48], thermal multi-zone model (TMZM) [27,49,50,51], thermal stratified model (TSM) [52,53], and thermal multi-node model (TMNM) [54,55] with the increasing number of nodes discretized. Compared to the other three NTEMs, TMNM contains the calculation of temperature, pressure, density, and even one-dimensional velocity in each node and thus can cover all the terms on the right side of Equation (2) in predicting the self-pressurization rates. Although the model faces the limitation of a one-dimensional description of physical fields, it still has the potential to be a promising thermal model for the design and optimization of high-performance LH2 tanks [29].
Compared with NTEMs, the CFD model extends the modeling to more than two dimensions with the integration of the continuity, momentum, and energy equations in each cell grid, and can provide a holistic spatial and temporal distribution of physical fields, achieving the numerical visualization of thermal behaviors of LH2 in multi-scales and multi-dimensions [17]. However, the CFD model faces a limitation in calculation speed which takes a duration of weeks to months to obtain transient behavior information from several hours to one day [54].
The development of the aforementioned models has promoted the clarification of the evolution mechanism of thermal behaviors inside LH2 tanks; however, the predictions of self-pressurization rate, temperature distribution, and liquid level changes from current models still have a big gap to substitute the experimental observations. More quantitative information needs to be captured in multi-physical fields calculated by thermal models.

2.3. Perspectives and Recommendations for Thermal Behaviors

Combining the current statutes of experimental/theoretical investigation on thermal behaviors during the no-vented storage process of LH2, this section proposes four perspectives on the key challenges and future recommended works in this field.

2.3.1. Long-Term Tests to Observe Transient Thermal Behaviors

Normally, the maximum allowable working pressure of an LH2 tank is designed to be around 1 MPa. For a 100 m3 tank, the maximum hold time can reach 8 d with the help of the self-pressurization rate indicator (120 kPa/d) shown in Figure 2a. However, the tested periods for most experiments are less than 24 h according to the published experimental studies on thermal behaviors of LH2 no-vented storage summarized in Table 1. Conducting the long-term test of transient thermal behaviors of LH2 is of great significance in future work for providing valuable experimental data on developing reliable thermal models and upgrading the requirements in standards.

2.3.2. Mechanism of Vapor–Liquid Phase Change in Liquid Hydrogen Tanks

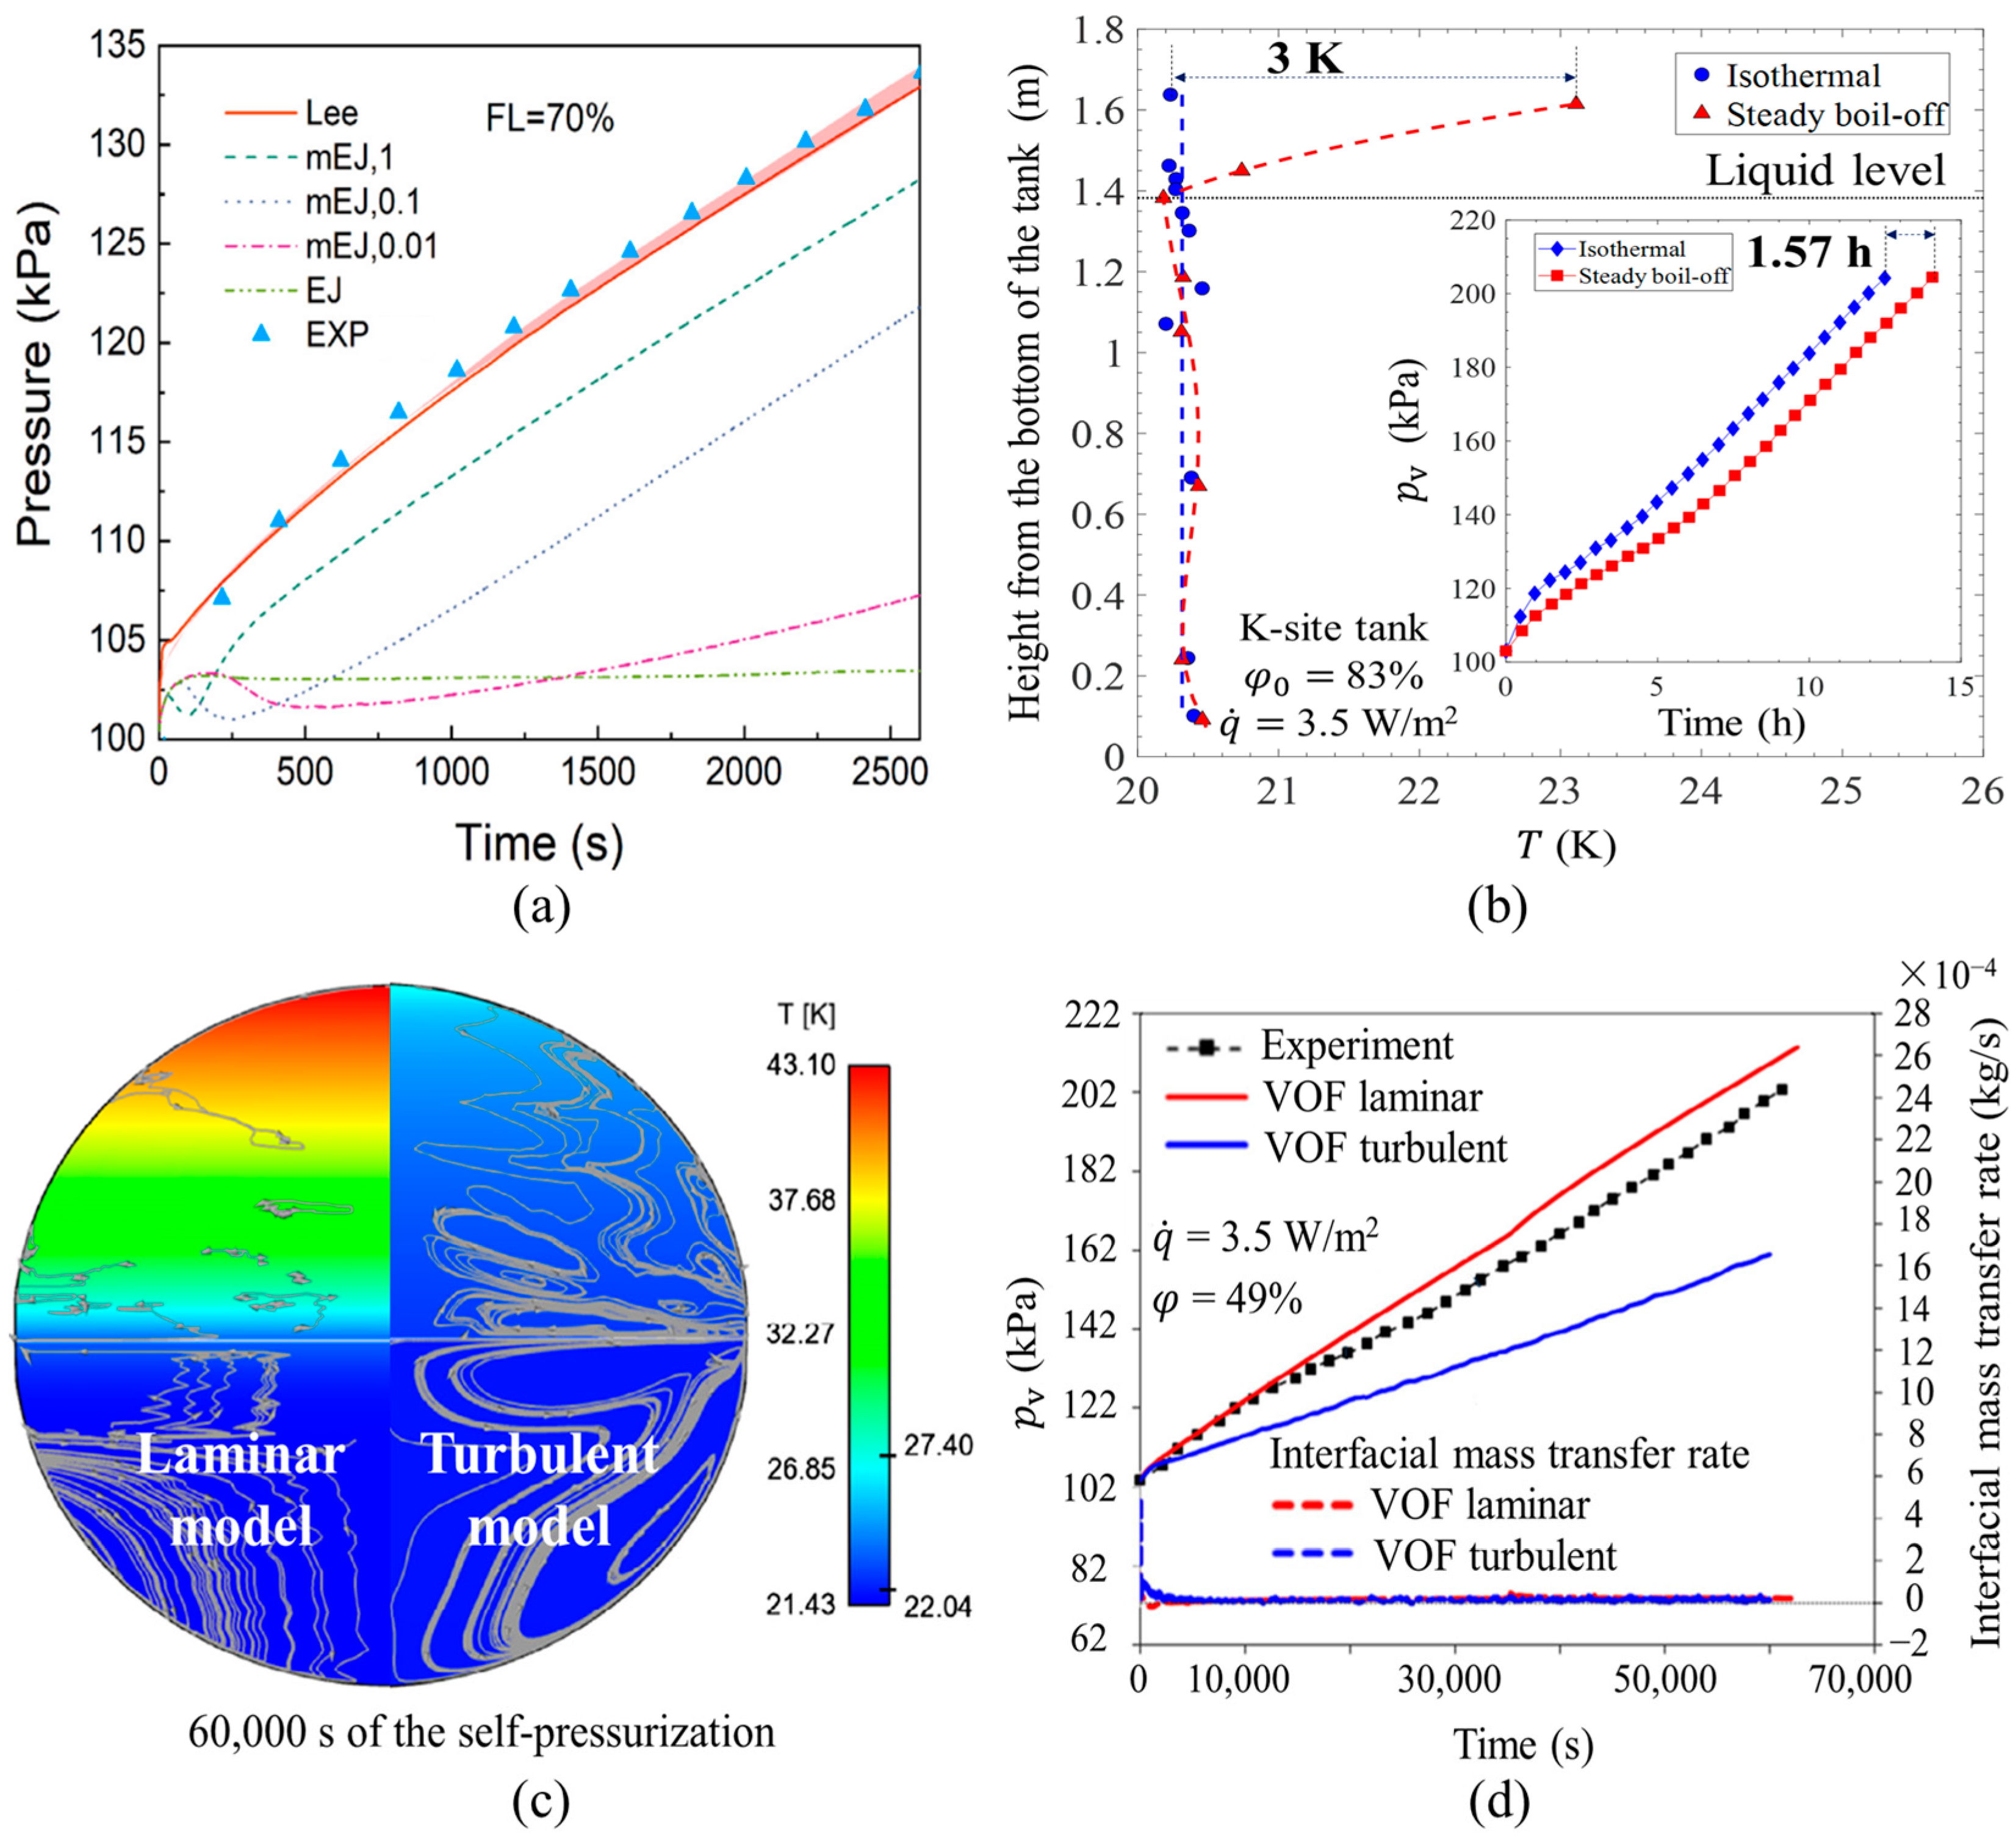
As indicated in Equation (2), the phase change term ( m ˙ p v Ω / ρ v ) is dependent on the self-pressurization rate, thus figuring out the mechanism of vapor-liquid phase change is vital for the safe storage and transportation of LH2. The current vapor-liquid phase change models include the Schrage model [59], Tanasawa model [60], Lee model [61], and energy jump model [62]. Different selections of coefficients in these models will have an impact on the prediction of the self-pressurization process (Figure 4a) in cryogenic tanks. However, the selection of coefficients in these models remains in disagreement due to the lack of a unified theory and testing results 30. Future works are recommended to focus on the long-term observation of vapor-liquid phase change behaviors in LH2 to calibrate these models.

2.3.3. Effect of Temperature Stratification on Self-Pressurization Rate

The temperature stratification in the fluid is formed by the buoyancy flows [32], and a more conspicuous temperature stratification phenomenon occurs in the vapor region than in the liquid [41]. The existence of this phenomenon makes the thermal equilibrium assumptions of vapor and liquid phases no longer valid and explains why the practical pressure builds up much faster than the pressure calculated by the TEM [26].
Nevertheless, some studies [34,41] indicated that the initialized temperature stratification helped to extend the hold time of no-vented storage of LH2. As shown in Figure 4b, when the LH2 tank is initialized with temperature stratification (i.e., steady boil-off mode), the hold time is 1.57 h longer than that is initialized without temperature stratification (i.e., isothermal mode) at the same initial liquid fill ratio and heat leak. Therefore, much effort should be made to reveal whether temperature stratification accelerates the pressure build-up or not in future research.

2.3.4. Effect of Free Convection Flows Driven by Buoyancy Force on Self-Pressurization Rate

As heat leaks into the tank, the fluid in the boundary layer is heated and moves upward to go through the vapor-liquid interface due to buoyancy force, and the fluid away from the wall keeps moving downward with vapor-liquid condensation, forming the free convection circulating flows among the vapor, liquid, and their boundary layers [17,63]. The intensity of free convection is described by the modified Rayleigh number ( R a * = G r * P r ) [64] to judge whether the flow is laminar or turbulent. As shown in Figure 4c, the temperature distributes more uniformly in the turbulent flows than in the laminar flows.
Normally, the modified Rayleigh number is in the turbulent region for the no-vented storage of LH2 [17]. However, according to the results in Figure 4d, the laminar model presents a better prediction of pressure build-up than the turbulent model. In addition, some studies [65,66] pointed out that the turbulent model was also capable of performing good predictions compared to experimental results in the LH2 self-pressurization process. Therefore, the numerical results still need to be validated by better and more targeted experiments. To investigate the effect of flows on the self-pressurization rate, three-dimensional modeling of turbulent flows with high-resolution flow fields is recommended for future work.

3. Thermal Insulation for the No-Vented Liquid Hydrogen Storage

When the volume and initial liquid fill ratio are fixed, the NER can directly evaluate the total heat leak into the LH2 tank. To keep the heat leak into the LH2 tank at a low level, it is vital to develop high-performance thermal insulations at LH2 temperatures. This section summarizes the state-of-the-art thermal insulation forms applied in LH2 storage, introduces the widely adopted testing method of thermal insulation, and proposes perspectives on challenges to be addressed and outlooks for future work.

3.1. Typical Thermal Insulation Forms and Testing Method for LH2 Storage

Table 3 summarizes the characteristics and performance of typical thermal insulation forms applied in LH2 storage. As shown in Table 3, the hollow glass microsphere and multilayer insulation (MLI) are two forms with excellent thermal insulation performance and will help to improve the thermal insulation performance in the future design of LH2 tanks.
Table 3. Characteristics and performance of typical thermal insulations for LH2 storage [4,67,68].
Insulation FormsAdvantagesDisadvantagesPerformance
Foam-outside
-
Lightweight
-
Low cost
-
Easy to implement
-
High thermal conductivity
-
Easy to degrade in the environment
>0.01 W/(m·K)
Foam-inside
-
Low cost
-
Reduce microcracking
-
Decrease heat ingress when the vacuum losses
-
Larger structural tank wall required
-
Increased thermal conductivity due to cryogenic fluid infiltration
-
Aerogel
-
Low density
-
Excellent thermal insulation under non-vacuum conditions
-
High cost
-
Limited mechanical properties
-
Not well-established for larger tanks
2 × 10⁻³~1.4 × 10⁻²
W/(m·K)
at 185 K [69]
Perlite
-
Low cost
-
Low density
-
Moderate thermal insulation under non-vacuum conditions
-
High demand for the vacuum to reach high thermal insulation performance
-
Compaction can happen with certain tank geometries under thermal cycling and/or dynamic loads
1 × 10⁻³~5 × 10⁻²
W/(m·K)
Glass bubbles/Hollow glass microspheres
-
Very low density
-
Simplified insulation due to flowability
-
Good thermal insulation under non-vacuum conditions
-
High demand for vacuum to reach high thermal insulation performance
-
Not well-established for larger tanks
2 × 10⁻⁴~1 × 10⁻³
W/(m·K)
Multi-layer insulation
-
Low density
-
Low radiation heat transfer
-
Superior thermal resistance under high vacuum
-
Well-established
-
Demand for high vacuum
-
Costly to implement and maintain
-
Near catastrophic failure upon vacuum loss
-
Difficult to execute for certain tank geometries or very large tanks
1 × 10⁻⁵~5 × 10⁻⁴
W/(m·K) [70]
Testing the performance is essential for the improvement and optimization of thermal insulation structures at LH2 temperatures. Take the MLI for instance; since the insulation performance is dependent on the layer density, number of layers, vacuum pressure, and temperatures of cold/warm boundaries, it is difficult to achieve an accurate prediction for it. Thus, reliable thermal insulation performance is obtained through testing [70]. The steady boil-off test is a widely adopted testing method for monitoring heat leaks into thermal insulation structures with the following expression [43]:
Q ˙ = m ˙ v t γ ρ l , s ρ l , s ρ v , s + m ˙ v t h v t h v , s A i L i T c T h k T d T
where m ˙ v t is the steady boil-off rate (mass flow rate), k is the thermal conductivity of pipelines and thermal struts, A and L are the section area and length of the pipelines/thermal structs, ρ l , s and ρ v , s are the saturation density of liquid and vapor, h v t and h v , s are the enthalpy of the vented boil-off gas and saturation vapor, and T c and T h are the temperatures of cold and ambient boundaries, respectively.
Equation (3) is valid under the assumption of a quasi-steady state. As indicated in Equation (3), the heat leak through the thermal insulation structure equals the difference between the enthalpy of the vented boil-off gas and solid heat conduction in the pipelines and thermal structs under the steady boil-off testing conditions [43]. This method was widely used in testing the thermal insulation performance at liquid nitrogen temperatures [71]. However, using LH2 in steady boil-off tests is costly and may bring about safety risks, making the published experimental data very limited. Thus, methods with an alternative heat sink at 20.3 K should be developed to test the thermal insulation performance without LH2.
In addition, the thermal performance tested on insulation structures provides a critical boundary condition for the prediction of thermal behaviors during the no-vented storage of LH2. For the sake of simplifying the modeling and calculation, the heat leak through the thermal insulation structure is treated as a uniformly distributed and constant heat flux in some studies, thus more attention is encouraged to be paid to the transient behaviors (spatial and temporal) of heat leak during the self-pressurization process.

3.2. Perspectives and Recommendations for Thermal Insulations

According to the aforementioned status in forms and testing methods applied in thermal insulation structures for LH2 storage, some perspectives on challenges and prospects are proposed and discussed as follows.

3.2.1. Alternative Testing Methods for Thermal Insulations at Liquid Hydrogen Temperatures

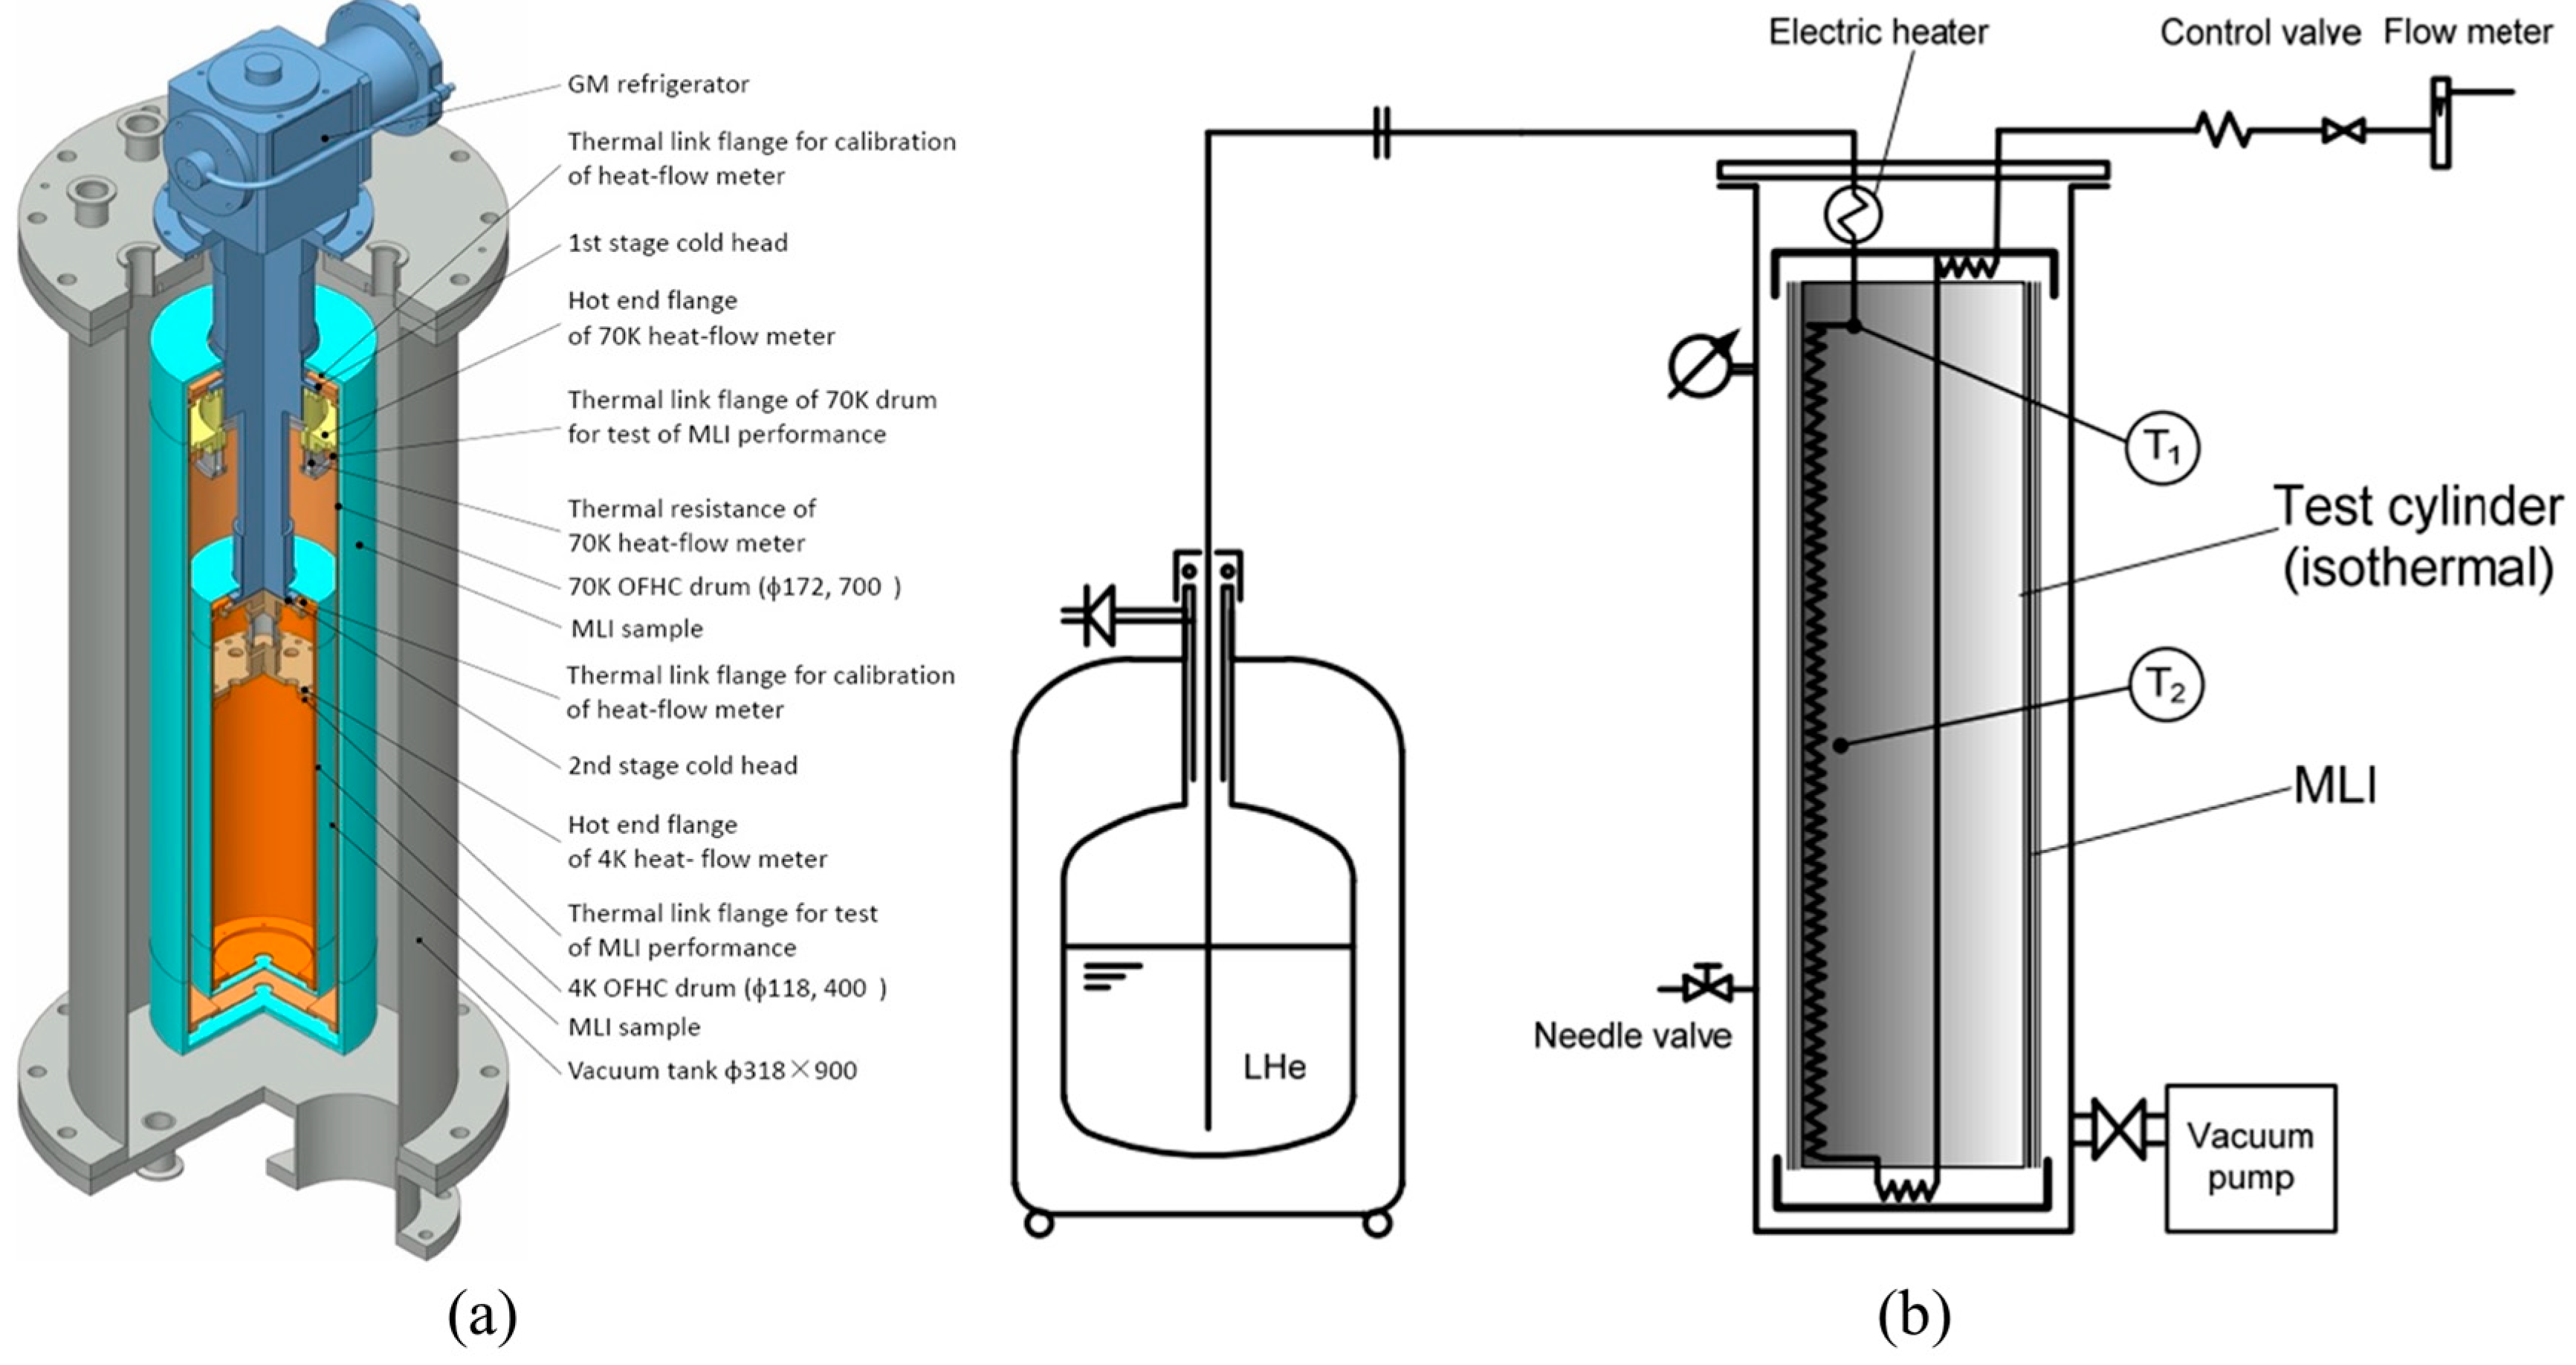
As shown in Figure 5, using cryocoolers or cold gaseous helium as the heat sink are two promising methods to alternate the LH2 in measuring the performance of thermal insulation structures at LH2 temperatures [70]. In the method coupled with the cryocoolers, as demonstrated in Figure 5a [72], a metal rod is installed to connect the cold head of the cryocoolers to the test chamber. The heat leak into the test chamber can be obtained from the temperature difference between the two ends of the rod after calibrating the thermal conductivity of the rod. Although a deviation of nearly 100% of heat leak occurred when compared to the measured results from the steady boil-off tests at liquid nitrogen temperatures [73], the incorporation of cryocoolers as the heat sink is still one of the potential solutions for alternating the use of LH2 in measuring the performance of thermal insulations [70,71,72,73]. More efforts should be made in this method to further increase the measurement accuracy of thermal insulation performance. In the method coupled with cold gaseous helium, as shown in Figure 5b [74], the design of the experimental facility and testing results at liquid nitrogen temperatures were provided, but no further discussion about the testing results at LH2 temperatures [75,76].

3.2.2. Measurement of Transient Heat Leak at Liquid Hydrogen Temperatures

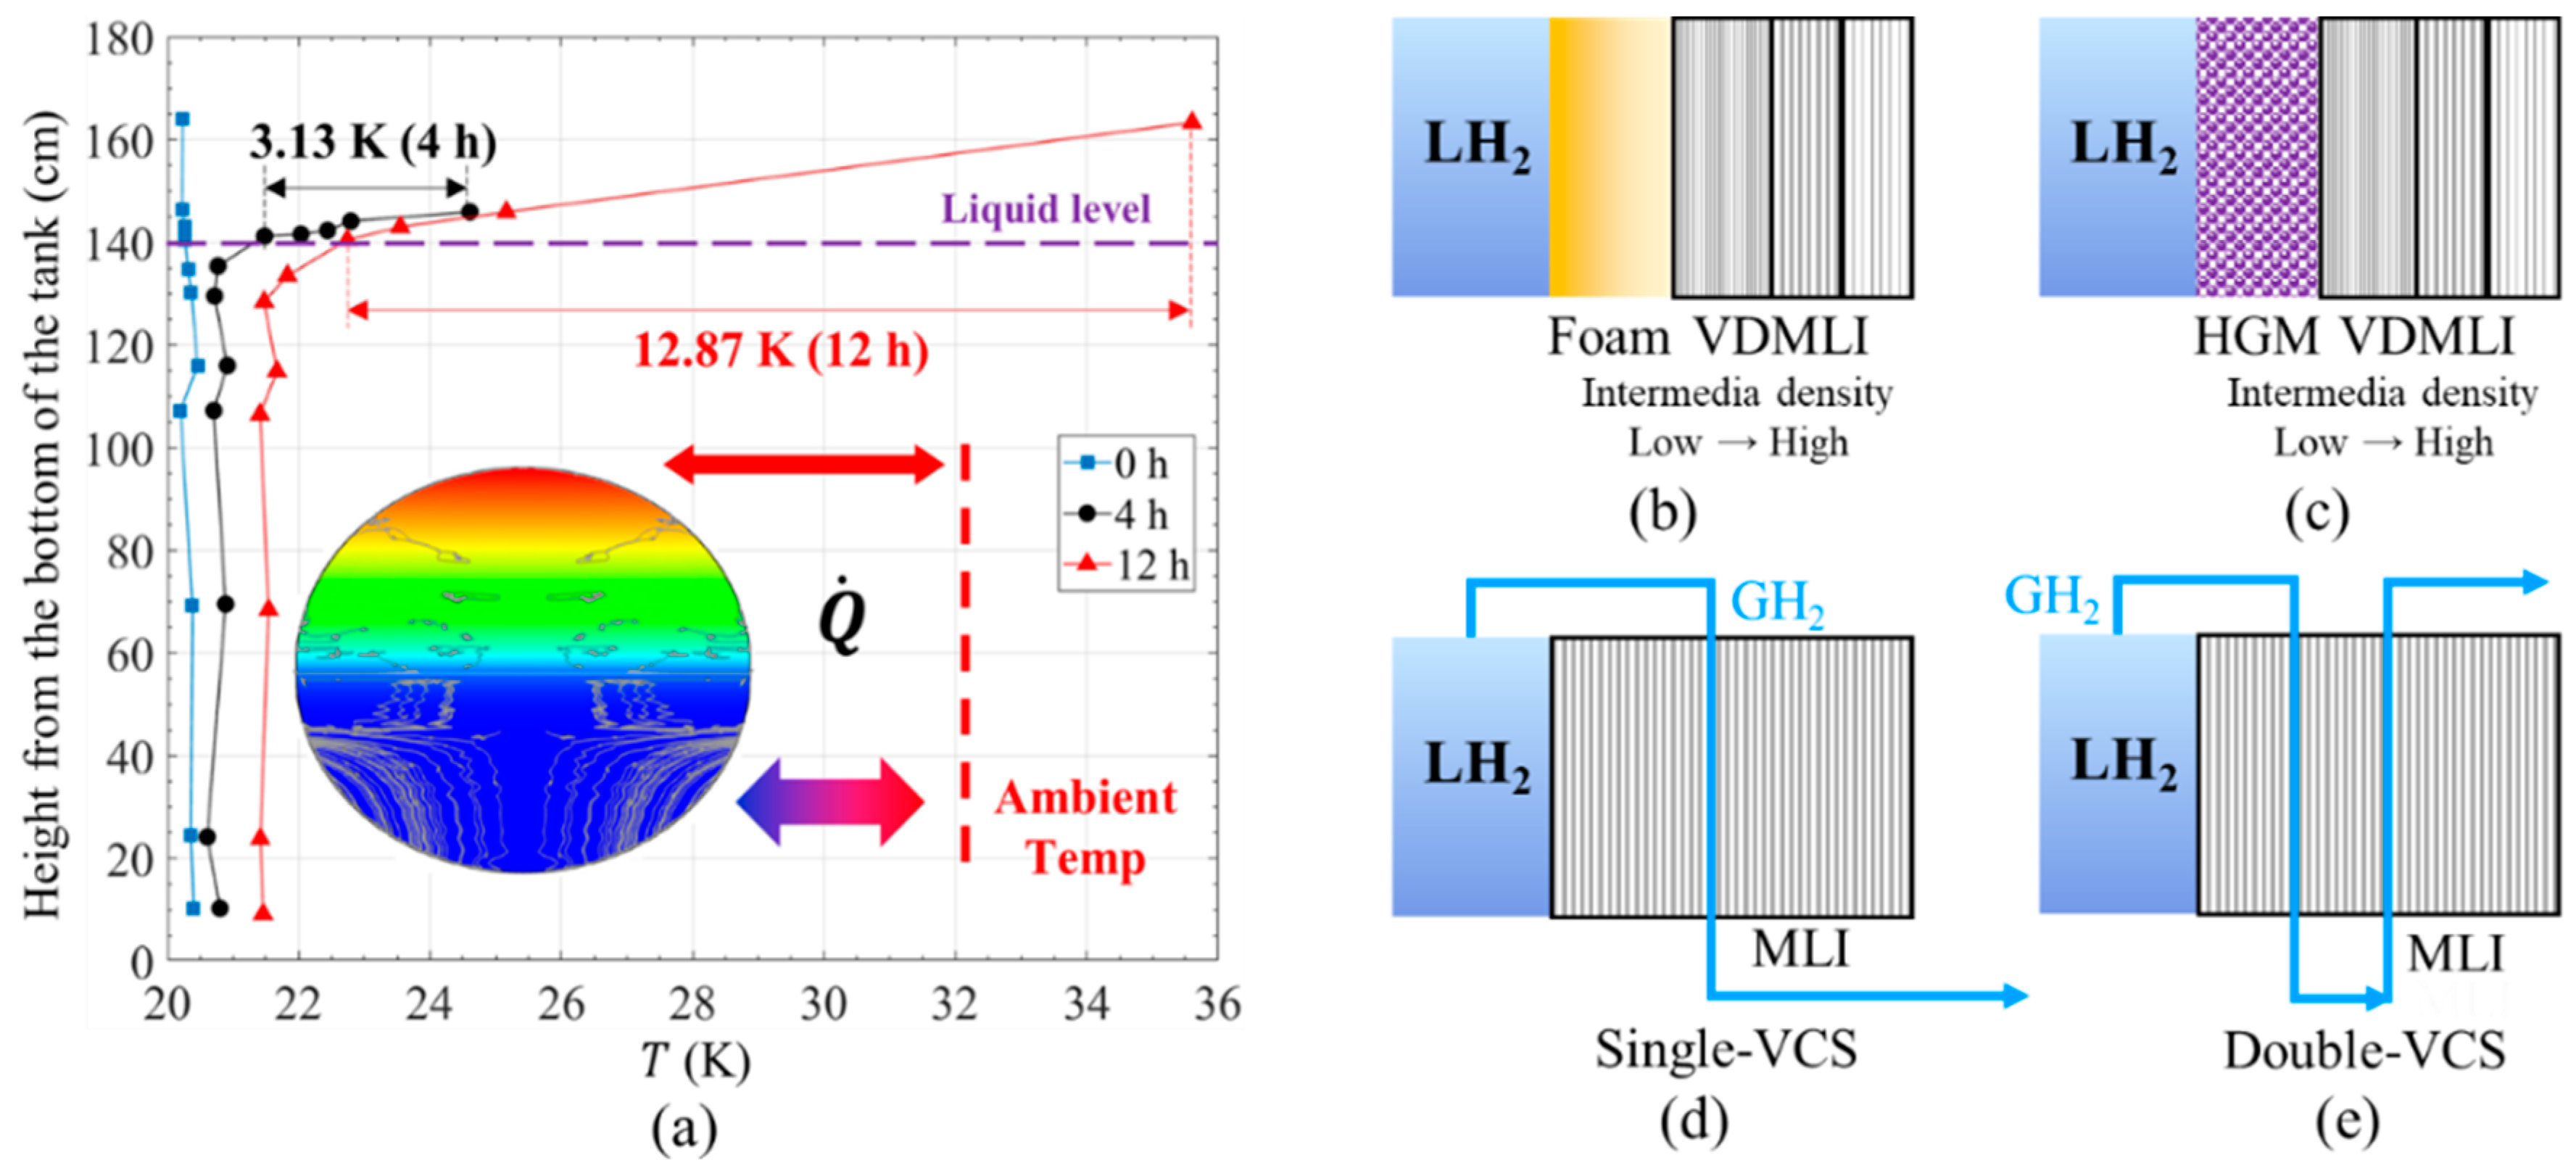
The heat leak through the thermal insulation structure is normally obtained by the steady boil-off testing and is input to the thermal models as a constant for the prediction of thermal behaviors inside the LH2 tank. However, the heat leak will have a spatial and temporal distribution due to the temperature stratification 38. As indicated in Figure 6a, the temperature stratification leads to a uniformly distributed temperature from the bottom to the top of the LH2 tank. The maximum temperature inside the fluid rises with time, making the temperature difference between the ambient surroundings and the fluid continuously reduced. When the ambient temperature is fixed, the heat leak will reduce during the no-vented storage of LH2. Moreover, the temperature of vapor is higher than that of liquid, causing the heat leakage distributed between the vapor and liquid phases [77]. For the sake of achieving an accurate description of the heat leak, conducting measurements of the transient heat leak under temperature stratification is recommended in future research.

3.2.3. Development of High-Performance Thermal Insulation for Protecting LH2 Tanks

According to the American standard CGA H-3 [18] and NASA report [43], the MLI under high vacuum is a widely used form of thermal insulation in the LH2 tank with a volume of less than 100 m3, and the form of variable-density MLI (VDMLI) can help to improve the insulation performance of MLI at LH2 temperatures. Figure 6b presents the schematic of VDMLI with foam [78]. The combination of VDMLI with foam can provide thermal protection for the cryogenic tank in the event of a vacuum breakdown or a sudden increase in heat leak [79]. In this case, the rapid increase in pressure and discharge of the tank contents can be limited by the safety valves of the tank.
Since the hollow glass microsphere has a higher thermal resistance than the foam, the composite MLI coupling the hollow glass microsphere (Figure 6c) with VDMLI becomes a potential form of thermal insulation according to reference [80]. However, few studies have been carried out to test the thermal insulation performance of the MLI coupled with the hollow glass microsphere due to some limitations. First, an additional wall is required between the hollow glass microsphere and MLI layers. Despite the existence of the hollow glass microsphere helping to slow down the pressure rise inside the tank in the event of a vacuum breakdown, more efforts need to be made for evacuation, and more space is required for thermal insulation. Therefore, the feasibility of applying the thermal insulation on the LH2 tanks by coupling the MLI with the hollow glass microsphere remains to be revealed in future studies.
To reduce the heat leak into the tank by making use of the sensible heat from the evaporated hydrogen from 20.3 K to 300 K, the vapor-cooled shield [35] (VCS, in Figure 6d,e) has attracted much interest in the demand for improving thermal insulation performance at LH2 temperatures [28]. It is noted that using the para-ortho hydrogen conversion can improve the performance of the VCS [81,82,83]. However, the performance of VCS coupled with para-ortho hydrogen conversion is limited by a high-pressure drop that existed in a catalyst and a reasonable position of VCS at the MLI layers. Moreover, due to the lack of systematical experimental tests, the improvement in the performance of VCS coupled with para-ortho hydrogen conversion remains unclear. Therefore, more experimental testing of MLI coupled with MLI at LH2 temperatures needs to be carried out.

4. Conclusions

Safe and efficient storage/transportation is essential for large-scale utilization and operation of LH2. This paper presents an overview of thermal behaviors during the no-vented storage of LH2 and thermal insulations applied to LH2 tanks for the two key indicators of hold time and normal evaporation rate (NER) required in the standard.
Thermal behaviors of the fluid inside the tank can directly affect the hold time, so the clarification of thermal behaviors is vital for the safe operation of LH2. Based on a summary of experimental/theoretical investigation on the thermal behaviors of LH2, four perspectives are proposed and discussed in this paper to encourage conducting long-term observations and revealing the mechanism of vapor-liquid phase change, temperature stratification, and buoyancy flows.
Thermal insulation with high performance can realize a low NER as well as a small heat leak into the tank, which provides substantial support for the long-term storage of LH2. Herein, the forms, performance, and testing method of forms of thermal insulation at LH2 temperatures are introduced. Accordingly, three perspectives and recommendations for future work are presented, including the alternative methods of using cryocoolers or cold gaseous helium to test the performance of thermal insulations, measurement of transient behaviors of heat leak due to thermal stratification, as well as the development of performance-improved thermal insulation structures. This work can provide guidance for the design and improvement of high-performance LH2 tanks.

Author Contributions

H.W.: Conceptualization, Methodology, Software, Formal analysis, Writing—Original Draft. Y.G.: Software, Validation, Data curation. B.W.: Writing—Review and Editing, Resources, Supervision. Q.P.: Software, Investigation. Z.G.: Writing—Review and Editing, Supervision. All authors have read and agreed to the published version of the manuscript.

Funding

This work was financially supported by the Baima Lake Laboratory Joint Funds of the Zhejiang Provincial Natural Science Foundation of China (Grant No. LBMHZ24E060004).

Conflicts of Interest

The authors declare no conflict of interest.

References

  1. IEA. Global Hydrogen Review 2023, 2023, IEA. Available online: https://www.iea.org/reports/global-hydrogen-review-2023 (accessed on 15 June 2024).
  2. Gür, T.M. Review of electrical energy storage technologies, material and systems: Challenges and prospects for large-scale grid storage. Energy Environ. Sci. 2018, 11, 2696–2767. [Google Scholar] [CrossRef]
  3. Parkinson, B.; Balcombe, P.; Speirs, J.F.; Hawkes, A.D.; Hellgardt, K. Levelized cost of CO2 mitigation from hydrogen production routes. Energy Environ. Sci. 2019, 12, 19–40. [Google Scholar] [CrossRef]
  4. Alsaba, W.; Al-Sobhi, S.A.; Qyyum, M.A. Recent advancements in the hydrogen value chain: Opportunities, challenges, and the way Forward-Middle East perspectives. Int. J. Hydrogen Energy 2023, 48, 26408–26435. [Google Scholar] [CrossRef]
  5. Bartela, L. A hybrid energy storage system using compressed air and hydrogen as the energy carrier. Energy 2020, 196, 117088. [Google Scholar] [CrossRef]
  6. Xie, X.B.; Hou, C.X.; Chen, C.G.; Sun, X.Q.; Pang, Y.; Zhang, Y.P.; Yu, R.H.; Wang, B.; Du, W. First-principles studies in Mg-based hydrogen storage materials: A review. Energy 2020, 211, 118959. [Google Scholar] [CrossRef]
  7. Andersson, J.; Grönkvist, S. Large-scale storage of hydrogen. Int. J. Hydrogen Energy 2019, 44, 11901–11919. [Google Scholar] [CrossRef]
  8. Fesmire, J.; Swanger, A.; Jacobson, J.; Notardonto, W. Energy efficient large-scale storage of liquid hydrogen. IOP Conf. Ser. Mater. Sci. Eng. 2022, 1240, 012088. [Google Scholar] [CrossRef]
  9. Liquefied Hydrogen Carrier -SUISO FRONTIER- Receives Classification from Nippon Kaiji Kyokai. Available online: https://global.kawasaki.com/en/corp/newsroom/news/detail/?f=20211203_9557 (accessed on 18 June 2024).
  10. Decker, L. Liquid Hydrogen Distribution Technology. Available online: https://www.sintef.no/globalassets/project/hyper/presentations-day-2/day2_1105_decker_liquid-hydrogen-distribution-technology_linde.pdf/ (accessed on 18 June 2024).
  11. LH2 Transport Trailers. Available online: https://files.chartindustries.com/21746492_LH2Trailer.pdf (accessed on 18 June 2024).
  12. IRENA. Global hydrogen trade to meet the 1.5 °C climate goal. In Part II: Technology Review of Hydrogen Carriers; International Renewable Energy Agency: Abu Dhabi, United Arab Emirates, 2022. [Google Scholar]
  13. Berstad, D.; Gardarsdottir, S.; Roussanaly, S.; Voldsund, M.; Ishimoto, Y.; Nekså, P. Liquid hydrogen as prospective energy carrier: A brief review and discussion of underlying assumptions applied in value chain analysis. Renew. Sustain. Energy Rev. 2022, 154, 111772. [Google Scholar] [CrossRef]
  14. Wang, H.R.; Wang, B.; Li, R.Z.; Shen, X.; Wu, Y.Z.; Pan, Q.W.; He, Y.X.; Zhou, W.M.; Gan, Z.H. Thermodynamic analysis of the effect of initial ortho-hydrogen concentration on thermal behaviors for liquid hydrogen tanks. Int. J. Hydrogen Energy 2024, 55, 243–260. [Google Scholar] [CrossRef]
  15. Cursu, S.; Sherif, S.A.; Veziroglu, T.N.; Sheffield, J.W. Analysis and optimization of thermal stratification and self-pressurization effects in liquid hydrogen storage systems-Part 1: Model development. J. Energy Resour. Technol. 1993, 115, 221–227. [Google Scholar]
  16. Mao, Z.Q. Hydrogen Safety; Chemical Industry Press Co., Ltd.: Beijing, China, 2020. (In Chinese) [Google Scholar]
  17. Wang, H.R.; Wang, B.; Sun, J.C.; Pan, Q.W.; Luo, G.Q.; Tao, X.; He, Y.X.; Pfotenhauer, J.; Jin, T.; Gan, Z.H. Experimental and computational fluid dynamic investigation on thermal behaviors of liquid hydrogen during the no-vented storage process: A literature review. Int. J. Hydrogen Energy 2024, 57, 822–843. [Google Scholar] [CrossRef]
  18. The Compressed Gas Association. Cryogenic Hydrogen Storage, 2nd ed.; CGA H-3-2013; The Compressed Gas Association, Inc.: McLean, VA, USA.
  19. T/CATSI 05006-2021; China Association for Technical Supervision Information. Special Technical Requirements for Static Vacuum-Insulated Liquid Hydrogen Pressure Vessels. Standards Press of China: Beijing, China, 2021. (In Chinese)
  20. T/CATSI 05007-2023; China Association for Technical Supervision Information. Special Technical Requirements for Transportable Vacuum-Insulated Liquid Hydrogen Pressure Vessels. Standards Press of China: Beijing, China, 2023. (In Chinese)
  21. Ishimoto, Y.; Voldsund, M.; Neksa, P.; Roussanaly, S.; Berstad, D.; Gardarsdottir, S.O. Large-scale production and transport of hydrogen from Norway to Europe and Japan: Value chain analysis and comparison of liquid hydrogen and ammonia as energy carriers. Int. J. Hydrogen Energy 2020, 45, 32865–32883. [Google Scholar] [CrossRef]
  22. Vanessa, T.; Sebastian, L.; Detlef, S. Hydrogen Science and Engineering: Material, Processes, Systems and Technology; Wiley-VCH Verlag GmbH & Co. KGaA: Hoboken, NJ, USA, 2016; pp. 659–690. [Google Scholar]
  23. Kawasaki Completes Basic Design for World’s Largest Class (11200-Cubic-Meter) Spherical Liquefied Hydrogen Storage Tank. Kawasaki. 2020. Available online: https://global.kawasaki.com/en/corp/newsroom/news/detail/?f=20201224_8018 (accessed on 15 June 2024).
  24. Al Ghafri, S.Z.S.; Munro, S.; Cardella, U.; Funke, T.; Notardonato, W.; Trusler, J.P.M.; Leachman, J.; Span, R.; Kamiya, S.; Pearce, G.; et al. Hydrogen liquefication: A review of the fundamental physics, engineering practice and future opportunities. Energy Environ. Sci. 2022, 15, 2690–2731. [Google Scholar] [CrossRef]
  25. Air Products. Safegram 9: Liquid Hydrogen; Air Products and Chemicals, Inc.: Lehigh Valley, PA, USA, 2014; Available online: https://www.airproducts.com.cn/en/company/sustainability/safetygrams (accessed on 18 June 2024).
  26. Chen, H.; Gao, X.; Xing, K.W.; Li, J.J. Influence of enthalpy on static evaporation rate of liquid hydrogen tank. Cryogenics 2015, 208, 62–66. (In Chinese) [Google Scholar]
  27. Matveev, K.I.; Leachman, J.W. The effect of liquid hydrogen tank size on self-pressurization and constant-pressure venting. Hydrogen 2023, 4, 444–455. [Google Scholar] [CrossRef]
  28. Matveev, K.I.; Leachman, J.W. Modeling of liquid hydrogen tank cooled with para-orthohydrogen conversion. Hydrogen 2023, 4, 146–153. [Google Scholar] [CrossRef]
  29. Wang, H.R.; Wang, B.; Xu, T.C.; Shen, X.; He, Y.X.; Zhou, W.M.; Pfotenhauer, J.; Jin, T.; Gan, Z.H. Thermal models for self-pressurization prediction of liquid hydrogen tanks: Formulation, validation, assessment, and prospects. Fuel 2024, 365, 131247. [Google Scholar] [CrossRef]
  30. Zuo, Z.Q.; Zhu, W.X.; Huang, Y.H.; Wang, L.; Tong, L.G. A review of cryogenic quasi-steady liquid-vapor phase change: Theories, models, and state-of-the-art applications. Int. J. Heat Mass Transf. 2023, 205, 123916. [Google Scholar] [CrossRef]
  31. Aasadnia, M.; Mehrpooya, M. Large-scale liquid hydrogen production methods and approaches: A review. Appl. Energy 2018, 212, 57–83. [Google Scholar] [CrossRef]
  32. Clark, J.A. A review of pressurization, stratification, and interfacial phenomena. Adv. Cryog. Eng. 1964, 10, 259–283. [Google Scholar]
  33. Aydelott, J.C. Effect of Size on Normal-Gravity Self-Pressurization of Spherical Liquid Hydrogen Tankage; NASA TN D-5196; NASA: Washington, DC, USA, 1969; pp. 1–44. [Google Scholar]
  34. Van, D.; Lin, C.S. Self-Pressurization of a Flight Weight Liquid Hydrogen Tank: Effects of Fill Level at Low Wall Heat Flux; NASA TM-105411; NASA: Washington, DC, USA, 1992; pp. 2–7. [Google Scholar]
  35. Zhang, C.G.; Li, C.J.; Jia, W.L.; Pang, Y. Thermodynamic study on thermal insulation schemes for liquid helium storage tank. Appl. Therm. Eng. 2021, 195, 117185. [Google Scholar] [CrossRef]
  36. Seo, M.; Jeong, S. Analysis of self-pressurization phenomenon of cryogenic fluid storage tank with thermal diffusion model. Cryogenics 2010, 50, 549–555. [Google Scholar] [CrossRef]
  37. Zuo, Z.Q.; Jiang, W.B.; Qin, X.J.; Huang, Y.H. A numerical model for liquid-vapor transition in self-pressurized cryogenic containers. Appl. Therm. Eng. 2021, 193, 117005. [Google Scholar] [CrossRef]
  38. Yang, Y.L.; Jiang, W.B.; Huang, Y.H. Experiment on transient thermodynamic behavior of a cryogenic storage tank protected by a composite insulation structure. Energy 2023, 270, 126929. [Google Scholar] [CrossRef]
  39. Liebenberg, D.H.; Edeskuty, F.J. Pressurization analysis of a large-scale liquid hydrogen dewar. Int. Adv. Cryog. Eng. 1965, 10, 284–289. [Google Scholar]
  40. Aydelott, J.C. Normal Gravity Self-Pressurization of 9-Inch-Diameter Spherical Liquid Hydrogen Tankage; NASA TN D-4171; NASA: Washington, DC, USA, 1967; pp. 1–10. [Google Scholar]
  41. Hasan, M.; Lin, C.S. Self-pressurization of a Flight Weight Liquid Hydrogen Storage Tank Subjected to Low Heat Flux; NASA TM-103804; NASA: Washington, DC, USA, 1991; pp. 2–5. [Google Scholar]
  42. Hastings, L.J.; Flachbart, R.H.; Martin, J.J.; Hedayat, A.; Fazah, M.; Lak, T.; Nguyen, H.; Bailey, J.W. Spray Bar Zero-Gravity Vent System for On-Orbit Liquid Hydrogen Storage; NASA TM-12926; NASA: Washington, DC, USA, 2003; pp. 43–133. [Google Scholar]
  43. Martin, J.J.; Hastings, L. Large-Scale Liquid Hydrogen Testing of a Variable Density Multilayer Insulation with a Foam Substrate; NASA TM-211089; NASA: Washington, DC, USA, 2001; pp. 25–35. [Google Scholar]
  44. Maekawa, K.; Takeda, M.; Hamaura, T.; Suzuki, K.; Miyake, Y.; Matsuno, Y.; Fujikawa, S.; Kumakura, H. First experiment on liquid hydrogen transportation by ship inside Osaka bay. IOP Conf. Ser. Mater. Sci. Eng. 2017, 278, 012066. [Google Scholar] [CrossRef]
  45. Maekawa, K.; Takeda, M.; Miyake, Y.; Kumakura, H. Sloshing measurements inside a liquid hydrogen tank with external-heating-type MgB2 level sensors during marine transportation by the training ship Fukae-Maru. Sensors 2018, 18, 3694. [Google Scholar] [CrossRef]
  46. Johnson, W.L.; Balasubramaniam, R.; Hibbs, R.G.; Zimmerli, G.A.; Asipaukas, M.; Bittinger, S.A.; Dardano, C.; Koci, F.D. Demonstration of Multilayer Insulation, Vapor Cooling of Structure, and Mass Gauging for Large-Scale Upper Stages: Structural Heat Intercept, Insulation, and Vibration Evaluation Rig (SHIIVER) Final Report; NASA TP-5008233; NASA: Washington, DC, USA, 2021. [Google Scholar]
  47. Rotenberg, Y. Numerical simulation of self-pressurization in a small cryogenic tank. Adv. Cryog. Eng. 1989, 29, 962–971. [Google Scholar]
  48. Schmidt, A.F.; Purcell, J.R.; Wilson, A.; Smith, R.V. An experimental study concerning the pressurization and stratification of liquid hydrogen. Adv. Cryog. Eng. 1960, 5, 487–497. [Google Scholar]
  49. Wang, H.R.; Wang, B.; Pan, Q.W.; Wu, Y.Z.; Jiang, L.; Wang, Z.H.; Gan, Z.H. Modeling and thermodynamic analysis of thermal performance in self-pressurized liquid hydrogen tanks. Int. J. Hydrogen Energy 2022, 47, 30530–30545. [Google Scholar] [CrossRef]
  50. Bailey, T.E.; Fearn, R.F. Analytical and experimental determination of liquid hydrogen temperature stratification. Adv. Cryog. Eng. 1963, 9, 254–264. [Google Scholar]
  51. Zilliac, G.; Karabeyoglu, M. Modeling of propellant tank pressurization. In Proceedings of the 41st AIAA/ASME/SAE/ASEE Joint Propulsion Conference & Exhibit, Tucson, AZ, USA, 10–13 July 2005. [Google Scholar] [CrossRef]
  52. Liu, Z.; Li, Y.Z. Thermal physical performance in liquid hydrogen tank under constant wall temperature. Renew. Energy 2019, 130, 601–612. [Google Scholar] [CrossRef]
  53. Arnett, R.W.; Votb, R.O. A Computer Program for the Calculation of Thermal Stratification and Self-Pressurization in a Liquid Hydrogen Tank; NASA: Washington, DC, USA, 1972. [Google Scholar]
  54. Sakowski, B.; Hauser, D.M.; Kassemi, M. SINDA/FLUINT and thermal desktop multi-node settled and unsettled propellant tank modeling of zero boil off test. In Proceedings of the 55th AIAA/ASME/SAE/ASEE Joint Propulsion Conference, Indianapolis, IN, USA, 19–22 August 2019. [Google Scholar] [CrossRef]
  55. Lan, E.; Shi, S.B.; Ji, W.; Ishii, M. Modeling and simulation of cryogenic propellant tank pressurization in normal gravity. Appl. Therm. Eng. 2024, 236, 121628. [Google Scholar] [CrossRef]
  56. Kassemi, M.; Kartuzova, O. Effect of interfacial turbulence and accommodation coefficient on CFD predictions of pressurization and pressure control in cryogenic storage tank. Cryogenics 2016, 74, 138–153. [Google Scholar] [CrossRef]
  57. Kartuzova, O.; Kassemi, M.; Moder, J.P. Self-pressurization and spray cooling simulations of the Multipurpose Hydrogen Test Bed (MHTB) ground-based experiment. In Proceedings of the 50th AIAA/ASME/SAE/ASEE Joint Propulsion Conference, Cleveland, OH, USA, 28–30 July 2014. [Google Scholar] [CrossRef]
  58. Mattick, S.J.; Lee, C.P.; Hosangadi, A.; Ahuja, V. Progress in modeling pressurization in propellant tanks. In Proceedings of the 46th AIAA/ASME/SAE/ASEE Joint Propulsion Conference & Exhibit, Nashville, TN, USA, 25–28 July 2010. [Google Scholar] [CrossRef]
  59. Schrage, R.W. A Theoretical Study of Interphase Mass Transfer; Columbia University Press: New York, NY, USA, 1953. [Google Scholar]
  60. Tanasawa, I. Advances in condensation heat transfer. Adv. Heat Transf. 1991, 21, 55–139. [Google Scholar] [CrossRef]
  61. Lee, W.H. Pressure iteration scheme for two-phase flow modeling. In Multiphase Transport: Fundamentals, Reactor Safety, Applications; World Scientific: Singapore, 1980. [Google Scholar]
  62. Zuo, Z.Q.; Wu, J.Y.; Huang, Y.H. Validity evaluation of popular liquid-vapor phase change models for cryogenic self-pressurization process. Int. J. Heat Mass Transf. 2021, 181, 121879. [Google Scholar] [CrossRef]
  63. Bourgarel, M.H.; Segel, M.P.; Huffenus, J.P. Study of stratification similitude laws in liquid hydrogen. Adv. Cryog. Eng. 1967, 13, 103–111. [Google Scholar]
  64. Holman, J.P. Heat Transfer, 10th ed.; McGraw Hill Higher Education: New York, NY, USA, 2012. [Google Scholar]
  65. Kartuzova, O.; Kassemi, M. Modeling interfacial turbulent heat transfer during ventless pressurization of a large scale cryogenic storage tank in microgravity. In Proceedings of the 47th AIAA/ASME/SAE/ASEE Joint Propulsion Conference & Exhibit, San Diego, CA, USA, 31 July–3 August 2011. [Google Scholar] [CrossRef]
  66. Wan, C.C.; Zhu, S.L.; Shi, C.Y.; Bao, S.R.; Zhi, X.Q.; Qiu, L.M.; Wang, K. Numerical simulation on pressure evolution process of liquid hydrogen storage tank with active cryogenic cooling. Int. J. Refrig. 2023, 150, 47–58. [Google Scholar] [CrossRef]
  67. Yin, L.; Yang, H.N.; Ju, Y.L. Review on the key technologies and future development of insulation structure for liquid hydrogen storage tanks. Int. J. Hydrogen Energy 2024, 57, 1302–1315. [Google Scholar] [CrossRef]
  68. Ratnakar, R.R.; Sun, Z.; Balakotaiah, V. Effective thermal conductivity of insulation materials for cryogenic LH2 storage tanks: A review. Int. J. Hydrogen Energy 2023, 48, 7770–7793. [Google Scholar] [CrossRef]
  69. Sakatain, N.; Ogawa, K.; Iijima, Y.I.; Arakawa, M.; Honda, R.; Tanaka, S. Thermal conductivity model for powered materials under vacuum based on experimental studies. AIP Adv. 2017, 7, 015310. [Google Scholar] [CrossRef]
  70. Gao, Y.F.; Wang, B.; Wang, H.R.; Sun, X.; Li, R.Z.; Xu, X.; Wang, Z.H.; Gan, Z.H. Progress of vacuum multilayer insulation materials at liquid hydrogen temperatures. Cryogenics 2021, 6, 12–21. (In Chinese) [Google Scholar]
  71. Fesmire, J.E.; Johnson, W.L. Cylindrical cryogenic calorimeter testing of six types of multilayer insulation systems. Cryogenics 2018, 89, 58–75. [Google Scholar] [CrossRef]
  72. Ohmori, T.; Kodama, K.; Tomaru, T.; Kimura, N.; Suzuki, T. Test apparatus utilizing a Gifford-Mcmahon cryocooler to measure the thermal performance of multilayer insulation. Phys. Procedia 2015, 67, 999–1004. [Google Scholar] [CrossRef]
  73. Hurd, J.A. Multilayer Insulation Testing at Variable Boundary Temperatures; Florida State University: Tallahassee, FL, USA, 2013. [Google Scholar]
  74. Funke, T.; Haberstroh, C. Performance measurements of multilayer insulation at variable cold temperature. Adv. Cryog. Eng. 2012, 1434, 1279–1284. [Google Scholar] [CrossRef]
  75. Funke, T.; Haberstroh, C. A calorimeter for measurements of multilayer insulation at variable cold temperature. Phys. Procedia 2015, 67, 1062–1067. [Google Scholar] [CrossRef]
  76. Funke, T.; Haberstroh, C. New measurements of multilayer insulation at variable cold temperature and elevated residual gas pressure. IOP Conf. Ser. Mater. Sci. Eng. 2015, 101, 012058. [Google Scholar] [CrossRef]
  77. Wang, H.R.; Wang, B.; Li, R.Z.; Shen, X.; Wu, Y.Z.; Pan, Q.W.; He, Y.X.; Zhou, W.M.; Gan, Z.H. Theoretical investigation on heat leakage distribution between vapor and liquid in liquid hydrogen tanks. Int. J. Hydrogen Energy 2023, 48, 17187–17201. [Google Scholar] [CrossRef]
  78. Zheng, J.P.; Chen, L.B.; Wang, J.; Xi, X.T.; Zhu, H.L.; Zhou, Y.; Wang, J.J. Thermodynamic analysis and comparison of four insulation schemes for liquid hydrogen storage tank. Energy Convers. Manag. 2019, 186, 526–534. [Google Scholar] [CrossRef]
  79. Huang, Y.H.; Wang, B.; Zhou, S.H.; Wu, J.Y.; Lei, G.; Li, P.; Sun, P.J. Modeling and experimental study on combination of foam and variable density multilayer insulation for cryogen storage. Energy 2017, 123, 487–498. [Google Scholar] [CrossRef]
  80. Wang, P.; Ji, L.; Yuan, J.; An, Z.G.; Yan, K.Q.; Zhang, J.J. Modeling and optimization of composite thermal insulation system with HGMs and VDMLI for liquid hydrogen on orbit storage. Int. J. Hydrogen Energy 2020, 45, 7088–7097. [Google Scholar] [CrossRef]
  81. Meng, C.J.; Qin, X.J.; Jiang, W.B.; Pu, L.M.; Liu, W.; Huang, Y.H. Cooling effect analysis on para-ortho hydrogen conversion coupled in vapor-cooled shield. Int. J. Hydrogen Energy 2023, 48, 15600–15611. [Google Scholar] [CrossRef]
  82. Xu, Z.L.; Tan, H.B.; Wu, H. Performance comparison of multilayer insulation coupled with vapor cooled shield and different para-ortho hydrogen conversion types. Appl. Therm. Eng. 2023, 234, 121250. [Google Scholar] [CrossRef]
  83. Shi, C.Y.; Zhu, S.L.; Wan, C.C.; Bao, S.R.; Zhi, X.Q.; Qiu, L.M.; Wang, K. Performance analysis of vapor-cooled shield insulation integrated with para-ortho hydrogen conversion for liquid hydrogen tanks. Int. J. Hydrogen Energy 2023, 48, 3078–3090. [Google Scholar] [CrossRef]
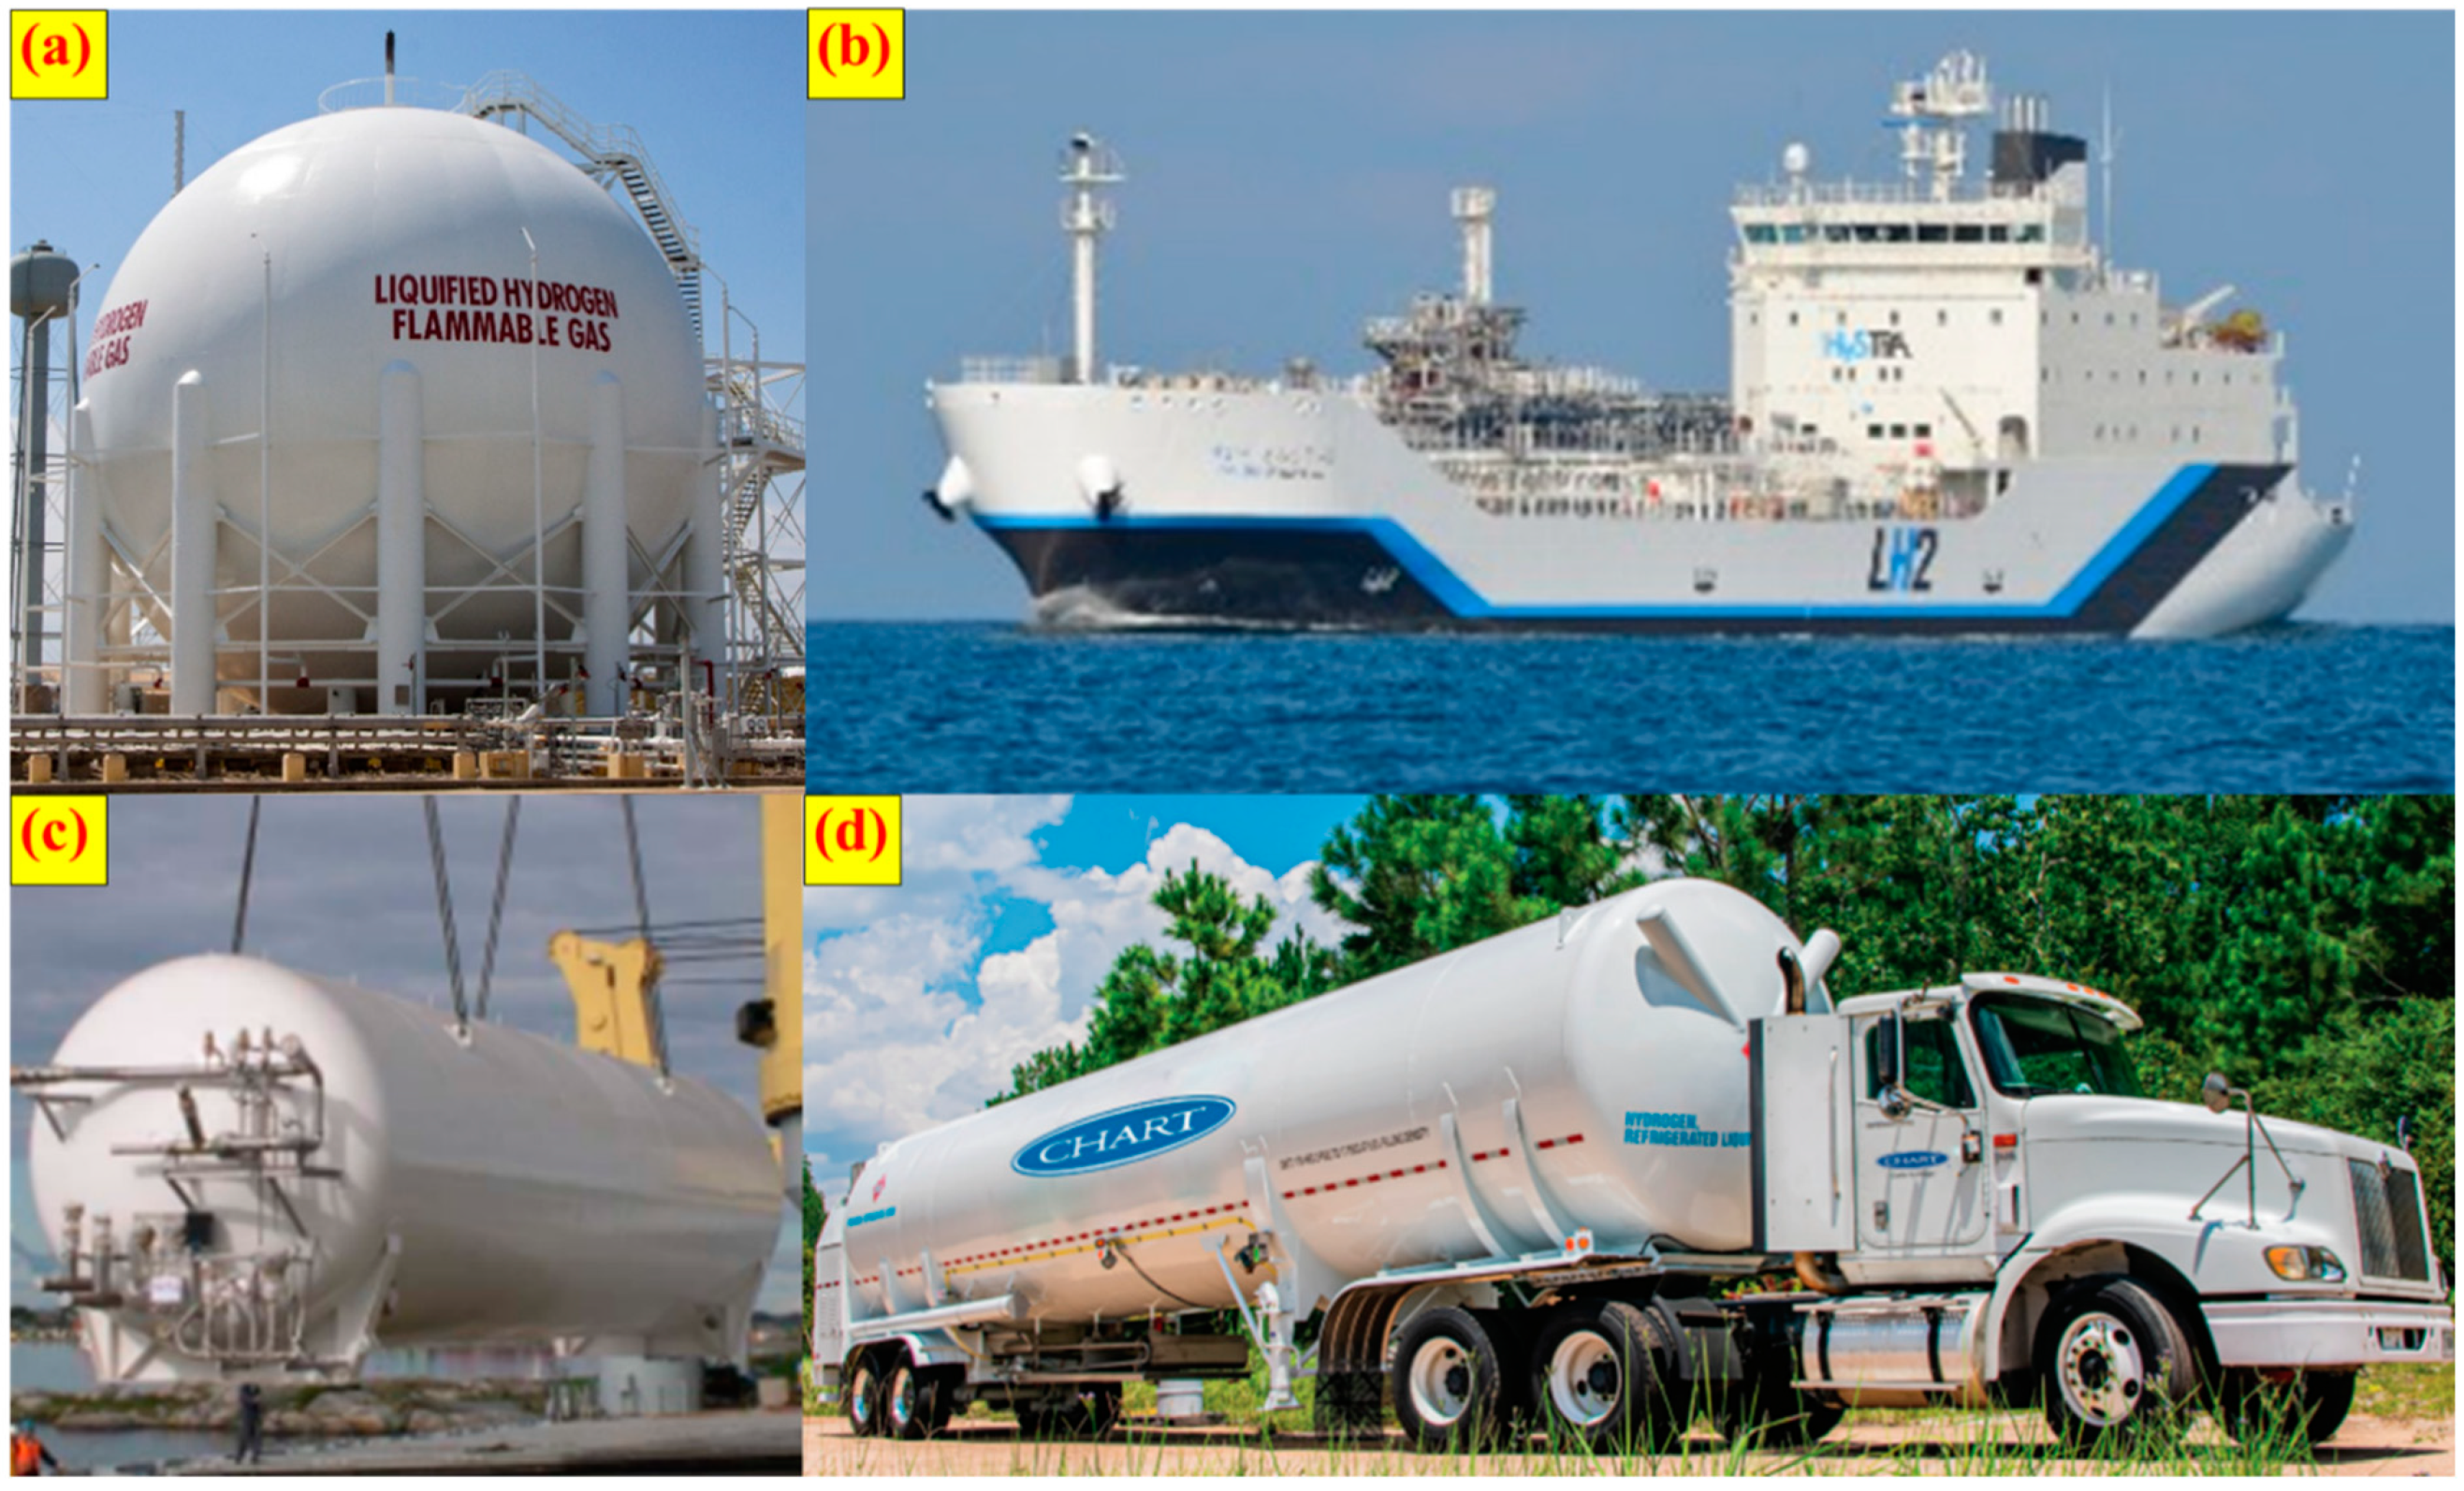
Figure 1. Typical methods for the storage and delivery of liquid hydrogen: (a). Spherical tank (NASA, Washington, D.C., Washington, United States, 3200 m3) [8]; (b). Liquefied hydrogen carrier ship (Kawasaki, Tokyo, Japan, 1250 m3) [9]; (c). Cylindrical horizontal tank (Linde, Pullach, Germany, 300 m3) [10]; (d). Transport trailer (Chart, Rancho Dominguez, CA, United States, 66.7 m3) [11].
Hydrogen 05 00031 g001
Figure 2. Indicators of hold time (self-pressurization rate) and normal evaporation rate (NER): (a). NER and self-pressurization rate at different volumes of LH2 tanks; (b). Outline of this paper. (Refs. in the figure: CGA H-3: [18]; T/CATSI-2021: [19]; NASA: [8,22]; Linde: [10]; Kawasaki: [9,23,24]; Air Products: [25]; Wenchang SLS: [26]).
Hydrogen 05 00031 g002
Figure 3. Schematic of models for predicting thermal behaviors during the no-vented storage of LH2: (a). Thermal equilibrium model (TEM); (b). Surface evaporated model (SEM); (c). Thermal multi-zone model (TMZM); (d). Thermal stratified model (TSM); (e). Thermal multi-node model (TMNM); (f). CFD model [58].
Hydrogen 05 00031 g003
Figure 4. Results of thermal behaviors inside LH2 tanks: (a). Predicted self-pressurization processes when coupled with different vapor–liquid phase change models in liquid nitrogen tanks [62]; (b). Effect of temperature stratification on self-pressurization rates for the LH2 tank 3441 (Point: Tested data; Dotted line: Spline line interpolation); (c). Temperature distributions obtained from laminar/turbulent models (SST k-ω) [56]; (d). Pressure rise and vapor-liquid phase change rate from laminar/turbulent models (SST k-ω) [56].
Hydrogen 05 00031 g004
Figure 5. Alternative testing methods for thermal insulations at LH2 temperatures: (a). Using cryocoolers as the heat sink [72]; (b). Using cold gaseous helium as the heat sink [74].
Hydrogen 05 00031 g005
Figure 6. Recommendations for thermal insulations at LH2 temperatures in future work: (a). Transient behaviors of heat leak due to temperature stratification [32]; (b). Composite thermal insulation with foam and variable-density MLI (VDMLI); (c). Composite thermal insulation with hollow glass microsphere (HGM) and VDMLI; (d). Single vapor-cooled shield (VCS) coupled with MLI; (e). Double-VCS coupled with MLI.
Hydrogen 05 00031 g006
Disclaimer/Publisher’s Note: The statements, opinions and data contained in all publications are solely those of the individual author(s) and contributor(s) and not of MDPI and/or the editor(s). MDPI and/or the editor(s) disclaim responsibility for any injury to people or property resulting from any ideas, methods, instructions or products referred to in the content.