Abstract
Globally, sea turtles face significant threats from human activities, yet detailed information on their habitat use and specific anthropogenic impacts remains limited, particularly in key marine protected areas like Kenya’s Diani-Chale National Marine Reserve (DCNMR). This study utilized drone-based (UAV—unmanned aerial vehicle) monitoring and geospatial analysis to assess sea turtle distribution and habitat use, integrating data from the Allen Coral Atlas. Most sea turtle sightings occurred in reef zones (61.86%), while the reef slope was the most utilized geomorphic feature (26.7% of sightings). The study identified a significant sea turtle hotspot in the northern DCNMR, a region characterized by lower anthropogenic pressure and unique geomorphic features. Between February and July 2024, we conducted monthly UAV surveys (6–10 survey days per month) in the DDCNMR using a DJI Mavic 3 drone, completing multiple standardized 25-min flights per day that each covered ~1 km2 via non-overlapping transects at 30–40 m altitude under optimal sea state and visibility conditions, resulting in 233 sea turtle sightings. UAV survey data were summarized descriptively, with sea turtle sightings mapped against geomorphological features as well as benthic habitats from an open source, high-resolution, satellite-based map and monitoring system for shallow-water coral reefs (ACA—Allen Coral Atlas). Allen Coral Atlas data and drone observations indicate that a widened reef slope and estuarine nutrient inputs provide a critical habitat gradient, offering turtles tidal-independent access to shallow foraging flats. Based on these findings, we recommend designating the northern reef slope as a priority no-take zone and conducting seagrass health assessments to guide potential restoration. This research demonstrates the utility of integrating drone surveys with open access geospatial tools to provide the actionable spatial data necessary for targeted sea turtle conservation and informed marine spatial planning.
1. Introduction
Effective conservation and management of sea turtles within Marine Protected Areas (MPAs) depend on a clear understanding of spatial distribution and habitat use. However, within the Diani-Chale National Marine Reserve (DCNMR) on the south coast of Kenya, these patterns have not yet been characterized using systematic, full-coverage, and quantitative data. Existing monitoring since 2018 has largely relied on photo-identification data collected during SCUBA surveys and citizen scientist reports. These efforts indicate that the DCNMR hosts significant sea turtle aggregations, with green turtles identified as the most abundant species [1]. However, these surveys cover only a fraction of the fringing reef and exclude shallow seagrass areas (<10 m) and deeper waters (>20 m). These information gaps constrain the evaluation of habitat importance and the implementation of evidence-based management. This is particularly problematic in a reserve that, despite its IUCN classification, lacks an operational management plan and suffers from chronic capacity shortfalls [2,3,4]. Furthermore, the area has historically faced governance challenges stemming from ongoing conflicts between the Kenya Wildlife Service (KWS) and local communities over resource use and benefit-sharing, which have hindered active management since its designation. Real-time ecological data on habitat use is therefore essential for evaluating the effectiveness of current conservation strategies and understanding how this Kenyan MPA can best sustain sea turtle populations [4,5]. To address the limitations of current surveys, drone surveys (Unmanned Aerial Vehicles, UAVs) started being employed in 2024 in this MPA, as a highly efficient, non-invasive tool for monitoring the extensive marine ecosystems with minimal disruption of both species and habitat [6,7,8,9]. By combining drone-based observations with standardized geomorphic and benthic layers from open access platforms, such as the Allen Coral Atlas, this study evaluates the integration of high-resolution opportunistic sighting data into a broader ecological mapping framework. The primary objective is to leverage this technical synergy to quantify sea turtle distribution and habitat selection within the DCNMR. Specifically, the research aims to identify critical aggregation hotspots and characterize the utilization of key benthic habitats, including seagrass meadows and coral reef systems.
Five of the world’s seven sea turtle species are found in Kenyan waters, with the green turtle (Chelonia mydas) and hawksbill turtle (Eretmochelys imbricata) being the most typical inhabitants of coastal coral reefs and seagrass beds [10]. Green turtles often prefer dense seagrass for food and protection, showing ontogenetic shifts toward herbivorous diets as they migrate to coastal areas [11,12,13]. Their diet is further shaped by external factors such as prey abundance and nutritional value [14,15]. In contrast, hawksbill turtles are primarily carnivorous, specializing in sponges within coral reef ecosystems [16]. Both species are ecologically vital, but the permanence of these populations depends on the health of their primary foraging habitats [17]. Both seagrass meadows and coral reefs are under increasing pressure from anthropogenic stressors, such as coastal development, pollution, and climate change [18,19,20,21]. Because these habitats are degrading rapidly, identifying and monitoring key foraging areas is essential. Establishing these spatial baselines is a critical step toward protecting these species and ensuring the long-term resilience of the marine ecosystems they rely on [22].
Addressing systemic data deficiencies, this research provides the spatially explicit evidence necessary to refine monitoring protocols and strengthen the baseline for a functional, data-driven management framework. Ultimately, this approach demonstrates a scalable model for utilizing accessible remote sensing tools to support the conservation of mobile marine megafauna in resource-constrained environments.
2. Materials and Methods
2.1. Study Site Description
The study was conducted within the Diani-Chale National Marine Reserve (DCNMR), a Marine Protected Area (MPA) located on Kenya’s southern coast in Kwale County (Figure 1). Formally designated by the Government of Kenya in 1995, the reserve’s boundaries extend along the coastline from the Mwachema River estuary in the north to Chale Island in the south, approximately 35 km south of Mombasa. The DCNMR is ecologically significant, encompassing 75 km2 of marine environment, protecting a diverse mosaic of vital ecosystems, including narrow fringing coral reefs, extensive seagrass meadows, and mangrove forests [23,24]. The study area within DCNMR is defined by a typical fringing reef system that runs parallel to the coastline that protects a 15 km2 shallow-water seagrass lagoon. This reef structure plays a decisive role in local ecology, as it becomes largely impassable during low tide, physically restricting the movement of large marine fauna in and out of the lagoon. Consequently, sea turtle access to the inner lagoon’s seagrass beds is tide-dependent, as the shallow reef crest acts as a seasonal and daily barrier to these critical foraging grounds. This expansive lagoon contains vital, diverse seagrass meadows, including Thalassodendron ciliatum, Syringodium isoetifolium, and Halophila ovalis [25], interspaced with sand and rubble, which represents 4 km2 of the DCNMR. This habitat transitions seaward into approximately 21 km2 of coral reef and associated algae ecosystems.
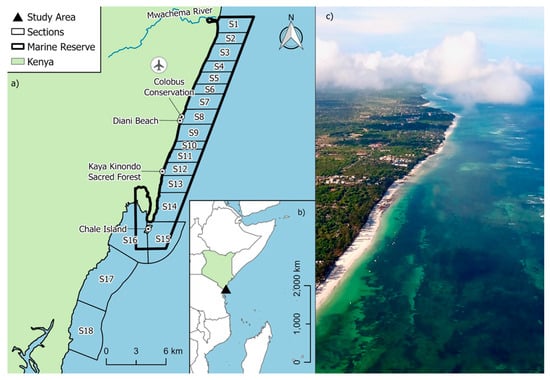
Figure 1.
(a) Map of the Diani-Chale Marine National Reserve (DCMNR) showing the official reserve boundaries, Diani Airport and placenames and the sectioning scheme established for conducting standardized drone transects and estimating sighting rate; (b) Relative location of DCMNR in Kenya; (c) Aerial drone view of a section of DCNMR showing the lagoon and fringing reef at high tide.
The region’s environmental conditions are governed by the seasonal reversal of monsoon winds. The North-East Monsoon (Kaskazi), occurring from November to March, typically brings calm seas and high-water clarity. In contrast, the South-East Monsoon (Kusi), from April to September, introduces cooler temperatures, increased rainfall, and higher surface winds [26]. These shifts were considered in the timing of our research, as the transition between seasons significantly influences underwater visibility.
2.2. Data Collection
To standardize survey effort and enable calculation of sighting rates, the DCNMR was divided into 16 similarly sized sections (Figure 1). Surveys in the DCNMR were conducted monthly from February to July 2024 using a DJI Mavic 3 Classic™ drone (DJI, Shenzhen, China), typically spanning 6–10 days per month. The survey period (February–July) was selected to encompass the transition from the calm North-East Monsoon (Kaskazi) to the onset of the South-East Monsoon (Kusi). This window ensured that the majority of data was collected under optimal conditions of high-water clarity and low surface wind, which are critical for the detectability of submerged sea turtles in shallow water, while still providing a representative look at distribution patterns as seasonal environmental instability increases. Flights were conducted in the early morning (07:00–09:00) at high or incoming tide to maximize visibility, allow full assessment of shallow seagrass habitats (0–6 m depth, much of which is largely exposed at low tide), and minimize wind-driven waves and surface movement that could reduce UAV image quality. Afternoon winds along the Kenyan coast, driven by predictable seasonal and diurnal patterns, typically generate rougher sea surfaces that would have impaired both image quality and sighting accuracy. While this schedule ensured high-quality data collection, we acknowledge that it also restricted surveys to a narrow set of environmental conditions, which may influence detectability (for depths > 6 m) and observed spatial patterns.
Sections 1–13 and 16 were surveyed by drone transects at least twice during the study period (Table 1), while the remaining sections were excluded from the study due to time and logistical constraints. Each survey was led by a trained drone pilot assisted by 1–2 turtle observers. Within each section, surveys consisted of multiple ~25-min flights covering approximately 1 km2 using a U-turn search pattern with non-overlapping 100 m-wide transects. Transect start and end points were arranged so that the last transect of each section ended 100 m before the start of the first transect in the adjacent section, preventing overlap between sections. The drone operated at an average altitude of 38.6 m (range: 30–40 m) and a speed of ~5 m/s, providing optimal visibility while minimizing disturbance to sea turtles [27,28].

Table 1.
Descriptive statistics on drone survey results and effort across different sections of DCMNR in 2024 (CPUE—Catch Per Unit of Effort, depicted as number of turtle sightings/hour; NS—No Survey).
2.3. Data Analysis
Flight videos were independently reviewed by two observers, with a third conducting a consensus analysis to validate the dataset and ensure no sightings were missed. To maintain taxonomic rigor, species identification followed a conservative multi-observer consensus protocol. Individuals were assigned to a specific taxon only when diagnostic morphological features were unequivocally discernible from the aerial imagery. Given that this conservative approach may be inherently biased against smaller or more cryptic species (e.g., Eretmochelys imbricata) in complex benthic environments, the total sighting pool was utilized for all spatial and habitat preference analyses to ensure a robust and representative assessment.
All sightings were mapped in QGIS (version 3.38) across the surveyed sections and the data extracted included GPS coordinates of sea turtle sightings and observed behaviors (Figure 2).
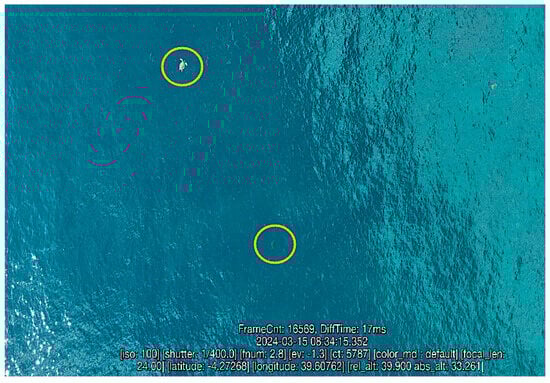
Figure 2.
Screenshot of drone video showing sea turtle sightings (n = 2, circled) and flight parameters.
To ensure accurate effort metrics for individual sections, seven flights were excluded from the sectional effort table because their automated transect paths overlapped multiple boundaries. However, all sightings recorded during these seven flights were retained and used in the subsequent habitat analysis.
Spatial patterns of sea turtle distribution were mapped using Kernel Density Estimation (KDE) to visualize relative sighting intensity across the lagoon and reef environments. This descriptive approach identified core areas of frequent occurrence without the application of formal statistical significance tests, with the identified hotspots reflecting observed spatial overlap.
To assess sea turtle sighting distribution in relation to existing marine ecosystems in the DCNMR, we spatially defined the boundaries and distribution of these ecosystems using high-resolution data from the Allen Coral Atlas (Version 2.0; Allen Coral Atlas Partnership, Tempe, AZ, USA, 2023) [29]. The ACA generates geojson files via satellite imagery and machine learning to classify the environment, identifying both geomorphic features (including lagoons, reef flats, crests, and fore reefs) and benthic classifications (such as coral/algae, seagrass, sand, and rubble) within the DCNMR. Sea turtle sighting coordinates were spatially overlaid onto the ACA layers to extract the corresponding habitat features for quantitative analysis. Benthic classes and bathymetric values (in absolute cm) from the ACA were used to infer habitat classification and use.
To characterize the spatial distribution of sea turtles relative to available benthic features, we calculated habitat selection ratios (SR) as an indicator of habitat occupancy intensity. These metrics compared the frequency of sea turtle occurrences within specific habitat classes—such as seagrass meadows, coral/algae reefs, and sandy substrates—against the proportional availability of those habitats within the study area. This analysis identified habitats with high, medium, or low occupancy relative to their spatial extent. Standardized departures from proportional use were evaluated using Bonferroni-adjusted confidence intervals (α = 0.05, m = number of habitats). In this framework, ratios significantly greater than 1.0 indicate habitats with higher-than-expected occupancy, while ratios less than 1.0 indicate habitats where turtles were less frequently observed relative to availability.
All spatial analyses were conducted in QGIS software (version 3.38).
3. Results
3.1. Survey Effort
A total of 233 sea turtle sightings were recorded during the study period, of which 18.03% (n = 42) were identified as green turtles, and 81.97% (n = 191) were of unknown species. Drone survey data were summarized as total sea turtle sightings, survey time, and their means ± standard deviations, along with sighting rate (number of sightings per hour) for the different sections of DCMNR (Table 1).
3.2. Habitat Availability and Utilization
Kernel Density Estimation (KDE) analysis (Figure 3) indicated that the primary sea turtle sighting hotspots within the DCNMR were concentrated in the northern region of the reserve, where the highest density (57.6%) was observed. The density map further revealed a pronounced clustering of sightings in proximity to the Mwachema River estuary area.
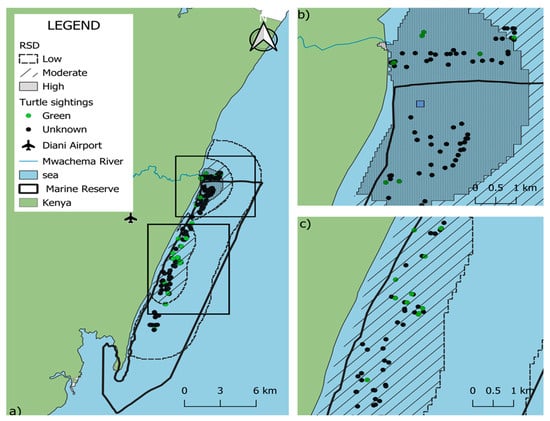
Figure 3.
Relative density distribution (RSD) of sea turtle sightings in the Diani-Chale National Marine Reserve. Panel (a) displays the entire reserve, where dark grey shading signifies areas of higher sighting density. Panels (b,c) provide zoomed-in views showing these higher density values specifically concentrated in the northern and central zones of the reserve, respectively. Green data points indicate green turtle (Chelonia mydas) sightings, while black data points represent “unidentified” species, while blue square represents RSD central point.
A total of 146 sightings (62.6%) overlapped with benthic habitats, encompassing shallow lagoon (n = 14) and coral reef environments (n = 132). Within the reef zone, the greatest number of sightings occurred along the reef slope (n = 63), followed by outer reef (n = 27), inner reef (n = 20), with back reef and reef crest showing the same number of sightings (n = 11) (Figure 4). In terms of depth, most of the sightings were observed at depths 0–3 m (n = 102, 69.9%), followed by 3.01–6 m (n = 39, 26.1%), and 6.1–9 m had the least number of sightings (n = 5, 3.5%). The remaining 90 sightings (38.1%) were recorded in open waters estimated to be deeper than 10 m.
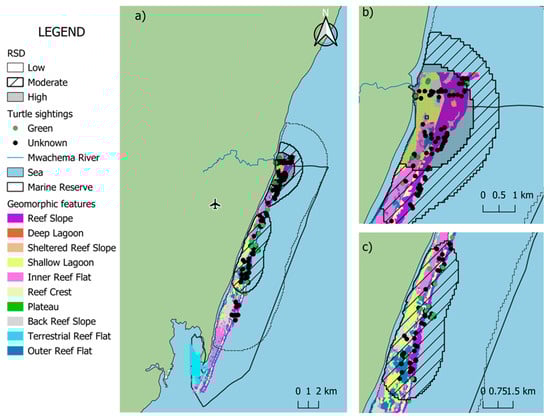
Figure 4.
Spatial co-occurrence of sea turtle sightings and geomorphic features in the Diani-Chale National Marine Reserve. The base geomorphic features layer was derived from the Allen Coral Atlas (Allen Coral Atlas © 2018–2023, CC BY 4.0, accessed May 2025). Panel (a) displays the entire reserve, while panels (b,c) provide zoomed-in views showing the detailed spatial relationship between turtle sightings and geomorphic features in the northern and central sectors, respectively, with blue square representing the relative density distribution (RSD) central point.
Habitat occupancy analysis revealed that the coral/algae class was the most prevalent benthic category (37.4% availability) and hosted the highest frequency of sea turtle occurrences (n = 74). This resulted in a selection ratio (SR) of 1.36, indicating a higher-than-expected occupancy of this habitat relative to its spatial extent. Rubble (SR = 1.06, 24% availability, n = 24) and sand (SR = 0.90, 19.9% availability, n = 27) exhibited occupancy rates proportional to their availability, suggesting neutral utilization. In contrast, seagrass habitats demonstrated low occupancy (SR = 0.30) despite comprising a substantial proportion of the study area (14.43%, n = 7), indicating that turtles were observed in these areas significantly less frequently than expected based on habitat availability alone (Figure 5; Table 2).
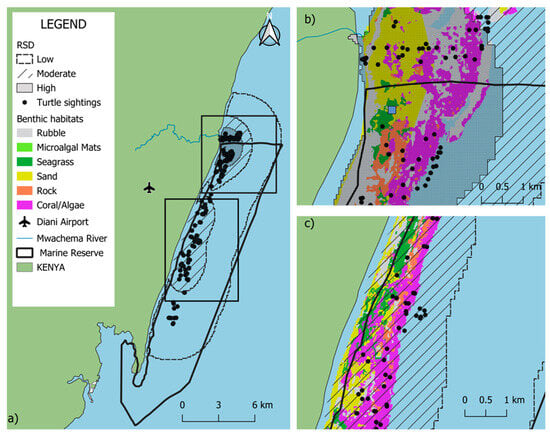
Figure 5.
Spatial co-occurrence of sea turtle sightings and benthic habitats in the Diani-Chale National Marine Reserve. The base habitat layer was derived from the Allen Coral Atlas (Allen Coral Atlas © 2018–2023, CC BY 4.0, accessed May 2025). Panel (a) displays the entire reserve, while panels (b,c) provide zoomed-in views showing the detailed spatial relationship between turtle sightings and habitats in the northern and central sectors, respectively. Blue square representing the relative density distribution (RSD) central point.
Table 2.
Sea turtle habitat availability, observed utilization, and occupancy intensity (Selection Ratio, SR) in the Diani-Chale National Marine Reserve. SR values < 1.0 indicate lower-than-expected occupancy relative to availability, while SR = 1.0 indicates neutral utilization.
4. Discussion
This study utilized a combined approach of aerial drone surveillance and existing open access data (Allen Coral Atlas) to generate a high-resolution understanding of sea turtle ecology and human pressures in the Diani-Chale National Marine Reserve (DCNMR), which is essential for effective, site-specific management interventions within this marine protected area. Our findings highlight the turtles’ habitat occurrences in relation to available geomorphic features of a fringing reef as well as associated marine benthic habitats, which are critical for informing robust conservation strategies [30,31].
Our analysis indicates that turtles predominantly utilize the reef slope (>10 m depth), a zone characterized by high coral diversity and growth that likely provides an optimal balance of foraging resources, shelter, and thermoregulation [32]. By forming a vital habitat gradient between high-energy crests and deeper zones, these slopes offer the synergistic refuge and foraging areas identified in this study. Notably, the relatively high frequency of sightings in open waters (>10 m) highlights the significance of non-reef habitats for migration and opportunistic foraging. However, the ACA habitat classification may erroneously attribute open waters to the reef slope area, which in the DCNMR often extends to 18 m depth (J. Hancock, pers. obs.).
Within shallow waters (<10 m), sightings were most frequent in coral/algae habitats, resulting in high selection ratios, particularly in the 0–3 m depth range. These environments likely provide essential food resources, such as algae, sponges, and invertebrates, which are critical components of the diets of juvenile green and hawksbill turtles [33,34,35,36]. In contrast, seagrass habitats were occupied less than expected, considering green turtles (Chelonia mydas) being the most documented species in DCNMR [1]. This species has a well-documented preference for seagrass habitats globally [37,38,39]. This low occupancy may reflect human-induced degradation, including nutrient runoff and sedimentation [40,41,42], or diet selectivity, as certain seagrass species may be less nutritionally suitable [43,44,45]. However, interpreting these patterns at a species level is not supported by the data presented, since species-level identification from drone observations was rarely possible due to operational altitude (30–40 m) and other potential confounding effects of turbidity, depth, and glare [46]. Consequently, we emphasize that these patterns reflect the broader sea turtle community, with species-specific traits used only as a framework for understanding potential habitat drivers. Another key limitation to our approach derives from the spectral similarity between seagrass meadows and coral/algae communities in remote sensing products like the Allen Coral Atlas, which may confound shallow-water classification [47]. Water column attenuation makes spectral differentiation difficult for automated products; therefore, rigorous ground-truthing is essential to correct classification errors for site-specific planning.
On a broader scale, the northern region of the DCNMR hosted a significant concentration of individuals and was the only location where turtles were regularly observed in shallow waters. In this northern sector, sea turtle distribution appears to be primarily influenced by the Mwachema River estuary and the unique geomorphic structure of the adjacent reef. A critical driver of the higher observed densities in this region is its tidal accessibility. Unlike other lagoon sections that are only accessible during high tide, the geomorphic configuration of the northern sector allows turtles to forage in shallow areas at any tidal stage. Data from the Allen Coral Atlas corroborates this spatial advantage, showing greater sand accumulation and a significantly widened reef slope compared to the rest of the reserve. Turtles utilized shallow sandy flats, which are likely enriched by estuarine nutrient inputs, which support the growth of seagrass and algae, while maintaining immediate access to the reef slope for structural refuge from wave energy [48].
We acknowledge that although the early morning surveys provided clearer imagery, the limited daily timeframe and six-month duration may not fully reflect sea turtle distribution across all times and seasons. As the primary objective of this research was the spatial characterization of sea turtle distribution relative to benthic habitats—rather than a comprehensive assessment of diurnal behavior—this sampling window was a methodological necessity. Standardizing surveys to early morning high tides mitigated the impact of predictable afternoon sea-breezes and surface glare, which may significantly impair the detectability of sub-surface features in unmanned aerial vehicle (UAV) data. Moreover, it is very possible that the use of waters deeper than 6 m is underestimated, as at these depths, it was not possible to see the entire water column. It is recommended that future monitoring initiatives adopt a more diverse temporal sampling regime across a full annual cycle to account for seasonal variability and diurnal shifts in foraging or resting activity. Such expanded research would further clarify the stability of the identified hotspots and facilitate the transition from habitat characterization toward the study of behavioral ecology.
Overall, these findings emphasize the need for a holistic conservation approach that protects coral/algae habitats and incorporates spatially explicit management strategies that include both reef and non-reef habitats. Importantly, integrating ground-truthing into future monitoring will be critical to validate remote observations, refine habitat-use assessments, and strengthen conservation planning in the DCNMR.
5. Conclusions
This study highlights the power and limitations of non-invasive, drone-based monitoring combined with open access mapping tools, such as the Allen Coral Atlas, for informing a spatially explicit management approach in Kenya’s Diani-Chale National Marine Reserve. The findings demonstrate that sea turtles in the DCNMR primarily utilize the reef slope and shallow coral/algae habitats, with a notable concentration in the northern sector near the Mwachema River estuary. These data can assist in informing targeted conservation efforts, such as designating the northern reef slope as a priority protected zone and implementing seagrass health assessment and monitoring on the intertidal sandy flats most accessible to foraging turtles. By anchoring management to these specific geomorphic and geographical hotspots, the reserve can move toward a more precise and effective conservation framework. Finally, fostering community awareness about the ecological importance of sea turtles and promoting sustainable practices remain crucial for the long-term success of these spatially targeted efforts.
Author Contributions
Conceptualization, J.M.H. and M.D.; Methodology, J.M.H., L.M., J.R.L. and S.K.; Software, J.R.L.; Validation, J.R.L. and S.K.; Formal analysis, B.O. and J.R.L.; Investigation, J.M.H., L.M. and S.K.; Resources, C.M.; Data curation, B.O., L.M. and J.R.L.; Writing—original draft, B.O.; Writing—review & editing, J.M.H., J.R.L., S.K. and C.M.; Supervision, J.M.H., M.D. and C.M.; Project administration, J.M.H. and S.K. All authors have read and agreed to the published version of the manuscript.
Funding
This research received no external funding.
Institutional Review Board Statement
Not applicable.
Informed Consent Statement
Not applicable.
Data Availability Statement
All data collected is available upon request.
Acknowledgments
The lead author dedicates the work to family and friends, whose unwavering support, love, and encouragement have been my constant source of strength and inspiration throughout this journey.
Conflicts of Interest
The authors declare no conflicts of interest.
Abbreviations
The following abbreviations are used in this manuscript:
| DCNMR | Diani-Chale National Marine Reserve |
| ACA | Allen Coral Atlas |
References
- Olive Ridley Project. Annual Review 2024. Olive Ridley Project 2024. Available online: https://oliveridleyproject.org/wp-content/uploads/2025/09/ORP_Annual-Review_2024.pdf (accessed on 1 June 2025).
- Muthiga, N.A. Evaluating the effectiveness of management of the Malindi–Watamu marine protected area complex in Kenya. Ocean Coast. Manag. 2009, 52, 417–423. [Google Scholar] [CrossRef]
- Onditi, K.O.; Li, X.; Song, W.; Li, Q.; Musila, S.; Mathenge, J.; Kioko, E.; Jiang, X. The management effectiveness of protected areas in Kenya. Biodivers. Conserv. 2021, 30, 3813–3836. [Google Scholar] [CrossRef]
- Okemwa, G.M.; Nzuki, S.; Mueni, E.M. The status and conservation of sea turtles in Kenya. Mar. Turt. Newsl. 2004, 105, 1–6. [Google Scholar]
- van de Geer, C.H.; Bourjea, J.; Broderick, A.C.; Dalleau, M.; Fernandes, R.S.; Harris, L.R.; Inteca, G.E.; Kiponda, F.K.; Louro, C.M.M.; Mortimer, J.A.; et al. Marine turtles of the African east coast: Current knowledge and priorities for conservation and research. Endanger. Species Res. 2022, 47, 297–331. [Google Scholar] [CrossRef]
- Chabot, D.; Bird, D.M. Wildlife research and management methods in the 21st century: Where do unmanned aircraft fit in? J. Unmanned Veh. Syst. 2015, 3, 137–155. [Google Scholar] [CrossRef]
- Hodgson, J.C.; Koh, L.P. Best practice for minimizing unmanned aerial vehicle disturbance to wildlife in biological field research. Curr. Biol. 2016, 26, R404–R405. [Google Scholar] [CrossRef]
- Schofield, G.; Nicole, E.; Katselidis, K.A.; Hays, G.C. Drones for research on sea turtles and other marine vertebrates—A review. Biol. Conserv. 2019, 238, 108214. [Google Scholar] [CrossRef]
- Hodgson, J.C.; Rowan, M.; Baylis, S.M.; Pham, T.; Wotherspoon, S.; Kilpatrick, A.D.; Segaran, R.R.; Reid, I.; Terauds, A.; Koh, L.P. Drones count wildlife more accurately and precisely than humans. Methods Ecol. Evol. 2018, 9, 1160–1167. [Google Scholar] [CrossRef]
- Hays, G.C.; Laloë, J.O.; Seminoff, J.A. Status, trends and conservation of global sea turtle populations. Nat. Rev. Biodivers. 2025, 1, 119–133. [Google Scholar] [CrossRef]
- Stokes, H.J.; Mortimer, J.A.; Hays, G.C.; Unsworth, R.K.; Laloë, J.O.; Esteban, N. Green turtle diet is dominated by seagrass in the Western Indian Ocean except amongst gravid females. Mar. Biol. 2019, 166, 135. [Google Scholar] [CrossRef]
- Smulders, F.O.H.; Bakker, E.S.; O’Shea, O.R.; Campbell, J.E.; Rhoades, O.K.; Christianen, M.J.A. Green turtles shape the seascape through grazing patch formation around habitat features: Experimental evidence. Ecology 2023, 104, e3902. [Google Scholar] [CrossRef] [PubMed]
- Arthur, K.E.; Boyle, M.C.; Limpus, C.J. Ontogenetic changes in diet and habitat use in green sea turtle (Chelonia mydas) life history. Mar. Ecol. Prog. Ser. 2008, 362, 303–311. [Google Scholar] [CrossRef]
- Di Beneditto, A.P.M.; Siciliano, S.; Monteiro, L.R. Herbivory level and niche breadth of juvenile green turtles (Chelonia mydas) in a tropical coastal area: Insights from stable isotopes. Mar. Biol. 2017, 164, 13. [Google Scholar] [CrossRef]
- Campos, P.; Cardona, L. Trade-offs between nutritional quality and abundance determine diet selection in juvenile benthic green turtles. J. Exp. Mar. Biol. Ecol. 2020, 527, 151373. [Google Scholar] [CrossRef]
- von Brandis, R.G.; Mortimer, J.A.; Reilly, B.K.; Van Soest, R.W.M.; Branch, G.M. Taxonomic composition of the diet of hawksbill turtles (Eretmochelys imbricata) in the Republic of Seychelles. West. Indian Ocean J. Mar. Sci. 2014, 13, 81–91. [Google Scholar]
- Santos, R.G.; Martins, A.S.; Batista, M.B.; Horta, P.A. Regional and local factors determine green turtle Chelonia mydas foraging relationships with the environment. Mar. Ecol. Prog. Ser. 2015, 529, 265–277. [Google Scholar] [CrossRef]
- Orth, R.J.; Carruthers, T.J.B.; Dennison, W.C.; Duarte, C.M.; Fourqurean, J.W.; Heck, K.L.; Hughes, A.R.; Kendrick, G.A.; Kenworthy, W.J.; Olyarnik, S.; et al. A global crisis for seagrass ecosystems. BioScience 2006, 56, 987–996. [Google Scholar] [CrossRef]
- Waycott, M.; Duarte, C.M.; Carruthers, T.J.B.; Orth, R.J.; Dennison, W.C.; Olyarnik, S.; Calladine, A.; Fourqurean, J.W.; Heck, K.L.; Hughes, A.R.; et al. Accelerating loss of seagrasses across the globe threatens coastal ecosystems. Proc. Natl. Acad. Sci. USA 2009, 106, 12377–12381. [Google Scholar] [CrossRef] [PubMed]
- Hodgson, G. A global assessment of human effects on coral reefs. Mar. Pollut. Bull. 1999, 38, 345–355. [Google Scholar] [CrossRef]
- Kleypas, J.A.; Buddemeier, R.W.; Gattuso, J.P. The future of coral reefs in an age of global change. Int. J. Earth Sci. 2001, 90, 426–437. [Google Scholar] [CrossRef]
- Fuentes, M.M.P.B.; McMichael, E.; Kot, C.Y.; Silver-Gorges, I.; Wallace, B.P.; Godley, B.J.; Brooks, A.M.L.; Ceriani, S.A.; Cortés -Gómez, A.A.; Dawson, T.M.; et al. Key issues in assessing threats to sea turtles: Knowledge gaps and future directions. Endanger. Species Res. 2023, 52, 303–341. [Google Scholar] [CrossRef]
- Karisa, J.F.; Obura, D.O.; Chen, C.A. Spatial heterogeneity of coral reef benthic communities in Kenya. PLoS ONE 2020, 15, e0237397. [Google Scholar] [CrossRef]
- Obura, D.O. An Indian Ocean centre of origin revisited: Palaeogene and Neogene influences defining a biogeographic realm. J. Biogeogr. 2016, 43, 229–242. [Google Scholar] [CrossRef]
- Aboud, S.A.; Kannah, J.F. Abundance, distribution and diversity of seagrass species in lagoonal reefs on the Kenyan coast. Am. Acad. Sci. Res. J. Eng. Technol. Sci. 2017, 37, 52–67. [Google Scholar]
- McClanahan, T.R. Seasonality in East Africa’s coastal waters. Mar. Ecol. Prog. Ser. 1988, 44, 191–199. [Google Scholar] [CrossRef]
- Bevan, E.; Kelaher, B.P.; Johnson, M.L.; Hughes, M.J. Measuring behavioral responses of sea turtles, saltwater crocodiles, and crested terns to drone disturbance to define ethical operating thresholds. PLoS ONE 2018, 13, e0194460. [Google Scholar] [CrossRef] [PubMed]
- Robinson, N.J.; Bigelow, W.F.; Cuffley, J.; Gary, M.; Hoefer, S.; Mills, S.; Smith, A.; Miguel Blanco, A. Validating the use of drones for monitoring the abundance and behaviour of juvenile green sea turtles in mangrove creeks in The Bahamas. Testudo 2020, 9, 24–35. [Google Scholar]
- Allen Coral Atlas Partnership. Imagery, maps and monitoring of the world’s tropical coral reefs. Zenodo 2022. [Google Scholar] [CrossRef]
- Robinson, N.J.; Aguzzi, J.; Arias, S.; Gatto, C.; Mills, S.K.; Monte, A.; Andrews, L.S.; Yaney-Keller, A.; Tomillo, P.S. Global trends in sea turtle research and conservation: Using symposium abstracts to assess past biases and future opportunities. Glob. Ecol. Conserv. 2023, 47, e02587. [Google Scholar] [CrossRef]
- Pasanisi, E.; Pace, D.S.; Orasi, A.; Vitale, M.; Arcangeli, A. A global systematic review of species distribution modelling approaches for cetaceans and sea turtles. Ecol. Inform. 2024, 82, 102700. [Google Scholar] [CrossRef]
- Heudier, M.; Mouillot, D.; Mannocci, L. Assessing the effects of coral reef habitat and marine protected areas on threatened megafauna using aerial surveys. Aquat. Conserv. 2023, 33, 286–297. [Google Scholar] [CrossRef]
- Goatley, C.H.; Hoey, A.S.; Bellwood, D.R. The role of turtles as coral reef macroherbivores. PLoS ONE 2012, 7, e39979. [Google Scholar] [CrossRef]
- Cardona, L.; Campos, P.; Velásquez-Vacca, A. Contribution of green turtles Chelonia mydas to total herbivore biomass in shallow tropical reefs of oceanic islands. PLoS ONE 2020, 15, e0228548. [Google Scholar] [CrossRef] [PubMed]
- Clyde-Brockway, C.E.; Heidemeyer, M.; Paladino, F.V.; Flaherty, E.A. Diet and foraging niche flexibility in green and hawksbill turtles. Mar. Biol. 2022, 169, 108. [Google Scholar] [CrossRef]
- Bjorndal, K.A. Nutrition and grazing behavior of the green turtle Chelonia mydas. Mar. Biol. 1980, 56, 147–154. [Google Scholar] [CrossRef]
- Taquet, C.; Taquet, M.; Dempster, T.; Soria, M.; Ciccione, S.; Roos, D.; Dagorn, L. Foraging of the green sea turtle Chelonia mydas on seagrass beds at Mayotte Island determined by acoustic transmitters. Mar. Ecol. Prog. Ser. 2006, 306, 295–302. [Google Scholar] [CrossRef]
- de Kock, W.; Mackie, M.; Ramsøe, M.; Allentoft, M.E.; Broderick, A.C.; Haywood, J.C.; Godley, B.J.; Snape, R.T.E.; Bradshaw, P.J.; Genz, H.; et al. North African seagrass meadows have supported green turtle populations for millennia. Proc. Natl. Acad. Sci. USA 2023, 120, e2220747120. [Google Scholar] [CrossRef]
- Livingston, R.J.; McGlynn, S.E.; Niu, X. Factors controlling seagrass growth in a gulf coastal system: Water and sediment quality and light. Aquat. Bot. 1998, 60, 135–159. [Google Scholar] [CrossRef]
- Suykerbuyk, W.; Bouma, T.J.; Govers, L.L.; Giesen, K.; de Jong, D.J.; Herman, P.; Hendriks, J.; van Katwijk, M.M. Surviving in changing seascapes: Sediment dynamics as bottleneck for long-term seagrass presence. Ecosystems 2016, 19, 296–310. [Google Scholar] [CrossRef]
- Oduor, N.A.; Munga, C.N.; Imbayi, L.K.; Botwe, P.K.; Nyanjong, E.O.; Muthama, C.M.; Mise, N.A.; Moosdorf, N. Anthropogenic nutrients and phytoplankton diversity in Kenya’s coastal waters. Mar. Pollut. Bull. 2024, 199, 115897. [Google Scholar] [CrossRef]
- Ballorain, K.; Ciccione, S.; Bourjea, J.; Grizel, H.; Enstipp, M.; Georges, J.-Y. Habitat use of a multispecific seagrass meadow by green turtles at Mayotte Island. Mar. Biol. 2010, 157, 2581–2590. [Google Scholar] [CrossRef]
- Burkholder, D.A.; Heithaus, M.R.; Thomson, J.A.; Fourqurean, J.W. Diversity in trophic interactions of green sea turtles on a relatively pristine foraging ground. Mar. Ecol. Prog. Ser. 2011, 439, 277–293. [Google Scholar] [CrossRef]
- Whitman, E.R.; Heithaus, M.R.; Barcia, L.G.; Brito, D.N.; Rinaldi, C.; Kiszka, J.J. Effect of seagrass nutrient content and relative abundance on the foraging behavior of green turtles. Mar. Ecol. Prog. Ser. 2019, 628, 171–182. [Google Scholar] [CrossRef]
- Stokes, H.J.; Mortimer, J.A.; Laloë, J.O.; Hays, G.C.; Esteban, N. Synergistic use of UAV surveys, satellite tracking data, and mark-recapture to estimate abundance of elusive species. Ecosphere 2023, 14, e4444. [Google Scholar] [CrossRef]
- Mumby, P.J.; Green, E.P.; Clark, C.D.; Edwards, A.J. Coral reef habitat mapping: How much detail can remote sensing provide? Mar. Biol. 1997, 130, 193–202. [Google Scholar] [CrossRef]
- Li, J.; Knapp, D.E.; Schill, S.R.; Roelfsema, C.; Phinn, S.; Silman, M.; Mascaro, J.; Asner, G.P. Adaptive bathymetry estimation for shallow coastal waters using Planet Dove satellites. Remote Sens. Environ. 2019, 232, 111302. [Google Scholar] [CrossRef]
- Kennedy, E.V.; Roelfsema, C.M.; Lyons, M.B.; Kovacs, E.M.; Borrego-Acevedo, R.; Roe, M.; Phinn, S.R.; Larsen, K.; Murray, N.J.; Yuwono, D.; et al. Reef Cover: A coral reef classification for global habitat mapping from remote sensing. Sci. Data 2021, 8, 196. [Google Scholar] [CrossRef]


Disclaimer/Publisher’s Note: The statements, opinions and data contained in all publications are solely those of the individual author(s) and contributor(s) and not of MDPI and/or the editor(s). MDPI and/or the editor(s) disclaim responsibility for any injury to people or property resulting from any ideas, methods, instructions or products referred to in the content. |
© 2026 by the authors. Licensee MDPI, Basel, Switzerland. This article is an open access article distributed under the terms and conditions of the Creative Commons Attribution (CC BY) license.