Abstract
Knowledge of weed community structure in agricultural systems is important for sustainable management, especially for evaluating the effects of different herbicides on soybean–corn succession crops. This study evaluated, over two crop seasons, weed community structure in response to chemical weed management strategies for soybean–corn succession in Brazil’s Triângulo Mineiro region. Phytosociological surveys of the weed community were conducted during harvest periods throughout the experimental phase, with referenced data for generating spatial distribution maps of biomass and density of the main present species. The survey identified 33 weed species, predominantly from the Poaceae and Asteraceae families. Regardless of the management system, the total weed biomass was lower in corn crops compared to soybean crops. In management systems using six different herbicides, the IVI of Commelina benghalensis was the lowest due to greater diversification of herbicide mechanisms of action. The results demonstrate that chemical weed management strategies strongly influence weed community structure, with significant effects on weed community structure and evenness in intensive agricultural regions. These changes also have implications for resistance management.
1. Introduction
The cultivation of soybean (Glycine max L. Merril) and corn (Zea mays) plays a major socioeconomic role in Brazilian agriculture, as these commodities contribute substantially to the trade balance and to strengthening the national economy [1]. The sustainability of these production systems, however, relies on the effective management of both biotic and abiotic factors that influence crop yield [2]. Among the biotic factors, weeds are particularly important, not only because they compete with crops for water, light, and nutrients, but also because they fulfill relevant ecological functions, such as interacting with soil microbiota, serving as hosts for pests and diseases, and influencing local biodiversity [3,4].
Weed interference with crops is a dynamic and complex process shaped by factors such as species composition, density, and the spatial distribution of the weed community; crop spacing and cultivar; adopted cultural practices; the period of coexistence of crop and weeds; and the edaphoclimatic conditions of the production region [5]. Moreover, the intrinsic traits of weed species, including adaptability, proliferation, dormancy, and seed longevity, affect their persistence and response to various types of disturbance, including management interventions [6].
The spatial distribution of weed populations in the field is typically heterogeneous, often characterized by patches and density gradients [7,8]. These patterns result from ecological processes such as seed dispersal, differential germination, interspecific interactions, and responses to selective pressures imposed by the environment and management practices [9]. Understanding the spatial ecology of weed communities is therefore essential for predicting shifts in species composition and dominance over time.
Within any weed community, the relative importance of each species varies according to intra- and interspecific interactions, as well as environmental conditions [1]. Phytosociological surveys, through the quantification of parameters such as frequency, density, abundance, and Importance Value Index, provide a basis for assessing how management practices and environmental factors shape community structure and diversity [10]. Such analyses yield insights into the processes of succession and adaptation, while also identifying trends in weed flora shifts.
Consequently, phytosociological studies not only support the selection of management strategies but also advance our understanding of weed ecology in agricultural systems, enabling long-term assessments of resilience, diversity, and community structure. However, long-term phytosociological studies that quantitatively assess the impact of progressively increasing the number of herbicide mechanisms of action (MOAs) on weed community structure, biodiversity, and resistance selection pressure in tropical soybean–corn succession systems remain scarce.
In this context, soybean–corn succession in the Triângulo Mineiro region represents an intensive agricultural system where weed management is strongly dependent on herbicides. Although phytosociological studies have advanced understanding of weed ecology, few studies have evaluated how the diversification of herbicide mechanisms of action (MOAs) influences community dynamics and biodiversity under tropical conditions. Most studies emphasize short-term control efficacy but do not address long-term shifts in species composition and dominance. We hypothesize that increasing the diversity of herbicide MOAs modifies weed community structure by maintaining higher community evenness and preventing the dominance of resistant or highly competitive species, thereby reducing management-driven community simplification and delaying resistance selection. Therefore, the aim of this study was to evaluate the community structure and phytosociological composition of weeds over two consecutive soybean–corn growing seasons, testing how management programs with different numbers of herbicide MOAs influence weed communities in the Triângulo Mineiro region, Brazil.
2. Materials and Methods
2.1. Study Site and Experimental Design
This study was conducted during the 2019/2020 and 2020/2021 growing seasons at Fazenda Bom Jardim, Uberlândia, Minas Gerais, Brazil (19°02′28.62″ S; 48°18′00″ W). The region has a tropical savanna climate (Aw, Köppen classification), with well-defined wet and dry seasons. Meteorological data (rainfall, as well as maximum and minimum temperatures) during the experimental period are presented in Figure 1.
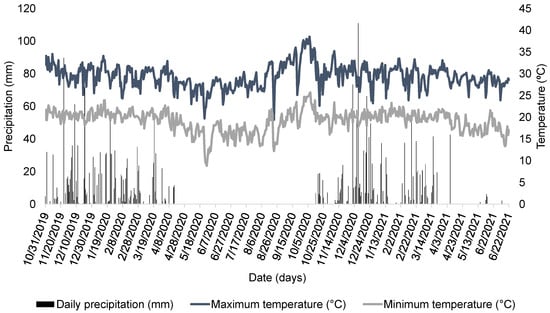
Figure 1.
Daily total precipitation (mm), as well as maximum and minimum temperatures (°C), during the period of the experiment at Bom Jardim farm, in Uberlândia, MG, Brazil [11].
A representative composite soil sample from the experimental area (0–20 cm depth) was analyzed prior to beginning the study. The soil was slightly acidic (pH in H2O = 6.23 ± 0.21; pH in CaCl2 = 5.72 ± 0.23), with medium levels of organic matter (2.1 ± 0.3%) and moderate cation exchange capacity (CTC at pH 7.0 = 5.6 ± 0.65 cmolc dm−3). Exchangeable bases consisted of calcium (3.1 ± 0.55 cmolc dm−3), magnesium (0.9 ± 0.22 cmolc dm−3), and potassium (0.15 ± 0.05 cmolc dm−3), resulting in a base saturation of 71 ± 6%. Available phosphorus extracted by resin showed high spatial variability, ranging from 16 to 126 mg dm−3, with a mean of approximately 56 mg dm−3. Exchangeable aluminum was absent from all samples. Sulfur levels varied between 2.6 and 7.8 mg dm−3.
Soil texture ranged from sandy-loam to clay-loam, with sand content between 55% and 80%, clay between 17% and 38%, and silt between 3% and 8%, indicating predominantly well-drained soil typical of Cerrado agricultural systems. Overall, the soil fertility conditions represent those commonly found in intensively managed soybean–corn succession areas in the Triângulo Mineiro region.
It is important to clarify that only one composite soil sample (0–20 cm) was collected to characterize the experimental area. This approach is commonly used in phytosociological and weed community surveys to provide baseline soil information for the field but does not allow plot-level soil–weed association analysis. Therefore, soil data in this study serve as an environmental descriptor of the site rather than as independent variables for statistical correlation with weed composition.
The experimental design consisted of soybean (Glycine max L. Merrill) followed by corn (Zea mays L.) in succession, under four chemical management systems differing in the number of herbicide mechanisms of action (MOAs): two, four, five, or six MOAs. Treatments were arranged in a strip design measuring 36 × 100 m, totaling an experimental area of 14,400 m2. Each strip was delimited by 3 m buffer zones to prevent contamination among management systems. Within each plot, phytosociological surveys were conducted using the quadrat method, with 36 quadrat placements per plot. The experiment was conducted in large operational strips (36 × 100 m), each management system was applied to a single continuous area, and the 36 quadrats within each strip represent subsamples rather than independent replicates. Therefore, the study presents a pseudoreplication structure, in which treatment effects cannot be inferred through traditional factorial designs. This limitation is inherent to on-farm strip experiments aimed at assessing weed community responses. To address this constraint, we interpreted quadrat-level measurements as spatial subsamples within each management system and used complementary multivariate analyses that are appropriate for community-level datasets under pseudoreplication.
2.2. Crop Management and Herbicide Treatments
Soybean cultivar Desafio was sown on 31 October 2019 and 29 October 2020 at a density of approximately 360,000 plants ha−1. Corn cultivars CRV 2738 VIP3 (2020) and KWS 8774 PRO2 (2021) were used, with a target density of 60,000 plants ha−1. Different cultivars were adopted due to local recommendations and commercial availability at the time of sowing. Row spacing was 0.5 m for both crops. Different corn cultivars were used in each growing season due to commercial availability and technical recommendations for the region at the time of sowing. Both cultivars are widely used in the Triângulo Mineiro region. The two cultivars selected for this study exhibit similar phenological durations and regional yield potential, which aligns with local technical recommendations for soybean–corn succession in the region, ensuring consistency in crop management practices and allowing reliable comparison of weed community responses across years.
The four management systems for soybean and corn crops using herbicides with different mechanisms of action and combinations were applied in each season. The systems were as follows: two mechanisms of action—inhibitor of the enzyme enol-piruvil-chiquiimato-phosphate sintetase (EPSPs) + photosystem II inhibitor (FSII); four mechanisms of action—enzyme inhibitor EPSPs + enzyme inhibitor acetyl CoA carboxylase (ACCase) + FSII + carotenoid synthesis inhibitor; five mechanisms of action—inhibitor of the enzyme epsps + inhibitor of the enzyme ACCase + mimetizador of auxin + FSII + carotenoid synthesis inhibitor; and six mechanisms of action—enzyme inhibitor EPSPs + inhibitor of the enzyme ACCase + acetolactate synthase inhibitor (ALS) + photosynthesis inhibitor in photosystem I (FSI) + FSII + carotenoid synthesis inhibitor. The herbicides were applied both pre- and post-emergence of weeds, in different doses, as described in Table 1 and Table 2 for the 2019/2020 and 2020/2021 agricultural years, respectively.

Table 1.
Management systems with the application of different herbicides in a soybean–corn succession crop system. Agricultural year: 2019/2020, Uberlândia–MG.
Table 2.
Management systems with the application of different herbicides in the soybean/corn cropping system. Crop year: 2020/2021, Uberlândia–MG.
The herbicides and combinations adopted in this study were selected based on their widespread use in soybean–corn production systems in the Triângulo Mineiro region. These programs represent the most common management strategies used by farmers, from glyphosate-based systems with only two MOAs to diversified programs including up to six MOAs. The increasing diversity of MOAs was designed to represent a gradient of chemical control intensity, allowing evaluation of how broadening the spectrum of herbicide mechanisms affects weed community composition and dynamics. The chosen herbicides also ensured crop safety and reflected technical recommendations for soybean and corn production in the region.
For soybeans, desiccation was performed 12 days before sowing, application pre-emergence of weeds was performed 1 day after sowing, and application post-emergence of weeds was performed 10 and 20 days after sowing. For corn, desiccation was performed 1 day before sowing, and application post-emergence of weeds was performed 18 days after sowing. The sprays were performed using a self-propelled sprayer at a volume of 150 L ha−1. Flat jet spray nozzles in fan format, with air induction, spaced 50 cm apart, were used.
2.3. Weed Community Survey
A phytosociological survey of the weed community was carried out for all crop. Weed species were identified, quantified, and collected using the inventory square method, with 0.25 m2 cast 36 times in each system, with spacing between points of 12 m in the experimental area. The weed species identified were collected by cutting them close to the ground, packed in paper bags, and oven-dried for 72 h at 65 °C. Next, the dry biomass was determined for each weed species collected. The phytosociological parameters were calculated according to the method of Mueller-Dombois and Ellenberg [12]. For each weed species i recorded across n quadrats (j = 1, …, n), the following metrics were obtained:
Frequency
(Unit: proportion of quadrats.)
Density
where A is the total sampled area (m2).
(Unit: individuals m−2.)
Dominance
(Unit: g m−2.)
Relative frequency
Relative density
Relative dominance
Importance Value Index (IVI)
The IVI ranges from 0 to 300, with higher values indicating greater ecological importance of a species within the community. A similarity dendrogram based on the level of infestation in the five systems at the end of the experiment was constructed using the group average clustering method (UPGMA) with the statistical software program R (version 4.2.2) [13].
The data collected were subjected to phytosociological analysis, and the IVI data for each species within each management system were quantified. The IVIs of the main species were graphed using Microsoft Excel 2016. The floristic similarity indices between the collection periods were calculated using Sorensen’s similarity index (SI) [14] based on the equation
where
a = number of species in common between areas;
b = total number of species area 1;
c = total number of species area 2.
The SI varies through the percentage scale, with 0 corresponding to having no species in common and 100% corresponding to all species being common to both areas.
2.4. Geostatistical Analysis
Given its high relative importance and persistence, Commelina benghalensis was selected for geostatistical analysis. Commelina benghalensis was selected for geostatistical mapping due to its consistently high dominance and Importance Value Index (IVI) across multiple sampling events, rather than for representing the entire weed community. The dry biomass (BS) and total plant density (Dens) data for Commelina benghalensis (L.) were analyzed at the end of the experiment by geostatistical methods, and the maps were generated using the ordinary Kriging method with QGis software version 3.22 and the Smart-Map: Decision support system for precision agriculture. The data were interpolated on a 10 × 10 m grid.
2.5. Statistical Analysis
Weed dry biomass data were subjected to analysis of variance (ANOVA) and, when significant, means were compared using Tukey’s test at the 5% probability level. Non-significant results are indicated as “ns” in Table 3. For weed density and species richness, only descriptive values are presented. Phytosociological parameters (frequency, density, dominance, and Importance Value Index—IVI) were calculated according to the method described by Mueller-Dombois and Ellenberg [12]. Floristic similarity was assessed using Sorensen’s similarity index [14]. The spatial distribution of C. benghalensis was evaluated by the ordinary Kriging method using QGIS 3.22. Multivariate analyses were conducted to describe patterns in weed community composition across herbicide management systems. Species abundance data were assembled into a community matrix and transformed using the Hellinger method to reduce the influence of zero inflation. Community structure was examined using Detrended Correspondence Analysis (DCA) based on Bray–Curtis dissimilarity, which allowed visualization of gradients in species composition and the association of quadrats with dominant species. Because the experiment followed an operational strip-field layout with subsampling and no true replication, ordination results were interpreted descriptively and not as inferential tests of treatment effects. All multivariate procedures were performed in R using the vegan package.
Table 3.
Total weed density (Dens), weed dry biomass (BS), and total number of weed species in the four harvests in each management system. MOAs = herbicide action; management system = soybean production system/corn second crop with different mechanisms of herbicide action.
3. Results and Discussion
3.1. Weed Diversity and Floristic Composition
The phytosociological survey identified 33 weed species infesting the soybean and corn crops during the experimental period. Dicots represented approximately 70% of the total, while monocots accounted for 30%. The species were distributed across 12 families, with Poaceae and Asteraceae being the most prevalent, with each contributing 28% of the total flora (Figure 2 and Table 4). This predominance may be attributed to the wide adaptability and prolific seed production of grasses and composites, which favor their persistence and dissemination under intensive cropping systems.
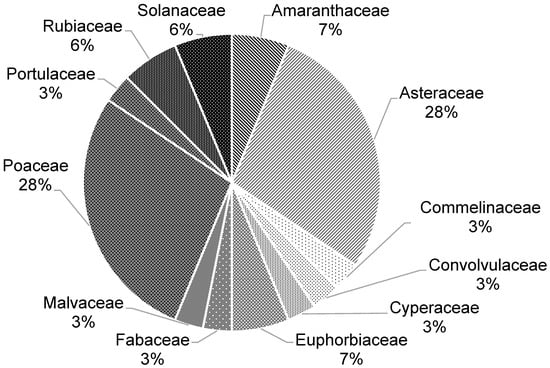
Figure 2.
Botanical families of weeds found in the 2019/2020 and 2020/2021 soybean and corn crops throughout the experimental area (Uberlândia, MG, Brazil).
Table 4.
Weed families present in the Uberlândia–MG region.
The high prevalence of the two families, Poaceae and Asteraceae, may have occurred due to the high number of species identified and the large amount of diaspores produced that facilitate dissemination of the species even in unfavorable conditions [15].
A similar predominance of Poaceae was reported in soybean crops in Chapadão do Sul, MS, where 38% of the species belonged to this family [16]. In southwestern Goiás, Santos et al. [17] also observed a high contribution of Poaceae and Asteraceae in transgenic soybean areas, reinforcing that these families dominate weed communities in the Cerrado region.
3.2. Effects of Management Systems on Weed Density and Biomass
Weed density, dry biomass, and the total number of species varied markedly among management systems and crops (Table 4). At the beginning of the experiment, in the 2019/2020 soybean crop, weed pressure was highest across all systems, reflecting the historical seed bank and high infestation level of the experimental area. In this season, densities exceeded 60 plants/m2, and dry biomass surpassed 260 g/m2 in some systems.
The data in Table 4 show that the sampled quadrats in the six-MOA system had the lowest cumulative weed density and biomass, suggesting an association between greater MOA diversity and lower infestation levels. In contrast, the two-MOA program accumulated the highest biomass (291 g m−2 across seasons), indicating that simplified glyphosate-based systems showed higher weed biomass in the sampled quadrats. Interestingly, the five-MOA program did not show the same level of reduction as the six-MOA system, sustaining relatively high cumulative biomass (111 g m−2). This pattern suggests that greater herbicide diversity was associated with lower IVI of some broadleaf weeds, whereas tolerant grasses such as Digitaria insularis and Eleusine indica remained prominent in the sampled quadrats. Lower density and biomass values were observed in corn crops compared with soybean crops, regardless of the management system. This pattern is largely explained by climatic conditions in which the corn season coincided with lower rainfall, which limited weed emergence and growth. Thus, the observed decline is more related to reduced germination opportunities than to crop competitiveness itself.
Cumulative values across the four harvests also highlight differences among management programs. The six-MOA system showed the lowest weed pressure among the sampled quadrats (43 plants/m2 and 28.68 g m−2), followed by the four-MOA system (53 plants/m2 and 73.94 g m−2). In contrast, the two-MOA and five-MOA systems maintained the highest cumulative densities and biomass (65–74 plants/m2 and 110–291 g m−2). Similarly, median biomass per season decreased from 12.95 g m−2 in the two-MOA system to only 1.48 g m−2 in the six-MOA system, indicating that more diversified programs tended to show lower biomass values in the sampled quadrats.
From the first soybean crop (2019/2020 season) to the last corn crop (2021), weed density declined by approximately 99% in all systems, with the most pronounced reduction in the six-MOA program (from 25.8 to 0.22 plants/m2; −99.1%). These results indicate that, although succession itself reduced infestation levels over time, the decline in infestation was more pronounced in systems with greater MOA diversity, suggesting a pattern of reduced weed pressure over time.
3.3. Dominant Species and Importance Value Index (IVI)
The IVI of the weed species varied with the management systems adopted. In the weed management system using two herbicide mechanisms of action (MOAs) (Figure 3), bitter grass was the species with the highest IVI in the 2019/2020 soybean growing season (31%). In the following two crops, corn (2020) and soybean (2020/2021 season), C. benghalensis exhibited higher IVIs: 43% in the corn crop and 45% in the soybean crop. In the corn crop in 2021, goose grass presented a 72% IVI.
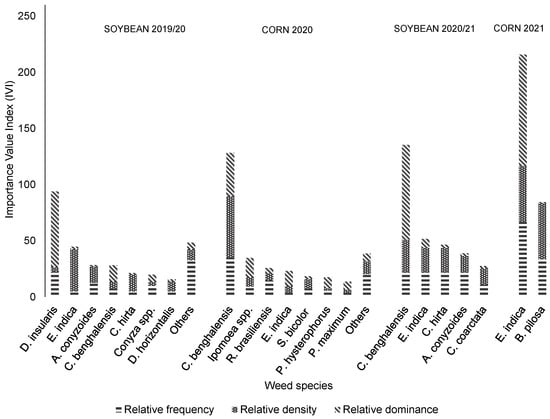
Figure 3.
Value indices of weeds in systems treated with two herbicide mechanisms of action, including application of glyphosate only in soybean and glyphosate + atrazine crops in corn crops (Uberlândia, MG, Brazil).
In the 2019/2020 season soybean crop, the non-described species together accounted for 16% of the total IVI: Amaranthus spp., Setaria parviflora (Poir.) Kerguélen, Alternanthera tenella Colla, Solanum americanum Mill., Gamochaeta coarctata (Willd.) Kerguélen, and Nicandra physalodes (L.) Pers. In the second crop (2020 corn), the other species (13% of the IVI of all weed species evaluated) were as follows (presented in descending order of IVI): Portulaca oleracea L., Cenchrus echinatus (L.) Pers., Echinochloa spp., Digitaria horizontalis Willd., Chamaesyce spp., and Sida spp.
In the management system with four herbicide MOAs (Figure 4), the differences in IVI values among species became more pronounced across seasons. In the first three harvests, C. benghalensis exhibited higher IVIs of 20, 46, and 86% in the 2019/2020, 2020, and 2020 soybean crops, respectively. In the last corn crop (2021), mattress grass was the most important species (84% IVI). Still, in the 2019/2020 soybean growing season, similar to the management system with two herbicide MOAs, bitter grass had a high IVI (18%). However, compared with the management system with two herbicide MOAs (Figure 3), Dens and BS were lower in all crops, indicating lower infestation levels in the sampled quadrats (Table 4).
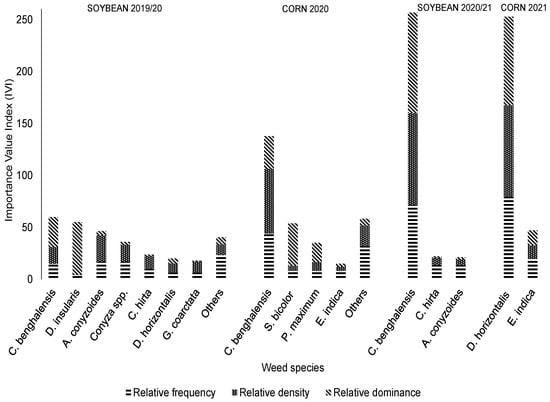
Figure 4.
Value indices of weeds in systems treated with four herbicide mechanisms of action, including application of the herbicides glyphosate + phenoxaprop-P-Ethyl + clethodim in soybean and glyphosate + atrazine + tembotrione in corn crops (Uberlândia, MG, Brazil).
In the soybean crop from the 2019/2020 season, the other non-described species accounted for 14% of the total IVI, including (in descending order of IVI): Eleusine indica (L.) Gaertn), S. parviflora, Cyperus spp., Ipomoea spp., Tridax procumbens L., S. americanum, Amaranthus spp., and A. tenella. In the second harvest (corn 2020), other species represented 19% of the total IVI and, in descending order of IVI, are Ipomoea spp., Parthenium hysterophorus, Richardia brasiliensis Gomes, D. horizontalis, Amaranthus spp., Chamaesyce spp., Euphorbia heterophylla, P. oleracea, and Conyza spp.
In the management system with five herbicide MOAs, the discrepancy between the IVIs in corn crops was higher (Figure 5). In the 2019/2020 soybean crop, two grasses, D. insularis and E. indica, had the highest IVIs of 21% and 17%, respectively. In the same harvest, the species not presented correspond to 12% of the IVI, including (in descending order of IVI) Ipomoea spp., C. echinatus, B. pilosa, Senna spp., Digitaria insularis (L.) Fedde, Conyza spp., S. americanum, and A. tenella. On the other hand, in the following crop, the species with the highest IVIs were C. benghalensis (IVI of 60%) and P. maximum (IVI of 13%). In the 2020/2021 soybean crop, unlike the previous year, two broadleaf species had the highest IVIs, namely Ageratum conyzoides L. and Ipomoea spp., at 30% each. The other species corresponded to 40% of the total IVI for the management system. In the following crop (2021), crowfoot grass was the most representative species, with an IVI of 44%.
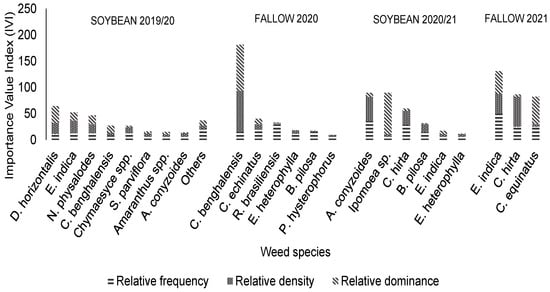
Figure 5.
Value indices of weeds in systems treated with five herbicide mechanisms of action, including application of glyphosate + 2,4-D + clethodim in soybean crops and glyphosate + 2,4-D in corn (Uberlândia, MG, Brazil).
At the study site, the species with the highest values of DO were the Digitaria genus, C. benghalensis, and E. indica. C. benghalensis is a weed that reproduces via underground seeds that hinder control, is widespread in Brazil, and can cause economic damage to agricultural crops such as soybeans and corn [18]. However, the initial presence of species from the Digitaria genus in the experimental area comes from the rich seed bank at the site, since the species presents staggered germination, which can cause late emergence [18]. This behavior of the species can be observed by comparing phytosociological analyses during growing seasons with adequate management that, as a consequence, reduces the seed bank, decreasing the IVI [19].
By analyzing the phytosociology data from the 2020 corn harvest, it was possible to observe control of Digitaria species (Figure 3 and Figure 4). Still, in the last phytosociological evaluation carried out during the harvest of the second corn crop in 2021, an increase in the IVI of chicken grass due to the high seed bank was observed. This information about the most important weed species in the soybean/corn second crop production system in Minas Gerais, in different control programs, helps illustrate how the relative importance of these species shifted over time.
In order of importance, the main species found at the end of the experiment were mattress grass and chicken grass. This result is different from that of another survey conducted in Uberlândia, Minas Gerais, Cerrado area, in which the main species present in the area were Cyperus spp., Amaranthus spp., Cynodon dactylon (L.) Pers, E. heterophylla, and C. benghalensis [20]. Results similar to those from our survey were found in a study conducted in a transgenic soybean crop in the city of Jaboticabal, with different levels of infestation, in which the most prominent species were A. tenella, D. horizontalis, and E. indica [21]. In a soybean/corn + brachiaria production system in Dourados (MS), the main species were Amaranthus hybridus L., R. brasiliensis, Raphanus raphanistrum L., and Lipidium virginicum Linnaeus [22].
When analyzing the Dens values of the weed community among the systems for the four harvests, the management system with five herbicide MOAs presented the maximum value of 637 thousand plants per ha in the 2019/20 soybean crop, at the beginning of the experiment.
Although the greatest diversity of the species found was for dicotyledonous, the most prominent IVI values were for monocots. C. benghalensis had great relative importance in this study, but the IVI value decreased over time as other species were increasing dominance in the area, such as D. insularis, D. horizontalis, and E. indica.
In the weed management system with six herbicide MOAs (Figure 6), as well as in the management system with four herbicide MOAs, IVI values increased throughout the harvests, with emphasis on C. benghalensis in the 2020 corn crop and large crabgrass in the 2021 corn crop. In the 2019/2020 soybean crop, the other species present, not described, were Cenchrus echinatus (L.) Pers. (4% IVI), T. procumbens L. (3% IVI), G. coarctata (2% IVI), Ipomoea spp. (2% IVI), C. benghalensis (2% IVI), Amaranthus spp. (1% IVI), and N. physalodes (2% IVI). In contrast to the 2019/2020 soybean crop, in the last soybean crop (2020/2021 season), the E. indica was the most important species (36% of IVI).
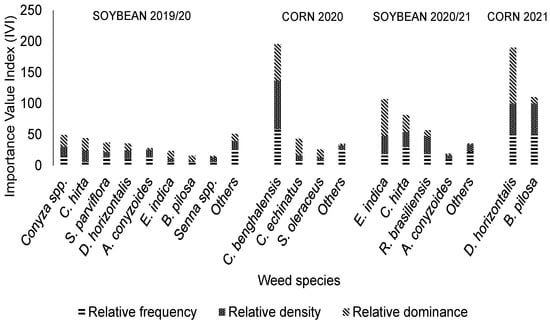
Figure 6.
Value indices of weeds in systems treated with six herbicide mechanisms of action, including application of the herbicides glyphosate + phenoxaprop-P-Ethyl + clethodim + diquat + metribuzin + chlorimuron-ethyl in soybean crops and glyphosate + atrazine + tembotrione in corn crops (Uberlândia, MG, Brazil).
Analysis of IVI across the four management systems revealed consistent shifts in weed dominance patterns. In programs with a lower number of MOAs (two and four), C. benghalensis maintained high relative importance throughout multiple cropping seasons, demonstrating its capacity to persist under simplified glyphosate-based management strategies. Conversely, in systems with greater MOA numbers (five and six), the relative importance of C. benghalensis declined, while competitive grasses such as Digitaria spp. and E. indica became increasingly dominant. This shift indicates that the adoption of more diversified herbicide programs can reduce the prevalence of a single tolerant species but simultaneously create ecological opportunities for other highly competitive weeds to expand.
Given the recurrent prominence of C. benghalensis in less diversified systems and its recognized biological attributes that favor survival under chemical control, this species was selected for geostatistical mapping to illustrate spatial distribution patterns across management systems.
3.4. Floristic Similarity and Community Composition
DCA ordination (Figure 7) revealed clear gradients in weed community structure across herbicide management systems. Quadrats from different systems showed partial overlap, but consistent directional patterns were evident along the first axis, with Commelina benghalensis and Ipomoea spp. positioned toward the positive side of DCA1, where several quadrats from the four-MOA and six-MOA systems were located. In contrast, Chamaesyce hirta, Ageratum conyzoides, and Digitaria horizontalis were associated with the negative side of DCA1, which included many quadrats from the five-MOA system. Along DCA2, Digitaria insularis occupied the upper portion of the ordination, reflecting quadrats where this species was more frequent, whereas Amaranthus spp. appeared in the lower portion of the axis. These patterns indicate that the weed community exhibited structured variation among systems, driven primarily by shifts in the relative abundance of a small set of dominant species within the sampled area.
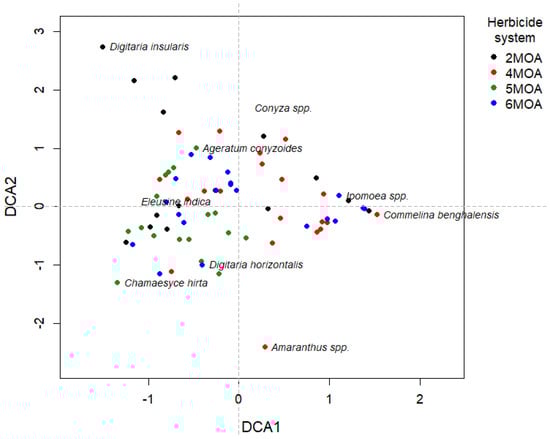
Figure 7.
Detrended correspondence analysis (DCA) ordination showing weed community structure across herbicide management systems in soybean–corn succession planting. Each point represents a sampled quadrat, colored according to the herbicide management system (two MOAs = black, four MOAs = red, five MOAs = green, and six MOAs = blue). Species names are positioned according to their DCA scores, illustrating their relative association with community composition gradients. Dashed lines indicate the origin of the first two ordination axes.
Although soil properties are recognized as important drivers of weed community structure, the present study was not designed to detect soil–weed statistical associations. Because only one composite soil sample was collected to characterize the site, soil attributes could not be used as independent variables in multivariate analyses such as PCA or CCA. Consequently, the ordination patterns observed in this study should be interpreted primarily as responses to management history and herbicide use, rather than as effects of spatial variation in soil fertility or texture. Future studies should incorporate spatially replicated soil sampling to allow robust testing of soil and weed relationships.
To define the level of similarity between two or more communities, the IS was calculated, and there was a change between the different management systems adopted in the two soybean crops over time (Table 5 and Table 6).
Table 5.
Phytosociological similarity indices (SIs) of the systems at the beginning of the experiment (Uberlândia, MG, Brazil).
Table 6.
Phytosociological similarity indices (SIs) of the systems in soybeans at the end of the experiment (Uberlândia, MG, Brazil).
Over time, when comparing the two soybean harvests, the level similarity among all systems decreased. This shows the influence of the different management programs on the floristic composition in the area. At the beginning of the experiment, similarity values were relatively high, with most systems sharing more than 70% of their species (Table 5). For instance, the two-MOA program showed 86.7% similarity with the four-MOA and five-MOA systems, while the lowest similarity at this stage (75.9%) was still above the 70% threshold, indicating a relatively homogeneous seed bank at the experimental site.
At the end of the study, however, similarity values decreased in all systems, evidencing a marked restructuring of the weed flora (Table 6). The two-MOA system, for example, maintained only 53.3% similarity with the six-MOA system and 54.5% similarity with the five-MOA program. Similarly, the four-MOA system showed only 44.4% similarity with the five-MOA system. These reductions reflect the selective effects of chemical management strategies, in which MOA diversification influenced species composition.
The reduction in the similarity of weed biomass at soybean pre-harvest between the 2019/2020 and 2020/2021 seasons indicates that the diversity of weed species changed over time. This result shows that herbicide management systems not only influence weed density and biomass, but also reduce floristic diversity across seasons. Understanding changes in weed community structure is essential in management programs with different herbicide mechanisms of action, where shifts in floristic composition can accelerate the selection of dominant species and the development of resistant populations.
3.5. Spatial Distribution of Commelina Benghalensis
When observing the spatial distribution of C. benghalensis BS and Dens in the 2020/2021 soybean crop (Figure 8), in the management system with four herbicide MOAs, the dominance rates for C. benghalensis were higher (Figure 8A), indicating inefficient management of this species. For the density (Figure 8B), the total distribution in the area was higher in the management system with four herbicide MOAs, indicating a greater distribution of the species in the variable analyzed in this system.
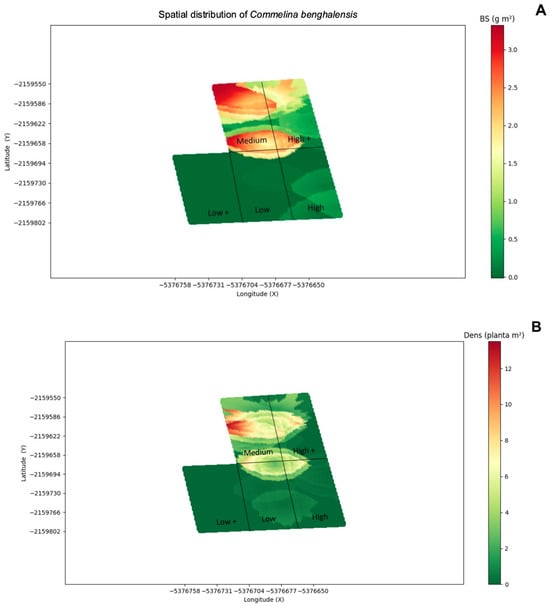
Figure 8.
Map of the spatial distribution of dry biomass ((A); BS—g/m2) and total density ((B); Dens—plants/m2) of Commelina benghalensis in the 2020/21 soybean crop. Green indicates a lower concentration of the variables studied, and red indicates the highest concentration of these variables (Uberlândia, MG, Brazil).
C. benghalensis is highly competitive with crops such as soybeans and corn, and the reason for the importance of this species is its efficient reproduction, with emphasis on underground seeds that hinder its control and promote it ability to survive in adverse conditions [23,24]. This is one of the reasons why C. benghalensis had a high IVI in the evaluated system. However, the data from this study showed alternatives in the chemical management of weeds and the importance of joining different mechanisms of action of herbicides. In addition to chemical control, integrated weed management (IWM) is efficient in controlling the weed community over time, reducing selection pressure. The patterns observed are consistent with strong shifts in weed community composition across management systems over time.
The clear divergence in floristic similarity (from >85% to <55%) between management systems over just 2 years underscores how herbicide programs were associated with distinct patterns of species composition. Although dicotyledonous species exhibited greater richness, the eventual dominance of monocot species, particularly D. insularis and Eleusine indica, across multiple systems suggests a selective advantage. This shift can be attributed to the repeated application of herbicides that are primarily effective against broad-leaved weeds (glyphosate, 2,4-D and atrazine), which may have released grass species from competition, allowing their populations to expand, a phenomenon akin to secondary succession induced by management [7]. Furthermore, innate traits of these grasses, such as prolific seed production, staggered germination (Digitaria spp.), and potential evolved resistance, likely contributed to their increased importance over time.
The initial high Importance Value Index (IVI) of C. benghalensis aligns with its notoriety as a pervasive weed in Brazilian agriculture. Its ability to reproduce via both aerial and subterranean seeds makes its control particularly challenging and explains its persistence, especially in systems with fewer MOAs, where control was less effective. The observed reduction in its IVI in systems with higher MOA numbers (five and six MOAs) highlights that a broader spectrum of action is necessary to target the multiple escape mechanisms of such complex weeds. The geostatistical maps (Figure 8) visually confirm this, showing higher biomass and density patches of C. benghalensis in the four-MOA system, indicating incomplete control.
3.6. Implications for Resistance Management and Biodiversity
The results obtained in this study demonstrate that chemical weed management strategies exert strong selection pressure, reshaping community structure and influencing diversity throughout the soybean and corn growing seasons. More diversified herbicide programs tended to show lower IVI values for C. benghalensis, while tolerant grasses such as D. insularis and E. indica remained frequent in the sampled quadrats. These species are particularly relevant, as they exhibit staggered germination, high seed production, and herbicide resistance, traits that enhance their persistence under intensive management regimes.
Such dynamics have direct implications for resistance management. The repeated use of herbicides, even when involving multiple MOAs, exerts continuous selective pressure that can favor biotypes with resistant traits. Indeed, the emergence of tolerant grasses in diversified systems suggests that, while MOA diversification delays the dominance of certain species, it does not eliminate the risk of new resistance cases. Therefore, relying solely on chemical management is insufficient to ensure long-term control.
The central implication of this study is that, while diversifying herbicide MOAs is a crucial strategy for managing difficult weeds and delaying resistance, it is not a definitive solution. Over-reliance on chemical management may shift the problem to a new set of species, potentially leading to new resistance issues. This has direct consequences for biodiversity conservation in agricultural landscapes, as it leads to simplified communities dominated by a few tolerant species, underscoring the importance of integrated weed management (IWM). Chemical diversity must be coupled with non-chemical practices, such as crop rotation, cover crops, and mechanical control, to reduce the overall selection pressure. This approach is essential not only for sustainable productivity, but also for maintaining ecological resilience.
4. Conclusions
Herbicide management strategies influence weed community structure, with implications for species dominance patterns and community evenness in intensive cropping systems. These shifts also relate to long-term herbicide resistance management. However, considering that the results reflect only the weed species present in the study area, these outcomes should be interpreted with caution to properly validate the diversity patterns observed and to support sustainable management recommendations.
Author Contributions
Conceptualization, D.K.; methodology, D.K. and J.R.O.S.; validation, D.K. and J.R.O.S.; formal analysis, D.K., J.R.O.S. and K.F.M.; investigation, D.K., J.R.O.S and K.F.M.; resources, D.K.; data curation, D.K. and J.R.O.S.; writing—original draft preparation, J.R.O.S.; writing—review and editing, J.R.O.S.; supervision, D.K.; project administration, D.K.; funding acquisition, D.K. All authors have read and agreed to the published version of the manuscript.
Funding
This research received no external funding.
Data Availability Statement
The original contributions presented in this study are included in the article. Further inquiries can be directed to the corresponding author.
Acknowledgments
The authors thank the Brazilian Agricultural Research Corporation (Embrapa), CAPES (Brazilian Federal Agency for Support and Evaluation of Graduate Education), and Bayer S.A. for their support of this study.
Conflicts of Interest
Author Décio Karam was employed by the company Brazilian Agricultural Research Co. The remaining authors declare that the research was conducted in the absence of any commercial or financial relationships that could be construed as a potential conflict of interest.
References
- Souza, R.G.; Cardoso, D.B.O.; Mamede, M.C.; Hamawaki, O.T.; Sousa, L.B. Desempenho agronômico de soja, sob interferência de plantas infestantes. Cult. Agronômica 2019, 28, 194–203. [Google Scholar] [CrossRef]
- Hussain, M.A.; Gao, X.; Qin, D.Q.; Qin, X.; Wu, G. Role of Biotic and Abiotic Factors for Sustainable Cotton Production. In Best Crop Management and Processing Practices for Sustainable Cotton Production; IntechOpen: London, UK, 2024. [Google Scholar] [CrossRef]
- Korres, N.E. Ecologically Based Weed Management: Concepts, Challenges, and Limitations; John Wiley & Sons: Hoboken, NJ, USA, 2023. [Google Scholar]
- Radosevich, S.; Holt, J.; Ghersa, C. Weed Ecology: Implications for Management, 2nd ed.; Wiley: Hoboken, NJ, USA, 1997. [Google Scholar]
- Costa, A.G.F.; Bacha, A.L.; Pires, R.N.; Pavani, M.C.M.D.; Alves, P.L.C.A. Interferência de Commelina benghalensis no crescimento inicial de Eucalyptus grandis no inverno e no verão. Ciência Florest. 2021, 31, 590–606. [Google Scholar] [CrossRef]
- Silva, A.F.; Concenço, G.; Aspiazu, I.; Galon, L.; Ferreira, E.A. Métodos de Controle de Planta Daninhas. In Controle de Plantas Daninhas: Métodos Físico, Mecânico, Cultural, Biológico e Alelopatia; Oliveira, M.F., Brighenti, A.M., Eds.; Embrapa Milho e Sorgo: Sete Lagoas, Brazil, 2018; pp. 11–33. [Google Scholar]
- Cardina, J.; Johnson, G.A.; Sparrow, D.H. The nature and consequence of weed spatial distribution. Weed Sci. 1997, 45, 364–373. [Google Scholar] [CrossRef]
- Trangmar, B.B.; Yost, R.S.; Uehara, G. Application of geostatistics to spatial studies of soil properties. Adv. Agron. 1985, 38, 45–94. [Google Scholar] [CrossRef]
- Balastreire, L.A.; Baio, F.H. Avaliação de uma metodologia prática para o mapeamento de plantas daninhas. Rev. Bras. De Eng. Agrícola E Ambient. 2001, 5, 349–352. [Google Scholar] [CrossRef]
- De Barros, R.P.; Reis, L.S.; Magalhães, I.C.S.; Da Silva, W.F.; Da Costa, J.G.; Dos Santos, A.F. Phytosociology of weed community in two vegetable growing systems. Afr. J. Agric. Res. 2018, 13, 28–293. [Google Scholar] [CrossRef]
- Instituto Nacional de Meteorologia (INMET). Banco de Dados Meteorológicos: Tabela de Dados Das Estações. 2022. Available online: https://tempo.inmet.gov.br/TabelaEstacoes/A001 (accessed on 18 August 2022).
- Mueller-Dombois, D.; Ellenberg, H. Aims and Methods of Vegetation Ecology; Wiley: Hoboken, NJ, USA, 1974. [Google Scholar]
- R Core Team. R: A Language and Environment for Statistical Computing, R Foundation for Statistical Computing: Vienna, Austria, 2020. Available online: https://www.R-project.org/ (accessed on 9 August 2025).
- Sorensen, T.A. Method of establishing groups of equal amplitude in plant society based on similarity of species content. In Ecologia, 3rd ed.; Odum, E.P., Ed.; McGraw-Hill Interamericana: City of Mexico, Mexico, 1972; pp. 341–405. [Google Scholar]
- Lorenzi, H. Manual de Identificação e Controle de Plantas Daninhas, 7th ed.; Instituto Plantarum: Nova Odessa, Brazil, 2014. [Google Scholar]
- Pinto, P.H.G.; Lima, S.F.; Andrade, M.G.O.; Contardi, L.M.; Ávila, J.; Reis, B.O.; Bernardo, V.F.; Vendruscolo, E.P. Weeds in soybean cultivation with different predecessor cover crops. Rev. Agric. Neotrop. 2021, 8, e5890. [Google Scholar] [CrossRef]
- Santos, W.F.; Procópio, S.O.; Silva, A.G.; Fernandes, M.F.; Barroso, A.L.L. Weed phytosociological and floristic survey in agricultural areas of Southwestern Goiás region. Planta Daninha 2016, 34, 65–80. [Google Scholar] [CrossRef][Green Version]
- Kissmann, K.G.; Groth, D. Plantas Infestantes e Nocivas, 2nd ed.; BASF: Ludwigshafen, Germany, 1991; Volume 1. [Google Scholar]
- Lima, S.F.; Timossi, P.C.; Almeida, D.P.; da Silva, U.R. Fitossociologia de plantas daninhas em convivência com plantas de cobertura. Rev. Caating 2014, 27, 37–47. [Google Scholar]
- Cruz, L.; Ferreira, L.; Canuto, R.; Canuto, D. Levantamento fitossociológico de plantas daninhas e controle de Cyperus rotundus L. com glifosato em pré-semeadura de feijão. Agrar. Acad. 2019, 6, 197–205. [Google Scholar] [CrossRef]
- Benedetti, J.G.R.; Pereira, L.; Alves, P.L.D.C.A.; Yamauti, M.S. Período anterior a interferência de plantas daninhas em soja transgênica. Sci. Agrar. 2009, 10, 289–295. [Google Scholar] [CrossRef]
- Concenço, G.; Silva, C.J.; Tomazi, M.; Correia, I.V.T.; Souza, N.C.D.S.; Andres, A. Infestation of weed species in pre-planting of soybean in succession to winter crops. Planta Daninha 2013, 31, 551–558. [Google Scholar] [CrossRef][Green Version]
- Santos, I.C.; Silva, A.A.; Ferreira, F.A.; Miranda, G.V.; Pinheiro, R.A.N. Eficiência de glyphosate no controle de Commelina benghalensis e Commelina diffusa. Planta Daninha 2001, 19, 135–143. [Google Scholar] [CrossRef]
- Wilson, A.K. Commelinaceae-a review of the distribution, biology and control of the important weeds belonging to this family. Trop. Pest Manag. 1981, 27, 405–418. [Google Scholar] [CrossRef]
Disclaimer/Publisher’s Note: The statements, opinions and data contained in all publications are solely those of the individual author(s) and contributor(s) and not of MDPI and/or the editor(s). MDPI and/or the editor(s) disclaim responsibility for any injury to people or property resulting from any ideas, methods, instructions or products referred to in the content. |
© 2026 by the authors. Licensee MDPI, Basel, Switzerland. This article is an open access article distributed under the terms and conditions of the Creative Commons Attribution (CC BY) license.