Abstract
This study introduces a novel, low-cost, and non-invasive method for characterizing the surface profile of transparent objects using double digital fringe projection (DDFP). By projecting dual sinusoidal patterns that generate a Moiré effect and applying a frequency-domain Gaussian filter, the system isolates relevant data for accurate phase recovery through the isotropic quadrature transform (IQT). Experimental validation with plastic and acrylic samples confirms the method’s high spatial resolution and robustness against ambient noise. Unlike traditional systems, this technique avoids coherent light sources and complex hardware, improving its accessibility for academic and industrial use in transparent surface metrology.
1. Introduction
The characterization of the surface of transparent objects is a relevant topic in various fields of engineering and materials science. This focuses on the digital reconstruction of various transparent plastic films extracted from plastic bottle fragments using non-destructive optical techniques.
Analyzing the surface of transparent materials is essential for enhancing the quality and performance of products in sectors such as biomedicine, optical device manufacturing, and materials engineering. Specifically, this analysis is applicable in the production of lenses and other optical devices, as well as in the assessment of recycled plastic materials’ quality. Previous studies have proposed the digital reconstruction of transparent objects through advanced optical techniques, including polarization analysis and triangulation for surface and thickness measurements [], laser scanning combined with multilayer refinement and point extraction [], and the application of the phase shifting techniques with diffusion models to mitigate aliasing in fringe projection [].
Differing from hyperspectral, polarimetric, or interferometric techniques, this approach aims for a low-cost, reproducible, and adaptable solution for transparent surfaces, without the need for specialized equipment or coherent illumination, which could broaden its industrial and academic applications.
Other optical techniques for collecting the surface profile of an object include interferometric holography [], as well as various implementations of structured light projection. These include its application to geological analog models under deformation using binary fringe patterns [], a single-shot 3D methods [], a combination of fringe projection with digital image correlation for full 3D displacement measurement [], automatic profilometry with a phase shifting approach [], the use of this techniques for evaluating deformation in biological tissues such as dental [] and facial structures []. A variant of this technique is the simultaneous double digital fringe projection [], which has been applied in various contexts, such as accurate measuring for complex surfaces [], enhancing phase extraction through frequency filtering methods [], proposing fast and cost-effective phase retrieval approaches [,], and analyzing dynamic changes in membrane surfaces over time []. The double projection technique is employed in this work, involving the overlapping of two fringe patterns to generate a Moiré pattern for further processing.
The double fringe projection technique finds applications in mechanics, where it is used for vibration analysis, strain, and displacement measurements []; in engineering and image processing for three-dimensional surface reconstruction []; as well as in biomedicine [], among other fields. This technique is distinguished by its high reproducibility and ease of use, which stem from its inherent characteristics. It features simple calibration, employs cost-effective components, and the fringe patterns are digitally managed. Additionally, the absence of mechanical components helps minimize systematic errors.
This study aims to examine the surface profile of a transparent acrylic plate and pieces of transparent plastic bottles using the DDFP technique. To recover the optical phase, an algorithm for the spatial analysis of individual intensity patterns was applied. For this type of analysis, techniques such as the Takeda method [,] or the quadrature transform [] are available, with the latter being the method employed for this project.
Despite recent advancements in fringe projection and optical metrology, current methods for analyzing transparent surfaces still face important limitations. Techniques such as interferometry, hyperspectral imaging, and polarization-based methods typically require costly and highly sensitive equipment, are prone to ambient disturbances, and demand complex calibration processes. These constraints limit their use in industrial, educational, or resource-constrained settings.
The present work addresses these challenges by proposing a robust and economical system based on double digital fringe projection (DDFP), which eliminates the need for coherent light sources or nanometric precision setups. Unlike single-shot or laser-based methods, DDFP with spatial demodulation via the isotropic quadrature transform (IQT) allows an accurate phase recovery even under non-controlled conditions. This approach broadens the applicability of transparent surface measurement by simplifying implementation, reducing cost, and maintaining high spatial resolution—thus contributing to the advancement of accessible metrology techniques.
2. Experimental Design
The overall methodology is structured in three main stages: fringe projection, frequency filtering, and phase recovery. This workflow allows for a systematic transition from image acquisition to accurate surface profile reconstruction, as illustrated in Figure 1.
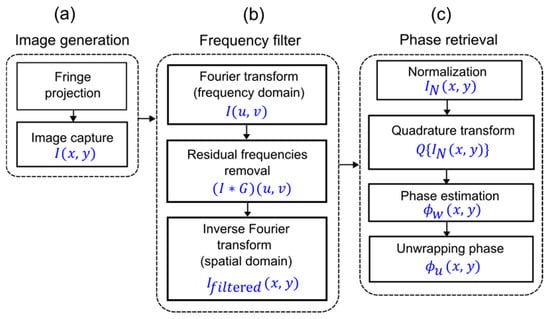
Figure 1.
Experimental procedure diagram used for retrieving the surface profile of transparent objects: (a) Fringe patterns projection and image generation. (b) Frequency filtering process. (c) Phase retrieval process, using a quadrature transform-based approach.
The process begins with the projection of a fringe pattern from two projectors located on opposite sides of the optical axis onto the object (Figure 1a), generating an interference pattern, making the system suitable for field deployment. This is captured by a camera.
In the second stage (Figure 1b), a frequency filter is applied []. The Fourier transform is applied to the captured image. A bandpass filter is employed to remove frequencies unrelated to the object’s surface, retaining only the frequencies from the overlapped projected fringes. Once filtered, an inverse Fourier transform is performed to obtain the clean interference pattern, obtaining a new set of fringes, known as the Moiré pattern.
The next step (Figure 1c) involves optical phase recovery using the IQT method. The amplitude of the Moiré patterns is normalized to obtain their phase through a quadrature transformation. This normalization process corrects the lighting variations in the moiré pattern. Then, using the Quadrature transform to obtain the phase maps
3. System Setup and Theoretical Description
3.1. System Characteristics
Figure 2 illustrates the optical setup for the DDFP technique, including some distance and angle parameters: represents the distances from the projectors to the object, which are 86.3 cm; is the distance from the camera to the object, which is 86.3 cm; and the angle between the projectors and the optical axis is . The imaging system consists of a Huawei P30 camera (Huawei, Shenzhen, China) with a CCD sensor, a resolution of 2736 × 3648 pixels, and a 4:3 aspect ratio. This device was selected because its high pixel density and low noise level ensure sufficient spatial resolution for fringe analysis without requiring a specialized camera. Moreover, since these characteristics are now common in most modern mobile devices, the system can be easily replicated using any similar smartphone available to users, reinforcing the low-cost and accessible nature of the proposed method. The projectors used are two EPSON PowerLite S27 with 3LCD technology (Epson America, Inc., Long Beach, CA, USA), a resolution of 800 × 600 pixels (SVGA), and 2700 lumens. This model was chosen since its technology provides stable and homogeneous illumination. A dual HDMI adapter synchronized the projection of the same pattern from both projectors.
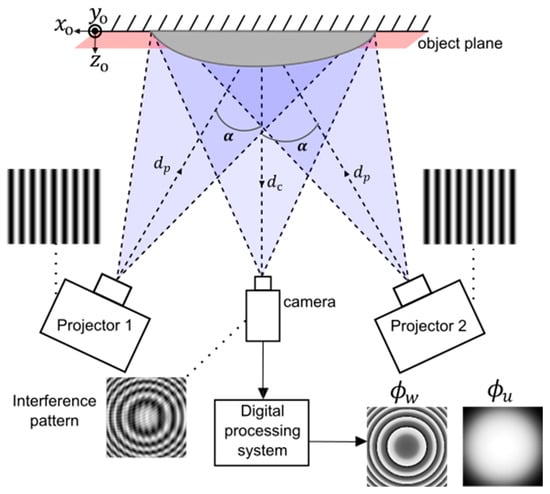
Figure 2.
Optical system implemented for the DDFP technique. The resulting intensity pattern from the interference of the projected fringes is observed, as well as the wrapped phase and the unwrapped phase .
The system operates under ambient conditions and does not require controlled temperature or humidity environments. This is possible due to the use of incoherent light sources, which are inherently less susceptible to external perturbations. As such, calibration procedures are minimal, making the system suitable for use in field environments. Illumination was reduced to approximately 1700 lumens by adjusting the projectors in order to prevent saturation of the camera sensor while maintaining adequate fringe contrast and signal-to-noise ratio under ambient conditions.
3.2. Double Fringe Projection
The DDFP technique is proposed for acquiring surface profile information. Monochromatic sinusoidal fringes with a constant period are projected onto the object. The spatial resolution of the system has practical limits that depend primarily on the resolution of the camera sensor, the projection optics, and the spatial frequency of the projected fringes. The minimum measurable feature size can be estimated by the relation:
where is the effective pixel size projected onto the object, and is the spatial frequency of the projected fringe pattern. For this study, this frequency was set at 0.12 cycles/mm, measured on the object plane. This imposes a lower bound on the scale of detectable features, especially when aiming to capture micro or submicron structures. For such applications, high-resolution projectors and imaging sensors would be required, along with precise system calibration.
This places a practical limitation on the system’s spatial resolution, restricting the detection of features below the projected pixel size. As such, microstructural analysis would require higher-frequency fringe patterns and optimized optical configurations.
The captured images show modulation in the fringes according to the shape. These display an intensity pattern and can be expressed by Equation (2). Through digital processing using fringe analysis techniques [,], phase information is obtained, enabling the displacement analysis of the object.
In Equation (1), represents the background light intensity; denotes the fringe contrast; f is the spatial frequency of the fringes along the x-axis, and represents the initial phase. By combining the terms of the initial phase and frequency, the overall phase can be expressed as . When the fringe pattern is projected onto a non-planar object, deformation in the fringe is introduced, which in turn causes modulation in the phase. Therefore, Equation (3) can be rewritten as follows:
represents the phase change introduced by the object’s topography. These results confirm the proposed system’s ability to accurately replace a single-phase expression, as shown in Equation (4):
The deformation in the fringes generated by the test object directly alters the total phase . This superposition in the projected fringe patterns is the combination of both patterns on the object plane, resulting in a Moiré pattern with its own frequency. As observed in Figure 2, the intensity pattern is obtained of an object plane, since the projected fringes impinge on the object.
The intensity of the interference pattern is expressed as the superposition of the two fringe patterns, comprising two phase components for each pattern and a third phase component corresponding to the Moiré pattern. By expressing the resulting phases in terms of their initial values and the phase change induced by the surface , as follows: , where and , Equation (4) can be reformulated as
Figure 3a,b depict two synthetic sinusoidal fringe patterns with different deformations according to each side of the optical axis. Figure 3c presents the superimposed intensity.
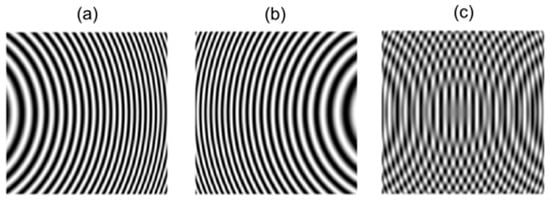
Figure 3.
Simulation of the projection and deformation of fringe patterns by DDFP (a,b); interference by overlay of fringe patterns (c).
3.3. Frequency Filtering for Moiré Pattern Retrieval
The intensity pattern provides information about the object’s shape. However, it also retains fringes from the projections that generate noise and compromise the measurement accuracy. To address this, a bandpass filter [,,,] is applied to selectively eliminate frequencies that do not contribute to the Moiré pattern. A Gaussian distribution bandpass filter has been developed for this purpose. Equation (4) is modified by substituting the trigonometric identity .
Therefore, the intensity can be expressed as follows:
The complex terms are replaced by the variables and in Equation (6), and the Fourier transform is performed to turn it into the frequency domain (u,v) using the operator F{ }:
The background intensity corresponds to the zero-frequency term . contains the required phase information, while represents the conjugate term.
The mathematical expression for the Gaussian distribution bandpass filter is given by Equation (8):
is a unit amplitude. The media (μu,μv) and standard deviation values (σu,σv) indicate the center and width of the Gaussian distribution, respectively. The filter is convolved with the intensity in the frequency domain of the image I(u,v). By removing the terms A(u,v) and C′(u,v), only C(u,v) remains. Therefore, the resulting filtered intensity can be expressed as follows:
In Figure 4, the intensity pattern profile in the frequency domain and the developed bandpass filter can be observed.
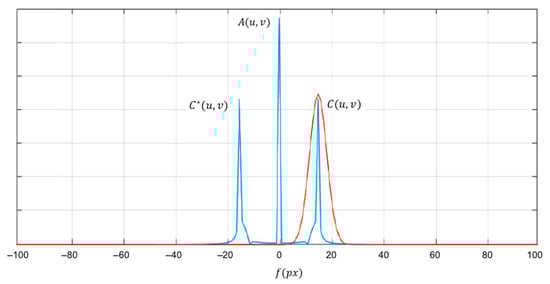
Figure 4.
Central row of the Fourier transform of the simulated intensity pattern in Figure 3c (blue), along with the Gaussian distribution bandpass filter (red).
Finally, the intensity image is back in the spatial domain by the inverse Fourier transform using the operator , as shown in Equation (10). The result is a Moiré pattern that has been effectively cleaned by removing residual frequencies.
Figure 5a displays a synthetic interference pattern, Figure 5b shows the filtered image, and Figure 5c compares the profiles of the images before and after filtering.
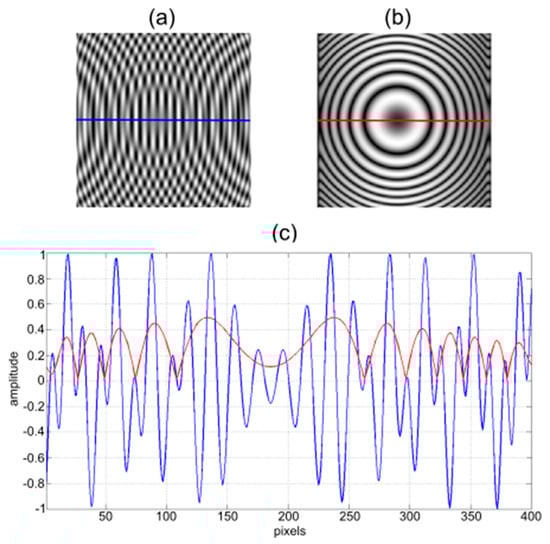
Figure 5.
(a) Interference pattern; (b) Moiré pattern obtained from filtering the interference pattern; (c) Comparison of profiles from both images: Moire pattern profile (blue) and interference pattern profile (red).
3.4. Phase Recovery from a Single Intensity Pattern
The implemented quadrature transformation method [,] enables phase recovery from a single intensity pattern. Particularly, the DemIQT function of the XtremeFringe 1.3 version software, developed for Matlab 2013b [], is used for this purpose.
The phase recovery procedure starts with the normalization of the intensity pattern, which preserves the information of the Moiré fringe contrast and phase modulation, yielding . Subsequently, the quadrature term is computed by applying the Hilbert transform of the function cos(α), which is H{cos(α)} = −sin(α), as shown in Equation (11).
The isotropic quadrature operator is used to obtain the wrapped phase modulated by the following function:
The unwrapped phase is obtained using multigrid techniques [,,].
4. Experimental Results
The samples used in this study consist of cut sections from thin transparent plastic bottles, as well as a thick acrylic plate. These samples were positioned at the central location between the projectors, approximately 40 ± 3 cm from the projection plane, depending on the dimensions of each object. This positioning enabled the establishment of an object plane that is perpendicular to the optical axis of the system, which is defined by the camera situated at the center of the projectors. The arrangement of the system conforms to the configuration of the DDFP setup illustrated in Figure 2. In this configuration, the superposition of the projected fringes is observed on the object, revealing the deformations corresponding to the topography of the object, as well as the effects of the fringe incidence angles on the surface, as seen in Figure 6.
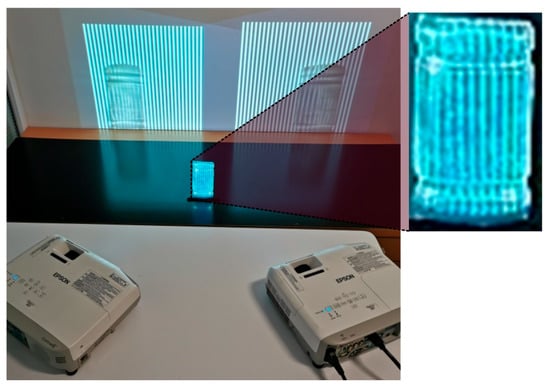
Figure 6.
Picture of the optical system illustrating the projection and overlapping of fringe patterns onto the sample object.
The study focuses on evaluating the effectiveness of the proposed method on various transparent samples. The analysis focuses on the visual characteristics of the captured interference and Moiré patterns, and the corresponding wrapped and unwrapped phase maps. The results are interpreted in terms of contrast, phase continuity, and the visibility of surface topographies. This approach is appropriate for validating the system’s capacity to resolve complex deformations in transparent materials without requiring contact or destructive testing.
This section outlines the analysis and recovery process for the surface of various transparent samples utilizing the proposed method. The results for each sample are detailed and explained, along with the key stages involved in the processing.
The following images illustrate the process as follows: The first image of the object is captured under direct illumination, providing a visual reference as seen in Figure 7a. Subsequently, the interference pattern generated by the projected fringes onto the surface is obtained, as shown in Figure 7b. After applying frequency filtering, the moiré pattern is generated and depicted in Figure 7c. Figure 7d presents this pattern with normalized intensity. Finally, the wrapped and unwrapped phases are shown in Figure 7e and Figure 7f, respectively.
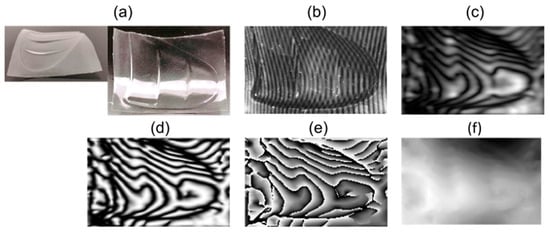
Figure 7.
Processing results for sample 1 of a transparent plastic bottle fragment. (a) Sample object; (b) overlapped fringes in the object; (c) Moiré pattern; (d) normalized pattern; (e) wrapped phase; (f) unwrapped phase.
In Figure 7, an object with a surface that exhibits significant height variations is presented, generating complex moiré fringes characterized by open, closed, and various oriented patterns. This complexity complicates phase recovery; however, precise results that accurately reflect the true surface profile of the object, by using the proposed method, can be observed.
Figure 8 illustrates different behaviors in the Moiré fringes (Figure 8c) due to variations between the upper and lower sections of the sample.
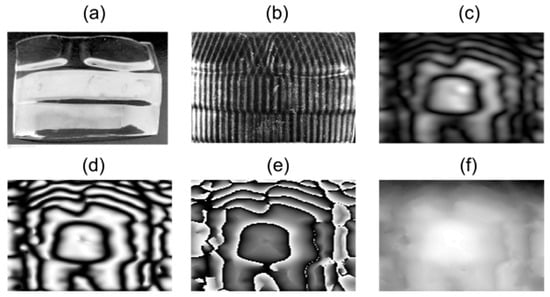
Figure 8.
Processing results for sample 2 of a transparent plastic bottle fragment. (a) Sample object; (b) overlapped fringes in the object; (c) Moiré pattern; (d) normalized pattern; (e) wrapped phase; (f) unwrapped phase.
In the case of Figure 9, the projection of vertical fringes onto the object with a predominantly flat surface shows that the fringe overlap does not cover the entire area. As a result, height variations are primarily observed at the edges, where they are more pronounced, which increases fringe spatial frequency and hinders accurate phase recovery.
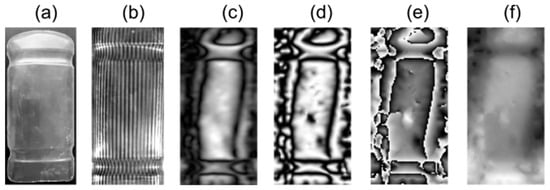
Figure 9.
Processing results for sample 3 of a transparent plastic bottle fragment. (a) Sample object; (b) overlapped fringes in the object; (c) Moiré pattern; (d) normalized pattern; (e) wrapped phase; (f) unwrapped phase.
Figure 10 and Figure 11 depict plastic pieces with sections marked by trenches that are accurately reconstructed in their phase, despite the reflection caused by the light projection.
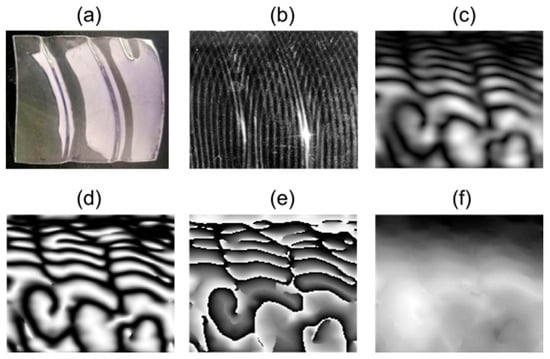
Figure 10.
Processing results for sample 4 of a transparent plastic bottle fragment. (a) Sample object; (b) overlapped fringes in the object; (c) Moiré pattern; (d) normalized pattern; (e) wrapped phase; (f) unwrapped phase.
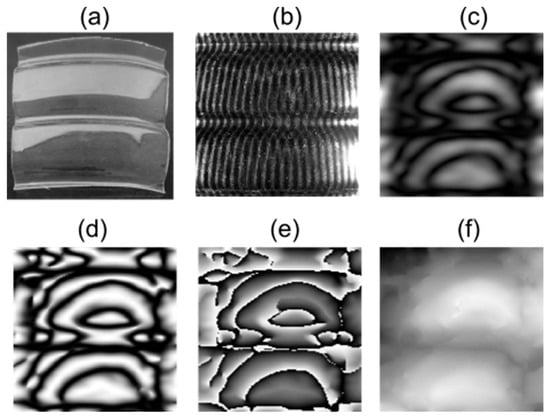
Figure 11.
Processing results for sample 5 of a transparent plastic bottle fragment. (a) Sample object; (b) overlapped fringes in the object; (c) Moiré pattern; (d) normalized pattern; (e) wrapped phase; (f) unwrapped phase.
Finally, Figure 12 illustrates a transparent acrylic panel with a thickness greater than the previous samples (5 mm). This complementary case allowed us to evaluate the robustness of the system under different optical conditions. The recovered fringes reveal its flatness and some inclination components of the object relative to the optical axis and the object plane.
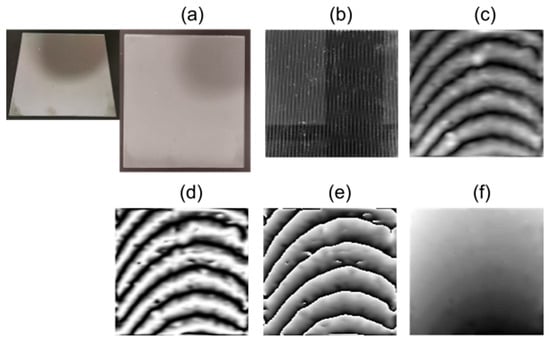
Figure 12.
Processing results for sample 6, a transparent acrylic plate. (a) Sample object; (b) overlapped fringes in the object; (c) Moiré pattern; (d) normalized pattern; (e) wrapped phase; (f) unwrapped phase.
These results demonstrate that the proposed system can accurately recover surface profiles even in samples with strong curvature, optical heterogeneity, or partial fringe occlusion. However, the method shows sensitivity to the fringe overlapping region and local reflectivity variations. Future research should evaluate the impact of these factors systematically and explore enhancements in robustness through adaptive filtering or AI-based fringe interpretation.
5. Conclusions
- This study primarily aimed to characterize transparent surfaces using a non-invasive optical approach based on simultaneous double digital fringe projection (DDFP) and phase recovery through spatial demodulation.
- The key novelty of this work lies in the combined implementation of double fringe projection and frequency filtering, which overcomes the typical limitations encountered in the measurement of transparent objects.
- Experimental results demonstrated the acquisition of detailed height maps on highly transparent surfaces, maintaining good spatial resolution and low distortion.
- The system is flexible and not limited to a single algorithm. The Instantaneous Quadrature Transform (IQT) was used as a demonstrative example due to its robustness under noisy conditions, but other spatial or temporal algorithms can be used with similar effectiveness.
- The setup relies on standard equipment and open-source software, making it accessible and viable for academic and resource-constrained environments.
- Compared to previous approaches such as single fringe projection or interferometric methods, the double projection strategy achieved similar results in spatial resolution and phase recovery accuracy, while reducing system complexity by avoiding the need for nanometric precision and synchronization.
- The method effectively addresses challenges caused by refraction and reflection in transparent materials by integrating techniques that stabilize phase retrieval and reduce ambient noise.
- This approach shows strong potential for use in industries where transparent surface characterization is critical, such as optical lens manufacturing, thin film analysis, and glass component quality control, both in static and dynamic scenarios.
- Although the focus was on low-reflectivity transparent objects, the system can be adapted for optically complex or opaque surfaces, as well as curved geometries, with appropriate calibration and geometric adjustments.
- Future work should explore the method’s performance under variable lighting conditions and on non-uniform or complex surfaces, as well as develop more robust phase retrieval algorithms for real-time applications.
- In conclusion, this work offers an accessible and versatile tool for optical surface characterization. For non-specialist readers, it provides a practical and adaptable solution to common challenges in the measurement of transparent objects.
Author Contributions
Conceptualization, D.A.G.-H. and U.U.-L.; methodology, R.S.-M.; software, M.G.-D.; validation, V.Z.-R., J.d.V.-H., D.O.-V. and D.A.V.-V.; formal analysis, U.U.-L.; investigation, U.U.-L.; resources, D.A.G.-H.; data curation, M.G.-D. and D.O.-V.; writing—original draft preparation, U.U.-L.; writing—review and editing, D.A.G.-H.; visualization, R.S.-M.; supervision, D.A.V.-V. and D.O.-V.; project administration, J.d.V.-H.; funding acquisition, D.A.G.-H. All authors have read and agreed to the published version of the manuscript.
Funding
This research received no external funding.
Data Availability Statement
The original contributions presented in the study are included in the article, further inquiries can be directed to the corresponding author.
Conflicts of Interest
The authors declare no conflicts of interest.
References
- Xu, X.; Qiao, Y.; Qiu, B. Reconstructing the surface of transparent objects by polarized light measurements. Opt. Express 2017, 25, 26296–26309. [Google Scholar] [CrossRef] [PubMed]
- He, K.; Sui, C.; Huang, T.; Zhang, Y.; Zhou, W.; Chen, X.; Liu, Y. 3D surface reconstruction of transparent objects using laser scanning with a four-layers refinement process. Opt. Express 2022, 30, 8571–8591. [Google Scholar] [CrossRef] [PubMed]
- Zhang, Q.; Liu, F.; Lu, L.; Su, Z.; Pan, W.; Dai, X. Reconstruction of transparent objects using phase shifting profilometry based on diffusion models. Opt. Express 2024, 32, 13342–13356. [Google Scholar] [CrossRef] [PubMed]
- Múnera, N. Interferometría Holográfica Digital en Tiempo Real: Aplicación de la Cuantificación de Deformaciones Mecánicas. Master’s Thesis, Universidad Nacional de Colombia, Facultad de Ciencias, Medellín, Colombia, 2013. [Google Scholar]
- Cerca, M.; Barrientos, B.; García, J.; Hernández, C. Obtención del relieve digital mediante proyección de luz estructurada en modelos analógicos de extensión. Bol. Soc. Geol. Mex. 2007, 59, 101–113. [Google Scholar] [CrossRef]
- Zhang, Z. Review of single-shot 3D shape measurement by phase calculation-based fringe projection techniques. Opt. Lasers Eng. 2012, 50, 1097–1106. [Google Scholar] [CrossRef]
- Quan, C.; Tay, C.; Huang, Y. 3-D deformation measurement using fringe projection and digital image correlation. Optik 2004, 115, 164–168. [Google Scholar] [CrossRef]
- Soriano-Garcia, M.; Sevilla-Escoboza, R.; Mora-Gonzalez, M. Optomechatronics design for mobile fringe patterns with applications on profilometry. In Proceedings of the IEEE International Autumn Meeting on Power, Electronics and Computing (ROPEC), Ixtapa, Mexico, 13–15 November 2019; pp. 1–6. [Google Scholar]
- Valin, J.; Goncalves, E.; Vinícius-Soares, P.; Milito, G.; Palacios-Fernández, F.; Roque, G.; Ricardo-Pérez, J.; Valin Fernández, M. Desarrollo del método de Moiré de proyección de franjas para la evaluación de deformaciones en premolares superiores. Ing. Mec. 2017, 20, 22–30. [Google Scholar]
- González, A.; Meneses, J.; León, J. Proyección de franjas en metrología óptica facial. INGE CUC 2012, 8, 191–206. [Google Scholar]
- Sciammarella, C.A.; Lamberti, L.; Boccaccio, A. General model for moiré contouring, part 1: Theory. Opt. Eng. 2008, 47, 033605. [Google Scholar] [CrossRef]
- Parra-Michel, J.; Martinez-Pelaez, R.; Duarte-Moller, A. Double structured light with divergent projection for surface topometry. Meas. Sci. Technol. 2021, 32, 095205. [Google Scholar] [CrossRef]
- Uribe-López, U.; Gutiérrez-Hernández, D.; Casillas Rodríguez, F.; Mora-González, M.; Muñoz-Maciel, J. Improvement of fringe quality for phase extraction in double digital fringe projection. Opt. Eng. 2019, 58, 092605. [Google Scholar] [CrossRef]
- Gutierrez-Hernandez, D.; Parra, J.; Atondo-Rubio, G.; Tellez-Quiñones, A.; Del Valle, J. Fast phase retrieval by temporal phase shifting and double-digital fringe projection. J. Optoelectron. Adv. Mater. 2016, 18, 750. [Google Scholar]
- Gutierrez-Hernandez, D.; Atondo-Rubio, G.; Parra, J.; Santiago-Montero, R.; Romero, V.; Del Valle, J.; Ibarra, I. Double-digital fringe projection for optical phase retrieval of a single frame. J. Optoelectron. Adv. Mater. 2015, 17, 1248–1253. [Google Scholar]
- Uribe-López, U.; Gutierrez-Hernandez, D.; Casillas-Rodriguez, F.; Tellez-Quiñones, A.; Parra-Michel, J.; Del Valle-Hernandez, J.; Escobar, M. Measurement of transient dynamics on a flexible membrane by double digital fringe projection. J. Optoelectron. Adv. Mater. 2019, 21, 1–2. [Google Scholar]
- Canchola, M. Medición de Perfiles Utilizando Técnicas de Proyección de Franjas. Master’s Thesis, INAOE, Puebla, México, 2012. [Google Scholar]
- Takeda, M.; Ina, H.; Kobayashi, S. Fourier-transform method of fringe-pattern analysis for computer-based topography and interferometry. J. Opt. Soc. Am. 1982, 72, 156–160. [Google Scholar] [CrossRef]
- Quiroga, J.; Servin, M.; Marroquín, J.; Gomez-Pedrero, J. Isotropic n-dimensional quadrature transform and its applications in fringe pattern processing. In Proceedings of the Optical Measurement Systems for Industrial Inspection III (SPIE 5144), Munich, Germany, 23–26 June 2003. [Google Scholar] [CrossRef]
- Creath, K.; Wyant, J. Optical Shop Testing; John Wiley & Sons: New York, NY, USA, 1992; pp. 501–599. [Google Scholar]
- Malacara, D. Phase Shifting Interferometry. Rev. Mex. Física 1990, 36, 6–22. [Google Scholar]
- Kreis, T. Fourier Transform Evaluation. Handbook of Holographic Interferometry: Optical and Digital Methods; John Wiley & Sons Ltd.: Bremen, Germany, 2005; pp. 256–258. [Google Scholar]
- Liu, Z.; Bu, S.; Zhang, C.; Tang, X. Filter Fourier Coefficients of Shape Projections for 3D Shape Retrieval. Int. J. Inf. 2010, 13, 1351–1360. [Google Scholar]
- Uribe-López, U.; Hernández-Montes, M.; Mendoza-Santoyo, F. Fully automated digital holographic interferometer for 360 deg contour and displacement measurements. Opt. Eng. 2016, 55, 121719. [Google Scholar] [CrossRef]
- Hernández, J.; De la Rosa, J.; Rodríguez, G.; Flores, J.; Tsonchev, R.; Garcia-Torales, G.; Alaniz-Lumbreras, D.; González, E. The 2D Continuous Wavelet Transform: Applications in Fringe Pattern Processing for Optical Measurement Techniques. In Wavelet Theory and Its Applications; InTech: London, UK, 2018. [Google Scholar] [CrossRef]
- Larkin, K.; Bone, D.; Oldfield, M. Natural demodulation of two- dimensional fringe patterns. I. General background of the spiral phase quadrature transform. JOSA A 2001, 8, 1862–1870. [Google Scholar] [CrossRef]
- Quiroga, J.; Crespo, D.; Gomez-Pedrero, J. XtremeFringe: State-of-the-art software for automatic processing of fringe patterns. In Proceedings of the Optical Measurement Systems for Industrial Inspection V (SPIE 6616), Munich, Germany, 17–21 June 2007; p. 66163Y. [Google Scholar]
- Pritt, M. Weighted least squares phase unwrapping by means of multigrid techniques. In Proceedings of the Synthetic Aperture Radar and Passive Microwave Sensing (SPIE 2584), Paris, France, 25–28 September 1995; Volume 2584, pp. 278–288. [Google Scholar]
- Botello, S.; Marroquin, J.L.; Rivera, M. Multigrid algorithms for processing fringe-pattern images. Appl. Opt. 1998, 37, 7587–7595. [Google Scholar] [CrossRef]
- Rivera, M.; Hernandez-Lopez, F.; Gonzalez, A. Phase unwrapping by accumulation of residual maps. Opt. Lasers Eng. 2015, 64, 51–58. [Google Scholar] [CrossRef]
Disclaimer/Publisher’s Note: The statements, opinions and data contained in all publications are solely those of the individual author(s) and contributor(s) and not of MDPI and/or the editor(s). MDPI and/or the editor(s) disclaim responsibility for any injury to people or property resulting from any ideas, methods, instructions or products referred to in the content. |
© 2025 by the authors. Licensee MDPI, Basel, Switzerland. This article is an open access article distributed under the terms and conditions of the Creative Commons Attribution (CC BY) license (https://creativecommons.org/licenses/by/4.0/).