


Commercial Level Analysis of P2P vs. Net-Metering Comparing Economic and Technical Indexes


Abstract
:1. Introduction
1.1. Problem Identification
1.2. Proposed Contribution to Literature
2. Literature Review
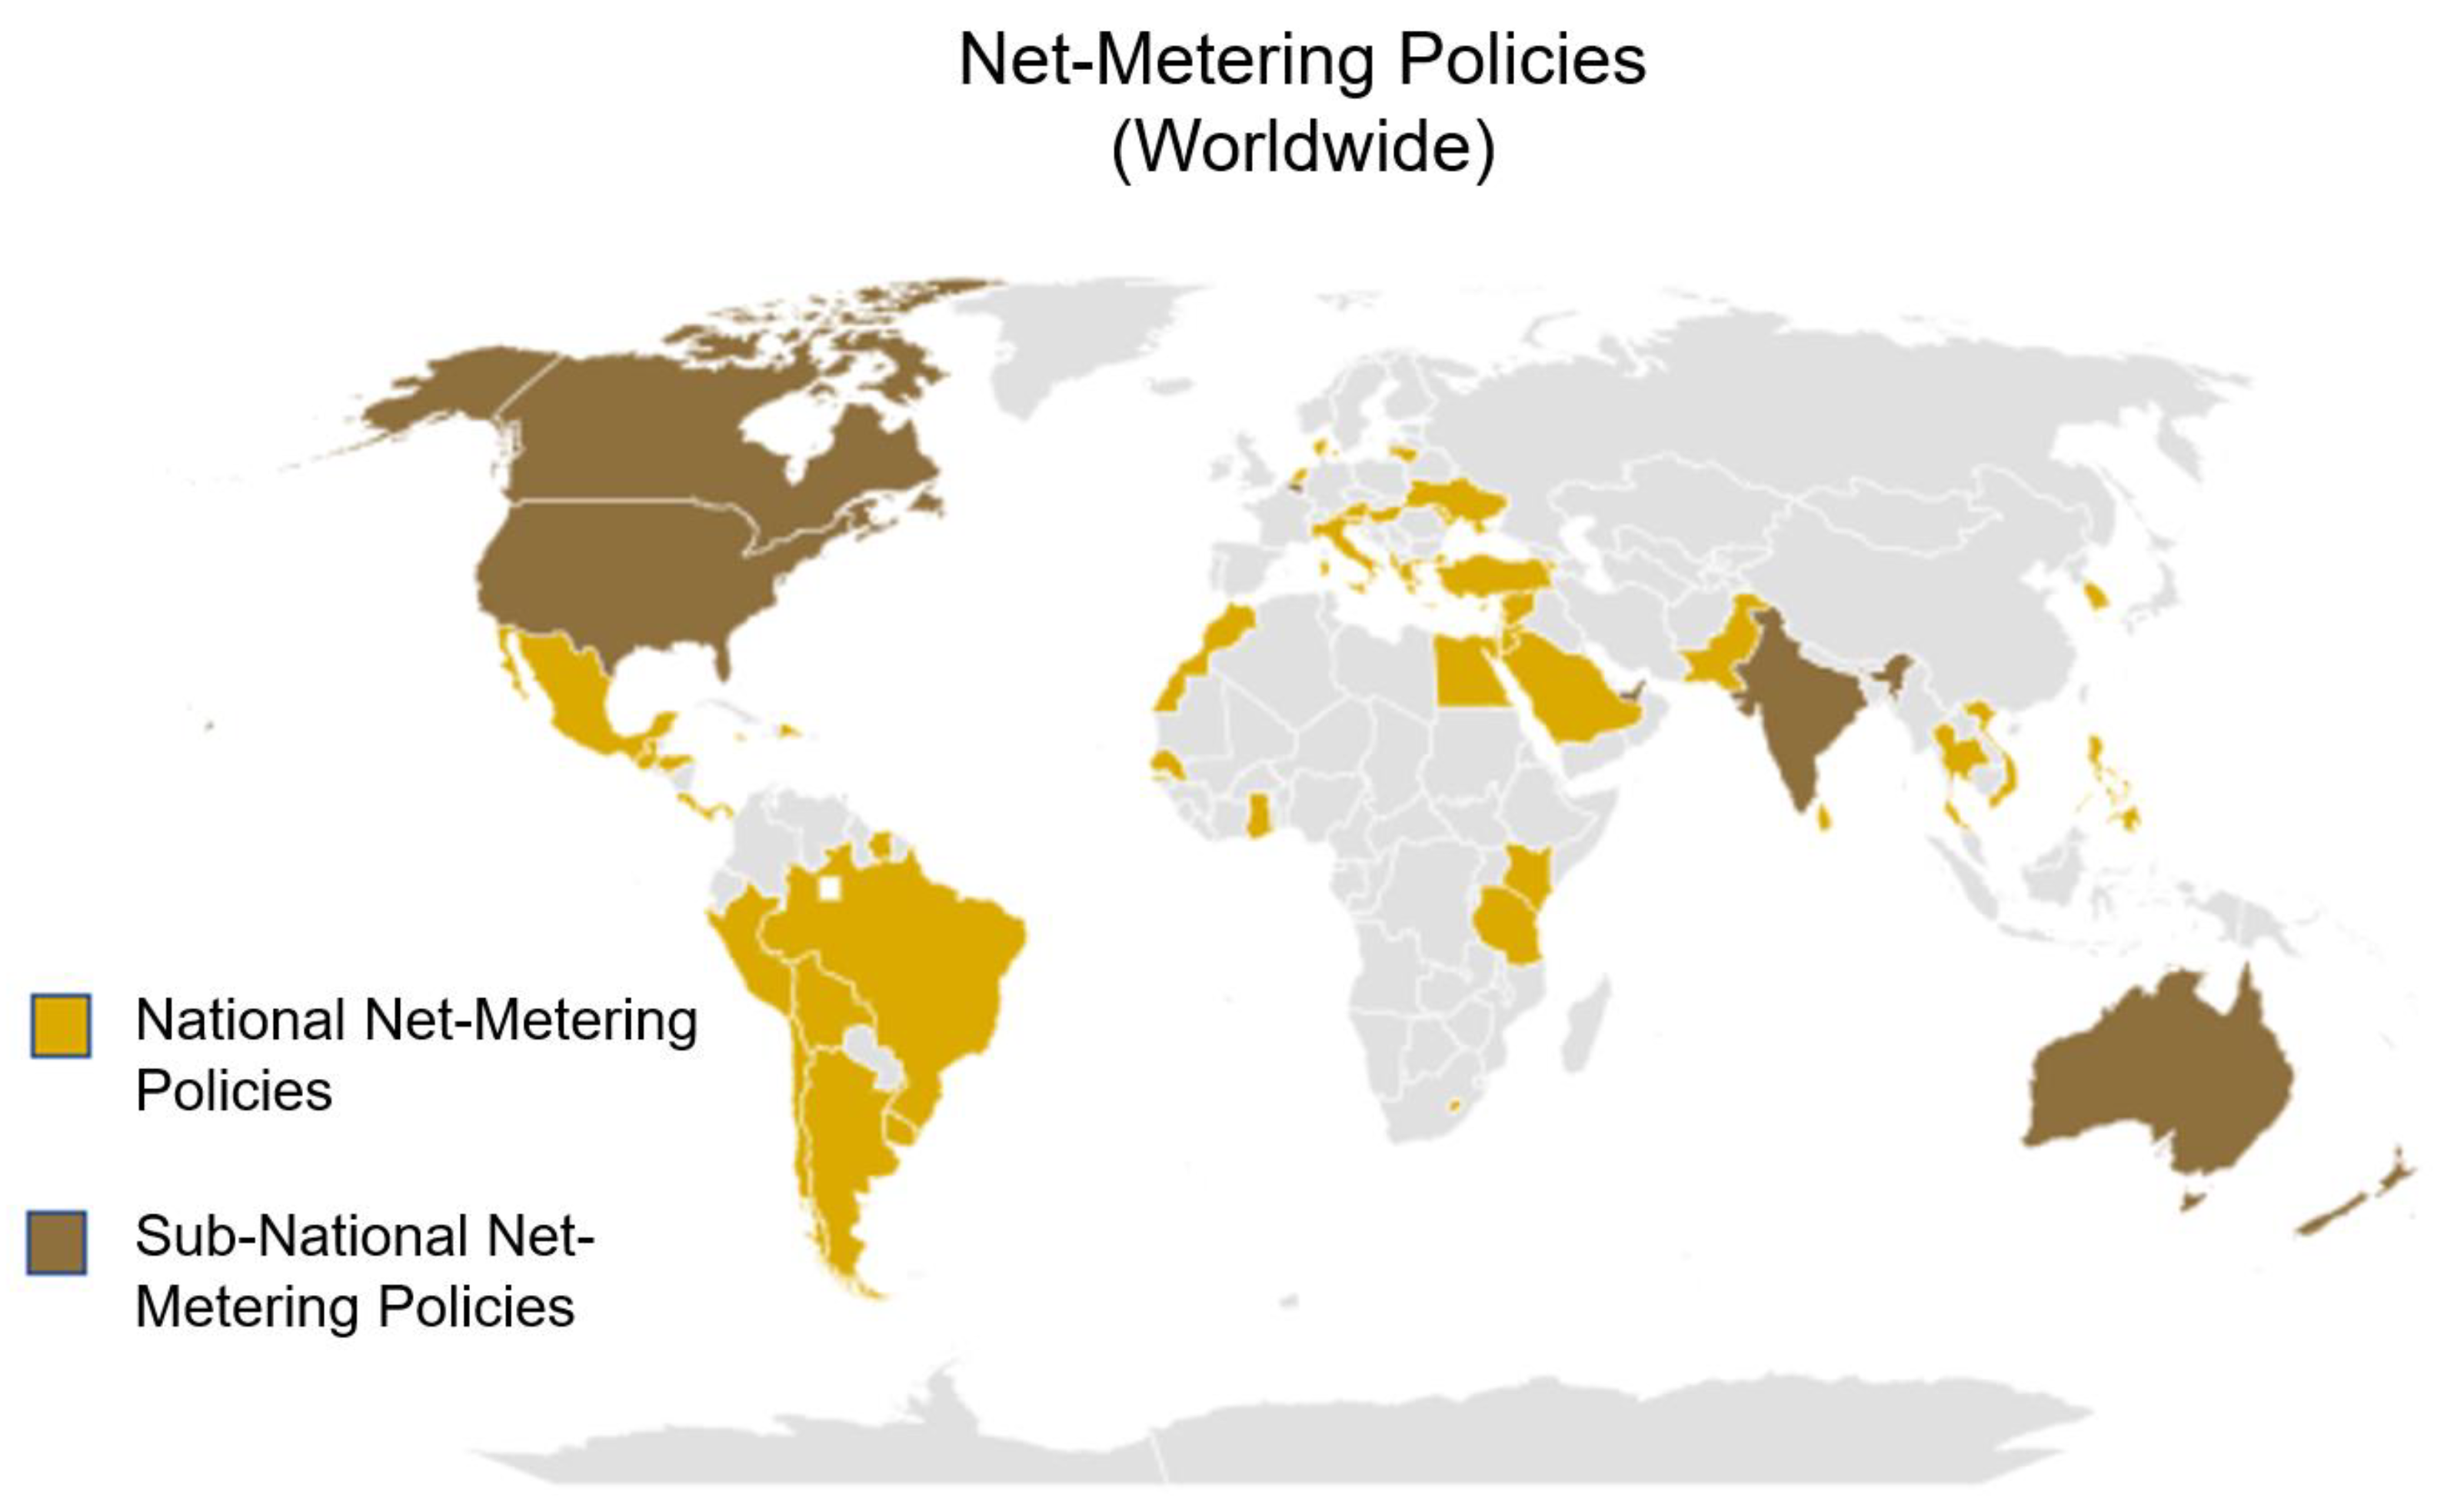
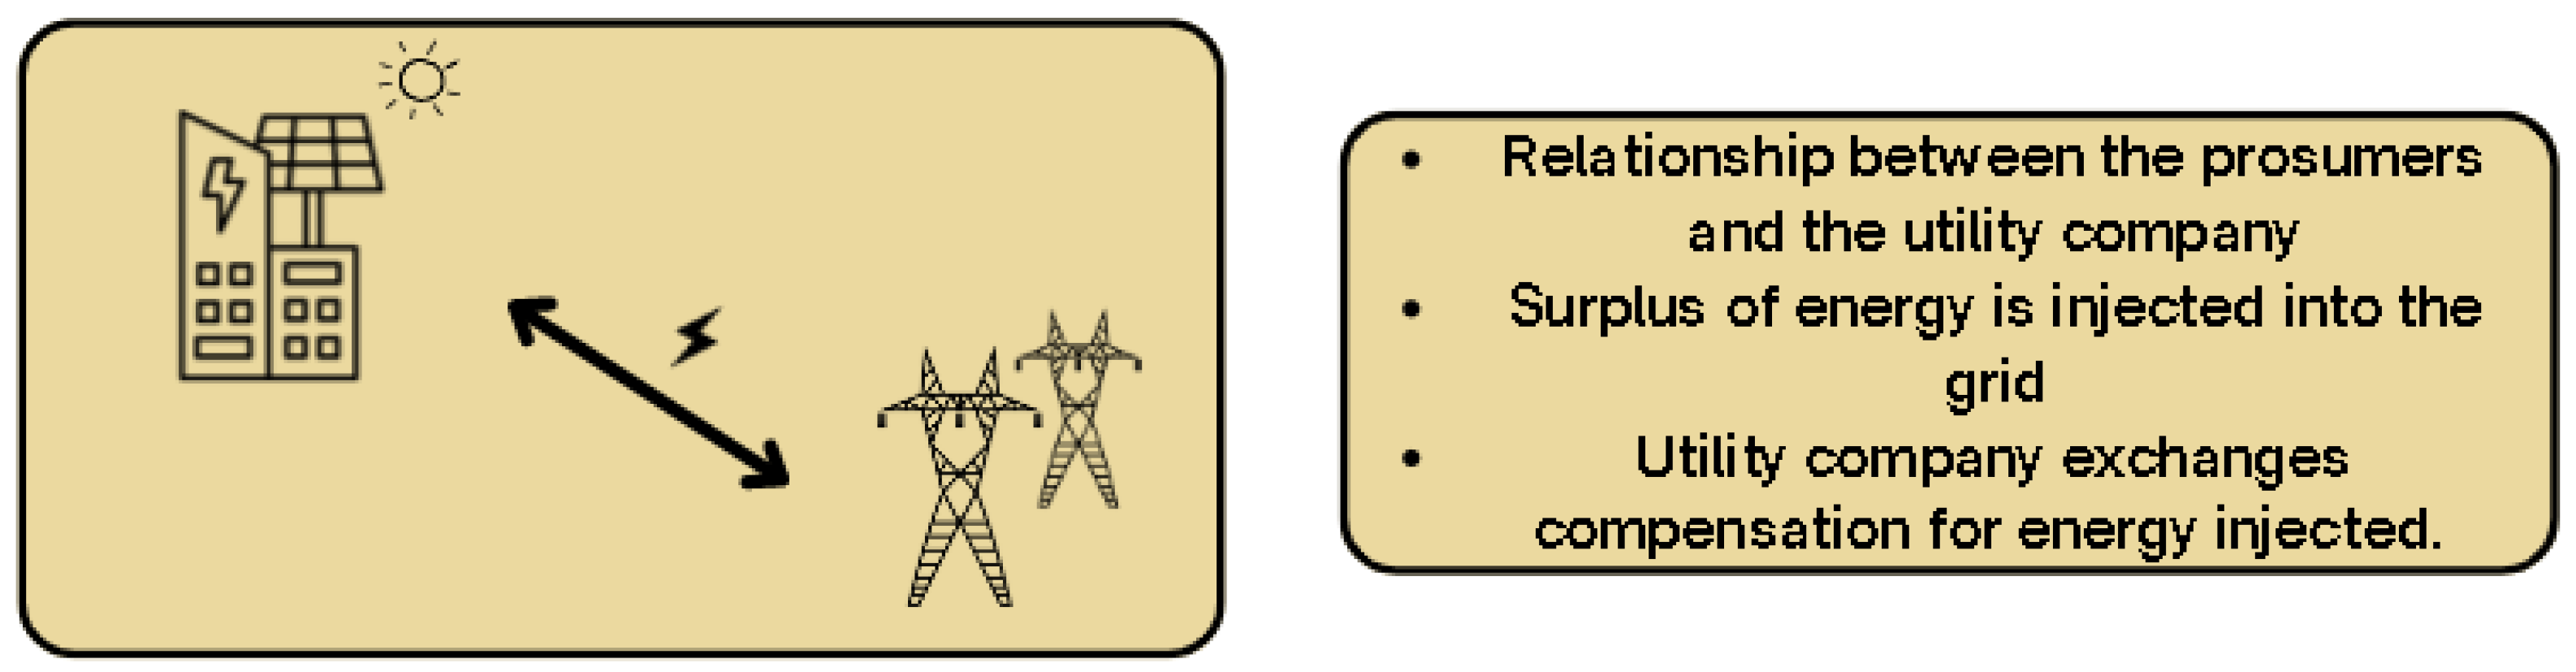
2.1. Net-Metering
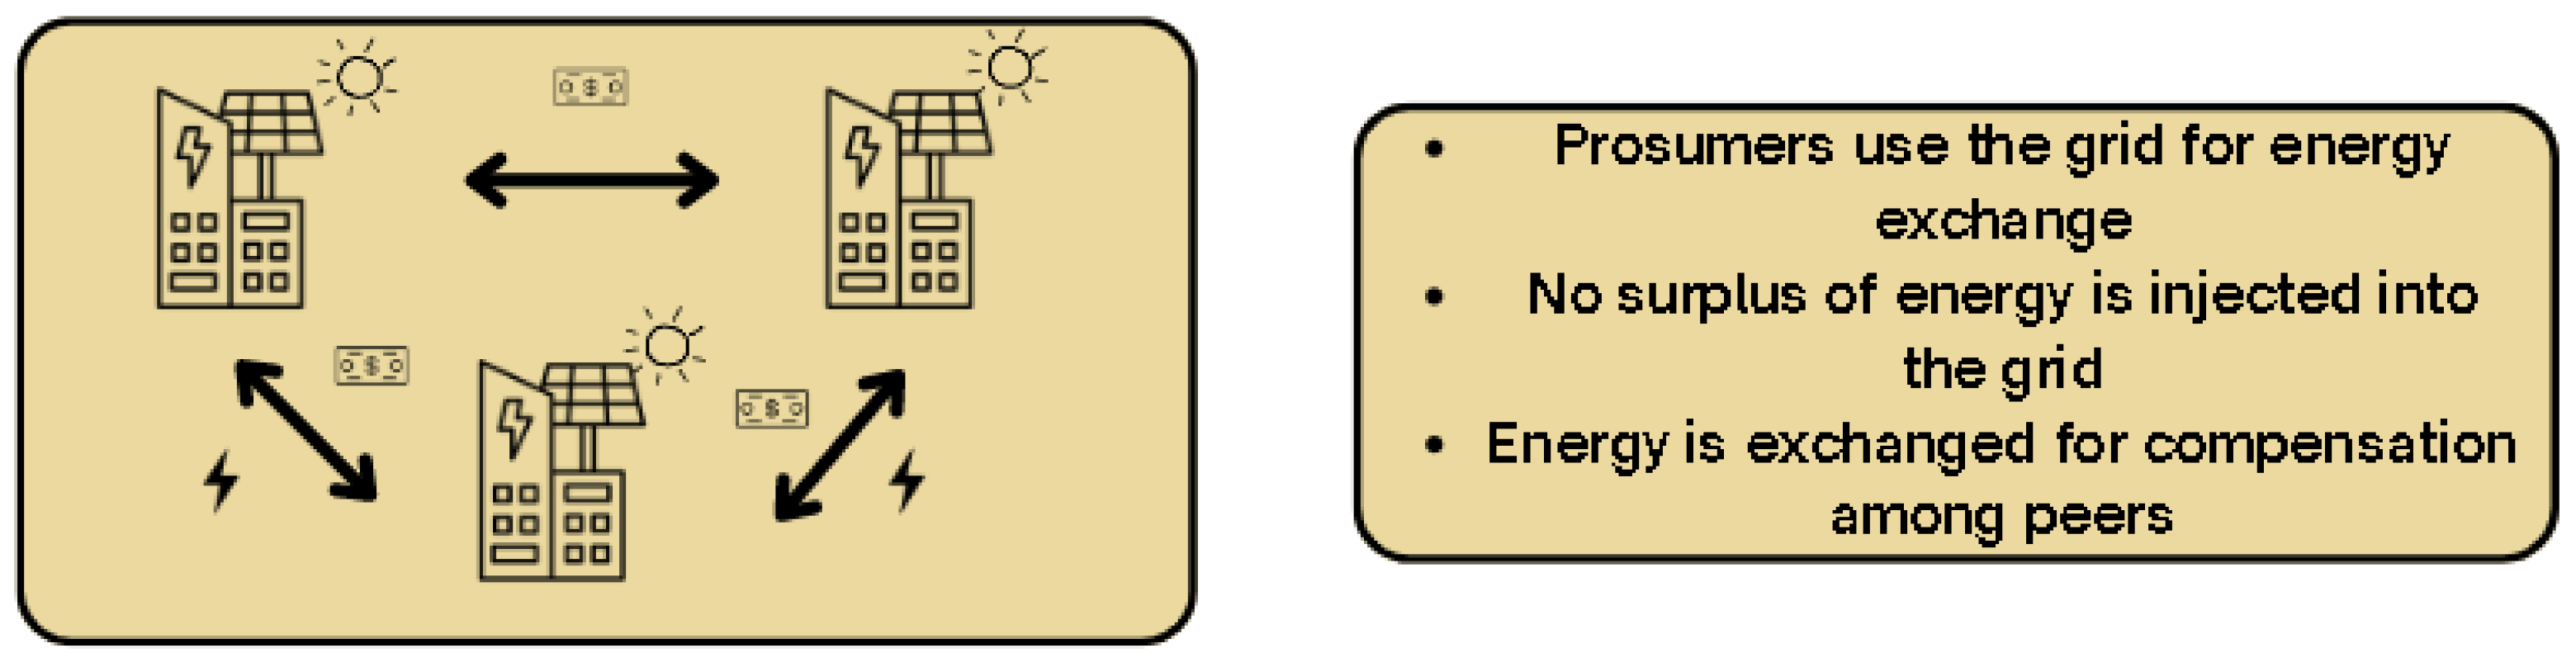
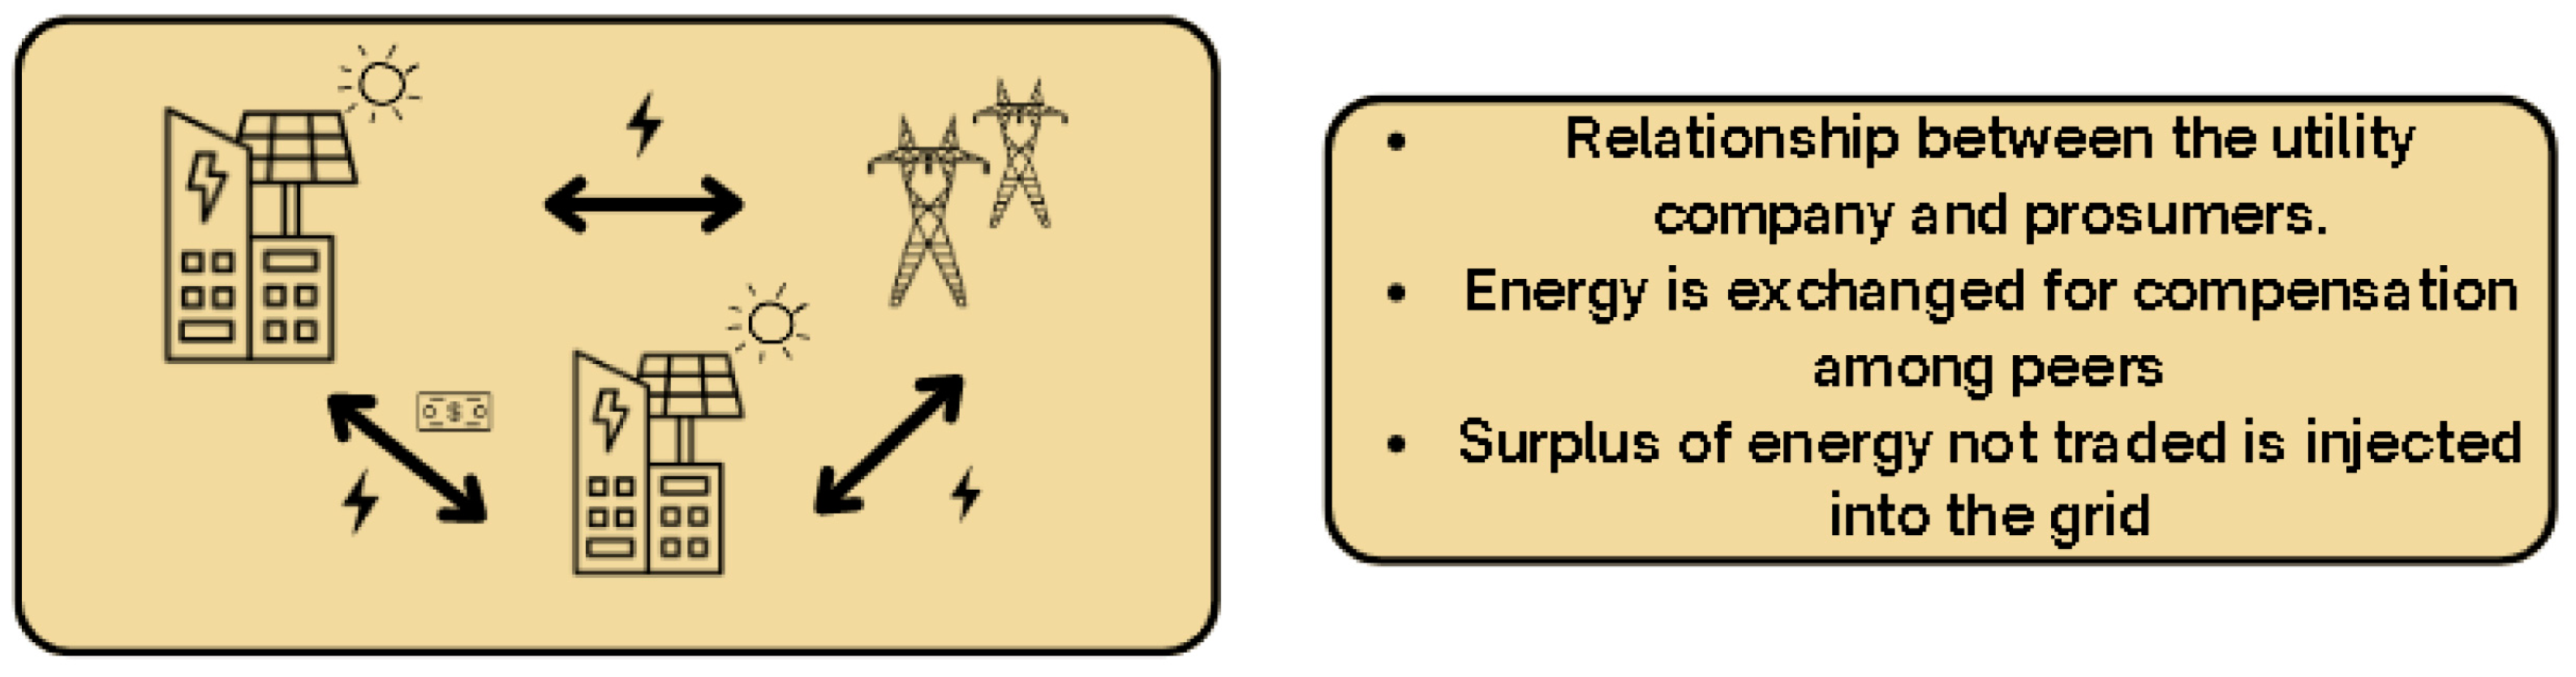
2.2. P2P Commercial Area
3. Methods
3.1. Simulation Models
3.2. Indexes
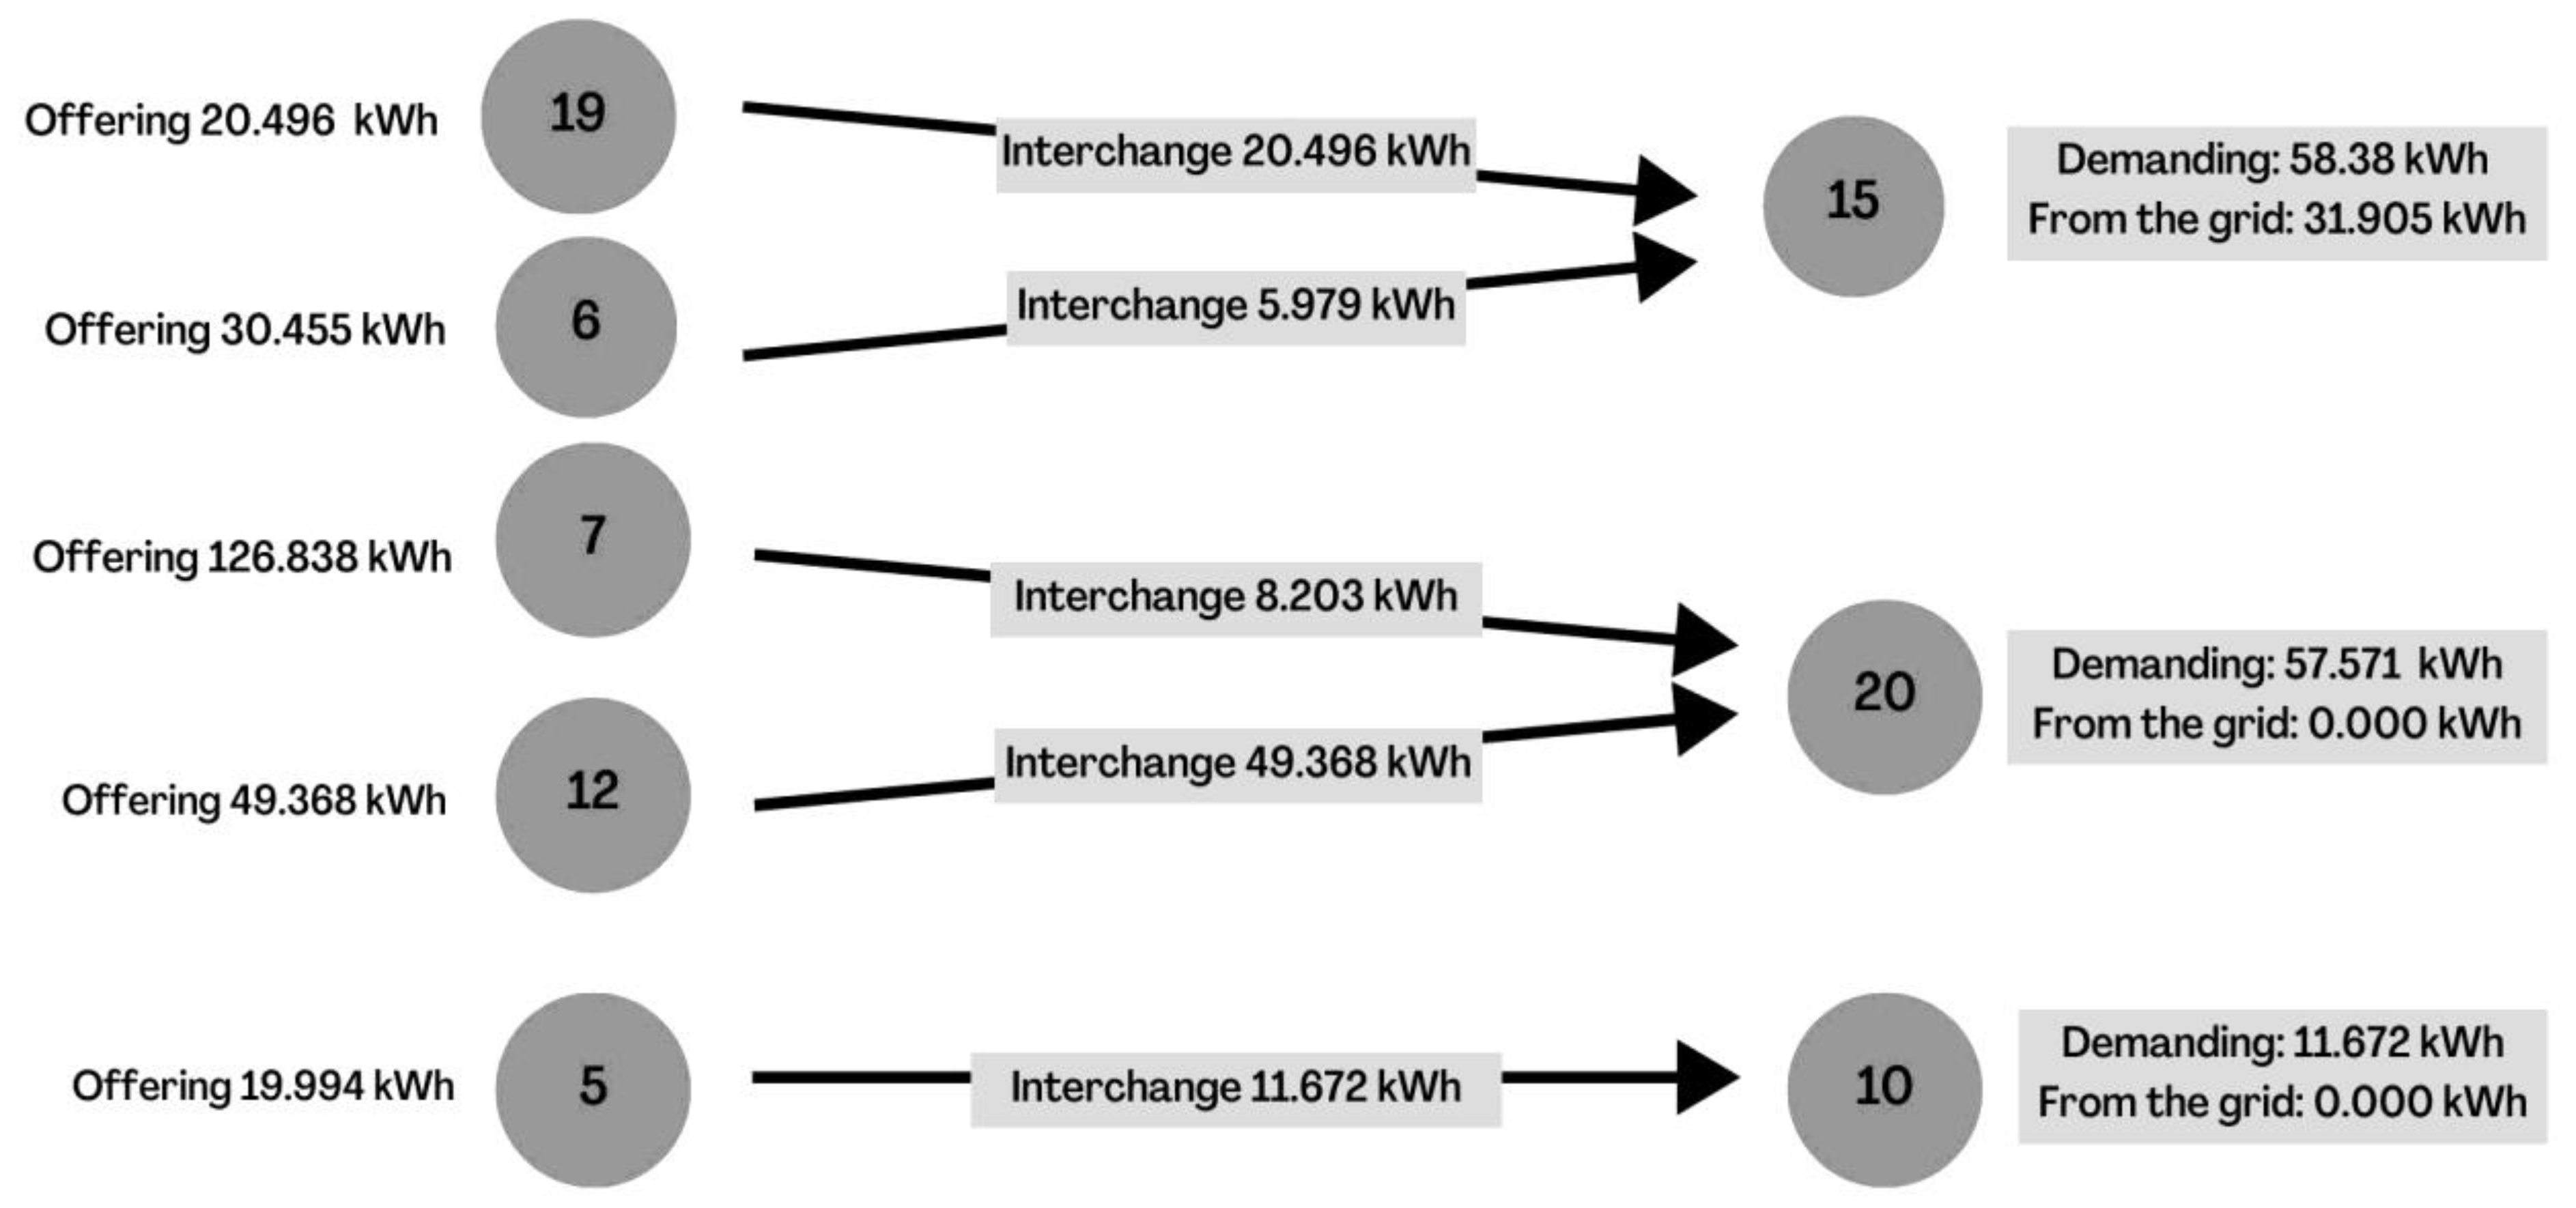
3.3. Study Design
3.4. Data Analysis
4. Results
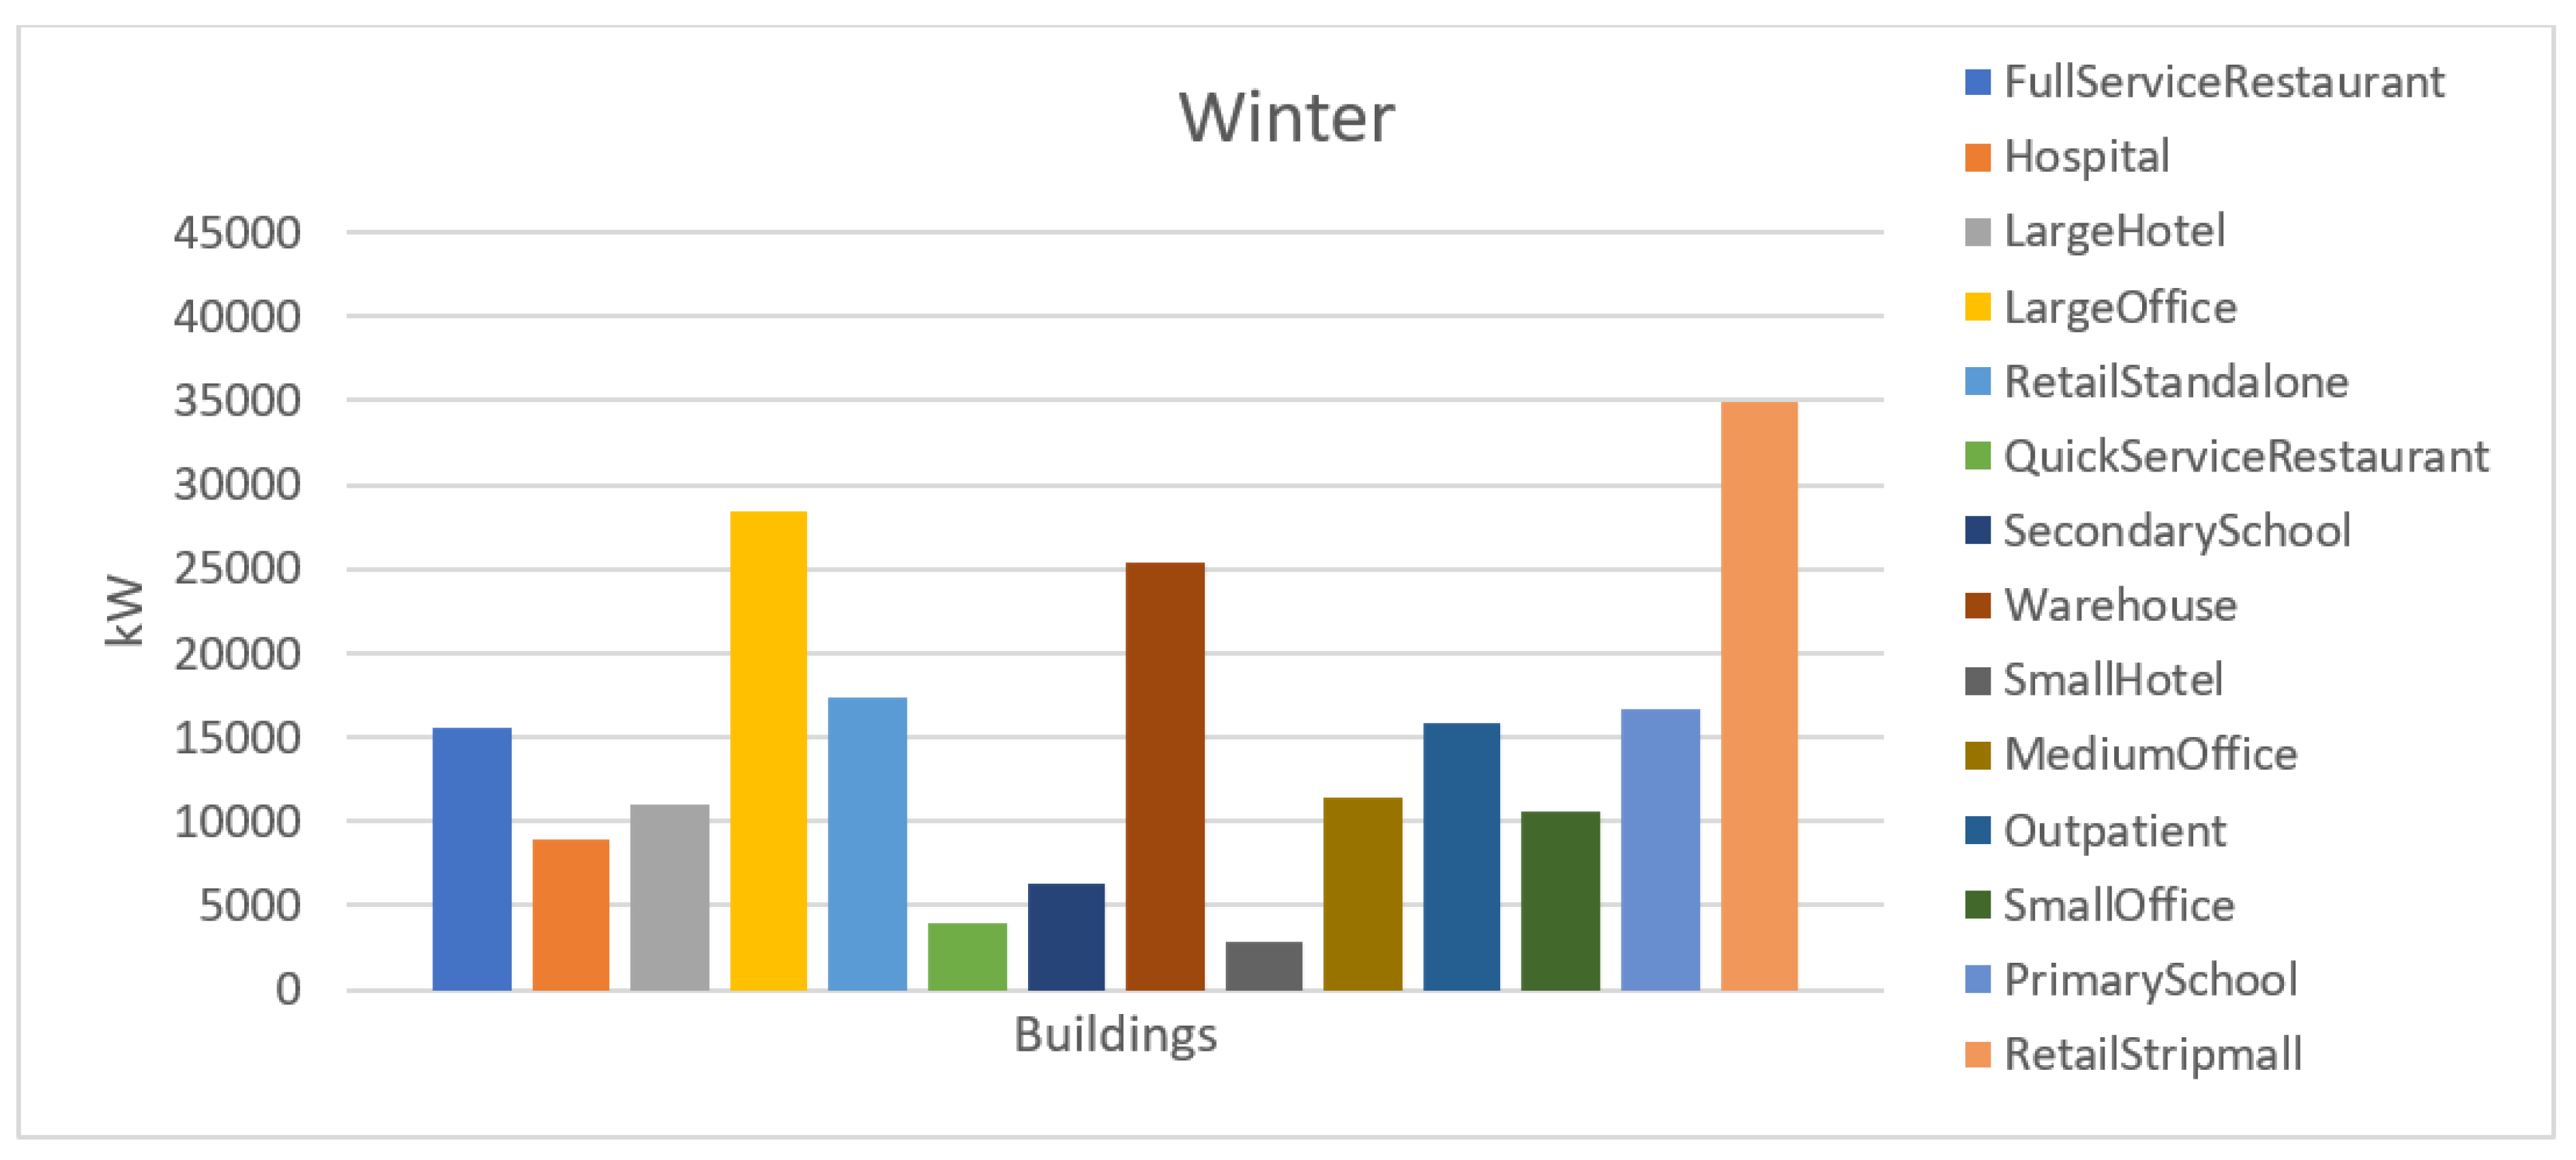
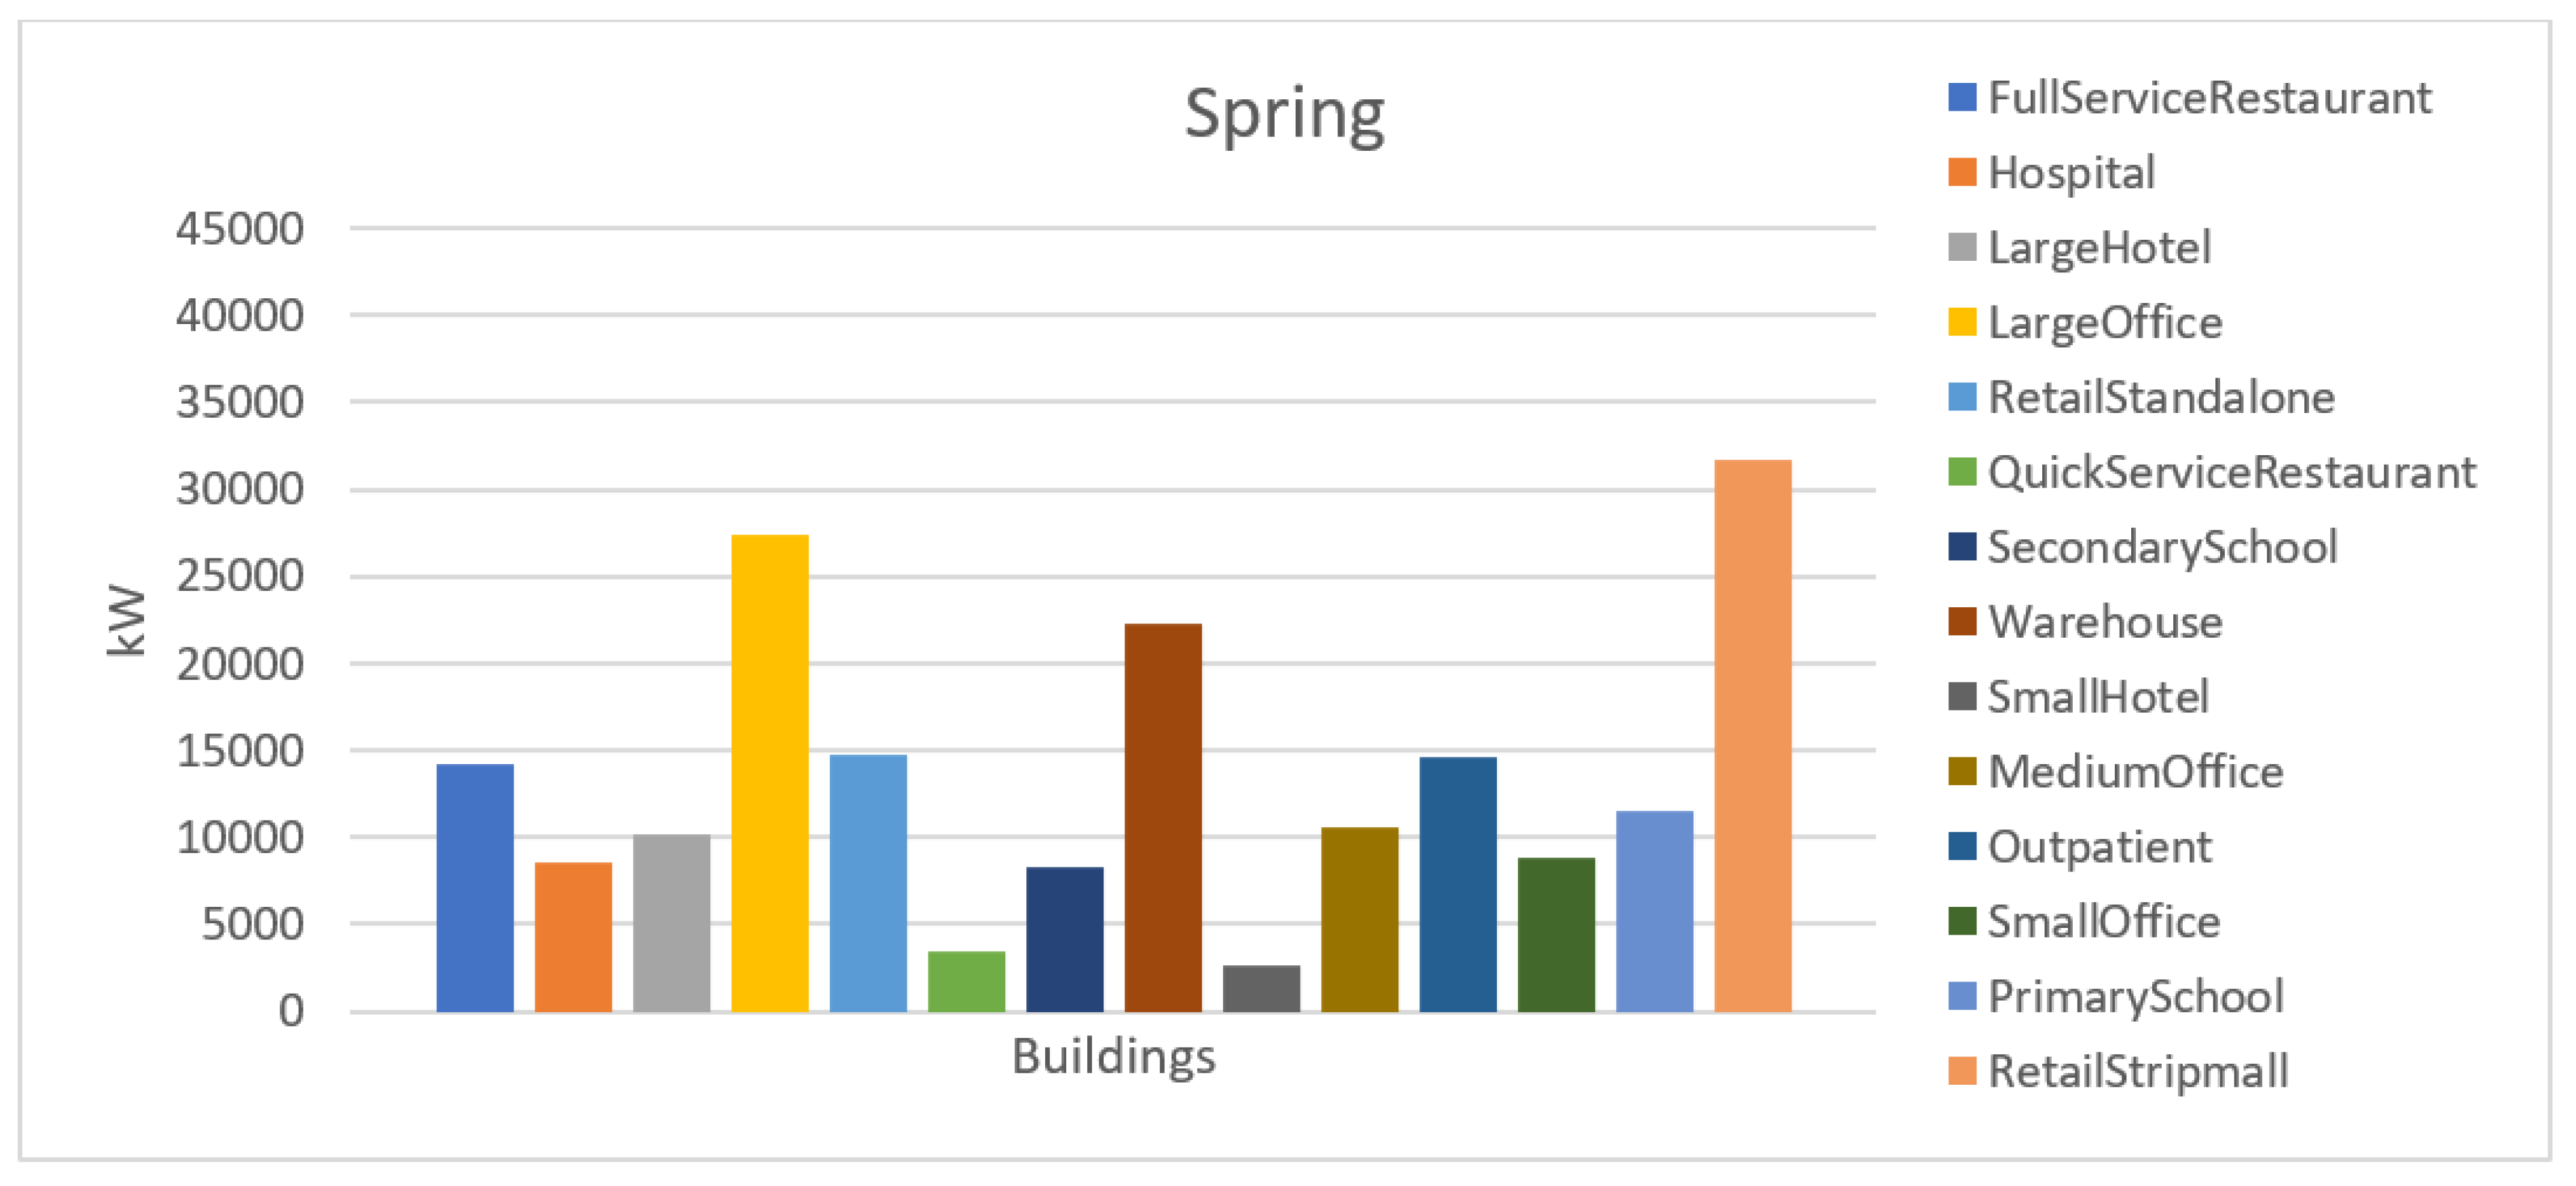
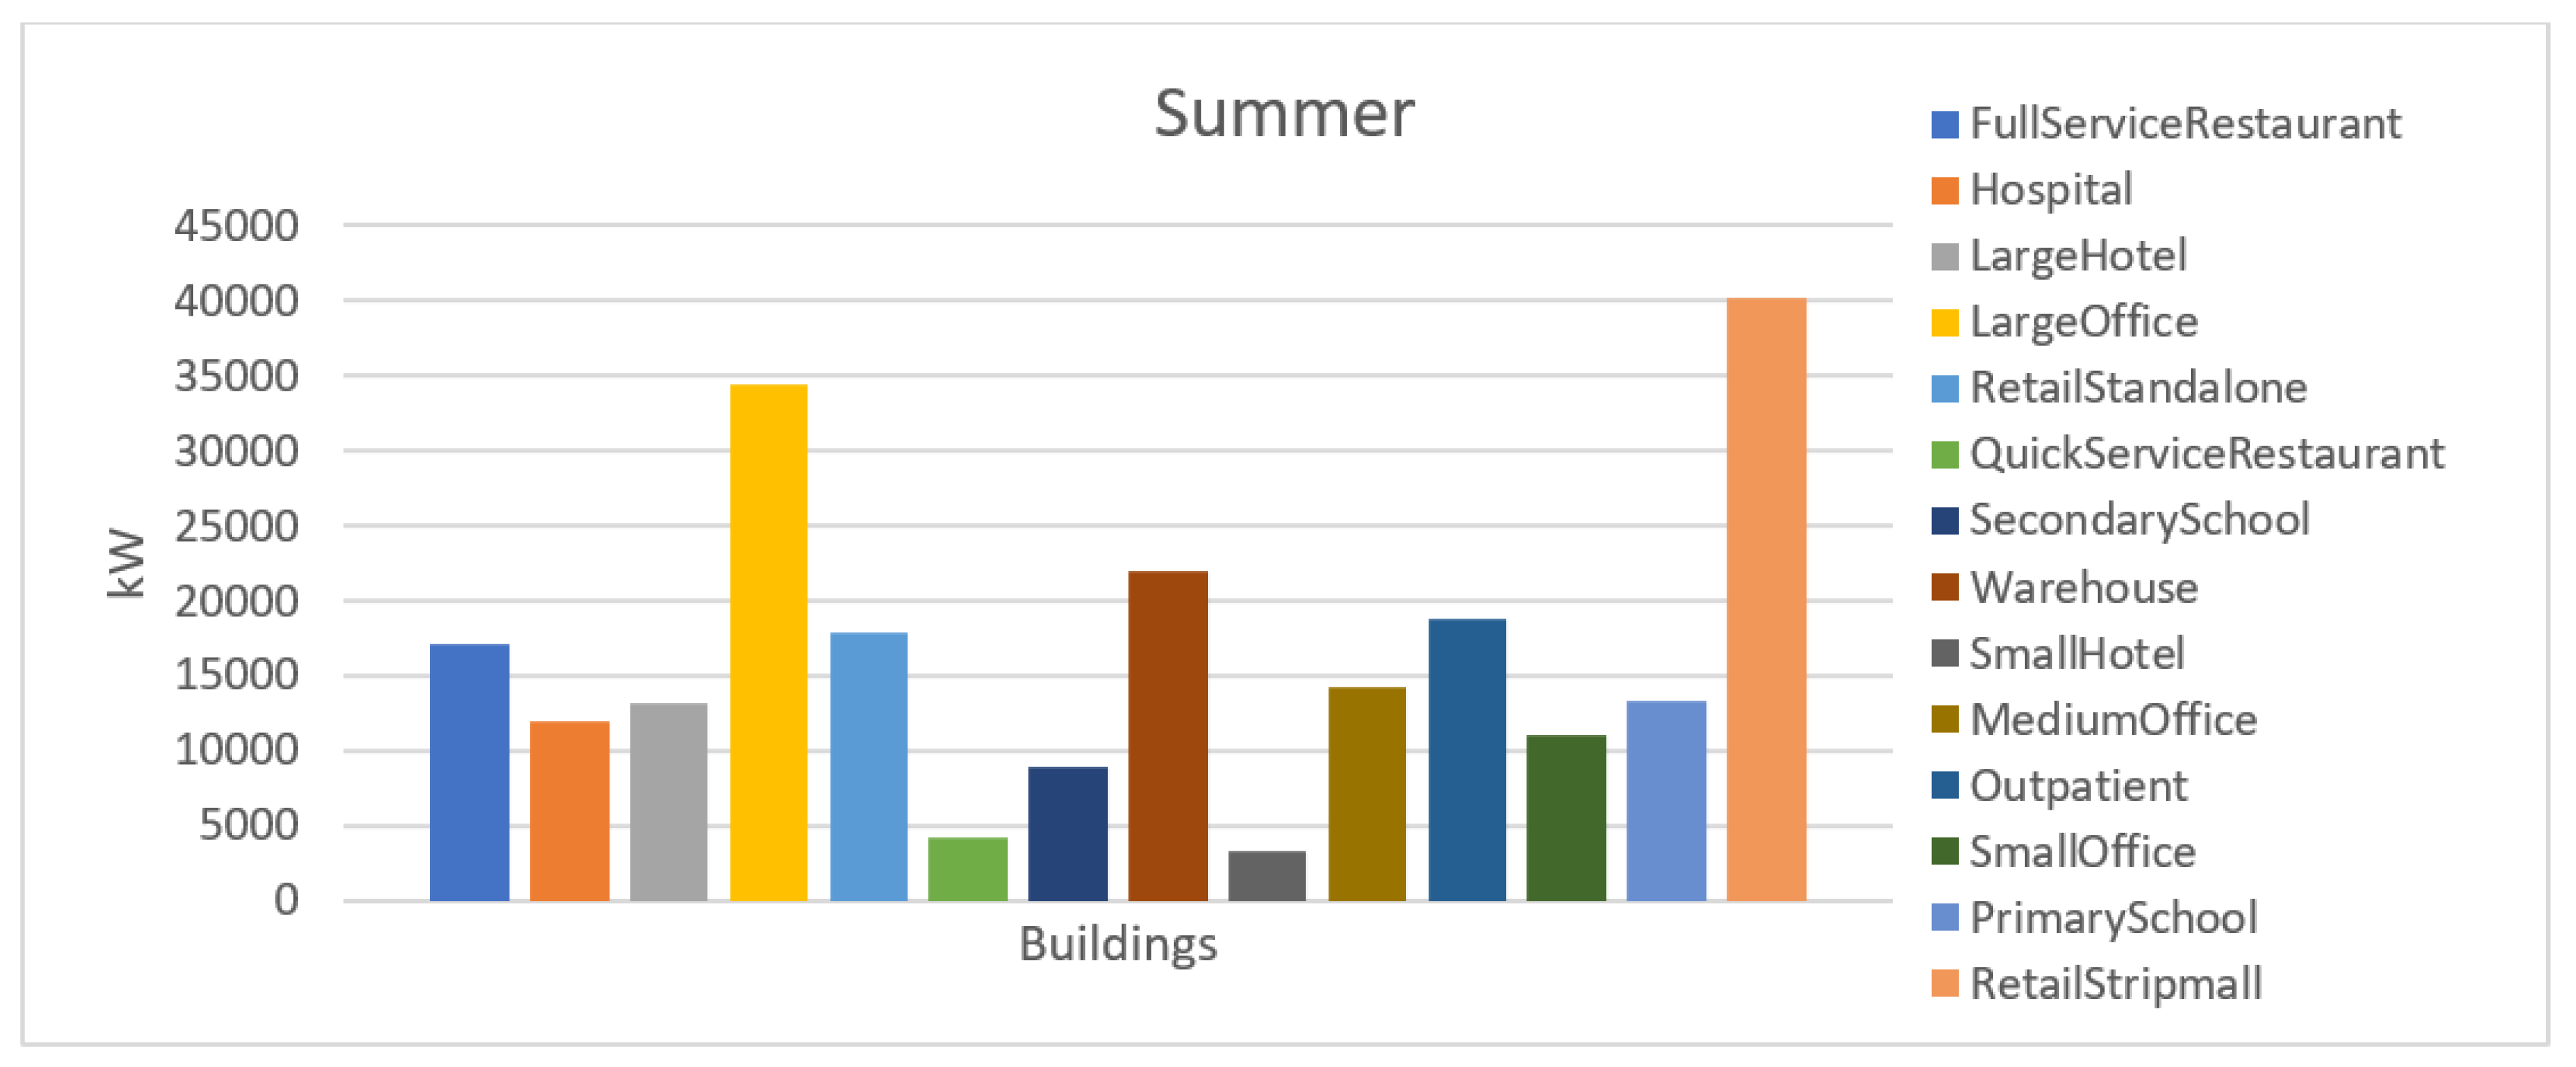
4.1. Consumption Profiles
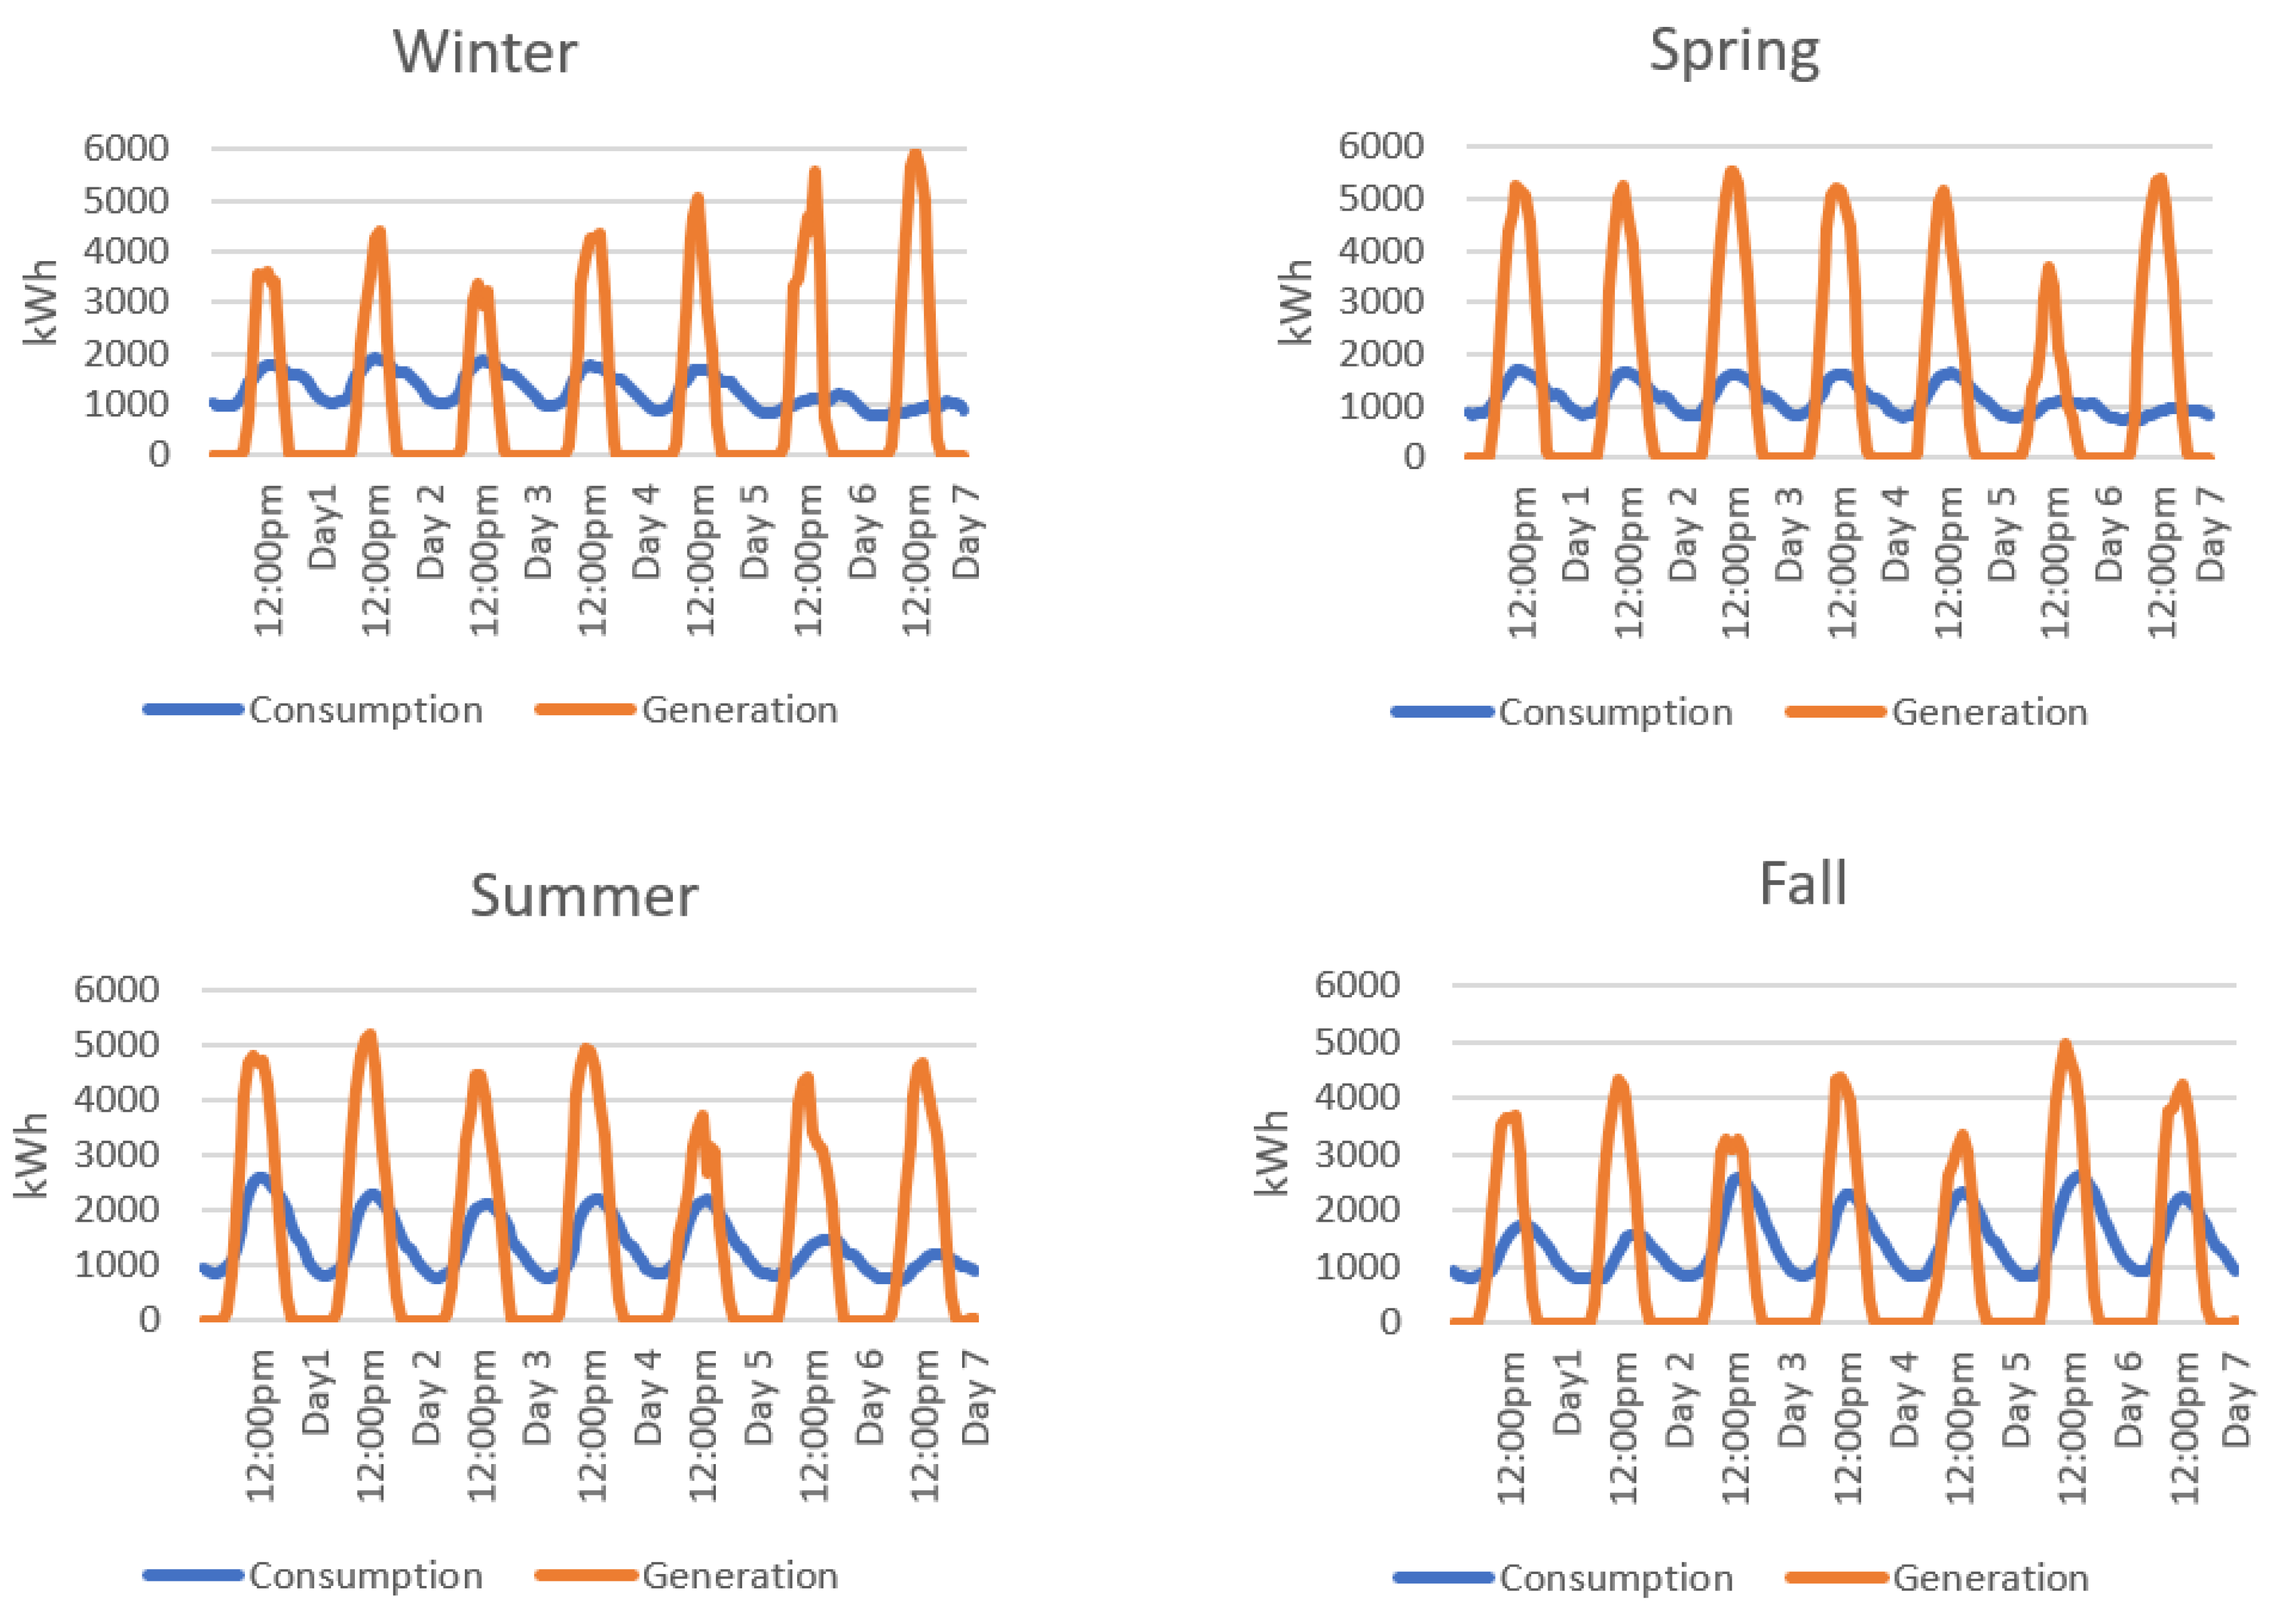
4.2. Consumption and Generation Profiles
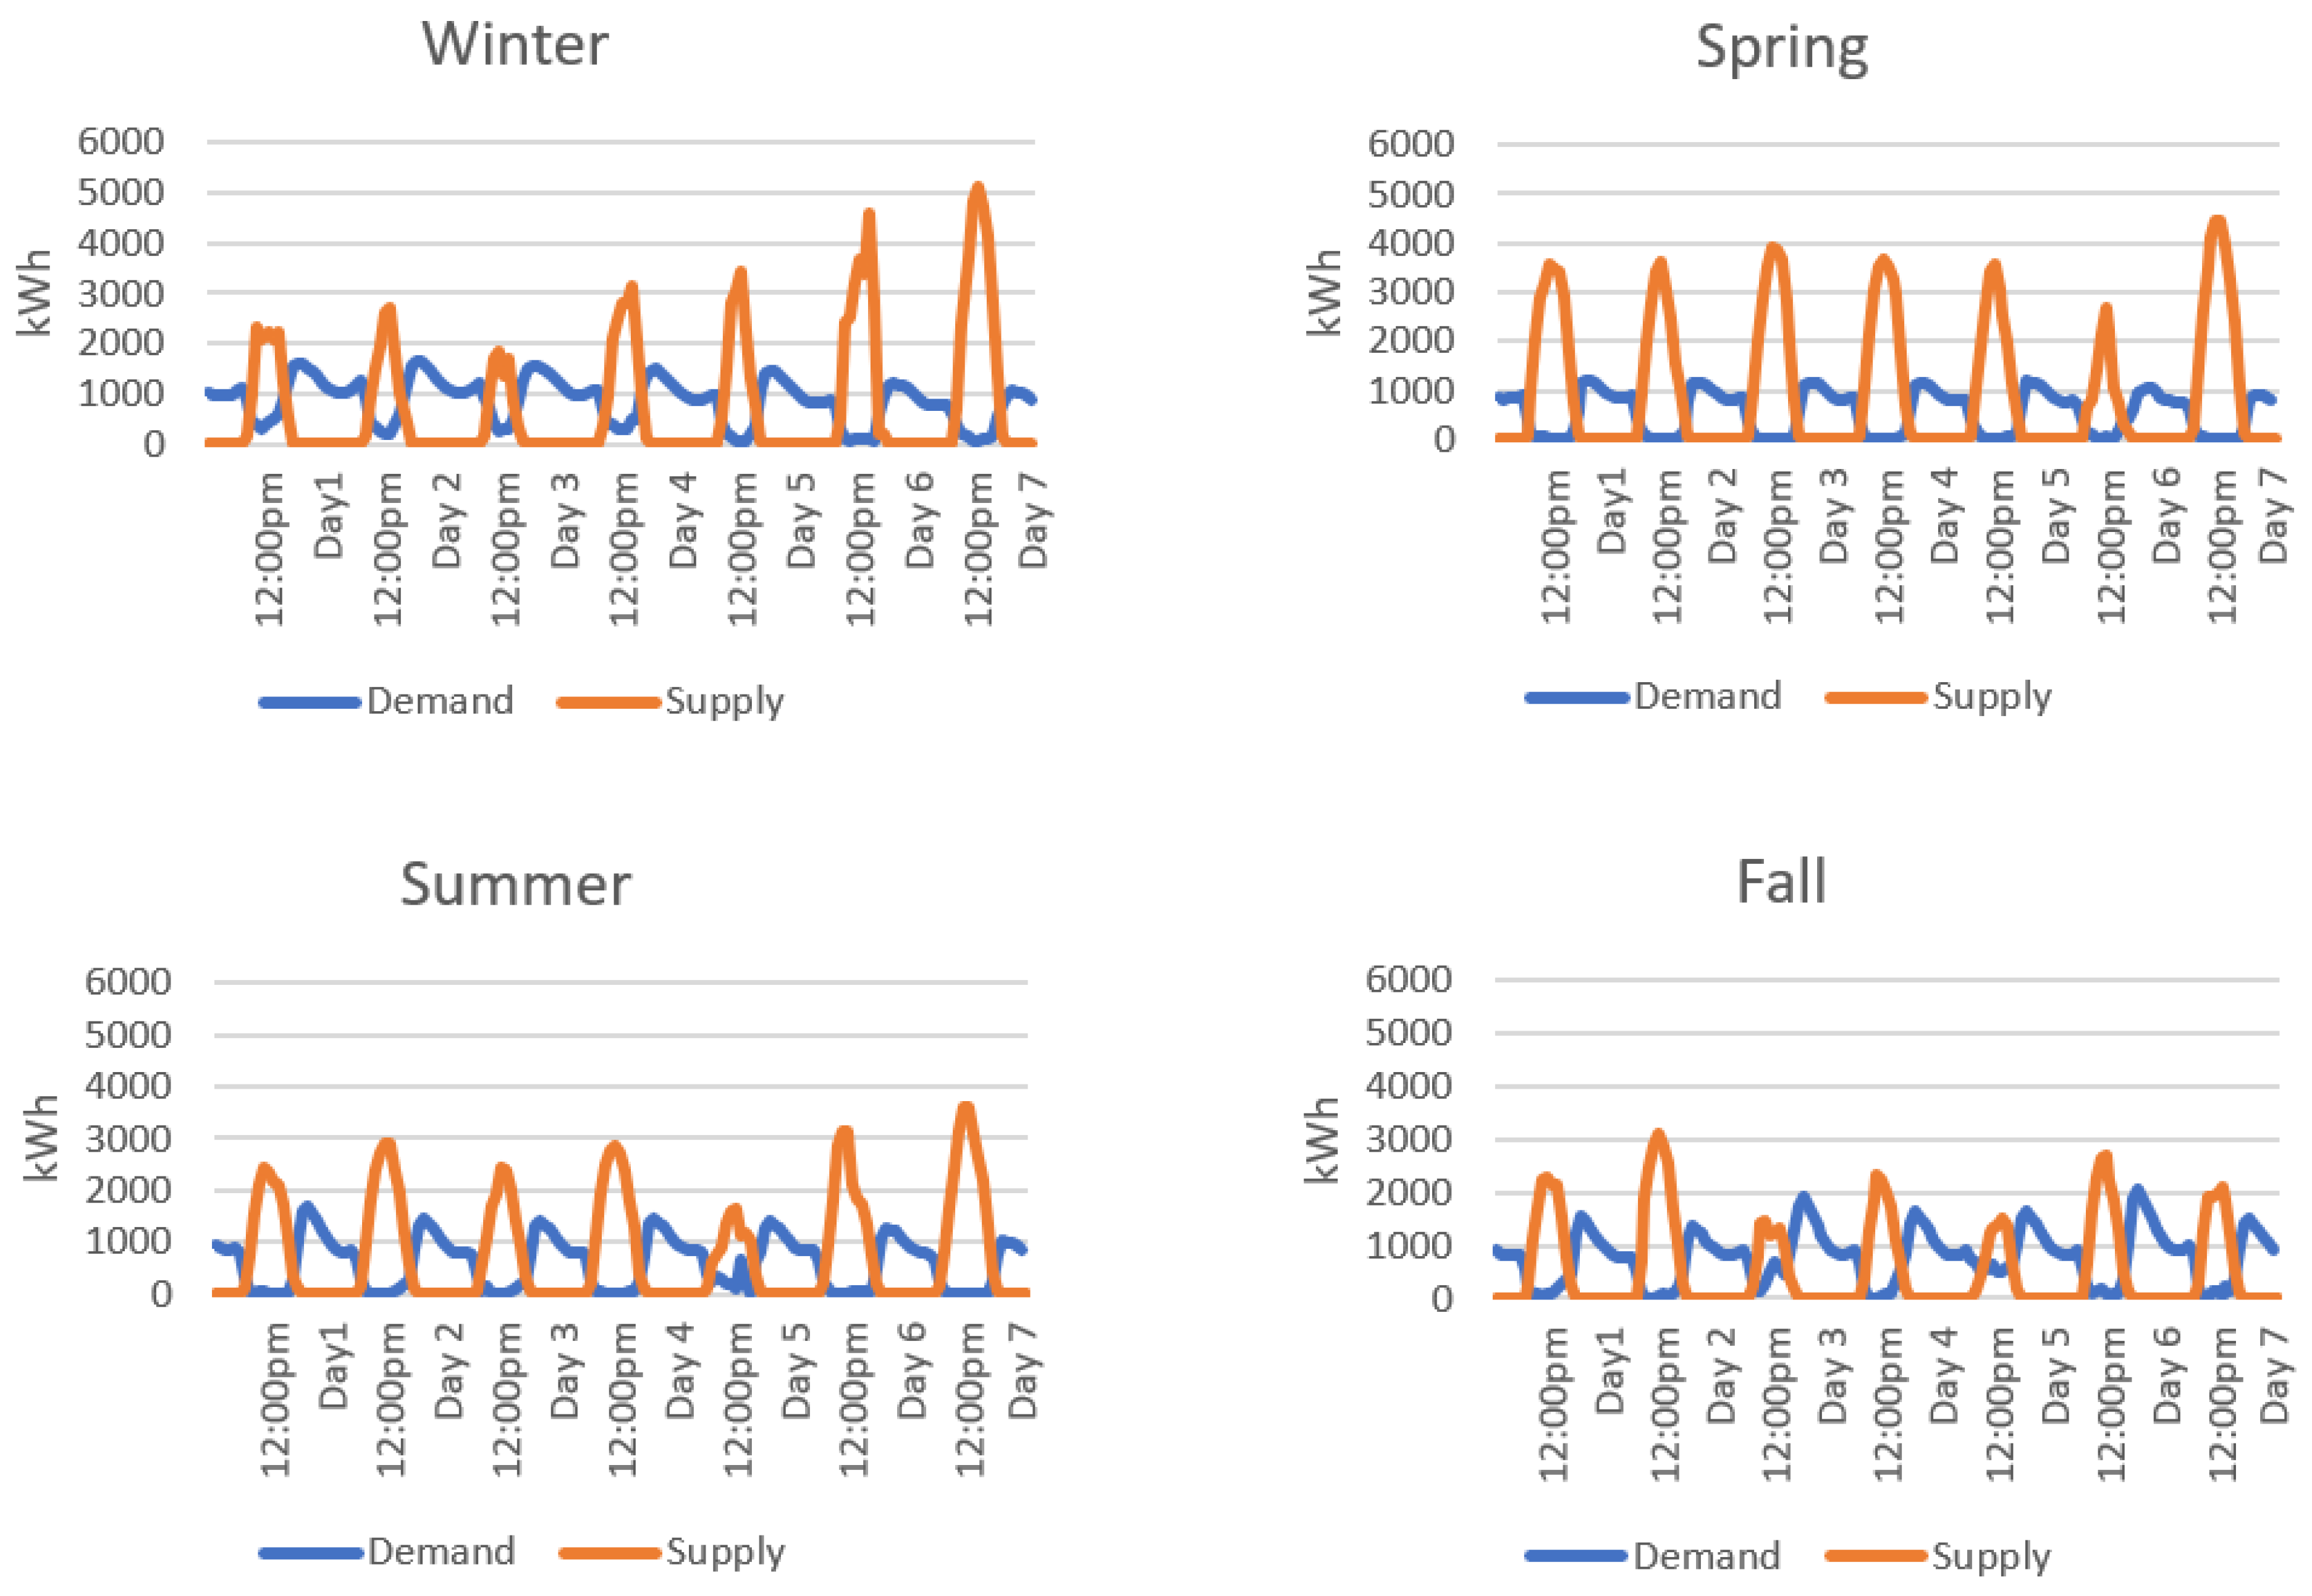
4.3. Supply and Demand of Energy
4.4. Technical and Economic Indexes
5. Discussion
5.1. General Discussion
5.2. Limitations and Future Research
6. Conclusions
Author Contributions
Funding
Data Availability Statement
Conflicts of Interest
References
- Association, Stockholm Environment Institute. Solar Industry Research Data. Available online: https://www.sei.org/ (accessed on 14 June 2022).
- Soto, E.A.; Bosman, L.B.; Wollega, E.; Leon-Salas, W.D. Comparison of net-metering with peer-to-peer models using the grid and electric vehicles for the electricity exchange. Appl. Energy 2022, 310, 118562. [Google Scholar] [CrossRef]
- Roux, A.; Shanker, A. Net Metering and PV Self-Consumption in Emerging Countries; International Energy Agency: Paris, France, 2018; p. 56. [Google Scholar]
- Murdock, H.E.; Gibb, D.; André, T.; Sawin, J.L.; Brown, A.; Ranalder, L.; Collier, U.; Dent, C.; Epp, B.; Hareesh Kumar, C. Renewables 2021-Global Status Report; REN21: Paris, France, 2021. [Google Scholar]
- Zhang, C.; Wu, J.; Zhou, Y.; Cheng, M.; Long, C. Peer-to-Peer energy trading in a Microgrid. Appl. Energy 2018, 220, 1–12. [Google Scholar] [CrossRef]
- Baez-Gonzalez, P.; Rodriguez-Diaz, E.; Carlini, M.A.R.; Bordons, C. A power P2P market framework to boost renewable energy exchanges in local microgrids. In Proceedings of the 2019 International Conference on Smart Energy Systems and Technologies (SEST), Porto, Portugal, 9–11 September 2019; pp. 1–6. [Google Scholar]
- Wang, Z.; Yu, X.; Mu, Y.; Jia, H. A distributed Peer-to-Peer energy transaction method for diversified prosumers in Urban Community Microgrid System. Appl. Energy 2020, 260, 114327. [Google Scholar] [CrossRef]
- Poullikkas, A.; Kourtis, G.; Hadjipaschalis, I. A review of net metering mechanism for electricity renewable energy sources. Int. J. Energy Environ. (Print) 2013, 4, 975–1002. [Google Scholar]
- Barnes, C. Aggregate Net Metering: Opportunities for Local Governments; North Carolina Solar Center: Raleigh, NC, USA. Available online: http://communitypowernetwork.com/sites/default/files/Aggregate-Net-Metering-2013 (accessed on 14 June 2022).
- Smith, K.M.; Koski, C.; Siddiki, S. Regulating net metering in the United States: A landscape overview of states’ net metering policies and outcomes. Electr. J. 2021, 34, 106901. [Google Scholar] [CrossRef]
- Thakur, J.; Chakraborty, B. Impact of compensation mechanisms for PV generation on residential consumers and shared net metering model for developing nations: A case study of India. J. Clean. Prod. 2019, 218, 696–707. [Google Scholar] [CrossRef]
- Sajjad, I.A.; Manganelli, M.; Martirano, L.; Napoli, R.; Chicco, G.; Parise, G. Net-metering benefits for residential customers: The economic advantages of a proposed user-centric model in Italy. IEEE Ind. Appl. Mag. 2018, 24, 39–49. [Google Scholar] [CrossRef]
- Martín, H.; de la Hoz, J.; Aliana, A.; Coronas, S.; Matas, J. Analysis of the net metering schemes for PV self-consumption in Denmark. Energies 2021, 14, 1990. [Google Scholar] [CrossRef]
- Dusonchet, L.; Telaretti, E. Comparative economic analysis of support policies for solar PV in the most representative EU countries. Renew. Sustain. Energy Rev. 2015, 42, 986–998. [Google Scholar] [CrossRef]
- Brown, D.P.; Sappington, D.E. Designing compensation for distributed solar generation: Is net metering ever optimal? Energy J. 2017, 38. [Google Scholar] [CrossRef]
- Junlakarn, S.; Kokchang, P.; Audomvongseree, K. Drivers and Challenges of Peer-to-Peer Energy Trading Development in Thailand. Energies 2022, 15, 1229. [Google Scholar] [CrossRef]
- Zhang, H.; Zhang, S.; Hu, X.; Cheng, H.; Gu, Q.; Du, M. Parametric optimization-based peer-to-peer energy trading among commercial buildings considering multiple energy conversion. Appl. Energy 2022, 306, 118040. [Google Scholar] [CrossRef]
- Zhou, Y.; Wu, J.; Long, C.; Ming, W. State-of-the-art analysis and perspectives for peer-to-peer energy trading. Engineering 2020, 6, 739–753. [Google Scholar] [CrossRef]
- Zhang, C.; Wu, J.; Long, C.; Cheng, M. Review of existing peer-to-peer energy trading projects. Energy Procedia 2017, 105, 2563–2568. [Google Scholar] [CrossRef]
- Inês, C.; Guilherme, P.L.; Esther, M.-G.; Swantje, G.; Stephen, H.; Lars, H. Regulatory challenges and opportunities for collective renewable energy prosumers in the EU. Energy Policy 2020, 138, 111212. [Google Scholar] [CrossRef]
- Soto, E.A.; Bosman, L.B.; Wollega, E.; Leon-Salas, W.D. Peer-to-peer energy trading: A review of the literature. Appl. Energy 2021, 283, 116268. [Google Scholar] [CrossRef]
- Jing, R.; Xie, M.N.; Wang, F.X.; Chen, L.X. Fair P2P energy trading between residential and commercial multi-energy systems enabling integrated demand-side management. Appl. Energy 2020, 262, 114551. [Google Scholar] [CrossRef]
- Tushar, W.; Yuen, C.; Saha, T.K.; Morstyn, T.; Chapman, A.C.; Alam, M.J.E.; Hanif, S.; Poor, H.V. Peer-to-peer energy systems for connected communities: A review of recent advances and emerging challenges. Appl. Energy 2021, 282, 116131. [Google Scholar] [CrossRef]
- Wilson, E. End-Use Load Profiles for the U.S. Building Stock. National Renewable Energy Laboratory (NREL). 2021. Available online: https://data.openei.org/submissions/4520 (accessed on 14 October 2021).
- Laboratory, National Renewable Energy. PVWatts Calculator. Available online: https://pvwatts.nrel.gov/ (accessed on 14 June 2022).
- EIA. Electric Power Monthly-Average Price of Electricity to Ultimate Customers by End-Use Sector, by State. Available online: https://www.eia.gov/electricity/data.php (accessed on 15 July 2022).
- Kiedanski, D.; Kofman, D.; Horta, J. Pymarket-a simple library for simulating markets in python. J. Open Source Softw. 2020, 5, 1591. [Google Scholar] [CrossRef]
- Blouin, M.R.; Serrano, R. A decentralized market with common values uncertainty: Non-steady states. Rev. Econ. Stud. 2001, 68, 323–346. [Google Scholar] [CrossRef]
- Mengelkamp, E.; Staudt, P.; Garttner, J.; Weinhardt, C. Trading on local energy markets: A comparison of market designs and bidding strategies. In Proceedings of the 2017 14th International Conference on the European Energy Market (EEM), Dresden, Germany, 6–9 June 2017; pp. 1–6. [Google Scholar]
- Kiedanski, D. Mechanisms and Architectures to Encourage the Massive and Efficient Use of Local Renewable Energy. Ph.D. Thesis, Institut Polytechnique de Paris, Paris, France, 2020. [Google Scholar]
- Pranadi, A.D.; Setiawan, E. Cost benefit analysis for peer-to-peer mechanism in residential sector of a single buyer electricity market. J. Energy Syst. 2020, 4, 179–195. [Google Scholar] [CrossRef]
- Long, C.; Wu, J.; Zhou, Y.; Jenkins, N. Peer-to-peer energy sharing through a two-stage aggregated battery control in a community Microgrid. Appl. Energy 2018, 226, 261–276. [Google Scholar] [CrossRef]
- An, J.; Lee, M.; Yeom, S.; Hong, T. Determining the Peer-to-Peer electricity trading price and strategy for energy prosumers and consumers within a microgrid. Appl. Energy 2020, 261, 114335. [Google Scholar] [CrossRef]
- Hutty, T.D.; Pena-Bello, A.; Dong, S.; Parra, D.; Rothman, R.; Brown, S. Peer-to-peer electricity trading as an enabler of increased PV and EV ownership. Energy Convers. Manag. 2021, 245, 114634. [Google Scholar] [CrossRef]
- Shukhobodskiy, A.A.; Zaitcev, A.; Colantuono, G. RED WoLF hybrid energy storage system: Algorithm case study and green competition between storage heaters and heat pump. Energy AI 2023, 14, 100287. [Google Scholar] [CrossRef]
- RED WoLF—Rethink Electricity Distribution Wihout Load Following. Available online: https://vb.nweurope.eu/projects/project-search/red-wolf-rethink-electricity-distribution-without-load-following/ (accessed on 20 August 2023).
- Electricity Maps. Available online: https://app.electricitymaps.com/map (accessed on 20 August 2023).
- Electricity System Operator, National Grid. Carbon Intensity. Available online: https://carbonintensity.org.uk/ (accessed on 20 August 2023).


| Peak of Power (kWh) | P2P | Net Metering | P2P & Net-Metering |
|---|---|---|---|
| Winter | 0.0570 | 0.0570 | 0.0570 |
| Spring | 0 | 0 | 0 |
| Summer | 0.2118 | 0.2118 | 0.2118 |
| Fall | 0.3154 | 0.3154 | 0.3154 |
| Energy Balance | P2P | Net Metering | P2P & Net-Metering |
|---|---|---|---|
| Winter | 0.6917 | 0.6435 | 0.6917 |
| Spring | 0.8126 | 0.8014 | 0.8126 |
| Summer | 0.8125 | 0.7974 | 0.8125 |
| Fall | 0.7470 | 0.7130 | 0.7470 |
| Benefit Index | P2P | Net Metering | P2P & Net-Metering |
|---|---|---|---|
| Winter | 0.1322 | 0.9781 | 0.9941 |
| Spring | 0.0000 | 0.9957 | 0.9989 |
| Summer | 0.0203 | 0.9920 | 0.9979 |
| Fall | 0.1181 | 0.9606 | 0.9924 |
| P2P | P2P & Net-Metering | |||
|---|---|---|---|---|
| Transactions vs. Supply | Transactions vs. Demand | Transactions vs. Supply | Transactions vs. Demand | |
| Winter | 0.1588 | 0.1353 | 0.1588 | 0.1353 |
| Spring | 0.0307 | 0.0563 | 0.0307 | 0.0563 |
| Summer | 0.0575 | 0.0742 | 0.0575 | 0.0742 |
| Fall | 0.1603 | 0.1184 | 0.1603 | 0.1184 |
| Combined Indexes | P2P | Net-Metering | P2P & Net-Metering |
|---|---|---|---|
| Winter | 1.1750 | 1.6786 | 2.0369 |
| Spring | 0.8996 | 1.7971 | 1.8985 |
| Summer | 1.1763 | 2.0012 | 2.1539 |
| Fall | 1.4592 | 1.9890 | 2.3335 |
Disclaimer/Publisher’s Note: The statements, opinions and data contained in all publications are solely those of the individual author(s) and contributor(s) and not of MDPI and/or the editor(s). MDPI and/or the editor(s) disclaim responsibility for any injury to people or property resulting from any ideas, methods, instructions or products referred to in the content. |
© 2023 by the authors. Licensee MDPI, Basel, Switzerland. This article is an open access article distributed under the terms and conditions of the Creative Commons Attribution (CC BY) license (https://creativecommons.org/licenses/by/4.0/).
Share and Cite
Soto, E.A.; Ortega, A.V.; Hernandez, A.; Bosman, L. Commercial Level Analysis of P2P vs. Net-Metering Comparing Economic and Technical Indexes. Eng 2023, 4, 2254-2273. https://doi.org/10.3390/eng4030129
Soto EA, Ortega AV, Hernandez A, Bosman L. Commercial Level Analysis of P2P vs. Net-Metering Comparing Economic and Technical Indexes. Eng. 2023; 4(3):2254-2273. https://doi.org/10.3390/eng4030129
Chicago/Turabian StyleSoto, Esteban A., Alexander Vizcarrondo Ortega, Andrea Hernandez, and Lisa Bosman. 2023. "Commercial Level Analysis of P2P vs. Net-Metering Comparing Economic and Technical Indexes" Eng 4, no. 3: 2254-2273. https://doi.org/10.3390/eng4030129
APA StyleSoto, E. A., Ortega, A. V., Hernandez, A., & Bosman, L. (2023). Commercial Level Analysis of P2P vs. Net-Metering Comparing Economic and Technical Indexes. Eng, 4(3), 2254-2273. https://doi.org/10.3390/eng4030129