Abstract
During the tender phase of public construction projects in Portugal, documents that describe the project are mandatorily submitted to open data repositories. However, in their current state, most of these repositories do not allow for benchmarking analysis due to a lack of data treatment and cohesion. This paper seeks to diagnose the main trends during the public construction project’s tender phase by performing a descriptive statistical analysis on the Portuguese Public Procurement Database (PPPData), a database that compiles 5172 public procurement contracts in Portugal from 2015 to 2022, to respond to the research gap in construction procurement benchmarking. The results of this statistical analysis draw out the main trends, uncover which tender variables can influence budget compliance, and diagnose Portugal’s public procurement in terms of its geographical, temporal, financial, and performance dispersion. This paper concludes that the award criteria are not correlated with final project performance and that multifactor assessment criteria do not necessarily lead to better performance. High-value projects awarded solely with the price award criterion tend to perform worse than those awarded with the multifactor assessment. The study also identified frequent errors and omissions in construction reporting; thus, there is a need for error mitigation tools.
1. Introduction
During the tender phase of public construction projects, the client issues documents describing the project to be executed. Bidders must consider the variables that affect the proposal, such as the base tender price (BTP), submission time, and award criteria, adapting their proposal to each specific project.
The award criteria in the procurement stage of a construction project may be defined in multiple ways concerning different factors, which mainly include cost, time, and quality, each with different weights. According to Article 74 of the Código dos Contractos Públicos (CPP), the contracting party can use either the lowest price criterion or the multifactor criterion, which foresees the allocation of a weight, usually expressed as a percentage, to each factor [1]. An example could be 50% technical suitability and 50% price, or 50% price, 45% technical suitability, and 5% duration [2]. Based on such factors, the client analyses each proposal and determines to whom to award the contract. The selection of the best-fitting criteria is crucial for clients and bidders as it defines how the project is formulated and determines its success [3,4]. Therefore, studying the effects of the tender’s variables on a project’s performance may help construction professionals to identify best practices when selecting the best bidder and proposal structure and improve the overall efficiency of the procurement process [5].
Previous studies have analysed the use of tender criteria in Portuguese public ventures but have not investigated the impact of these options on performance or the correlations between the other tender variables [2]. In this sense, this study aims to address the research gap surrounding construction procurement benchmarking by examining the influence of award criteria definition on project performance and identifying trends and correlations in Portuguese public procurement over an extended period.
Additionally, there has been growing interest in the architecture, engineering, and construction (AEC) sector to digitalise the tendering process with electronic bidding [6]. However, because of the cultural and technical characteristics of the AEC sector, extracting consistent information from reporting data is challenging, making data analysis more costly and inconsistent as it often depends on the individual performing it [7,8]. Due to this, the AEC sector currently suffers from a great scarcity of structured data publicly available in databases [9]. This shortage is an intensifying obstacle to implementing new methodologies in the sector that are already highly successful in other industries, such as machine learning [10]. Moreover, this scarcity contrasts with the intrinsic functioning of the AEC sector, which generates a high volume of documentation throughout the construction process [11]. In particular, public procurement and tendering procedures are some of the best-documented procedures in construction in Portugal since government institutions require public construction project participants to submit a set of data blocks for each project on open-source platforms [1]. However, the data quality, extraction, and consultation do not fulfil direct statistical analysis given that these platforms lack the treatment and systematisation of their data [7,8].
Databases with historical project data are vital for early-stage estimating and benchmarking as they allow for the comparison of diverse bidding analysis methods across many construction ventures [7]. Hence, aiming at solving this challenge is far-reaching for the construction sector [12].
Consequently, this paper seeks to identify trends and best practices in public procurement through a descriptive statistical analysis of 5172 contracts extracted from the following websites: Portal Base (PB) available in [13], the Portuguese national repository of public procurement procedures, and Diário da República Electrónico (DRE), available in [14], the official national gazette. These contracts, which are in an unstructured format on these government websites, have been processed, treated, classified, and structured in PPPData, an open-access database presented in [15]. By having access to procurement data, this study analysed various aspects related to construction procurement, such as construction project geographical and financial dispersion. Additionally, it enabled an assessment of the effects of recent economic initiatives and legal impositions, the influence of global and national economic fluctuations on the construction industry, and the impacts of award criteria selection and submission time on project performance.
This paper is organised into five subsequent chapters. Section 2 presents the research approach and the characteristics of the analysed data. Section 3 and Section 4 present the main correlations found between the contract variables. Section 5 discusses the main takeaways of this work, summarising the results found and providing the best practices for clients to implement during the procurement phase to enhance the performance of their projects. Finally, Section 6 concludes the study by highlighting the main conclusions and presenting future research paths.
2. Research Approach
Construction research approaches can be broadly classified as quantitative and qualitative methods [16]. Quantitative research emphasises data quantification and theory confirmation, while qualitative research focuses on words, contexts, and theory formation. Qualitative research approaches are generally perceived as more adaptable [17]. Considering the investigative character of this study, the qualitative method was deemed suitable for data collection. Following a similar process to [18], this paper utilises the research methodology to critically analyse public procurement in Portugal from 2015 to 2022. The analysis uses the PPP Data database, which contains Portuguese public procurement contracts with closing dates between 2015 and 2022, in both Portuguese and English versions [15,19]. The available dataset only covers this period because the data were scraped in 2022 and due to inconsistencies in the hyperlinks of tender notices stored in DRE and other tender data stored in PB from 2015 onwards. For this reason, the authors of PPP Data decided that it was not relevant to continue scraping information beyond 2015 since this would create too many contracts with missing information in the dataset. The dataset underwent manual refinement to ensure statistical analysis integrity. This process resulted in the removal of forty-two contracts: three outside the date limit (2015–2022), seven with significant deviations between initial and effective prices (EP) deemed erroneous (outside of the [10; 90] percentile interval), and 32 contracts classified as “Not Compliant.” These were excluded due to considerably lower EPs than the initial price (IP), indicating incomplete execution. Consequently, the final analysis included 5172 contracts from the original 5214. Despite the manual data treatment, there were still instances of missing data that may have impacted the analysis. However, it is highlighted that the dataset studied represents all public procurement contracts executed in Portugal and that these missing values offer valuable insights into the status of construction reporting. Distribution visualisations, association tests (such as the chi-square test), and comparison tests for paired samples (such as the t-test and the Wilcoxon test) were employed using Excel and SPSS statistics to identify trends in the variables under study. Subsequently, literature reviews were conducted to justify and support the observed patterns.
2.1. Data Variables
Each unique contract was characterised by 14 distinct properties in this study, taken from the PPPData database. These properties were organised into six thematic groups, as shown in Table 1. The subchapters also follow these six thematic groups, each presenting their respective statistical descriptive analysis of the collected dataset. Each subchapter begins with the calculation of descriptive statistics and the illustration of the distribution for the research variables, providing information about the contracts under study, summarising the characteristics of the collected dataset, and highlighting potential relationships between variables. Additionally, each property is further described in its respective subchapter.

Table 1.
Data Variables.
2.2. Publication and Close Year
As illustrated in Figure 1, the collected dataset had contracts published from 2009 to 2022. The number of published contracts has increased over the years, with two exceptions: one in 2015, which had a slight decrease, and another more severe decrease in 2020. The trend for the increased number of contracts analysed can be attributed to the stabilisation and consolidation of the Portuguese economy. According to the Strategy and Research Office, there has been an upward trend in the gross value added in the construction sector, nearing the levels observed in 2005 by the year 2022. This recovery follows a notable decline in 2015 [20]. Furthermore, a comparison of the financial reports of Infrastruturas de Portugal, the largest public contractor in the country, between 2015 and 2022 reveals a clear upward trajectory in both the quantity and value of awarded contracts [21,22].
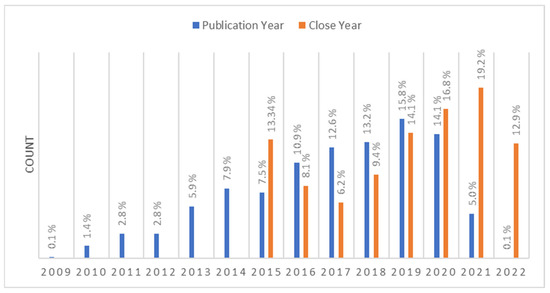
Figure 1.
Contract publication per year (blue) and closed contracts per year (orange).
Conversely, the decrease in the number of published contracts from 2020 onwards is attributed to excluding contracts that are still in progress and have not been completed at the time of data aggregation. Another possible reason for the decrease in published contracts is the impact of the COVID-19 pandemic. The precautionary measures and restrictions imposed during the pandemic limited on-site operations, which significantly reduced construction sector activity, affecting the submission and conclusion of contracts [23].
From Figure 1, it is also possible to verify the distribution of the number of closed contracts for each year, with the dataset including contracts with a closing date ranging between 2015 and 2022. Since 2017, there has been an upward trend in the number of closed contracts within the PB, except for 2022, since the data-gathering process was conducted before this year’s completion. This trend indicates that, over the years, users have completed more procedures correctly within the PB, which suggests an improvement in well-structured data stored on the platform and increased user awareness.
User awareness is crucial regarding data integrity; industry support programmes, such as Portugal 2020, which financially supported PB, may indicate an improvement in stakeholders’ understanding and engagement in submitting projects [24]. Still, there are instances where users fail to properly close the procedure in the PB’s database upon completing a project. This submission delay results in a loss of meaningful information about the contract closure. As such, the project’s closing date in this database indicates when the final information about the project was submitted, not its completion date. Therefore, using this platform, it is impossible to understand a project’s performance concerning the fulfilment of the execution deadline. This analysis found that 5125 contracts had complete information regarding the closing and publication years.
Moreover, the leveraging of available European funds for regional development in the country may explain the fluctuations in the number of contracts submitted to PB over the years. The introduction of new fund programs leads to a surge in the number of public construction projects that must be forwarded to PB [25,26].
2.3. Region
Figure 2 showcases the ventures’ regional distribution for contracts closed between 2015 and 2022. As expected, the regions with the highest population had significantly more public procurement contracts executed. Porto and Lisbon stood out, with 720 and 709 projects, respectively. These numbers are over 200 projects higher than the third district: Aveiro, with 492 contracts. The top five districts were rounded off by Braga and Faro, both with 367 contracts. The remaining regions in decreasing order were Setúbal (260), Viseu (240), Vila Real (234), Leiria (213), Coimbra (206), Santarém (182), Azores (171), Viana do Castelo (152), Beja (136), Portalegre (135), Guarda (112), Bragança (106), Castelo Branco (81), Madeira (79), and Évora (58). Finally, 120 contracts had a missing region variable.
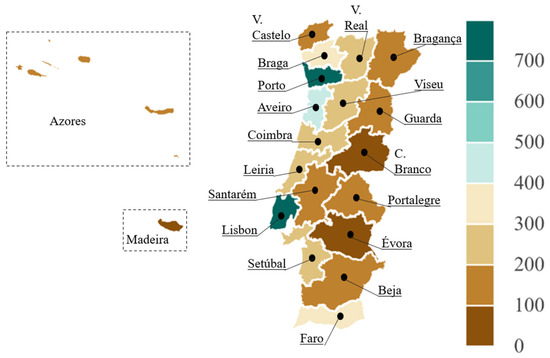
Figure 2.
Distribution of the contracts per region in Portugal for contracts closed between 2015 and 2022.
The distribution of contracts by district reaffirmed the statistical finding that Portugal ranks third in the European Union regarding local authorities’ limited involvement in public spending [27,28]. Despite ongoing decentralisation programmes initiated in 2015 to align with the average levels of the EU, there remains a prevailing trend of public works primarily taking place in metropolitan and coastal regions [29]. According to OECD’s report on decentralisation efforts in Portugal, the process is still ongoing and faces challenges, such as addressing the role of inter-municipal cooperation and managing the volatility of some of the municipal tax bases [30].
2.4. Submission and Execution Deadlines
Submission time can be an important factor in making a reasonable bid for a tender as it restricts the time companies may consider their bid. As observed in Figure 3a, 4874 contracts were identified with this deadline information, meaning 298 had it missing. Focusing on the valid cases, it was found that the average time given to bidders for their proposal submission was approximately 24 days. Clients most often required 30 days to make their submission, with 75% of all contracts taking less than a month. The submission deadline ranged from 1 to 156 days.
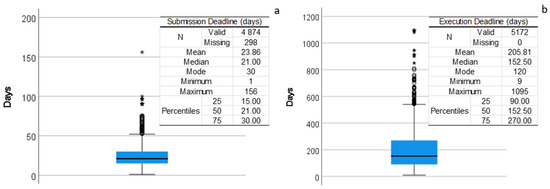
Figure 3.
(a) Submission deadline boxplot. (b) Execution deadline boxplot.
The EU procurement directive sets different deadlines depending on the type of procedure. What is observed is that most public authorities either adhere to the legally prescribed deadlines or opt for extended periods to accommodate the bidding process [31].
Regarding the execution time, as shown in Figure 3b, all 5172 contracts had this information specified. On average, the projects had an execution time of approximately 153 days. Concerning the mode, projects with 120 days of execution time were the most frequent. A total of 75% of all contracts were below 270 days of execution, i.e., most public projects executed in Portugal between 2015 and 2022 did not reach one year of duration. Moreover, the execution deadline among the projects of this dataset ranged from 9 to 1095 days. The analysis of execution time statistics for construction projects in Portugal revealed a substantial number of small-scale projects. Hence, it can be inferred that most public procurement in the country comprises such projects.
2.5. Award Criteria
Regarding the award criteria, 2321 projects used the price criterion, which amounted to 44.9% of all contracts. The multifactor assessment criterion was used in 1281 contracts (24.8%), while 1570 contracts (30.3%) had a missing award criterion. As such, the dataset showed a strong preference for using the price criterion over the multifactor criterion, which considers other factors such as time and work quality (measured in multiple ways).
The considerable quantity of contracts lacking award criteria poses limitations on the analysis of their impact and further underscores the argument made in the Introduction section regarding the insufficient information available in construction sector databases. Thus, it is essential to acknowledge the presence of missing information throughout this analysis and its implications.
Table 2 presents the descriptive statistics on the price weight in multifactor classification statistics. Of all contracts, 3602 (2321 + 1281) had a weight given to the price factor, meaning that all contracts with award criteria included a price factor. The average weight given to the price factor in these contracts was approximately 85%, while the mode and median were 100%. The range of this weight ranged from 5% to 100%.
Table 2.
Price weight in multifactor classification contracts.
Most of the contracts awarded by the multifactor criterion continued to give significant weight to the price factor. As shown in Table 2, the mean weight for the price factor in multifactor classification awarded contracts was 58.2%, while the mean and median were 60%. In fact, in multifactor assessment projects, 337 gave the price a weight between 70% and 95%, 707 gave it a weight between 40% and 70%, and 237 gave it a weight between 0% and 40%. Thus, it can be concluded that price is still the most significant factor in selecting the best bid, even in multifactor assessment tenders.
2.6. Price Variables
Table 3 presents the main descriptive statistics of the price variables: the BTP, IP, and EP. The IP can never be higher than the BTP and, as expected, the average BTP was higher than the remaining price variables, set at EUR 842,000 (USD 917,000). The data showed considerable variability in price, as shown by the high standard deviation and coefficient of variation across all price variables. Moreover, there was a significant skewness in the distribution of contracts, with a pronounced proclivity towards small-value projects.
Table 3.
Price variables statistics.
The comparison between the average IP and EP gave further insight into the performance of construction projects. For instance, their value similarities suggested that, in most projects, the EP met the IP, the mean of the price difference was equal to EUR 611/USD 666 (with a standard deviation of EUR 87,125/USD 94,917), and the median was equal to EUR 0. Since these variables followed exponential distribution (that was not normally distributed), the t-test for paired samples may not have provided valid results when comparing their means. Thus, a Wilcoxon non-parametric test was conducted to compare the paired differences between observations and determine if there were significant differences among them. Since it evaluated the null hypothesis that the median of the differences was equal to zero and the result was a p-value = 0.394, the test revealed that the differences were not statistically significant (p-value > 0.05); thus, it can be considered that the EP and IP are, in fact, not dissimilar.
To avoid unfair comparisons between small and large projects, in terms of budget, it was decided to classify contracts according to the dimension of their IP. In fact, since large projects work with significantly larger amounts of money, a slip of several thousand USD may represent a small percentage of the total venture—the same cannot be said for a small project. To this end, three price classes were created:
- Small-value projects (IP less than EUR 250 k/USD 272 k);
- Intermediate-value projects (IP greater than EUR 250 k/USD 272 k and less than EUR 1 M/USD 1.1 M);
- High-value projects (IP greater than EUR 1 M/USD 1.1 M).
Table 4 shows the distribution of contracts by each class, enabling a separate performance analysis for each interval and a better understanding of low- and high-value contracts. The chosen class limits were based on a simplification of the Portuguese system of qualifications for construction companies’ permits, referred to as “Permit Classes” [32].
Table 4.
Distribution of contracts by IP class.
Table 4 shows a high number of small- and intermediate-value contracts, respectively, 2406 and 2204, when compared with high-value contracts, 562. To this end, high-value projects accounted for only 10.9% of all contracts, contrasting with 46.5% and 42.6% for small and intermediate works, respectively.
2.7. Performance
A comparison of the IP and EP of contracts allowed for an assessment of project performance. The price difference (=IP − EP) indicated whether the EP exceeded or fell short of the IP, with negative differences indicating exceeding and positive differences indicating compliance. The price proportion was obtained from the ratio between the EP by the IP. If a value exceeded 100%, the EP exceeded the IP. Projects with an EP above the IP did not meet the contractually agreed-upon price and, therefore, did not comply with the expected financial performance.
Table 5 shows that the average price difference exhibited a slight slippage for the projects in this dataset. The mode value confirmed that most projects complied with the IP. The same trend can be observed in the statistics of the price proportion. The low standard deviation and distribution of the dataset indicate minor price deviations, suggesting that most projects successfully adhered to the contractually defined requirements.
Table 5.
Performance variables statistics.
Moreover, there were values for these variables that were notoriously out of range for construction. The low value for the minimum price proportion (10.27%) indicated that only 10% of what was initially planned was spent on a project. Like all the others in this dataset, this contract was closed under a complete fulfilment of the contract classification, making these cases odd occurrences. Without further information, it is impossible to determine the cause for such a large discrepancy between the IP and the EP. In these cases, it is possible only to speculate on the quality of the data inserted into the PB. These occurrences affect the performance classification of contracts in this article since this classification was conducted according to the price difference in percentages.
Additionally, a classification was given to each contract to access its financial performance. As with the IP categories, the following three classes were created to sort contracts according to their performance:
- Price Compliance: contracts in which the ratio between the EP and the IP was above 105%;
- Price Spill: contracts in which the ratio between the EP and the IP was 95% and 105%;
- Price Savings: contract in which the ratio between the EP and the IP was below 95%.
The need to use this classification to evaluate a project’s performance arose from the difficulty in deciding the slippage size that justified classifying a project’s performance as negative or in conformity. This is because the amount of funds and resources moved by high-value projects is incomparable with that of small-value projects.
According to this classification, a large part of the contracts, 70.5% (3644), complied with the price. Regarding the extreme cases, there were more projects with slippage in price, approximately 16.4% (846), compared to the 13.2% (682) of contracts that saved money. These values indicated a positive result for the correct execution of works and contract compliance in Portugal.
3. Association and Relationships between Contract Characteristics
This chapter presents a discussion and analysis of the relationships and associations between some variables.
3.1. Publication and Close Year
Through the graphs in Figure 4, it is possible to observe the variation in the number of published and closed public contracts in the seven regions of Portugal with the most contracts per year during the period under study. Published contracts have increased over the years. Porto and Lisbon have changed leadership throughout the years, with Lisbon publishing more projects since 2018. In 2014 and 2016, users opened more projects in Aveiro than in Porto; the same was true in 2017 when Aveiro overtook Lisbon. These were the only occasions when another region other than Porto or Lisbon shared first and second place. Additionally, in 2018, the district of Faro overtook Aveiro in the top three regions with more published articles.
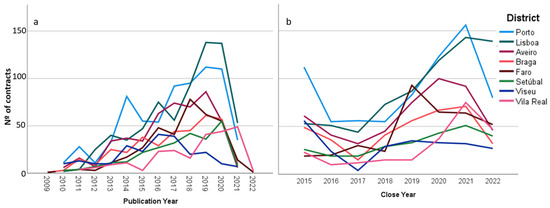
Figure 4.
(a) Variation of the number of open contracts per region by year. (b) Variation in the number of closed contracts per region by year.
Regarding the closure of contracts by region in Portugal, since 2017, there has been a trend towards an increase in the number of closed contracts. Also, this analysis found that Porto and Lisbon had changed their leadership. Third place has been occupied exclusively by Aveiro, with two exceptions: in 2019, when Faro led the country, and at the beginning of 2022. In 2015, an atypical year, the top three were Porto, Aveiro, and Viseu.
The relationship between publication and close years and the award criteria shows that the percentage of contracts with missing award criteria has decreased over time. According to the PB, the loss of hyperlinks between the tender notices published in the DRE, which includes details about the award criteria, and the remaining data found in PB can be attributed to updates on the DRE website that are not synchronised with the PB, resulting in instances of missing information. In fact, in 2015, the number of contracts closed with missing award criteria was almost 90%. This number has reduced to approximately 19% and reached a minimum level of 15.2% in 2020. In the last five years, the average percentage of contracts with missing information was 16.7%.
The percentage of contracts using price criteria has increased over time. According to the number of contracts closed, the number of contracts using price criteria has increased from 44.1% in 2016 to 60.6% in 2022. As for contracts that used the multifactor criterion, the same has not occurred. These types of contracts had a peak between 2017 and 2018 at 35% and 38% and have been slowly decreasing, averaging 24.8% of representativeness between 2020 and 2022. This dominance in the number of contracts using the price criterion can be justified by the increase in small-value contracts submitted to the platform in recent years.
The relationship between publication and close years and the IP class reveals that the submission of small-value contracts has increased over time. This trend may indicate a greater awareness among public procurers who undertake more minor projects to submit public contracts on the platform.
The representativity of high-value projects has decreased from 24.6% in 2016 to an average of 7.2% over the last five years. The downward trend for high-value projects has also occurred for intermediate-value projects, which obtained an average of 50.3% in the first four years, and shifted to an average of 38.3% in the last four years. Over the previous three years, the split between the three categories has remained at approximately 57/36/7.
Regarding performance over time, Figure 5b shows that the percentage of contracts in which there was slippage in price decreased and the opposite trend was verified for projects that saved financially.
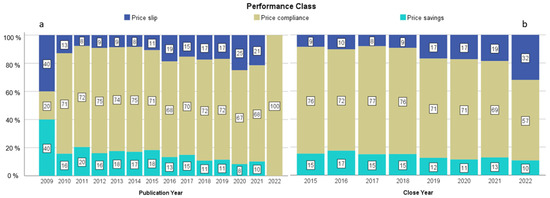
Figure 5.
Percentage of published contracts (a) and closed contracts (b) per performance.
In fact, in the first four years of analysis (2015 to 2018), approximately 9% (8.1–10.3%) of annual projects did not come close to the IP and approximately 16% (14.9–17.4%) of yearly projects had savings.
This paradigm has changed in the last four years (2019–2022), where failed contracts have increased in representativeness to 21.3% on average and contracts with funding savings have decreased to 11.7% on average. Moreover, there was a distinctive peak in 2022, with 32% of contracts failing, perhaps caused by the inflation felt in the global economy. Additionally, the number of contracts that met the contractually stipulated price also changed in averages from 2015 to 2018 (75.3%) compared to the last four years (67.1%).
3.2. Submission and Execution Deadline Effects on Performance
The boxplot from Figure 6a highlights that the submission deadline does not affect a project’s performance as the distribution of the submission days stays almost the same for all performance classes. Previous studies claimed that contractors with more time and documentation could perform more accurate cost estimations [33]. This, in turn, increases the likelihood of these companies submitting lower bid prices, ultimately enhancing their chances of winning the contract [34]. However, this study’s data show that increased submission times are not directly correlated with improved performance.
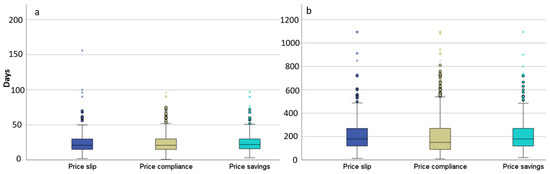
Figure 6.
(a) Submission deadline per performance class boxplot. (b) Execution deadline per performance class boxplot.
Concerning the correlation with execution time, Figure 6b shows that short-term projects achieved slightly better results than long-term ones in terms of meeting budgets. However, this correlation is too tenuous to confirm a correlation between the variables.
3.3. Region Relationship between IP Class, Award Criteria, and Performance
The region with the highest proportion of high-value projects was Beja, with 31.6% (the only one above 30%), followed by Évora (24.1%) and Azores (21.1%), both over 20%. Involving the same IP category, the smallest proportion was found in Castelo Branco, with 3.70%, followed by Faro (4.1%) and Guarda (4.5%).
Considering intermediate-value projects, the autonomous region of Azores led all regions, with 56.7%, followed by Santarém, Madeira, Viana do Castelo, and Bragança with over 50% of the intermediate category. With 33.3%, Vila Real was the region with the lowest proportion of intermediate-value projects, followed by Aveiro (35.6%) and Faro (37.6%).
Finally, the regions with the highest proportion of small-value projects were Vila Real (61.1%), the only one above 60%, followed by Faro, Leiria, Lisbon, Aveiro, and Setubal with over 50%. Conversely, the Beja, Azores, and Madeira regions registered less than 30% of small-value projects.
The proportion of high-value projects was more significant in regions with fewer contracts, such as Beja, Évora, and the autonomous regions of Azores and Madeira. It is relevant to state that one of the reasons for the discrepancy in the proportion of high-value projects in relation to smaller ones may be due to the lack of reporting of small-value contracts by public contractors, who, despite having an obligation to submit the projects, may sometimes fail to do so due to different reasons such as insufficient staffing and lack of technical or technological resources.
With respect to the award criteria, the regions with greater use of the price criterion were Vila Real, the only one above 70%, followed by Leiria and Faro, both above 60%. In the opposite direction, the lowest proportion was found in Azores, Viana do Castelo, and Évora. However, in the case of Azores, the proportion of contracts with missing award criteria was much higher when compared to the distribution of criteria in the last two regions, which influenced this statistic.
Furthermore, regarding the multifactor assessment criterion, the regions that used this criterion the most were Viana do Castelo (46.7%), Évora, and Setúbal. Conversely, Madeira did not have a single project with the multifactor assessment criterion. Next, the region that made the least use of this criterion was Leiria, with 4.3%, followed by Santarém, Vila Real, Coimbra, Portalegre, Viseu, and Faro, all with less than 15%.
Lastly, the regions with the most contracts with missing information were Beja, Azores, and Madeira (49.4%). All regions experienced more than 15% of the contracts missing award criteria information, hitting at the data sourcing problem introduced at the begging of this paper. Despite a substantial amount of literature on decision analysis approaches for making value-based decisions, it has been highlighted by [35] that the current public procurement practice and practitioners lack awareness of this body of knowledge. Vila Real was the region with the most complete information as only 16.2% of its contract had missing award criteria.
Concerning the performance of projects per region of Portugal, Madeira was the region that obtained the best performance, that is, the one that had the lowest percentage of projects that slipped in price.
However, the small number of projects executed in the Madeira archipelago may undermine this statistic. After Madeira, Beja (8.8%), Portalegre (8.9%), and Leiria (9.4%) all had a percentage below 10% of contracts with financial slips. The worst performing regions were Setubal, Guarda, Castelo Branco, and Santarém, with over 20% of the projects sliding financially. Viseu, Coimbra, and Braga witnessed over 20% off the project saving in the contractually agreed price.
3.4. Association between Award Criteria and IP Class
Concerning the relationship between the IP category of the project and the award criteria, Figure 7 shows a relevant association where, as the economic dimension of the project gets bigger, the price award criterion usage drops. In contrast, the multifactor criterion increases its use from small-value projects, which is 20.3%, to intermediate and high-value projects, between 26% and 29%.
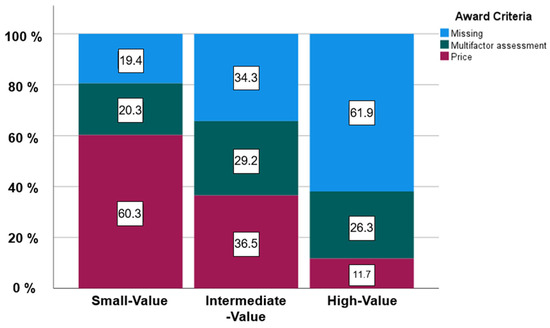
Figure 7.
Stacked bar chart percentage of award criteria by IP class.
Strangely enough, the greater the value of the venture, the greater the number of contracts with the omitted award criterion.
Furthermore, a Chi-square test performed to test the association between these two variables showed a significant inverse association since the asymptotic significance was smaller than 0.05 (<0.01). This test confirmed that choosing award criteria depends on the financial dimension of the projects. However, Cramer’s V coefficient value of 0.25 described the strength of this association as low.
3.5. Association between Award Criteria and Performance
At the outset, it could be considered that a tender with an award criterion that considers different factors would be more analytical and yield better results when compared to a tender where the award is solely decided through the price of the tender. However, as shown in Figure 8, this dataset confirms that there is not a sufficiently relevant association to state that one or the other award criterion yields better results.
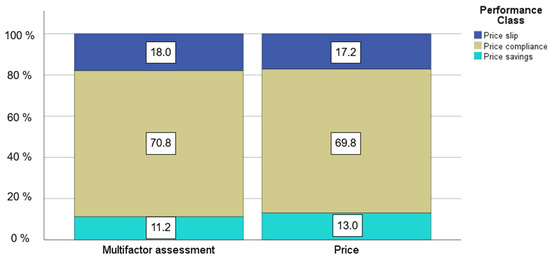
Figure 8.
Stacked bar chart relationship between award criteria and performance of the project.
Similarly to the previous subchapter, a chi-square test was performed to check for an association between these variables. The results indicated that the performance of the project was not significantly associated with the selected award criteria, as evidenced by the asymptotic significance (0.304). Additionally, the Cramer’s V coefficient value of 0.026 suggested that this association, if present, is minimal. Thus, it can be concluded that the relationship between these variables is not considered relevant. Moreover, it is highlighted that the high number of missing award criteria may have affected the findings gathered from the association between these two variables.
This tendency reinforces the argument stated by [36] about widely used tender evaluation models based on scoring formulas such as the multifactor assessment in Portuguese tendering. The study identified that current evaluation models struggled to capture the preferences of the procuring authority and that the assessment of weightings for award criteria neglects the measurement levels of the criteria, leading to ambiguity in weight definition. Lastly, the study confirmed that relative scoring formulas do not allow bidders to make informed judgments about their offers. These findings underscore the limitations of current tender evaluation practices, hindering the results of multifactor assessments in tendering.
3.6. Association between IP Class and Performance
Similarly to the relationship between performance and award criteria, the relationship between IP category and performance also does not allow one to distinguish one category of projects as better performing than the others. As shown in the bar chart of Figure 9, all the IP categories had very similar proportions of failure, compliance, and savings.
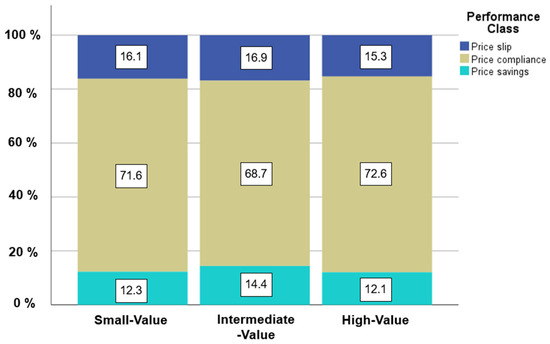
Figure 9.
Stacked bar chart relationship between IP category and performance of the project.
3.7. Association between Criterium Class and Performance
Regarding the effect of the weight given to the price factor on the proposals, represented by the criterium class, on the outcome of the projects, as shown in Figure 10, the class that achieved the best performance was the 0% to 40% class. This class outperformed the others by 5% fewer projects with price slips. Next, the 70% to 95% class was the second-best performer, followed by the 95% to 100% (price award criteria) and 40% to 70% classes.
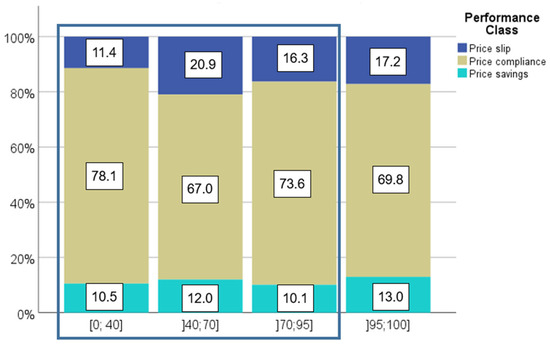
Figure 10.
Stacked bar chart relationship between criterium class and performance of the project.
Additionally, the latter was the most inconsistent. In fact, despite it witnessing more than 20% of the project sliding financially, it also achieved 12% of price savings, only behind the price award criteria.
4. Analysis Per IP Class of Projects
Various factors, including the economic dimension, influence the structure of construction projects. This chapter examines the impact of award criteria and criterion class on project performance, specifically focusing on the IP class. The following questions are addressed:
- Is there any criterion that performs better when a project is small/high in value?
- Is there any weight of the price factor that performs better when the project has a smaller/higher value?
Concerning the small-value project from Table 6, the performance of award criteria was similar to the overall dataset. This class represented the largest IP class group, with 1939 projects below the EUR 250 k threshold, causing repeated performance indices across all award criteria, indicating no clear outperformer. However, the multifactor assessment demonstrated slightly worse performance than the price factor. Regarding the criterium class, as shown in Table 6, the 40% to 70% class performed the poorest. The 0% to 40% class performed the best, consistent with the overall dataset. The price factor and the 70% to 95% price weight class performed similarly, achieving more financial slips than the best-performing class but achieving more projects with price savings.
Table 6.
Distribution of Award Criteria and Criterium Class Per IP Class Performance.
Conversely, regarding intermediate-value projects (Table 6), the price award criterion performed worse than the multifactor criterion, although the difference between the two was slight. Regarding the criterion class, the worst performer remained consistent with the overall dataset and the previous IP category. However, the price factor also showed inconsistency, with its performance decreasing by 2.5% compared to the previous class.
Finally, concerning high-value projects, Table 6 shows that the difference between the performance of the price award criteria and the multifactor assessment award criteria increased. Clearly, in high-value projects, the multifactor assessment criteria seemed to outperform the price criteria. Table 6 highlights a new trend where project performance decreases as the weight of the price factor increases in the award criteria.
Moreover, the 40% to 70% class increased its performance significantly. Despite this, it remained the most inconsistent class among all others.
The tendency observed in the analysis of the IP category indicated that in high-value projects, there must be a consideration of multiple factors for the tender procedure for the venture and that the same criteria do not apply to all types of projects.
5. Discussion
This paper conducted a descriptive statistical analysis of 5172 public procurement contracts closed between 2015 and 2017. Through the description and correlation between variables, it was possible to identify public procurement trends in public venture contracts in Portugal. Some of the patterns identified in the data showed surprising results and enabled the outlining of best practices for public procurement.
An example of these results is the overall good performance of the public works since more than 70% of the projects were within budget and 13% more had savings compared to the IP. Unexpectedly, using the price award criteria did not result in more non-compliant projects than using the multifactor award criteria. This can be attributed to the shortcomings of current tender evaluation models, which fail to accurately capture procuring authorities’ preferences and allow for vague interpretations of tender criteria weightings [36]. In fact, the use of the multifactor award criteria is only justified in larger projects (above USD 272 k) because it is only in these that a discrepancy between the performance of the two criteria was found, with multifactor criteria standing out the bigger the budget for the development became. Moreover, the tender evaluation method should objectively assess submitted bids. Procurement authorities can benefit from the use of well-structured multifactor assessment tenders as using non-price criteria in procedures can enhance competitiveness and foster the submission of tenders with innovative solutions [37]. To achieve better results, the weight of the price factor in multifactor assessment criteria should not be between 40% and 70% as multifactor assessment performed best when the price was higher than 70% or smaller than 40%. Lastly, this study also proves that the economic dimension of the project also affects the type of award criteria chosen by the client. Thus, the economic dimension should be considered for the award criteria definition.
Furthermore, while the submission deadline for a proposal is not directly correlated with a project’s performance, the most common practice is to set the deadline for 30 days. The EU procurement directive provides varying deadlines based on the type of procedure. It is observed that most public authorities either follow the legally prescribed deadlines or opt for extended periods to accommodate the bidding process [31].
There is an investment gap between the large urban centres like Lisbon and Porto, represented by a greater volume of developments, to the detriment of the primarily rural and depopulated interior regions, reflecting Portugal’s centralisation struggles. Additionally, most of the developments were of small or medium value, with more than 90% having a budget of less than USD 1.1 million. There was a wide variation between the budgets of the developments as the dataset included contracts ranging in value from a few thousand USD up to several million.
Moreover, there was an increase in the number of projects submitted to public procurement platforms and the quality of the information in these submissions, indicating increased clients’ awareness of the correct closing of processes. This increase in user awareness may be linked to national programmes that finance public procurement platforms and the consolidation of the Portuguese economy. However, the large percentage of contracts with missing award criteria and other errors and omissions demonstrates that the quality of the data submitted in public procurement platforms is still far from ideal as the architecture of these platforms is not optimal for data sharing and storage. This circumstance was a limiting factor in this study as it excluded several contracts from the dataset analysed.
6. Conclusions
This paper performed a descriptive statistical analysis of 5172 public procurement contracts, analysing trends in the public tender market from 2015 to 2022. The data originated from PPPData, a repository of public procurement contracts developed by [15] using data mining algorithms on two Portuguese public procurement platforms.
To this end, PPPData allowed for the performance of a comprehensive statistical analysis that would not be possible by consulting both platforms separately. Since previous works analysed and treated the acquired data, the present study focused on a more thorough investigation of its information compared to other existing studies in the literature focusing on this topic. As such, the results of this study present current tendencies in public procurement contracts, identifying the main trends and recommending best practices for structuring the selection criteria according to the type of venture. This statistical analysis shows the following:
- Overall, the performance of construction projects in Portugal during the studied timeframe was positive.
- Award criteria are generally not correlated with the final price of projects.
- Multifactor assessment criteria do not necessarily lead to better performance compared to projects awarded solely based on the price factor.
- High-value (i.e., above USD 1.1 million) projects exclusively awarded based on the price award criterion tend to perform worse than those awarded with multifactor assessment.
- Contract execution is concentrated in coastal areas and major cities of Portugal.
- There has been, in general, an increase in the number of contracts submitted to PB.
- Granting extended submission deadlines does not guarantee improved financial performance of construction projects.
- Errors and omissions in construction reporting are prevalent, leading to information scarcity in public tender repositories.
- Public procurement data repositories play a crucial role in summarising and providing insights into project results.
- Error mitigation tools and increased awareness of data submission accuracy are necessary for public procurement repositories.
These data draw valuable insights for bidders and clients in the tender process, enhancing requirements and efficiency. This paper contributes to bridging the knowledge gap by examining the influence of tender award criteria on project performance and providing a diagnostic analysis of Portuguese public procurement performance in recent years. It is important to note that contract modifications were not considered in this analysis, and further exploration is needed to understand their impact on the findings. Future studies should expand this analysis as the dataset grows, incorporating additional variables. Furthermore, the development of machine learning applications can leverage the findings of this study to predict project performance. These future studies will support algorithm functioning and decision-making processes.
Author Contributions
Conceptualization, J.P.M. and J.M.d.C.; Methodology, J.M.d.C. and M.L.S.; Investigation, L.J.d.S. and M.L.S.; Resources, L.J.d.S., J.P.M. and L.S.; data curation, L.J.d.S., M.L.S. and L.S.; writing—original draft, L.J.d.S.; Writing—Review & Editing, J.P.M., L.S., J.M.d.C. and M.L.S.; visualization, L.J.d.S. and M.L.S. All authors have read and agreed to the published version of the manuscript.
Funding
This work was financially supported by the European Regional Development Fund (ERDF) through the Operational Competitiveness and Internationalisation Programme (COMPETE 2020) (funding reference: POCI-01-0247-FEDER-046123) and by Base Funding—UIDB/04708/2020 of the Research Unit CONSTRUCT—Institute of R&D in Structures and Constructions—funded by national funds through FCT/MCTES (PIDDAC). This work was also co-financed by the European Social Fund (ESF) through the Northern Regional Operational Programme (Norte 2020) (funding reference: NORTE-06-3559-FSE-000176).
Data Availability Statement
Some or all data, models, or codes generated or used during the study are available in a repository online in accordance with funder data retention policies. Jacques de Sousa, Luís & Martins, João & Sanhudo, Luís. (2023). Portuguese Public Procurement Data for Construction (2015–2022). Data in Brief. 48. 109063. doi:10.1016/j.dib.2023.109063, accessed on 10 June 2023.
Conflicts of Interest
The authors declare no conflict of interest.
References
- DRE. Código dos Constratos Públicos (CCP)—Consolidated with the Amendment Introduced by Decree-Law no. 78/2022 of 7 November 2008; IMPIC: Rebecq, Belgium, 2008.
- IMPIC. Anual Public Procurement in Portugal. 2019. Available online: https://www.impic.pt/impic/assets/misc/relatorios_dados_estatisticos/RelContratosPublicos_2019_EN.pdf (accessed on 1 April 2023).
- Muriro, A.; Wood, G. A comparative analysis of procurement methods used on competitively tendered office projects in the UK. In Proceedings of the COBRA 2010—Construction, Building and Real Estate Research Conference of the Royal Institution of Chartered Surveyors, Paris, France, 2–3 September 2010. [Google Scholar]
- Yi, C.-Y.; Gwak, H.-S.; Kim, B.-S.; Lee, D.-E. Stochastic Multi-variate Performance Trade-off Method for Technical Tender Evaluation. KSCE J. Civ. Eng. 2018, 22, 4240–4253. [Google Scholar] [CrossRef]
- Carbonara, N.; Pellegrino, R. The role of public private partnerships in fostering innovation. Constr. Manag. Econ. 2020, 38, 140–156. [Google Scholar] [CrossRef]
- Kerridge, S.; Halaris, C. SupplyPoint: An integrated system supporting E-business in the Construction Sector. In Proceedings of the First IFIP Conference on E-Commerce, E-Business, E-Government (I3E 2001), Zürich, Switzerland, 3–5 October 2001. [Google Scholar]
- Chen, D.; Hajderanj, L.; Fiske, J. Towards automated cost analysis, benchmarking and estimating in construction: A machine learning approach. In Proceedings of the 13th Multi Conference on Computer Science and Information Systems, Porto, Portugal, 16–19 July 2019. [Google Scholar]
- Martin, J.L.N. E-Bidding for Building Contracts in the UK. AACE Int. Trans. 2007, RICS.02.1–RICS.02.4. [Google Scholar]
- Jacques de Sousa, L.; Martins, J.P.; Baptista, J.S.; Sanhudo, L.; Mêda, P. Algoritmos de classificação de texto na automatização dos processos orçamentação. In Proceedings of the 4° Congresso Português de Building Information Modelling, Braga, Portugal, 4–6 May 2022. [Google Scholar]
- Dogan, A.; Birant, D. Machine learning and data mining in manufacturing. Expert Syst. Appl. 2021, 166, 114060. [Google Scholar] [CrossRef]
- Munawar, H.S.; Ullah, F.; Qayyum, S.; Shahzad, D. Big Data in Construction: Current Applications and Future Opportunities. Big Data Cogn. Comput. 2022, 6, 18. [Google Scholar] [CrossRef]
- Aibinu, A.A.; Al-Lawati, A.M. Using PLS-SEM technique to model construction organisations’ willingness to participate in e-bidding. Autom. Constr. 2010, 19, 714–724. [Google Scholar] [CrossRef]
- IMPIC. Portal Base. 2022. Available online: https://www.base.gov.pt (accessed on 1 April 2023).
- DRE. Diário da Républica Electónico. 2022. Available online: https://dre.pt/dre/home (accessed on 1 April 2023).
- Jacques de Sousa, L.; Martins, J.P.; Sanhudo, L. Portuguese Public Procurement Data for Construction (2015–2022). Data Brief 2023, 48, 109063. [Google Scholar] [CrossRef] [PubMed]
- Umar, T.; Egbu, C. Causes of construction accidents in Oman. Middle East J. Manag. 2017, 5, 21–33. [Google Scholar] [CrossRef]
- Umar, T. Key factors influencing the implementation of three-dimensional printing in construction. Proc. Inst. Civ. Eng. Manag. Procure. Law 2021, 174, 104–117. [Google Scholar] [CrossRef]
- Bryman, A. Social Research Methods, 5th ed.; Oxford University Press: London, UK, 2016. [Google Scholar]
- Jacques de Sousa, L.; Martins, J.P.; Sanhudo, L. Base de Dados: Contratação Pública em Portugal Entre 2015 e 2022; Universidade do Minho: Gimaraes, Portugal, 2022. [Google Scholar]
- Gabinete de Estratégia e Estudos. Principais Indicadores Económicos de Portugal. 2023. Available online: https://www.gee.gov.pt/pt/publicacoes/indicadores-e-estatisticas/principais-indicadores-economicos-de-portugal (accessed on 15 May 2023).
- Infraestruturas de Portugal. Relatório de Contas. 2015. Available online: https://www.infraestruturasdeportugal.pt/sites/default/files/inline-files/Relat%C3%B3rio%20e%20Contas%20Separadas%202015%20%E2%80%93%20vers%C3%A3o%20corrigida.pdf (accessed on 15 May 2023).
- Infraestruturas de Portugal. Relatório de Contas. 2021. Available online: https://www.infraestruturasdeportugal.pt/pdfs/RC_IP_2021.pdf (accessed on 15 May 2023).
- Leontie, V.; Maha, L.-G.; Stoian, I.C. COVID-19 Pandemic and Its Effects on the Usage of Information Technologies in the Construction Industry: The Case of Romania. Buildings 2022, 12, 166. [Google Scholar] [CrossRef]
- Faria, B.S.; Simões, A.C.; Rodrigues, J.C. Impact of Governmental Support for the Implementation of Industry 4.0 in Portugal. In Innovations in Industrial Engineering, Proceedings of the International Conference Innovation in Engineering, Minho, Portugal, 28–30 June 2022; Lecture Notes in Mechanical Engineering; Springer: Cham, Switzerland, 2022; pp. 108–120. [Google Scholar]
- Picas, S.; Reis, P.; Pinto, A.; Abrantes, J.L. Does tax, financial, and government incentives impact long-term Portuguese SMEs’ sustainable company performance? Sustainability 2021, 13, 11866. [Google Scholar] [CrossRef]
- Ferreira FE, M.; Catarino, J.R. European territorial development and the place based approach: The budgetary dimension of Portugal 2020. Rev. Iberoam. J. Dev. Stud. 2018, 7, 114–136. [Google Scholar] [CrossRef]
- Governo da República Portuguesa. Há Uma Clara Correlação Entre a Maior Centralização e o Menor Desenvolvimento. 2019. Available online: https://www.portugal.gov.pt/pt/gc21/comunicacao/noticia?i=ha-uma-clara-correlacao-entre-a-maior-centralizacao-e-o-menor-desenvolvimento (accessed on 15 May 2023).
- OECD. Key Data on Local and Regional Governments in the European Union (Brochure). 2018. Available online: www.oecd.org/regional/regional-policy (accessed on 15 May 2023).
- CID. Comissão Independente para a Descentralização—Volume I—Relatório. 2019. Available online: https://www.parlamento.pt/Documents/2019/julho/descentralizacao/Relatorio-Final-descentralizacao.pdf (accessed on 15 May 2023).
- OECD. Decentralisation and Regionalisation in Portugal. 2020. Available online: https://www.oecd-ilibrary.org/content/publication/fea62108-en (accessed on 15 May 2023).
- EU. Directive 2014/24/EU of the European Parliament and of the Council of 26 February 2014 on Public Procurement and Repealing Directive 2004/18/EC Text with EEA Relevance. 2014. Available online: https://eur-lex.europa.eu/legal-content/EN/TXT/?uri=CELEX:32014L0024 (accessed on 15 May 2023).
- DRE. Law 41 2015, Regulated by Ordinance 212/2022 Diário da República, 1.ª Série; Diário da República: Lisbon, Portugal, 2022.
- Hanák, T.; Drozdová, A.; Marović, I. Bidding Strategy in Construction Public Procurement: A Contractor’s Perspective. Buildings 2021, 11, 47. [Google Scholar] [CrossRef]
- Fry, T.D.; Leitch, R.A.; Philipoom, P.R.; Tian, Y. Empirical Analysis of Cost Estimation Accuracy in Procurement Auctions. Int. J. Bus. Manag. 2016, 11, 1. [Google Scholar] [CrossRef]
- Bergman, M.A.; Lundberg, S. Tender evaluation and supplier selection methods in public procurement. J. Purch. Supply Manag. 2013, 19, 73–83. [Google Scholar] [CrossRef]
- Lehtonen, J.-M.; Virtanen, K. Choosing the most economically advantageous tender using a multi-criteria decision analysis approach. J. Public Procure. 2022, 22, 164–179. [Google Scholar] [CrossRef]
- Plebankiewicz, E.; Kozik, R. The transformation of the tender evaluation process in public procurement in Poland. IOP Conf. Ser. Mater. Sci. Eng. 2017, 251, 012042. [Google Scholar] [CrossRef]


Disclaimer/Publisher’s Note: The statements, opinions and data contained in all publications are solely those of the individual author(s) and contributor(s) and not of MDPI and/or the editor(s). MDPI and/or the editor(s) disclaim responsibility for any injury to people or property resulting from any ideas, methods, instructions or products referred to in the content. |
© 2023 by the authors. Licensee MDPI, Basel, Switzerland. This article is an open access article distributed under the terms and conditions of the Creative Commons Attribution (CC BY) license (https://creativecommons.org/licenses/by/4.0/).