Abstract
Overtaking maneuvers can induce significant changes in the airflow field between vehicles, potentially compromising the stability and safety of the overtaken vehicle. This study investigates the aerodynamic characteristics during overtaking in a platoon of vehicles using the 1:2.5 DrivAer fastback model as the subject of analysis. To simulate the external flow during overtaking within a vehicle platoon, the Reynolds-Averaged Navier–Stokes (RANS) equations are employed under steady-state, incompressible flow assumptions. A baseline simulation is first performed for a single vehicle, and the results are validated against experimental data to ensure the reliability of the numerical method. The simulation is subsequently extended to a two-vehicle platoon configuration with a longitudinal spacing of half a vehicle length. Under steady platoon driving conditions, no significant lateral aerodynamic disturbances are observed between adjacent vehicles, and a two-vehicle platoon is subjected to relatively small lateral forces. However, during the overtaking process, notable variations in aerodynamic forces and moments occur. In particular, the lateral force coefficient and yaw moment coefficient of two-vehicle platoons reach their peak values at about two vehicle lengths ahead of the critical overtaking position. Furthermore, during the overtaking maneuver, the aerodynamic characteristics of the overtaken vehicle exhibit continuous fluctuations. The resulting variations in the lateral force coefficient and cornering stiffness have a sustained impact on vehicle handling stability, providing crucial insights for enhancing vehicle maneuverability.
1. Introduction
In recent years, the development of high-grade highways and intelligent transportation systems (ITSs) has accelerated globally, promoting the concept of platoon driving as a means to enhance traffic efficiency, reduce fuel consumption, and lower vehicle emissions. However, as vehicles operate within these systems, they are subjected to complex aerodynamic interactions beyond the effects of ground friction, which may pose serious challenges to driving safety. In platoon driving, the reduced gap between vehicles results in shortened inter-vehicle distances. As trailing vehicles enter the wake region of the leading vehicle, mutual aerodynamic interference occurs, significantly affecting parameters such as drag and lift forces [1,2]. Overtaking, commonly encountered during vehicle operation, can drastically alter the flow field between vehicles during the passing phase, potentially leading to instability and compromising driving safety [3]. Therefore, it is necessary to investigate the aerodynamic variations in both platoon driving and overtaking scenarios within intelligent transportation.
Several scholars have investigated the factors influencing the flow field characteristics of vehicles traveling in platoons by combining wind tunnel experiments with numerical simulations. To analyze the flow topology of two vehicles under platoon conditions, Wu et al. (2007) [4] conducted a wind tunnel test using a 1/8-scale car model. They found that when the distance between the two cars exceeded 0.35 times the car length, the drag force on the front vehicle began to surpass that on the rear vehicle. Further studies have shown that the drag force acting on vehicles in a platoon is strongly influenced by the front vehicle’s geometric design and chassis structure [5]. Additionally, the flow field around platooning vehicles is significantly affected by inter-vehicle spacing and Reynolds number [2]. Considering drag reduction effects among sedans in platoon configurations, Hong et al. (1998) [6] concluded that within a specific range of inter-vehicle distances, the aerodynamic drag force of both vehicles decreases significantly. Similarly, Törnell et al. (2021) [7] employed the detailed European truck model to examine the impact of inter-vehicle spacing on aerodynamic performance, revealing that reduced spacing leads to lower aerodynamic resistance for vehicles in a platoon. Some academics show a positive interest in safety distance during the overtaking process. Recent studies using the DrivAer model have investigated the complex aerodynamic interactions in platoons, specifically focusing on the effects of afterbody shapes and various vehicle types at different inter-vehicle distances [8,9].
During the overtaking process, the influence of relative speed on the overtaking vehicle is minimal, whereas it has a significant effect on the overtaken vehicle. As the relative speed increases linearly, both the lateral force coefficient and the yaw moment coefficient between the two vehicles show a slight increase [10]. Extensive research efforts have been made to clarify the mechanisms responsible for the generation of lateral forces and yaw moments during overtaking. Numerical studies with computational fluid dynamics (CFD) have demonstrated that the geometric shape and relative velocity between vehicles play a critical role in the development of these aerodynamic forces during the overtaking maneuver [11,12,13]. Recent numerical investigations have further explored the transient aerodynamic interactions during overtaking maneuvers. For instance, Uddin et al. [14] identified the critical positions where lateral force fluctuations are maximized, while Cheng [15] focused on the stability of following vehicles within a platoon during the passing process.
A review of the limited literature reveals that current research on car platooning and overtaking processes primarily focuses on factors such as the number of vehicles in the platoon, inter-vehicle distance, lateral spacing between vehicles, and relative speed. However, there has been little investigation into the overtaking phenomenon within intelligent car-following platoons. Overtaking in such platoons can cause abrupt fluctuations in the aerodynamic flow field, potentially disrupting the stability of the formation and increasing the risk of traffic accidents. To address this gap, the present study adopts the DrivAer model as the research subject and employs the finite incremental step method. Eight representative phases are selected to capture the aerodynamic behavior of the intelligent car-following platoon during overtaking, under the assumption of negligible relative speed between vehicles. To realistically simulate overtaking scenarios in a computationally efficient manner, this study analyzes a series of typical longitudinal positions ranging from the initiation to the completion of overtaking.
2. Model Establishment and Verification
2.1. Model Introduction
The DrivAer model is an open-source automotive geometry developed collaboratively by BMW, Audi, and the Institute of Aerodynamics and Fluid Mechanics at the Technical University of Munich. It is available in three body styles: fastback, hatchback, and sedan. The DrivAer model maintains a fully detailed car shape, including critical features such as an integrated chassis structure, allowing it to realistically replicate the external flow field characteristics of an actual vehicle [16].
To maintain consistency with the experimental geometric configuration, the present study employs a 1:2.5 scale fastback model as the research subject. In order to simulate the actual operating conditions, the model neglects the cooling airflow, incorporates a sealed grille, and retains the detailed geometry of the standard chassis. A three-dimensional view of the DrivAer model is shown in Figure 1.
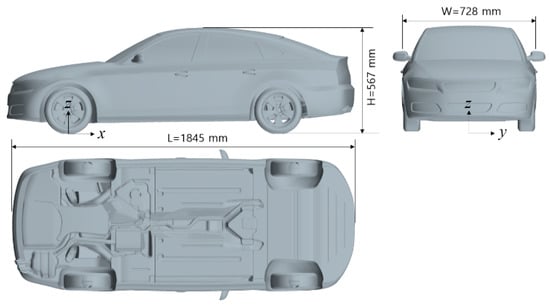
Figure 1.
Three-dimensional view of the DrivAer model (fastback version).
2.2. Establishment of Computational Domain
To maintain consistency with wind tunnel test conditions, the model is placed within a bounding box in the CFD environment, and a rectangular computational domain is constructed to replicate the geometry of the wind tunnel. To ensure fully developed turbulence and flow stability throughout the overtaking process, the upstream distance from the vehicle’s front to the inlet is set to 8 , while the downstream distance from the vehicle’s rear to the outlet is set to 9 . The overall width and height of the computational domain are defined as 17 and 12.5 , respectively. The detailed dimensions and boundary conditions of the computational domain are illustrated in Figure 2.
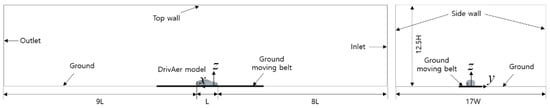
Figure 2.
Dimensions of the computational domain used in the simulation.
To ensure comparability with experimental results, the measurements were conducted at fixed Reynolds numbers rather than at fixed velocities. The specific formula is as follows:
where Re is the Reynolds number, ρ is the air density, U is the airflow velocity, d is the characteristic length, and μ is the dynamic viscosity of the airflow.
The specific boundary conditions are summarized in Table 1.

Table 1.
Summary of boundary conditions used in the simulation.
2.3. Grid Generation and Refinement Strategy
Since grid generation has a significant impact on the accuracy of computational results, different PID (Parts Identification) regions were defined for the vehicle body and the computational domain. Trimmed meshes were generated separately for each PID region. The surface mesh size on the vehicle body ranged from 0.5 mm to 4 mm, while the mesh size for the computational domain was set to 64 mm. All surface meshing was performed using the pre-processing software ANSA 2023 [17,18]. The meshed model was then imported into the commercial CFD software STAR-CCM+ 2020, where boundary layers were created and volume meshes were generated [19,20]. In the simulation setup, the vehicle’s boundary layer was resolved using five prism layers, with a total thickness of 8 mm and a growth factor of 1.3. The first layer height of the prism cells was determined to ensure that the wall y+ values remain within the valid range for the wall functions of the k-epsilon model.
2.4. Governing Equations
Typically, the external flow field around a vehicle is considered three-dimensional, isothermal, and steady. Since the vehicle speed is far lower than one-third of the speed of sound, the airflow can be assumed incompressible. The selection of a turbulence model is critical for accurate numerical predictions. Le et al. (2026) [21] employed the k–ω turbulence model, as it has been demonstrated to strike a balance between accuracy and computational cost. The realizable k–ε model performs well in scenarios involving rotation and large-scale separation, and its non-equilibrium wall functions can effectively capture the pressure distribution on wheel surfaces [22]. The realizable k–ε model was chosen primarily due to its rapid computation speed, relatively low mesh quality requirements, and good convergence properties, which have been validated across numerous automotive engineering studies. While more detailed investigations of flow fields often employ unsteady simulation methods to elucidate flow separation and vortex structures in key separation zones, and subsequently improve aerodynamic characteristics [23,24], the objective of this study was to capture a general trend during overtaking. Given the limited computational resources, the realizable k-epsilon model was deemed sufficient for research purposes.
The realizable k–ε model used in this study belongs to the class of Reynolds-averaged Navier–Stokes (RANS) equations. The RANS equations are derived by decomposing the instantaneous velocity into mean and fluctuating components and then performing a time-average of the Navier–Stokes equations. For incompressible steady flow, the momentum equation can be expressed as:
where is the time-averaged velocity component in the i-th direction, is the time-averaged pressure, ρ is the air density, and μ is the kinematic viscosity. The term represents the Reynolds stress tensor, which accounts for the effects of turbulence and requires closure through a turbulence model [25].
To close the RANS equations, the Reynolds stress term is modeled using the Boussinesq approximation, which assumes that the turbulent stresses are proportional to the mean strain rate:
where is the turbulent (eddy) viscosity, and is the turbulent kinetic energy.
The turbulent viscosity is determined through the realizable k–ε turbulence model, which solves two separate transport equations and is especially suitable for complex geometries such as the DrivAer model [22]. In the numerical implementation, pressure and velocity are coupled using the SIMPLE (Semi-Implicit Method for Pressure-Linked Equations) algorithm. A second-order upwind scheme is used for spatial discretization to improve solution accuracy. The convergence of the numerical simulations was determined by monitoring both the residuals of the governing equations and the aerodynamic force coefficients. Iterations continue until the residuals fall below 1 × 10⁻⁴, and the monitored coefficients remain stable with fluctuations less than 0.001 over at least the last 500 iterations.
2.5. Grid Independence and Model Validation
It is well known that mesh quality significantly affects both computation time and the convergence behavior of numerical simulations. In this study, grid independence validation is conducted to verify the reliability of the mesh generation strategy. Three levels of mesh refinement—coarse, medium, and fine—are applied around the vehicle body to assess grid independence. Based on these refinement schemes, volume meshes consisting of approximately 7.7 × 10⁶, 1.49 × 10⁷, and 1.89 × 10⁷ cells are generated. The corresponding simulation results are presented in Table 2. Among the three, the fine mesh scheme shows the closest agreement with experimental data, with a deviation of only 0.8%, satisfying the accuracy requirements. Moreover, since the computational resource demand of the fine mesh scheme is not significantly higher than that of the other two, and its accuracy is superior, it is selected as the refined mesh scheme for subsequent simulations.
Table 2.
The drag coefficients for different mesh refinement levels.
The grid refinement region on the y = 0 m plane for the fine mesh scheme is illustrated in Figure 3. As shown in Figure 3, three large refinement zones are arranged around the vehicle. To accurately capture the flow characteristics at the rear of the vehicle, an extended refinement area is specifically applied in the wake region.
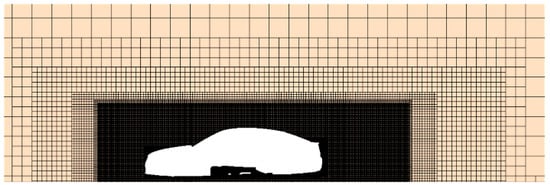
Figure 3.
Grid refinement distribution on the y = 0 m plane in the fine mesh scheme.
In addition, in order to obtain more aerodynamic characteristics of the model, 25 pressure monitoring points are evenly distributed in the longitudinal plane of the body of the model, the location of these specific points is set according to Ref. [20]. The locations of the monitoring points are shown in Figure 4.
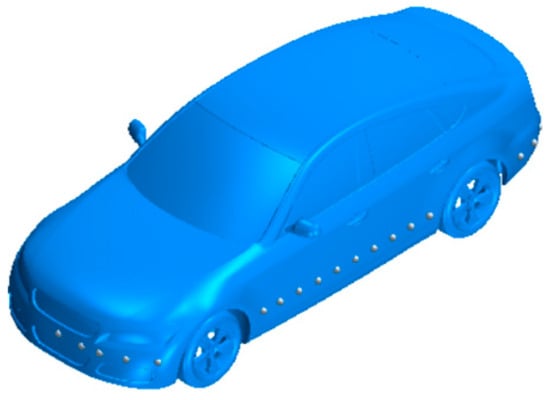
Figure 4.
Location of surface pressure monitoring points on the z = 0.15 m plane.
Similarly, the six-component balance outputs the pressure at the monitoring points, which is then converted into the pressure coefficient (Cₚ) using Equation (4).
where P is the monitored static pressure, is the freestream (ambient) pressure, ρ is the air density, and U is the freestream airflow velocity.
Pressure values at 25 monitoring points, evenly distributed near the vehicle body surface on the z = 0.15 m plane, are extracted and compared with corresponding experimental results. The comparison is illustrated in Figure 5. As shown in the figure, the overall trend of the simulation results aligns well with the experimental data, with only minor deviations observed at a few discrete points. Therefore, the simulation results are considered reliable for further analysis.
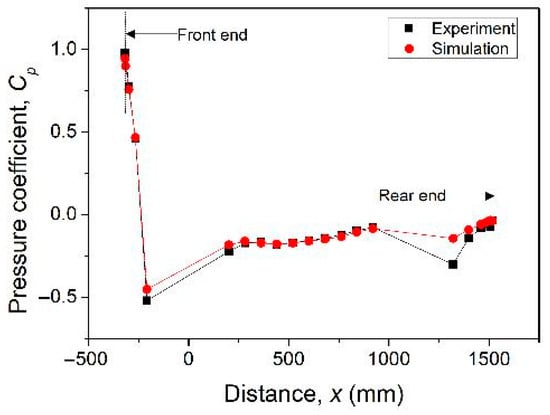
Figure 5.
Distribution of the pressure coefficient on the z = 0.15 m plane.
3. Aerodynamic Characteristics of Vehicles in Platoon Driving
The previous section confirmed the aerodynamic characteristics under single-vehicle driving conditions and validated the credibility of the computational domain and mesh generation strategy for a single vehicle. Following Azim et al. (2000) [2] when the relative speed between the overtaking and overtaken vehicles is sufficiently small, the aerodynamic interference can be approximated by a sequence of quasi-steady “snapshots.” Importantly, the steady solutions do not form ensemble averages of the entire non-stationary maneuver; rather, each steady RANS solution represents the Reynolds-averaged mean aerodynamic loads for a statistically steady flow at a given relative position. In addition, Yamamoto et al. (1997) [10] compared static and dynamic overtaking approaches and reported that dynamic effects remain small within a limited relative-speed range. Therefore, to simulate the overtaking process in a platoon while conserving computational resources, this study selects several representative longitudinal positions covering the entire overtaking sequence—from initiation to completion—for analysis.
The scenario of a single vehicle overtaking another has been extensively investigated in the literature [11]. Therefore, a separate baseline analysis for this case is not repeated in this manuscript. Instead, this study focuses on the aerodynamic interference occurring when a single vehicle overtakes a two-vehicle formation, which constitutes the primary configuration investigated herein.
A schematic diagram of the overtaking process is shown in Figure 6. The overtaking vehicle is designated as Car 1, while the vehicles being overtaken are referred to as Car 2 and Car 3. All vehicles travel in the positive x-axis direction, with the y-axis defined as perpendicular to the x-axis and pointing toward the vehicle body. Existing literature on vehicle platooning suggests that effect of lateral spacing between two vehicles becomes negligible in terms of lateral force interaction when the spacing approximates twice the vehicle width. As spacing decreases, lateral forces increase rapidly, indicating that the safe lateral distance for side-by-side driving should lie between one vehicle width and half a vehicle width. To ensure safe overtaking, this study adopts a lateral spacing of W (one vehicle width) [26]. Considering the average drag of the platoon configuration, the wake effect is beneficial for platoons with inter-vehicle spacing . Taking lateral overtaking scenarios into account, the ideal longitudinal position ranges from to . After comprehensive consideration, the longitudinal spacing between vehicles within the platoon is set to 0.5 L (0.5 vehicle length) [27]. The longitudinal travel distance of Car 1 in each phase is represented by , where the positive direction of is aligned with the vehicle’s direction of travel. In this study, the normalized parameter is used to represent the relative longitudinal position of Car 1, where L denotes the vehicle length. With a phase interval of 0.5 , eight simulation cases are selected, covering the range to 3.5.
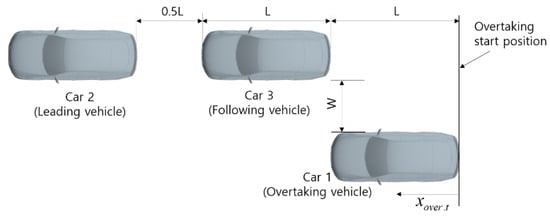
Figure 6.
Schematic diagram of the overtaking process and coordinate definitions for Car 1 (overtaking vehicle), Car 2 (leading vehicle), and Car 3 (following vehicle).
Analysis of Aerodynamic Characteristics in Platoons
In vehicle aerodynamic analysis, three non-dimensional coefficients are primarily used to evaluate the aerodynamic forces and moments acting on the vehicle body: the drag coefficient (CD), the lateral force coefficient (CS), and the yaw moment coefficient (CYM). These coefficients normalize the respective aerodynamic quantities by the dynamic pressure and appropriate reference values, and are defined as follows:
These coefficients are essential in characterizing aerodynamic behavior, particularly in evaluating drag performance, lateral stability, and yaw response during transient conditions such as crosswind or overtaking maneuvers.
Two DrivAer models are placed within the computational domain used in the previous section, maintaining a longitudinal spacing of half a vehicle length. The simulations are conducted using the same methodology described earlier in this paper. The corresponding results are presented in Table 3. It can be observed that, compared to the single-vehicle scenario, the drag coefficient (CD) of the rear vehicle increases by approximately 6.1%, while that of the front vehicle decreases by about 20.3%. It is worth noting that the lateral force coefficient and yawing moment coefficient of a single vehicle are not zero. This is primarily due to the modeling process of the DrivAer model. Apart from closing the front grille and simplifying the cooling system, all other components remain consistent with the experimental model. The vehicle’s chassis is relatively complex and asymmetric, causing the airflow to undergo significant separation as it passes beneath the chassis. The vortices generated from this separation merge with the airflow on both sides, creating a pressure difference along the vehicle’s sides, which leads to a non-zero lateral force. Additionally, the discretization process (converting continuous equations into discrete ones) inherent in solving the governing equations introduces errors. Moreover, the modeling employed does not accurately capture small-scale details of boundary layer separation, or other very small disturbances. This contributes to uncertainty in, for example, the small lateral force coefficient.
Table 3.
Aerodynamic force and moment coefficients for two-vehicle platoon simulation.
Furthermore, Table 3 indicates that, when two vehicles travel in a platoon, both experience relatively small lateral forces, suggesting that significant lateral displacement is unlikely. However, both vehicles are clearly subjected to yaw moments, causing the front ends of both vehicles to deflect leftward. Notably, the absolute value of CYM on Car 2 is smaller than that on a single car, indicating a smaller yaw moment in this position. In addition, the absolute value of car 2’s CYM is smaller than that of a single car, indicating that car2 is experiencing a smaller yaw moment at this moment and is deflecting more toward the straight-ahead direction.
The pressure distribution on the z = 0.15 m plane for the two-vehicle platoon is shown in Figure 7. The high-pressure region at the front of Car 2 is more pronounced than that at the corresponding location on Car 3. Conversely, the low-pressure region near the rear of Car 2 is smaller than that of Car 3. As a result, the overall pressure differential between the front and rear of Car 2 is less than that of Car 3, resulting in a higher drag coefficient (CD) for Car 3. As the airflow passes over the vehicle body, it splits to both sides, forming a low-pressure region along the vehicle’s lateral surfaces. In the platoon configuration, the low-pressure zones on either side of both vehicles remain largely symmetrical. This symmetry leads to only minor differences in the lateral force coefficient (CS) between the two cars, which helps maintain straight-line driving stability within the platoon. When there is a significant pressure difference between the front and rear of a vehicle, notable yaw moments may be generated [8]. For Car 2, the elevated pressure at the front induces a clockwise yaw moment, while the increased pressure at the rear generates a counteracting counterclockwise yaw moment, leading to internal yaw moment cancelation. In contrast, since Car 3 is located within the wake of Car 2, the pressure at the front of Car 3 is reduced, resulting in consistent counterclockwise yaw moments acting on both the front and rear. This causes a stronger tendency for Car 3 to yaw toward the left. Consequently, the absolute value of the yaw moment coefficient (CYM) for Car 3 is greater than that of Car 2.
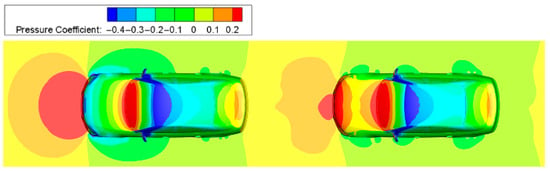
Figure 7.
Pressure distribution on the z = 0.15 m plane for Car 2 and Car 3 in the platoon.
Figure 8 illustrates the velocity distribution of vehicles in a platoon on the y = 0 m plane. As shown in the figure, Car 3, located in the wake region of the leading vehicle (Car 2), significantly alters the flow field. The wake generated by Car 2 is deflected upwards upon impinging on the front of Car 3, and part of this deflected wake recirculates toward the rear of Car 2. This recirculation increases the local flow velocity in the wake region of Car 2, which in turn contributes to partial pressure recovery at its rear end. Moreover, due to the deflection of the wake flow over the front surface of Car 3, the volume of flow re-entering its wake region is reduced. This phenomenon leads to a substantial decrease in the velocity of the airflow behind Car 3, affecting the low-pressure zone at its rear.
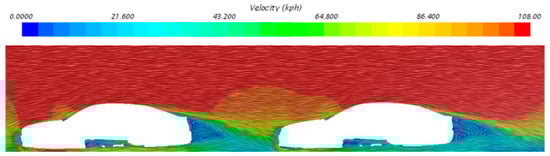
Figure 8.
Velocity distribution on the y = 0 m plane showing wake interaction between Car 2 and Car 3 in a platoon configuration.
Distribution of streamlines provide an intuitive visualization of airflow direction, offering direct insight for assessing flow field variations. Figure 9 presents the streamline plot for the y = 0 plane of the vehicle queue. From the figure, it can be observed that the airflow passing over the rear and undercarriage of Car 2 converges beneath the front of Car 3, forming a rearward-directed flow. The redistribution of airflow significantly reduces the volume of flow directly impacting the front section of Car 3, thereby decreasing the pressure at the vehicle’s front. The overall effect results in a slight pressure drop in the wake region, coupled with a significant reduction in front pressure, leading to a decreased overall pressure differential across the vehicle body. However, the drag coefficient remains higher than that of Car 2.
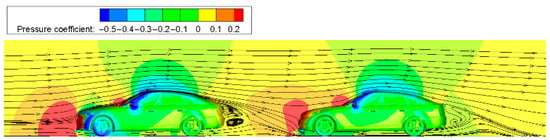
Figure 9.
Streamlines and pressure distribution on the y = 0 m plane for Car 2 and Car 3 in a platoon.
4. Aerodynamic Characteristics of Overtaking in Platoon Driving
Analysis of Aerodynamic Behavior During the Overtaking Process in Platoon Driving
The primary focus of this study is the evolution of the flow field when a vehicle overtakes a platoon of vehicles. Accordingly, the analysis centers on the changes in aerodynamic characteristics of the vehicles being overtaken. The computed variations in drag coefficient (CD), lateral force coefficient (CS), and yaw moment coefficient (CYM) for the overtaking vehicle during key overtaking phases are presented in Figure 10, Figure 11 and Figure 12, respectively.
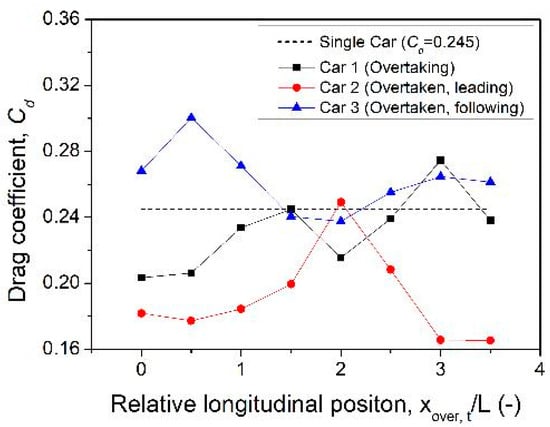
Figure 10.
Variation in aerodynamic drag coefficient (CD) of the three vehicles during the overtaking process.
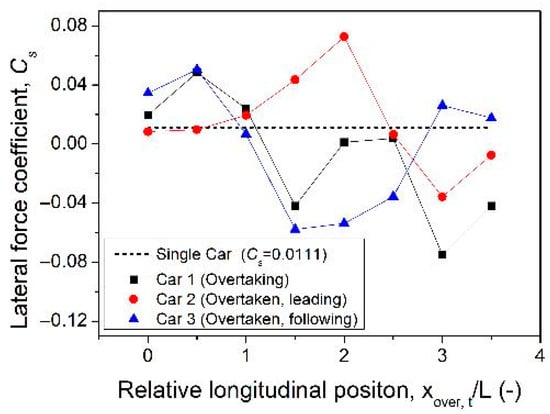
Figure 11.
Variation in lateral force coefficient (CS) of the three vehicles during the overtaking process.
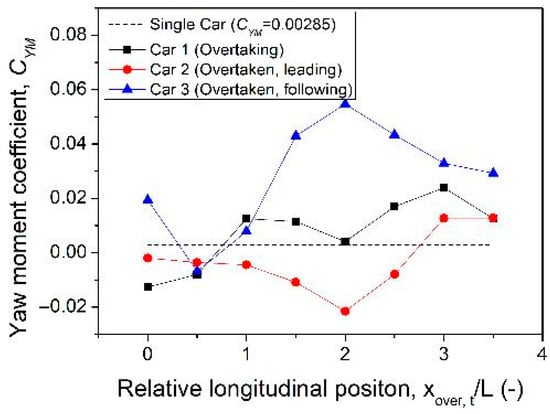
Figure 12.
Variation in yaw moment coefficient (CYM) of the three vehicles during the overtaking process.
The results reveal that the aerodynamic forces acting on the overtaking vehicle undergo significant fluctuations throughout the overtaking process. Since the main objective of this paper is to examine how flow field variations influence vehicle handling stability during overtaking, the following section provides a detailed analysis of the aerodynamic behavior of the overtaking vehicle. This is accomplished by correlating the trends in aerodynamic coefficients with the pressure distribution at selected discrete phases.
From the stage of to 3.5, the interference side of the overtaken vehicles is strongly affected by the combined influence of three flow field regions: the high-pressure zone at the front of the overtaking vehicle, the low-pressure zone on the interference side, and the wake region. This combined aerodynamic interference causes continuous changes in the aerodynamic characteristics of each vehicle throughout the overtaking process. Figure 13 presents the pressure distribution on the z = 0.15 m plane at . At this initial overtaking stage, Car 3 is subjected to elevated pressure from the front end of the overtaking vehicle (Car 1), which leads to a noticeable reduction in the negative pressure region on the interference side. As a result, the lateral force coefficient (CS) of Car 3 increases along the y-axis direction.
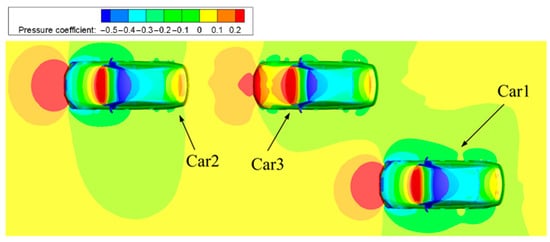
Figure 13.
Pressure distribution on the z = 0.15 m plane at , showing initial aerodynamic interaction during the overtaking process.
Meanwhile, the pressure on the upper surface of Car 2 remains largely unchanged. However, a slight decrease in pressure at the right-front section of Car 3 contributes to the generation of a counterclockwise yaw moment at the rear of Car 2. This results in a minor reduction in the yaw moment coefficient (CYM) for Car 2, compared to its value during straight platoon driving without overtaking. Overall, flow field analysis at this phase indicates that Car 2 experiences minimal aerodynamic disturbance when overtaking begins.
When the overtaking vehicle reaches , as illustrated in Figure 14, the entire front high-pressure zone of Car 1 enters the interference side of the overtaken vehicle. Due to the reduced gap between Car 1 and Car 3, the local flow velocity increases, leading to an expansion of the low-pressure region along the interference side. As a result, although the negative pressure region on the interference side of Car 3 continues to grow, the vehicle experiences an increase in the lateral force coefficient (CS) and a noticeable decrease in the yaw moment coefficient (CYM) due to the influence of the high-pressure field from the overtaking vehicle.
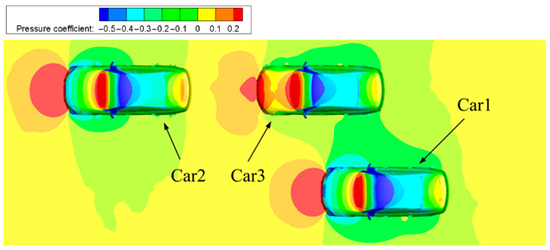
Figure 14.
Pressure distribution on the z = 0.15 m plane at , showing aerodynamic interaction between Car 1 and the overtaken vehicles.
A similar effect is observed for Car 2. The positive pressure from the front of Car 1 increases the pressure along the interference side of Car 2, resulting in a rise in lateral aerodynamic force. The pressure imbalance between the interference side and the open side of Car 2 induces a clockwise yaw moment, which manifests as a further reduction in CYM.
As shown in Figure 15, when the overtaking vehicle reaches , Car 1 and Car 3 are positioned side by side, exhibiting near-symmetry except for the influence of the high-pressure region at the front of Car 1. At this stage, the low-pressure regions on the interference sides of both vehicles reach their maximum extent. Although Car 3 is still affected by the positive pressure generated by Car 1, the pressure difference between its open side and interference side increases. As a result, the overall lateral aerodynamic force acting on Car 3 stabilizes, leading to a slight decrease in the lateral force coefficient (CS). Additionally, as the influence of Car 1’s positive pressure diminishes, the asymmetry in pressure distribution becomes more pronounced, resulting in an increased counterclockwise deflection of the car body. Accordingly, the yaw moment coefficient (CYM) increases.
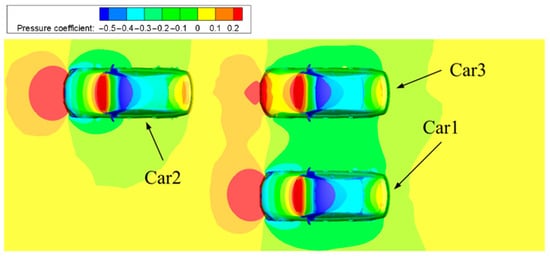
Figure 15.
Pressure distribution on the z = 0.15 m plane at , showing flow symmetry and aerodynamic effects during the midpoint of the overtaking process.
Furthermore, Car 2 undergoes a notable change in aerodynamic behavior. A significant increase in pressure on the left (interference) side of Car 2 leads to a rise in the lateral force coefficient (CS) and a corresponding decrease in the yaw moment coefficient (CYM).
When Car 1 reaches , it has already passed beyond the midpoint of Car 3, leading to a significant alteration in the flow field. The corresponding pressure distribution on the z = 0.15 m plane is shown in Figure 16. During this stage, both the lateral force coefficient (CS) and yaw moment coefficient (CYM) of Car 2 and Car 3 change markedly. As Car 1 moves toward the rear of Car 2, the influence of its front high-pressure region on Car 3 further weakens. The size of the low-pressure region between Car 2 and Car 3 decreases, resulting in an increased pressure difference between the open side and interference side of Car 3. This growing asymmetry causes a continued rise in CS, with lateral force acting in the direction opposite to that in earlier stages.
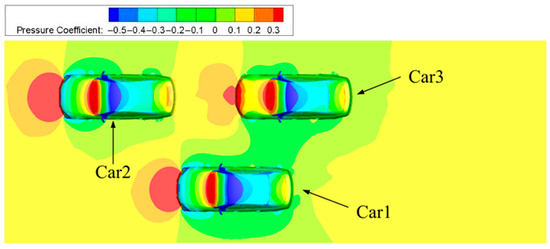
Figure 16.
Pressure distribution on the z = 0.15 m plane at , showing intensified aerodynamic interactions as Car 1 overtakes Car 3.
Simultaneously, the pressure imbalance between the open and interference sides of Car 2 intensifies, leading to an overall increase in CS toward the interference side. In comparison to the previous stage, the low-pressure region near the body surface of Car 2 becomes narrower. The resulting torque, generated by the pressure difference between the upper half of Car 2’s interference side and its open side, induces a counterclockwise rotation, which reduces CYM.
In contrast, the lower half of Car 3’s body on the interference side experiences a notable increase in pressure, creating a new pressure differential with the open side. This imbalance, combined with the growing lateral force, causes Car 3 to yaw clockwise, resulting in a rapid increase in CYM.
When Car 1 reaches , as illustrated in Figure 17, it has completely overtaken Car 3 and entered the interference side of Car 2. At this moment, CS of Car 2 and CYM of Car 3 reach their maximum values, and analysis can be carried out by combining streamlines and pressure gradient distribution. At this stage, the high-pressure area at the front of Car 1 pushes the airflow between Car 1 and Car 2 towards Car 2, which significantly increases the lateral aerodynamics on the interference side of Car 2 to its maximum value of 13.4 N at model scale. Simultaneously, the low-pressure regions between Car 1 and Car 2 begin to merge. As a result, the pressure difference between the open side and the interference side of Car 2 continues to intensify, inducing a stronger counterclockwise yaw moment and causing CYM to reach its minimum. The results obtained from numerical simulation indicate that the maximum lateral force exerted on the scale model is 13.4 N. According to the geometric scaling law, this lateral force corresponds to an actual value of approximately 33.5 N on a full-size vehicle. Although a lateral force of 33.5 N is insufficient to directly trigger a rollover, it significantly compromises the vehicle’s lateral stability, thereby accelerating the progression towards a rollover condition.
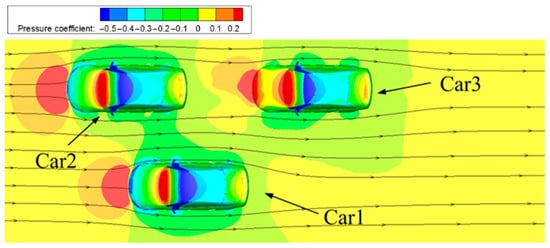
Figure 17.
Streamline and pressure distribution on the z = 0.15 m plane at , illustrating maximum lateral force on Car 2 and yaw moment variation in Car 3.
In the case of Car 3, the pressure on the open side increases while the overall pressure difference between the open and interference sides decreases. This reduction in asymmetry leads to a gradual increase in its lateral force coefficient (CS). Additionally, the high-pressure zone at the front of Car 3 becomes smaller compared to the previous phase, weakening its stabilizing effect. Ultimately, the dominant clockwise yaw moment generated at the front of Car 3 leads to a slight increase in its yawing moment coefficient (CYM), reaching a maximum value that corresponds to a yawing moment of approximately 7.36 N·m. Although this value is not large enough to cause the vehicle to twist directly, it does increase the tendency for the vehicle to twist.
Figure 18 illustrates the flow characteristics of each vehicle when Car 1 reaches . At this stage, Car 1 and Car 2 are positioned side by side. The high-pressure zones at the front of both vehicles have merged, and the low-pressure region between their interference sides expands to its maximum extent. The influence of the high-pressure field at the front of Car 1 on the interference side of Car 2 continues to diminish. However, the pressure difference between the open and interference sides of Car 2 increases significantly. As a result, CS acting on Car 2 increases sharply in the opposite direction, while the absolute value of the yaw moment coefficient (CYM) decreases accordingly. In contrast, Car 3 is now less affected by the wake flow of Car 1. The pressure on its interference side continues to rise, reducing the pressure differential between the open and interference sides. Consequently, the absolute value of CS acting on Car 3 decreases. Although a clockwise yaw moment is still induced by the pressure difference across the upper half of Car 3’s body, the expanding high-pressure zone at the front of Car 3 generates a counterclockwise yaw moment that partially offsets it. As a result, the yaw moment coefficient (CYM) of Car 3 decreases to a certain extent.
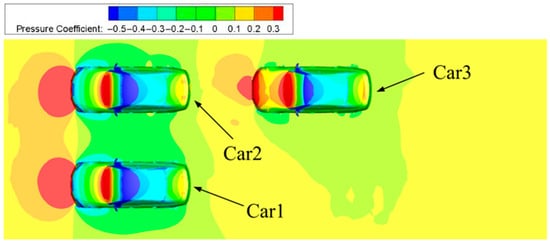
Figure 18.
Pressure distribution on the z = 0.15 m plane at .5, showing aerodynamic interaction as Car 1 aligns with Car 2.
As shown in Figure 19, when the overtaking vehicle (Car 1) continues to advance and reaches , the influence of its front high-pressure region on the interference side of Car 2 further diminishes. Although the size of the low-pressure region between Car 1 and Car 2 decreases, the pressure on the open side of Car 2 rises slightly, resulting in greater differential pressure between the open and interference sides. Consequently, the lateral force coefficient (CS) acting on Car 2 increases further in the direction of the interference side, indicating that the aerodynamic attraction of Car 2 toward Car 1 reaches its peak at this stage. Additionally, the lower half of Car 2’s body on the interference side is influenced by the wake flow of Car 1, leading to noticeable pressure recovery in this region. The pressure difference between this recovered area and the corresponding open side generates a counterclockwise yaw moment at the rear of Car 2. This counteracts, to some extent, the clockwise yaw moment generated by the high-pressure region at the front. As a result, the overall yaw moment coefficient (CYM) of Car 2 decreases.
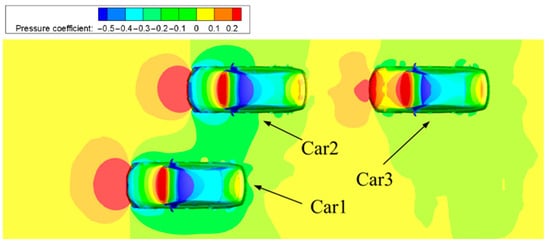
Figure 19.
Pressure distribution on the z = 0.15 m plane at , highlighting peak aerodynamic attraction on Car 2 and recovery effects on Car 3.
Meanwhile, as the rear end of Car 1 moves further away from Car 3, the front positive pressure region of Car 3 becomes less influenced by Car 1. Accordingly, the high-pressure area at the front of Car 3 begins to expand, and the pressure recovers on its interference side becomes more prominent. This results in lateral force and yaw moment components on Car 3 acting in opposite directions.
When Car 1 reaches , it has fully completed the overtaking process of the vehicles traveling in the platoon, as illustrated in Figure 20. At this point, the aerodynamic interaction between the interference sides of Car 1 and Car 3 is further diminished. The pressure on the interference side of Car 2 increases rapidly, while the pressure difference between its open and interference sides decreases. As a result, the absolute value of the overall lateral force acting on Car 2 is reduced accordingly. Notably, there is significant pressure recovery on the lower half of Car 2’s body, which partially offsets the lateral moment generated by the pressure difference on the upper half. This balanced effect causes the yaw moment coefficient (CYM) of Car 2 to remain nearly unchanged.
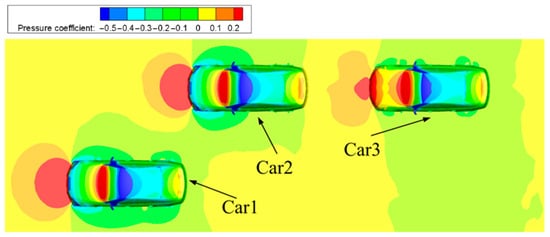
Figure 20.
Pressure distribution on the z = 0.15 m plane at , showing the flow field recovery after the completion of the overtaking maneuver.
As for Car 3, it is scarcely influenced by the wake flow of Car 1 after the overtaking process is completed. The low-pressure region on the interference side of Car 3 returns to a state similar to that observed under two-vehicle platoon driving conditions. Compared to the previous phase, the pressure differential between its open and interference sides is reduced, resulting in a decrease in the lateral force coefficient (CS) and a corresponding reduction in CYM.
5. Conclusions
The present study employed a numerical simulation approach, which was subsequently validated through a comparison with wind tunnel test results. The findings revealed a mere 0.8% discrepancy in the aerodynamic drag coefficient, thereby confirming the reliability of the computational method and establishing a solid foundation for the feasibility of analyzing aerodynamic characteristics during overtaking in subsequent investigations. The aerodynamic characteristics of vehicles traveling in a platoon, as well as the aerodynamic responses of overtaken vehicles during the overtaking process, were investigated. The following conclusions were obtained:
- (1)
- During steady platoon driving, no significant lateral aerodynamic disturbance occurs between adjacent vehicles. As a result, both Car 2 and Car 3 are subjected to relatively small lateral forces. For Car 2, the high-pressure region at the front induces a clockwise yaw moment, while increased pressure at the rear end generates a counterclockwise yaw moment, resulting in an overall leftward lean of the vehicle body. In contrast, Car 3, located in the wake of Car 2, experiences reduced frontal positive pressure. Consequently, both the front and rear ends of Car 3 are subjected to counterclockwise yaw moments, which cause Car 3 to lean more noticeably to the right compared to Car 2. The absolute value of the yaw moment coefficient (CYM) for Car 3 is greater than that of Car 2.
- (2)
- During the overtaking process, the aerodynamic characteristics of the overtaken vehicle exhibit continuous fluctuations. The variations in lateral force coefficient and cornering stiffness have a sustained impact on vehicle handling stability, which provides an important reference for improving vehicle maneuverability. At , the lateral force acting on Car 2 reaches its maximum, indicating the strongest tendency of the vehicle to be pushed away from the overtaking car along its open side. Simultaneously, Car 3 experiences its maximum yaw moment, resulting in a pronounced tendency for the vehicle to rotate toward the overtaking vehicle. This highlights the peak of aerodynamic instability in the overtaking scenario.
- (3)
- This study primarily employs numerical simulation methods. However, numerical simulations are merely one of many research tools, and actual flow environments are often more complex than simulated ones. To enhance the reliability of the research conclusions, future work should conduct relevant experiments to validate the numerical results. Additionally, the overtaking process was approximated using steady-state RANS “snapshots,” thus the results only represent average aerodynamic forces and moment coefficients, failing to capture unsteady fluctuations. Non-aerodynamic forces (such as rolling resistance and drivetrain friction) were not considered, which exceeds the scope of this CFD-based analysis. The observed changes in lateral force and yaw moment coefficients do not directly impact vehicle handling stability. This research provides a reference for safety assessments that couple vehicle dynamics/driver models and consider crosswinds/turbulence, which will be addressed in future studies.
Author Contributions
Conceptualization, T.Z.; writing—original draft preparation, T.Z.; methology—software, Q.-Y.C.; writing—review and editing, S.-J.K.; supervision, G.-S.L. All authors have read and agreed to the published version of the manuscript.
Funding
This research received no external funding.
Data Availability Statement
The raw data supporting the conclusions of this article will be made available by the authors on request.
Conflicts of Interest
The authors declare no conflicts of interest.
References
- Okumura, K.; Kuriyama, T. Transient Aerodynamic Simulation in Crosswind and Passing an Automobile; SAE Technical Paper 970404; SAE International: Warrendale, PA, USA, 1997. [Google Scholar] [CrossRef]
- Azim, A.F.A.; Gawad, A.F.A. A Flow Visualization Study of the Aerodynamic Interference Between Passenger Cars; SAE Technical Paper 2000-01-0355; SAE International: Warrendale, PA, USA, 2000. [Google Scholar] [CrossRef]
- Zabat, M.; Frascaroli, S.; Browand, F.K. Drag Measurements on 2, 3 and 4 Car Platoons; SAE Technical Paper 940421; SAE International: Warrendale, PA, USA, 1994. [Google Scholar] [CrossRef]
- Wu, Y.; He, B.; Fu, L. Influence of Velocity on Transient Aerodynamic Characteristics of Overtaking and Overtaken Vehicles. J. Jilin Univ. 2007, 37, 1009–1013. [Google Scholar]
- Ebrahim, H.; Dominy, R.; Martin, N. Aerodynamics of Electric Cars in Platoon. Proc. Inst. Mech. Eng. Part D J. Automob. Eng. 2021, 235, 1396–1408. [Google Scholar] [CrossRef]
- Hong, P.; Marcu, B.; Browand, F.; Tucker, A. Drag Forces Experienced by Two, Full-Scale Vehicles at Close Spacing. 1998. Available online: https://escholarship.org/uc/item/50q2p3sn (accessed on 7 January 2026).
- Törnell, J.; Sebben, S.; Söderblom, D. Influence of Inter-Vehicle Distance on the Aerodynamics of a Two-Truck Platoon. Int. J. Automot. Technol. 2021, 22, 747–760. [Google Scholar] [CrossRef]
- Ebrahim, H.; Dominy, R.; Martin, N. The Effect of Afterbody Geometry on Passenger Vehicles in Platoon. Energies 2021, 14, 7553. [Google Scholar] [CrossRef]
- Kim, I.; Lee, J.; Park, S.; Han, K. Effects of Vehicle Type and Inter-Vehicle Distance on Aerodynamic Characteristics during Vehicle Platooning. Appl. Sci. 2021, 11, 4096. [Google Scholar] [CrossRef]
- Yamamoto, S.; Yanagimoto, K.; Fukuda, H.; China, H.; Nakagawa, K. Aerodynamic Influence of a Passing Vehicle on the Stability of the other Vehicles. JSAE Rev. 1997, 18, 39–44. [Google Scholar] [CrossRef]
- Sun, H.; Karadimitriou, E.; Li, X.M.; Mathioulakis, D. Aerodynamic Interference between Two Road Vehicle Models during Overtaking. J. Energy Eng. 2019, 145, 04019002. [Google Scholar] [CrossRef]
- Park, S.; Nam, S.; Sankar, G.S.; Han, K. Evaluating the Efficiency of Connected and Automated Buses Platooning in Mixed Traffic Environment. Electronics 2022, 11, 3231. [Google Scholar] [CrossRef]
- Park, S.O.; Lee, J.H.; Kim, M.S.; Jung, D.Y.; Chang, J.H. Numerical Study on Understanding the Force and Moment Changes Acting on the Overtaking Vehicle During Overtaking Process. Int. J. Automot. Technol. 2023, 24, 195–205. [Google Scholar] [CrossRef]
- Uddin, M.; Chellaram, A.D.; Robinson, A.C. CFD Investigations of the Aerodynamics of Vehicle Overtaking Maneuvers. AIP Conf. Proc. 2017, 1851, 020085. [Google Scholar] [CrossRef]
- Cheng, S.Y.; Tsubokura, M.; Nakashima, T.; Okada, Y.; Nouzawa, T. Effects of Transient Aerodynamics on Vehicle Stability: A Large Eddy Simulation Analysis. In Proceedings of the 30th AIAA Applied Aerodynamics Conference, New Orleans, LA, USA, 25–28 June 2012. [Google Scholar] [CrossRef][Green Version]
- Heft, A.I.; Indinger, T.; Adams, N.A. Experimental and Numerical Investigation of the DrivAer Model. In Proceedings of the ASME 2012 Fluids Engineering Division Summer Meeting, Rio Grande, PR, USA, 8–12 July 2012; pp. 41–51. [Google Scholar] [CrossRef]
- Zaya, J. Aerodynamic Optimization of Ground Vehicles with the Use of Fluent’s Adjoint Solver. 2013. Available online: https://www.semanticscholar.org/paper/Aerodynamic-Optimization-of-Ground-Vehicles-with-of-Zaya/51b2e06f6e331ac936a74accc170e60cb61e5f55 (accessed on 7 January 2026).
- BETA CAE Systems. ANSA, version 23.1.0; BETA CAE Systems: Root, Switzerland, 2023. Available online: https://www.beta-cae.com/ansa.htm (accessed on 7 January 2026).
- Simmonds, N.; Pitman, J.; Tsoutsanis, P.; Jenkins, K.; Gaylard, A.; Jansen, W. Complete Body Aerodynamic Study of three Vehicles; SAE Technical Paper 2017-01-1529; SAE International: Warrendale, PA, USA, 2017. [Google Scholar] [CrossRef]
- Siemens Digital Industries Software. Simcenter STAR-CCM+, Version 2021.1; Siemens Digital Industries Software: Plano, TX, USA, 2021. Available online: https://support.sw.siemens.com (accessed on 7 January 2026).
- Le, T.L.; Phan, T.P.; Tran, D.; Vu, V.T.; Do, L.H.T. A CFD Study of the Aerodynamic Characteristics of a DrivAer Fastback Model. Aerosp. Sci. Technol. 2026, 168, 111043. [Google Scholar] [CrossRef]
- Yu, X.; Jia, Q.; Bao, D.; Yang, Z. A Comparative Study of Different Wheel Rotating Simulation Methods in Automotive Aerodynamics; SAE Technical Paper 2018-01-0728; SAE International: Warrendale, PA, USA, 2018. [Google Scholar] [CrossRef]
- Ballerstein, N.; Horst, P. Manipulation of the Aerodynamic Behavior of the DrivAer model using Dimple Patterns. J. Wind Eng. Ind. 2023, 233, 105216. [Google Scholar] [CrossRef]
- Rüttgers, M.; Park, J.; You, D. Large-eddy Simulation of Turbulent Flow over the DrivAer fastback Vehicle Model. J. Wind Eng. Ind. 2019, 186, 123–138. [Google Scholar] [CrossRef]
- Bardina, J.; Huang, P.; Coakley, T. Turbulence Modeling Validation. In Proceedings of the 28th Fluid Dynamics Conference, Snowmass Village, CO, USA, 29 June–2 July 1997. [Google Scholar] [CrossRef]
- Fu, L.M.; Fu, Y.F. Numerical Simulation on Characteristics of Turbulent Flow around Two Cars Driving Side-by-side. J. Jilin Univ. (Eng. Technol. Ed.) 2005, 35, 358–362. [Google Scholar]
- Gan, E.C.J.; Fong, M.; Ng, Y.L. CFD analysis of slipstreaming and side drafting techniques concerning aerodynamic drag in NASCAR racing. CFD Lett. 2020, 12, 1–16. [Google Scholar] [CrossRef]


Disclaimer/Publisher’s Note: The statements, opinions and data contained in all publications are solely those of the individual author(s) and contributor(s) and not of MDPI and/or the editor(s). MDPI and/or the editor(s) disclaim responsibility for any injury to people or property resulting from any ideas, methods, instructions or products referred to in the content. |
© 2026 by the authors. Licensee MDPI, Basel, Switzerland. This article is an open access article distributed under the terms and conditions of the Creative Commons Attribution (CC BY) license.