Article

What Is the Internal Pressure That Initiates Damage in Cementitious Materials during Freezing and Thawing? A Micromechanical Analysis

Chair of Materials Science and Testing, Centre for Building Materials (CBM), TUM School of Engineering and Design, Department of Materials Engineering, Technical University of Munich, Franz-Langinger-Strasse 10, 81245 Munich, Germany
*
Author to whom correspondence should be addressed.
Appl. Mech. 2022, 3(4), 1288-1298; https://doi.org/10.3390/applmech3040074
Submission received: 30 September 2022 / Revised: 28 October 2022 / Accepted: 2 November 2022 / Published: 5 November 2022
(This article belongs to the Special Issue Fracture Mechanics and Durability of Engineering Materials)

Abstract

:
Damage induced by repetitive freezing and thawing processes is one of the critical factors that affect concrete durability in cold climates. This deterioration process manifests as surface scaling and internal damage. The damage processes are governed by physicochemical mechanisms that are active across multiple scales. In this contribution, we present a novel multiscale theoretical framework for estimating the critical pressure required for microcrack initiation during freezing and thawing of cementitious mortar. Continuum micromechanics and fracture mechanics is used to model the phenomena of microcrack initiation and growth. Damage at the microscale is upscaled to the level of the specimen using multilevel homogenization. The critical pressure is estimated using poromechanics at the microscopic scale. A theoretical analysis shows that in the frozen state, the material can resist higher pressures. As a consequence, the material is more susceptible to damage during thawing. The micromechanical predictions are within the range of the predictions obtained by electrokinetic theory.

1. Introduction

By 2050, 70% of the world’s population is projected to live in urban areas [1]. This would require enormous investments in infrastructure made of concrete. Given the carbon footprint associated with the construction of concrete infrastructure, the recent focus has been on increasing the sustainability of concrete infrastructure. Increasing the service life of concrete infrastructure is one of the essential components in improving sustainability. Damage of concrete due to frost is an important factor that negatively affects the durability of concrete in cold climates. One familiar example is the freeze–thaw induced damage of concrete pavements during winter. Two types of material deterioration attributed to freeze–thaw loads are the scaling of the surface and the internal microcracking that is driven by physicochemical mechanisms such as phase-change, transport and hygro-thermomechanical stresses acting over multiple scales. Seminal contributions to our current understanding of freeze–thaw induced deterioration of cement-based materials include the work of Powers and Helmuth (osmotic pressure) [2], Scherer (crystallization pressure) [3,4], Coussy and Monteiro (poromechanics) [5], Setzer (thermal equilibrium/micro-ice lens) [6] and Zhao (nanofluidic salt-trapping) [7]. The aforementioned theories have been the basis for the development of a variety of analytical and computational models for a model-based characterization of freeze–thaw induced damage of cementitious materials. For further reading, Guo et al. [8] provides a detailed state-of-the art review on the damage mechanisms and modeling approaches. The most recent theory that explains the origins of the high pressures during freezing and thawing is the work of Zhao et al. [7]. This is a physics-based theory that explains freeze–thaw damage as a consequence of trapped ions. It must be noted that the pore-fluid is not pure water but contains dissolved ions due to the material composition and depending on the environment, such as concrete pavements saturated with deicing salts. According to Zhao et al., the large disjoining pressures generated by trapped ions cause material damage. This theory, based on electrokinetics, predicts pressures up to 30 MPa. Durability of a material is determined by the interplay of attack (due to external factors—in our case, temperature) and resistance (the material characteristics). While this electrokinetic theory focuses on the attack, an analysis of the resistive aspect of the material to freeze–thaw loads is required. In other words, what are the pressures required for damage of the cementitious material? To provide insight into this question, we use a micromechanical approach [9] to estimate the range of critical pressures required for damage of mortar specimens. The paper is structured as follows: First, we review the methodological basis of the model in Section 2. In Section 3, we develop the model, and in Section 4 and Section 5 we discuss the model predictions and implications of the study presented in this paper. Finally, we summarize the paper and provide conclusions in Section 6.

2. Fundamentals of Continuum Micromechanics

Cementitious building materials are heterogeneous across the scales. Concrete, the most common cementitious material, is made by mixing coarse aggregates (e.g., basalt, limestone) of size > 4 mm in a mortar matrix. The mortar also has a heterogeneous material structure consisting of fine aggregates (e.g., sand) with sizes in the range of 0.125 –4 mm that are embedded in a cement matrix. Cement paste is the binder material and is in itself also heterogeneous, containing partially saturated pores with sizes ranging from a few nanometers to millimeters in size. The behavior of a heterogeneous material such as concrete or mortar can be described using the concept of a representative elementary volume (REV). An REV describes a volume (length scale L) containing heterogeneities (length scale l). The size of the REV is chosen such that l < < L . As the name suggests, the REV represents the averaged behavior of the heterogeneous microstructure within the REV. Using the concept of an REV, the properties of heterogeneous materials such as concrete or mortar can be homogenized, i.e., if the microscale properties of the individual constituents in the REV are given, the corresponding macroscale property can be obtained. This allows for a homogenization of material properties across multiple scales using appropriate representative elementary volumes across the scales. The homogenized property is also often denoted as an effective property of the REV. In general, the stiffness (henceforth, the fourth order tensor of elasticity will be called the stiffness) of a material with n different components with n different stiffness properties can be estimated using the following expression [10,11]:
C e f f = i = 1 n ϕ i C i : A i
In the above expression, C e f f is the overall, homogenized and effective stiffness of the material; C i is the stiffness; and ϕ i the volume fraction of ith component. The tensor A i is the so-called localization tensor that specifies geometrical information corresponding to the ith material component. The localization tensor can be approximated by several methods [11,12]. Classical continuum micromechanics schemes can be broadly divided into methods that characterize materials either with or without a clear host-inclusion morphology. In case of a clear matrix inclusion morphology, the homogenized stiffness tensor can be written as follows:
C e f f = C h + i = 1 n i n c j = 1 n i , g e o C i C h ϕ j : A i , j : F
A i , j = I + P j : C i C h 1
P j = S j : C h 1
The subscript h denotes the host material. The subscript i denotes the inclusion type, i.e., the inclusion that has a unique property different to that of the host. Inclusions themselves, having a common stiffness, can have different geometries. This is denoted by the subscript j. Thus, n i n c is the total number of inclusions having a unique stiffness. n i , g e o is the number of different inclusion geometries that belong to the ith inclusion. P j is the polarization tensor and S j is the Eshelby tensor. The simplest approximation when computing the localization tensor ignores the interaction of the inclusions with each other. The tensor F characterizes the interaction. If there is no interaction (i.e., according to the Dilute-Scheme), then
F = I
One of the classical methods in which interactions between the inclusions can be approximately taken into account is the Mori–Tanaka scheme [13,14]. Here, the tensor F is defined as follows:
F = ϕ h I + i = 1 n i n c j = 1 n i , g e o ϕ j : A i , j 1
In case there is no clear host-inclusion morphology, the cascade micromechanics model [10], which replicates the self-consistent scheme asymptotically, can be applied. While the Mori–Tanaka scheme is explicit, the cascade micromechanics model has to be iteratively computed. At the asymptotic limit, the self-consistent scheme is recovered.
C e f f n + 1 = i = 1 n i n c j = 1 n i , g e o C i ϕ j : A i , j n : i = 1 n i n c j = 1 n i , g e o ϕ j A i , j n 1
A i , j n = I + P j : C i C e f f n 1
P j = S j : C e f f n 1

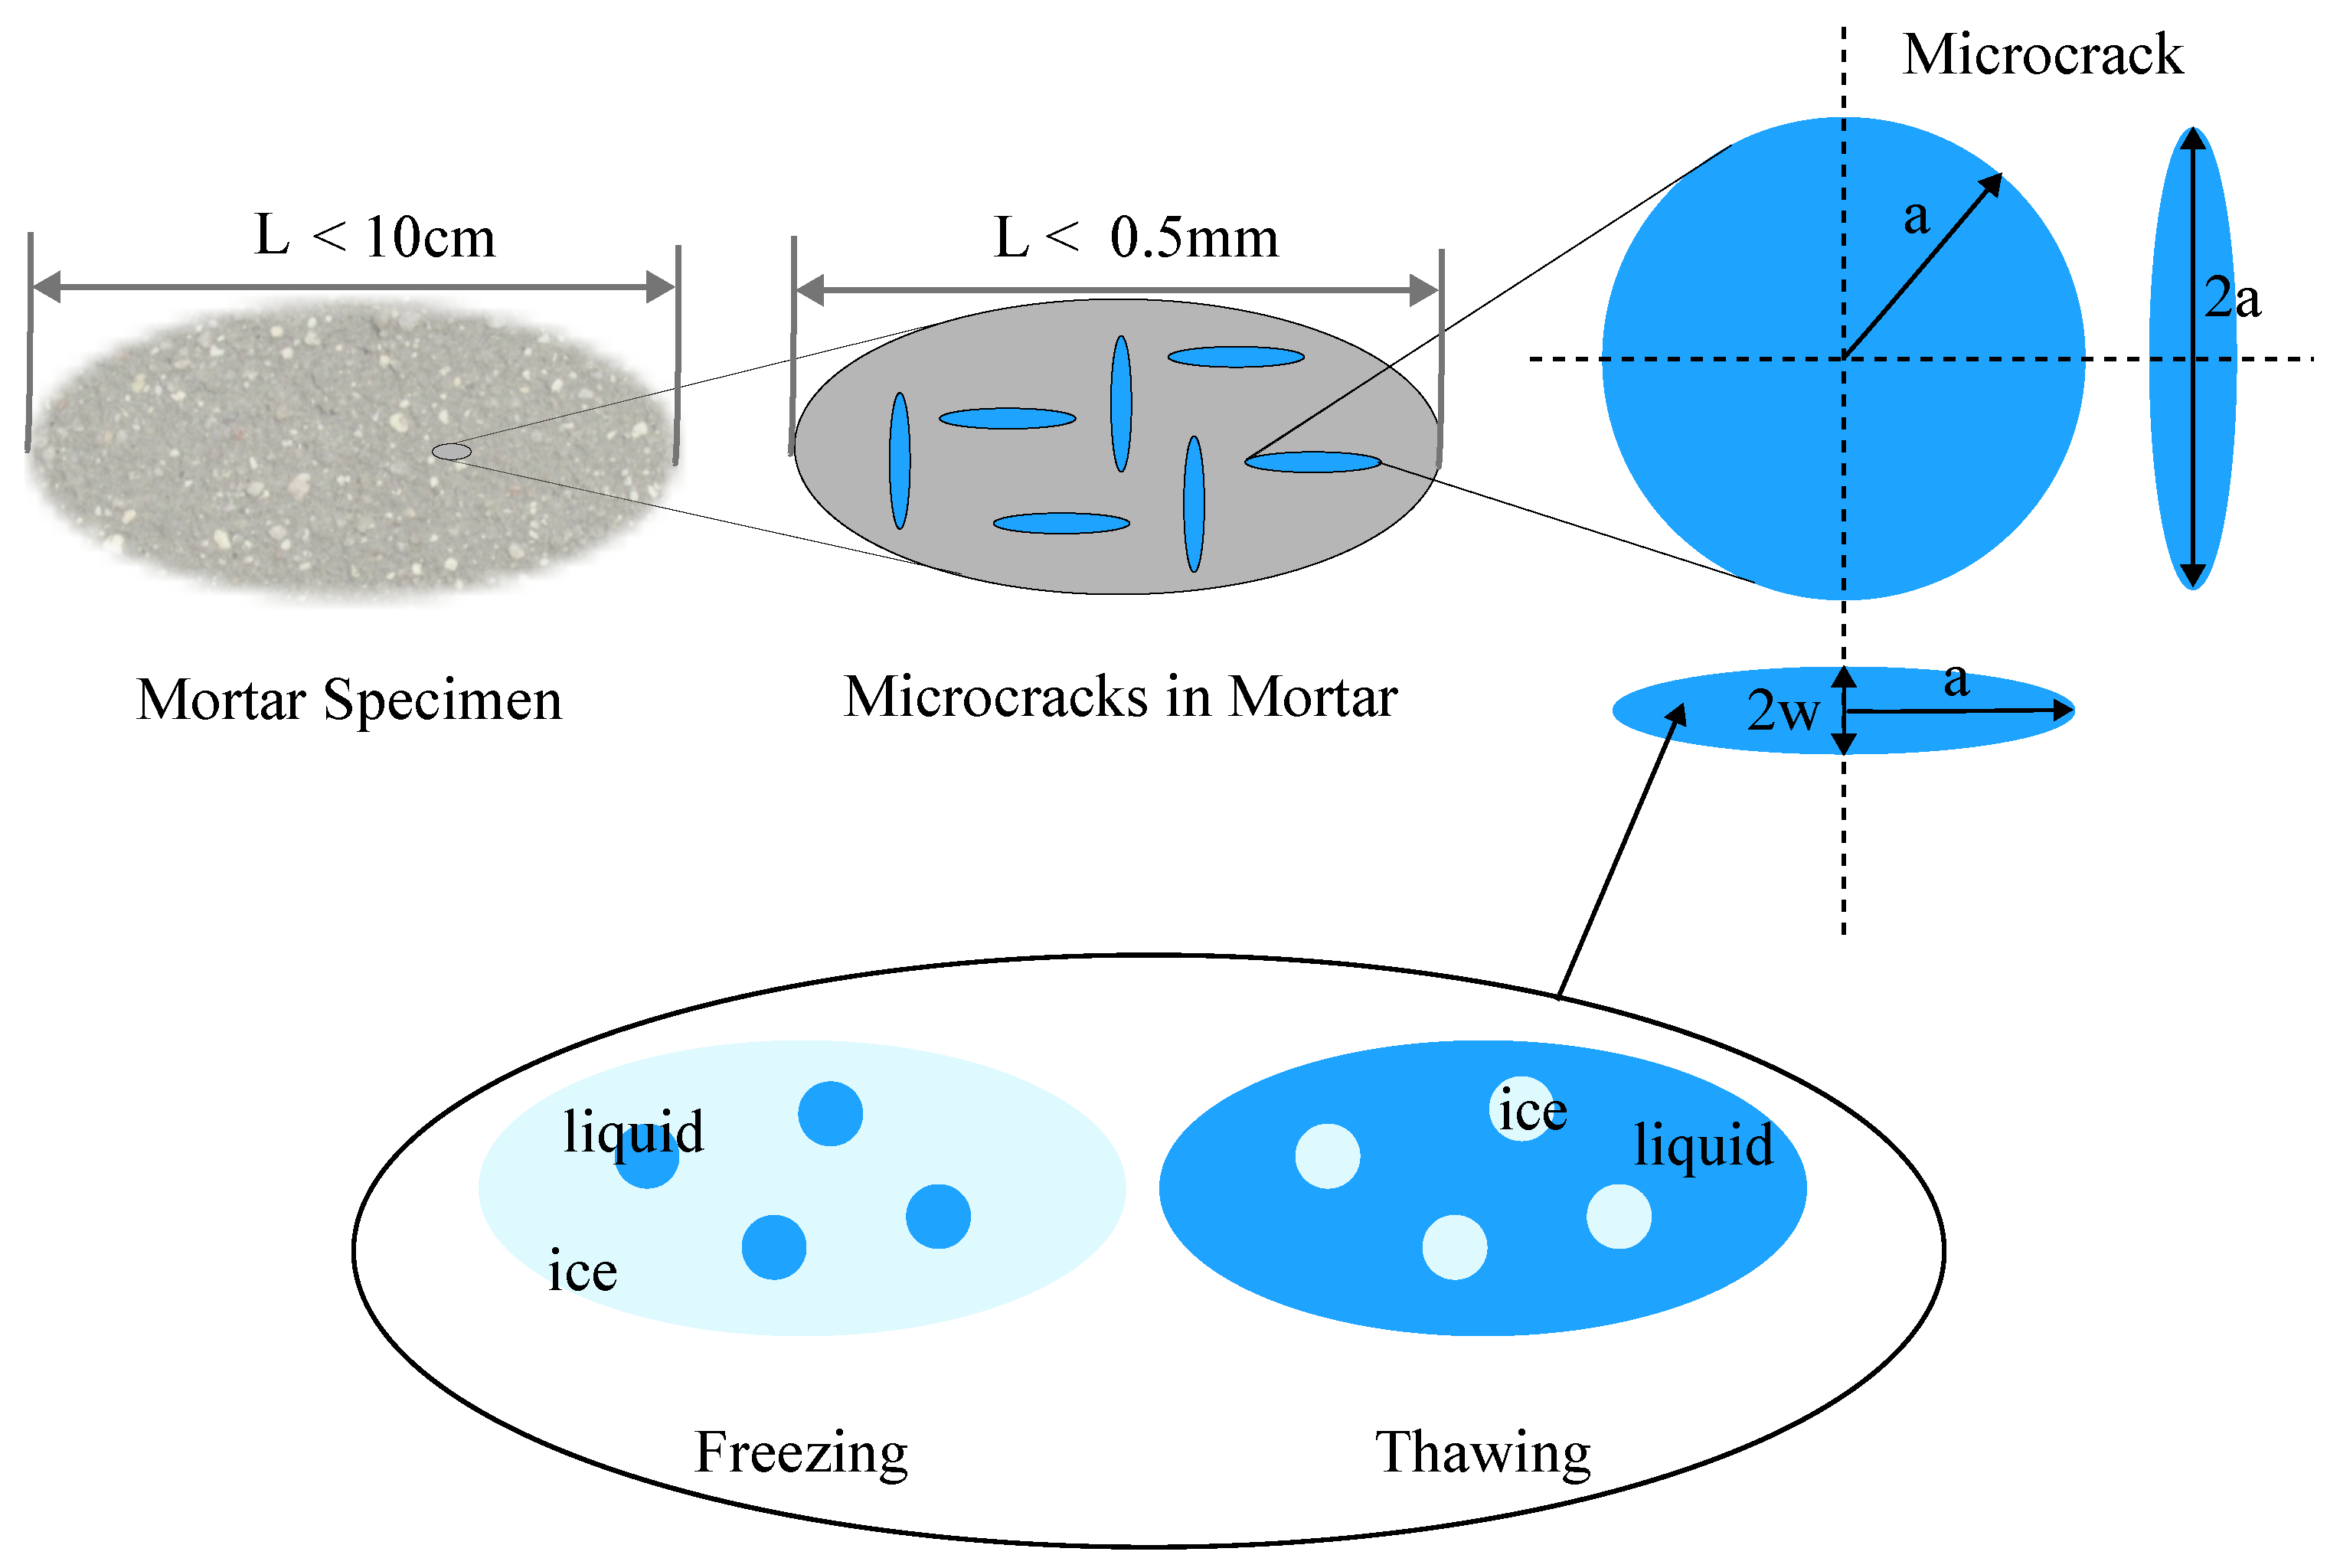
3. Multiscale Model for Freezing Mortar

Having briefly discussed the fundamentals of continuum micromechanics in the previous section, we apply the continuum micromechanics techniques for homogenization in conjunction with fracture mechanics to estimate the critical pressure that leads to microcrack initiation in saturated freezing mortar specimens. To this end, the following ingredients are required: (a) a model to simulate microcracking of mortar; (b) a model to describe the evolution of stiffness of mortar as a function of the ice saturation degree; (c) a poromechanics model of partially frozen mortar. Combining the aforementioned models, we obtain a model for microcracking of partially frozen mortar due to internal pressure in the microcracks. Figure 1 shows the multiscale approach used for modeling microcracking of freezing mortar. The specific details of the approach will be discussed in the following subsections.

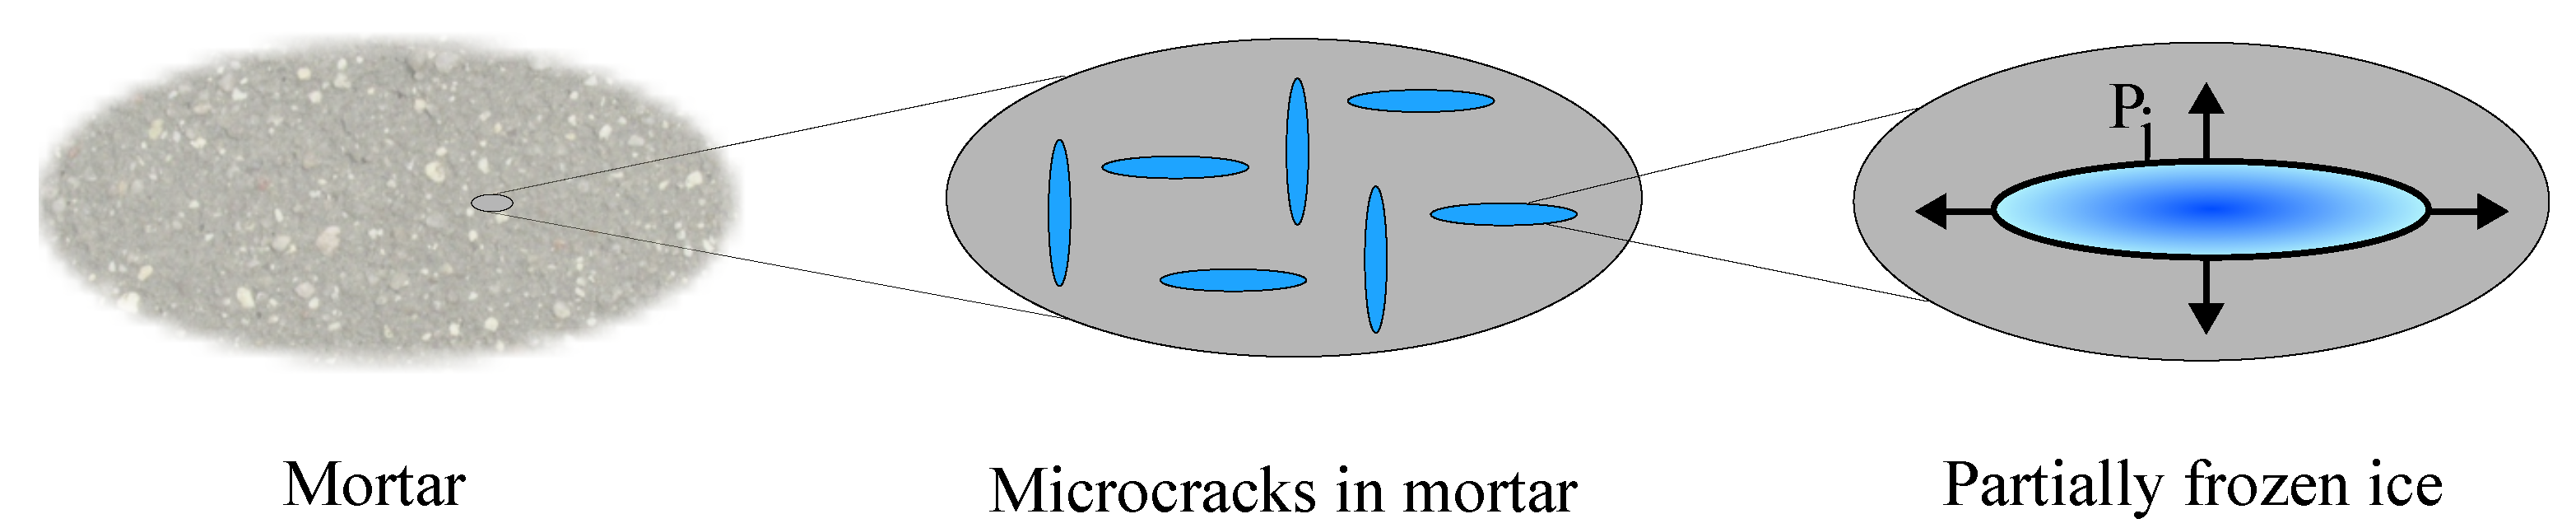
3.1. Microcracking of Mortar

The resistance to fracture of mortar is governed by the tensile strength and compressive strength of the material. Damage of mortar subjected to tensile or compressive loadings starts with microcrack propagation and, later, coalescence of these microcracks that lead to crack localization. Recently, a multiscale micromechanics model for fracture of concrete and mortar was proposed in [9]. According to this approach, tensile and compressive failure of the mortar and concrete specimens is modeled in terms of the microcrack initiation and growth that is governed by linear elastic fracture mechanics [15,16]. Assuming that there are three orthogonal families of microcracks [9], which are oblate spheroidal in shape (i.e., penny shaped), microcrack initiation and stable microcrack propagation of the jth microcrack family are given by
G j G c j 0
ϵ ˙ j 0
( G j G c j ) ϵ ˙ j = 0
Here, G j is the energy release rate associated with the propagation of the jth microcrack family. G c j is the critical fracture energy release rate and is a material property. ϵ j is the microcrack density parameter defined as ϵ i = N j a j 3 , where N j is the total number of microcracks of the family j per unit volume and a j is the microcrack size—which, assuming penny-shaped ellipsoidal microcracks, denotes the radius of the microcrack. The fracture energy release rate for the propagation of the jth microcrack family is given as
G j = Ψ ϵ j = 1 2 E : C ϵ j : E
Here, Ψ is the potential energy. The critical fracture energy release rate is given by [9,16]
G c j = 2 π 3 g f a j
where g f is the microscopic fracture energy release rate. According to Equation (13), given an applied strain E , microcrack growth can be simulated if we have a formula for C (which is the stiffness of the material) as a function of the crack-density parameter ϵ j . Using continuum micromechanics, we can approximate the stiffness of mortar with distributed microcracks as follows:
C = C i n t I j = 1 3 ϕ j : A j : F
F = ( 1 j = 1 3 ϕ j ) I + j = 1 3 ϕ j A j 1
A j = I + P j : C i n t 1
P j = S j : C i n t 1
In the above equations, ϕ j = N j 4 3 π a j 3 X denotes the total volume fraction of the microcrack family j. X is the aspect ratio and N j is the number of cracks per unit volume of the jth microcrack family. In terms of the crack density parameter, we can write this also as ϕ j = 4 π 3 ϵ j X . Let ϕ c r = j = 1 3 ϕ j be the total microcrack volume fraction in mortar. The initial microcrack volume fraction is ϕ c r 0 . The theoretical stiffness of the ‘intact’ mortar material ‘without microcracks’ is denoted as C i n t .
In order to simulate microcrack growth, an estimation of the initial microcrack parameters (geometry and volume fraction), the theoretical stiffness of mortar without microcracks C i n t and the microscopic fracture energy release rate g f is required. These parameters need to be either assumed (ad-hoc) or if possible calibrated using experimental data. In general, it is also preferable to calibrate the parameters at least partially using easily available experimental measurements. To this end, we use the measurements of Young’s modulus and the compressive strength of two different mortar mixes. The details of the mortar compositions are given in Table 1. Both compressive strength and Young’s Modulus were measured on cylindrical specimens with a diameter of 10 cm and a height of 20 cm. The compressive strength was determined according to DIN EN 12390-3:2009. The resulting values were then used as input values for determination of Young’s Modulus according to DIN EN 12390-13:2013, where one-third of the compressive strength is applied to the specimens over the course of three repeating loading cycles. The experimental data and the calibrated quantities are listed in Table 1.
In Table 1, the provided microcrack size and microcrack aspect ratio are obtained from thin-slice microscopy of concrete slices. These values should be interpreted in an averaged sense and are only representative of the microcrack state. The experimental details of the microcrack geometry characterization will be presented in a subsequent publication and are beyond the scope of this paper. Within the context of this paper, these values can be interpreted as model assumptions. Omitting these details will not in any way affect the main conclusions and the presented model methodology. Finally, C i n t is a theoretical value and is not easy to compute. This is also a quantity that cannot be experimentally measured. If an accurate value for ϕ c r 0 is available, C i n t can be computed. One option to compute C i n t is using multiscale homogenization [17]. Using multiscale homogenization, we obtain a Young’s Modulus of 35.1 GPa and 48.4 GPa for M-40 and M-55, respectively, at complete hydration. Please note that this is a theoretical estimate and further detailed analysis and research is required for an accurate characterization of this quantity. Now that we have a theoretical estimate, we can easily compute the necessary microcrack density that needs to be introduced into the mortar C i n t to obtain the experimentally measured Young’s Modulus. Having developed a model for the stiffness of mortar, subsequently, microfracture mechanics can be used to simulate damage. The macroscopic stress–strain behaviors of both mortar mixes are provided in Figure 2.

3.2. Stiffness of Partially Frozen Mortar

As mortar freezes, the stiffness of mortar also changes. In order to model the stiffness of mortar as a function of the ice saturation, we use the Mori–Tanaka method. During freezing of a liquid in a microcrack, the freezing front approaches the center from the surface to the interior. During thawing, the melting front starts from the exterior to the interior. To approximate this mechanism, we can model the stiffness evolution as a function of the ice saturation during freezing as follows:
C l s = C s + C l C s ϕ l : A l : F l s
F l s = ϕ s I + ϕ l : A l 1
where C l s denotes the stiffness of a freezing liquid, C l = 0 is the stiffness of the liquid and C s is the stiffness of the solid ice. ϕ s is the ice-saturation degree and ϕ l is the liquid-saturation degree. We assume fully saturated microcracks such that ϕ s + ϕ l = 1 . In case of partial saturation, this expression has to be modified to accommodate the unsaturated volume. During thawing, the host material is assumed to be the liquid phase and the inclusion the ice phase. In this case,
C l s = C l + C s C l ϕ s : A s : F l s
F l s = ϕ l I + ϕ s : A s 1
The solid ice is assumed to be isotropic with a Young’s modulus of 10 GPa and a Poisson ratio of 0.3. Having specified the evolution of the properties of the saturated liquid during freezing and thawing, we can now model the evolution of the mortar stiffness during freezing and thawing. We assume that during freezing and thawing the microcracks are saturated with liquid and, hence, can be interpreted as inclusions in a mortar matrix. Analogous to the expressions presented in Equation (15), we obtain
C = C i n t + j = 1 3 C l s C i n t ϕ j : A j : F
F = ( 1 j = 1 3 ϕ j ) I + j = 1 3 ϕ j A j 1
A j = I + P j : C l s C i n t 1
P j = S j : C i n t 1
Having modeled the stiffness of mortar with microcracks whose properties evolve during freezing and thawing, we can compute the internal critical pressure required for microcrack growth. To this end, a micro-poromechanical model of partially saturated mortar is required. This is the topic of discussion in the next subsection.

3.3. Pressure Required at Microcrack Initiation

According to micro-poromechanics [16,18], the fracture energy release rate of a fluid-saturated porous material with an internal pore pressure P j is given as
G j = Ψ ϵ j = 1 2 E : C ϵ j : E + P j 2 2 N 1 ϵ j + P j B ϵ j : E G c j
The quantities B and N are poroelastic constants [16]. The expressions N 1 ϵ j and B ϵ j can be written as follows:
N 1 ϵ j = 1 : D i n t : C ϵ j : D i n t : 1
B ϵ j = C ϵ j : D i n t : 1
In the above expressions, 1 is the second-order unit tensor. Simplifying the above equations, the expression for the pressure in the microcracks can be obtained at the state when the microcracks initiate, i.e., G j = G c j :
P j = 4 π g f 3 a j ( 1 : D : C ϵ j : D : 1 )
Figure 3 shows an illustration of the internal pressure acting on the mortar matrix. In Equation 30, P j is the pressure inside the jth microcrack family at microcrack growth initiation. It can be seen that this pressure depends on the microcrack size, the microscopic fracture energy g f , the compliance of partially frozen mortar D and the rate of change of the stiffness of partially frozen mortar as a function of the non-dimensional microcrack density parameter. It must be noted that the compliance in Equation (30) is the compliance of the partially frozen, microcracked mortar. This compliance is different to the compliance in Equations (29) and (28), which correspond to that of the theoretical intact material. During simplification, this term is eliminated. The aim of this contribution is to estimate the pressure required for microcrack initiation. Using Equation (30), these critical values can be estimated. This pressure we denote as the freeze–thaw resistance and can also be interpreted as the freeze–thaw ’strength’ of the material.

3.4. Air-Pores Reduce the Internal Pressure
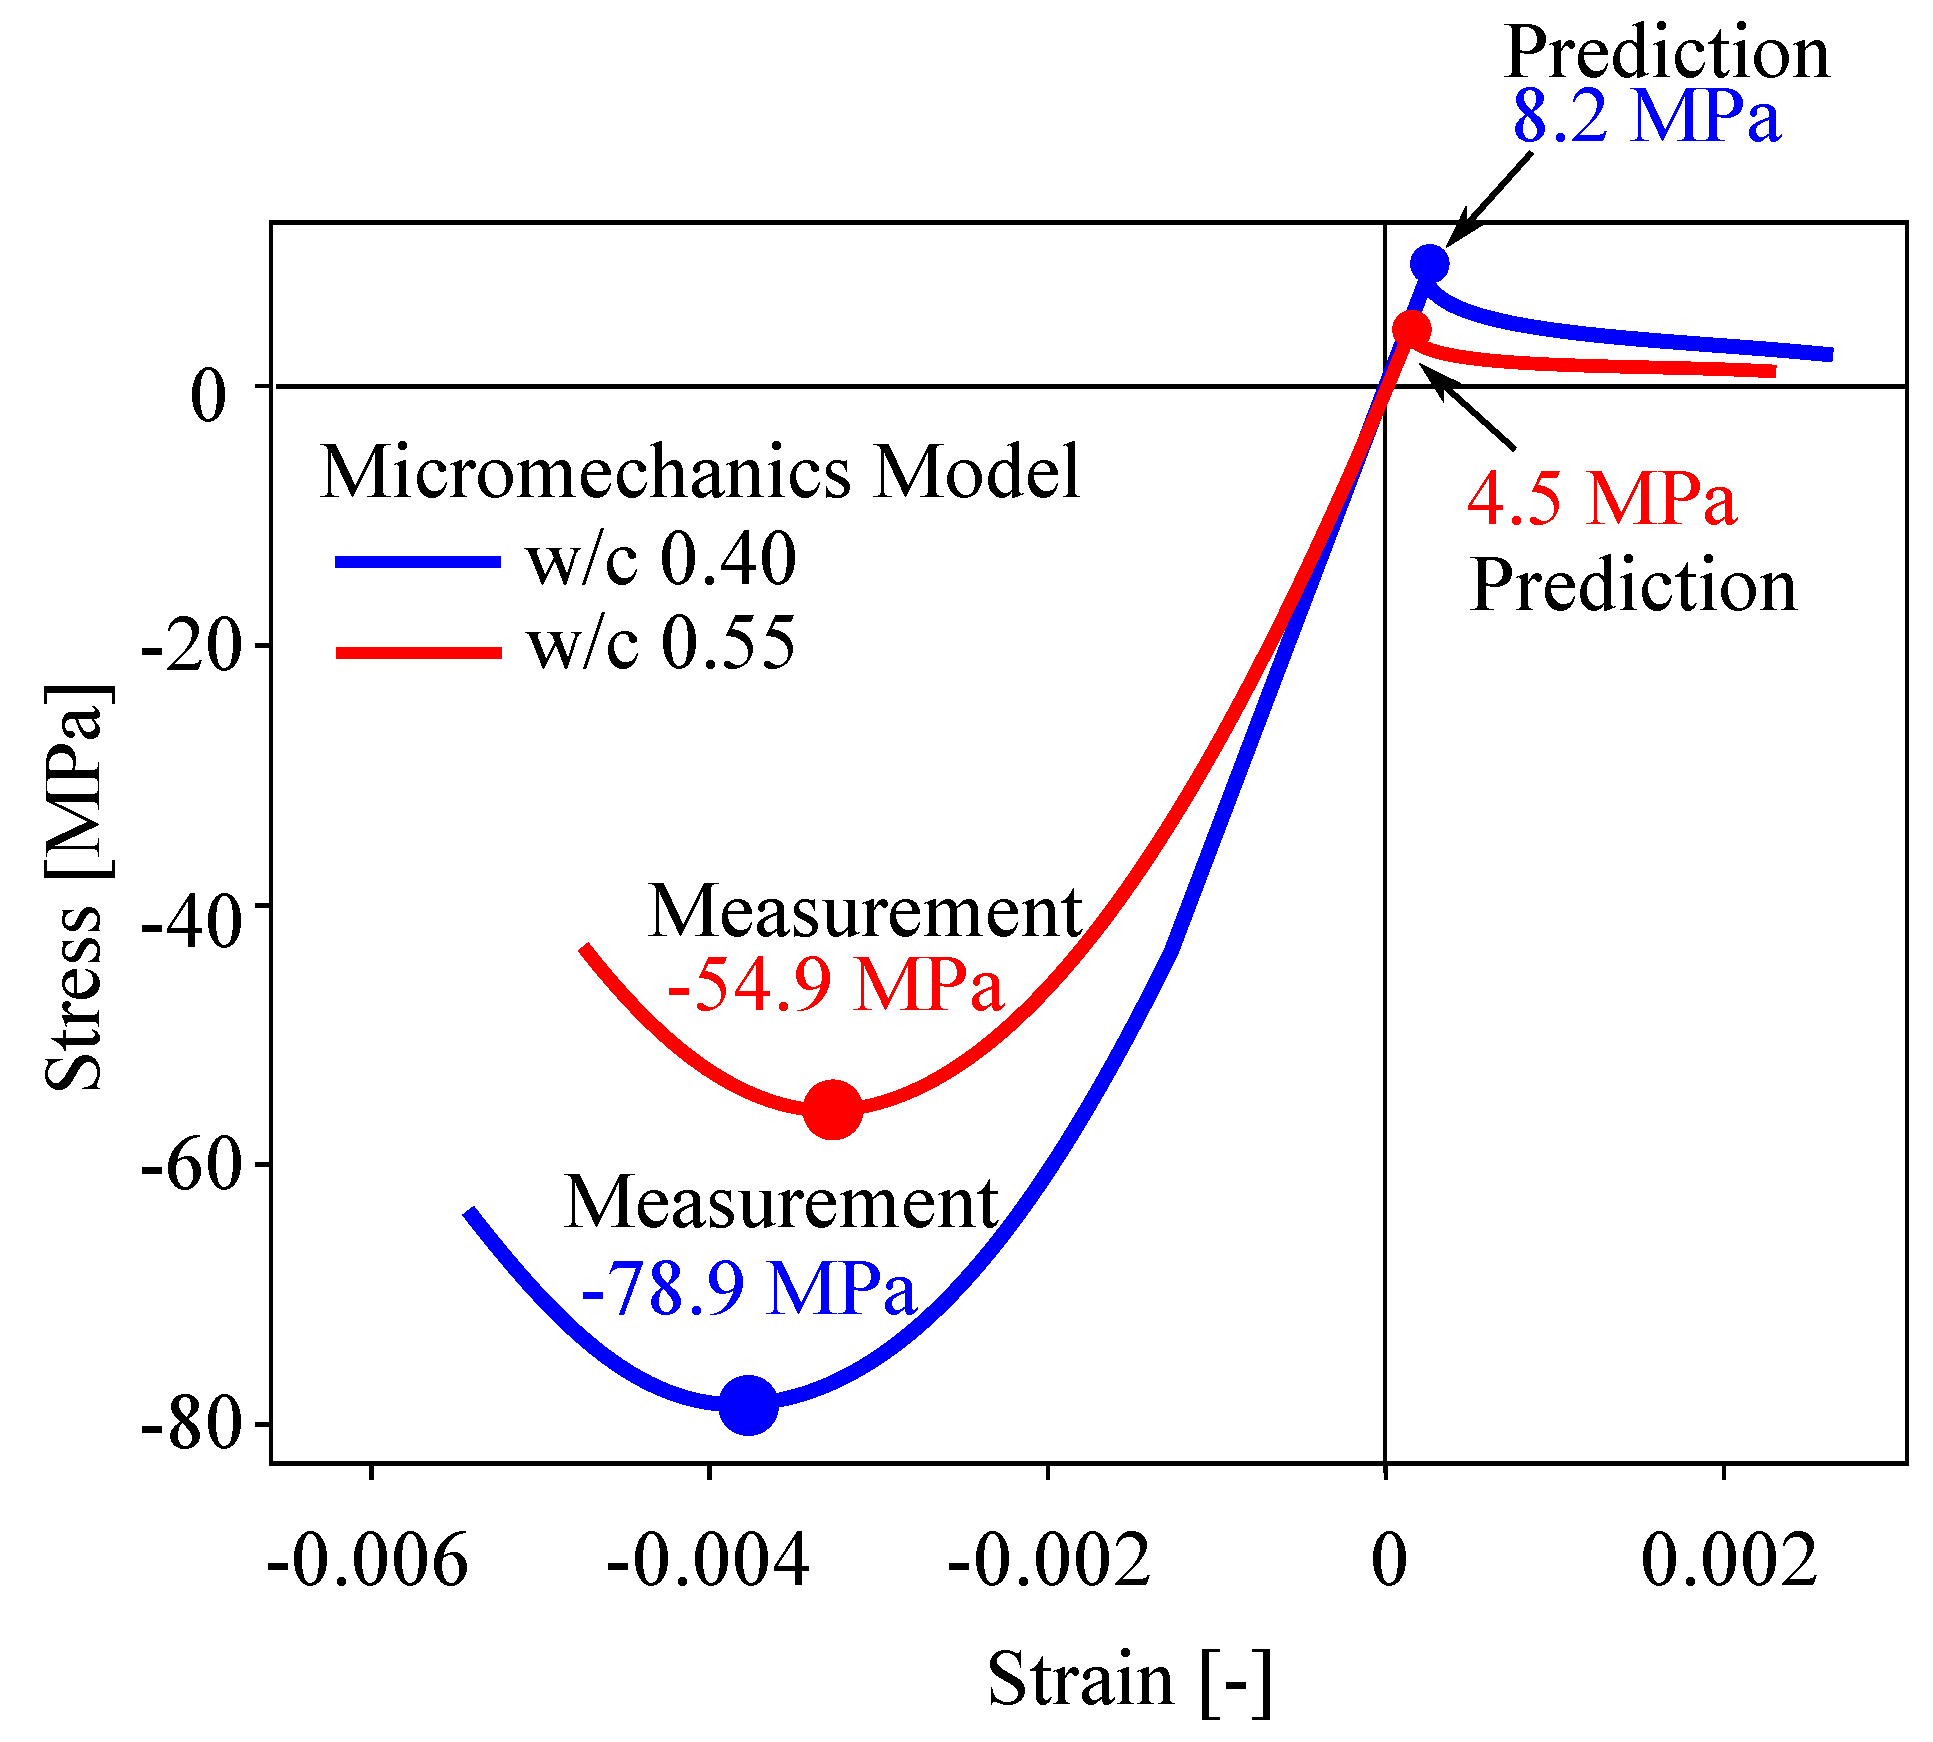
If we require the pressure in the pores, we can simplify the Equation (30) assuming just one family of inclusions with a spherical shape. Moreover, the derivative of the elasticity tensor with respect to ϵ can be transformed to the derivative with respect to the pore-size a. After introducing the simplification, we obtain the following expression:
P = 4 π g f N a 1 : D : C a : D : 1
This equation can explain, using a purely micromechanical approach, that if the size of the pores increase or if the density of the pores increase, the resistance also increases irrespective of the ice-saturation content. It must be noted that g f here refers to the fracture energy release rate associated with the increase in pore-size due to cracking around the pore.

4. Results

The predictions of the multiscale micromechanics model for the in situ critical pressure required for microcrack growth is shown in Figure 4. The critical pressure is the same in all three microcrack families; hence, no differentiation is made with regards to the microcrack orientation. The microcrack orientation will be relevant in case additional mechanical loadings or constraints are applied. In this particular case, we assume free expansion of a mortar REV without any constraints.
At zero ice saturation, i.e., when the microcracks are fully saturated with pure liquid, the pressure required for microcrack initiation is slightly larger than the tensile strength of the unsaturated (i.e., empty microcracks) material, depending on the material composition (w/c = 0.4 or w/c = 0.55). The mortar with w/c = 0.55 requires a lower critical pressure build-up in the microcracks to initiate microcrack growth when compared to the mortar with w/c = 0.4. During freezing, as the ice saturation increases, the critical pressure required to initiate microcracking also increases in a non-linear fashion, reaching a maximum of approximately 17 MPa and 24 MPa for w/c = 0.55 and w/c = 0.4, respectively. This is a consequence of the increasing overall stiffness of the freezing mortar due to ice formation. During thawing, as soon as the ice saturation reduces infinitesimally, there is a drastic drop in the critical pressure required for microcracking. This drop in the critical pressure is also a consequence of the drop in the overall stiffness of freezing mortar due to the ice melting within the microcracks. As soon as the ice starts melting within the microcracks, the melting front proceeds from the microcrack surface inward. As the liquid phase that forms an interface between the partially frozen ice and mortar does not posses stiffness, the overall stiffness drops drastically. During thawing, until full recovery of the liquid phase in the microcrack, the critical pressure remains constant. Shown in a shaded green background is the predictions of the electrokinetic theory [7] where the pressure generated is attributed to nanofluidic salt trapping.

5. Discussion

The following discussion mainly pertains to the theoretical estimate of the critical pressure shown in Figure 4. The predictions of the model are within the range of pressures predicted by the electrokinetic theory [7]. It can be seen that the material becomes ‘stronger’ when frozen, i.e., the critical pressure required for microcracking when the microcracks are completely frozen is approximately three times the value when the microcracks are in a thawed state. Furthermore, the critical pressure is path-dependent. During freezing, higher critical pressures are required. It can be concluded that the material is more susceptible to damage during thawing rather than during freezing. This could also potentially explain why the hydraulic pressure theory that attributes damage as a consequence of expansion of water during freezing has been discarded. Evidently, when frozen, the material has a higher resistance to damage as a result of the increased stiffness from ice. Finally, the critical pressure required for microcrack initiation at zero ice saturation is slightly higher than the theoretical tensile strength of the material (when the microcracks are not saturated). This is similar for both mortar types. Based on this observation, increasing the tensile strength should increase the freeze–thaw durability of the material. A holistic simulation of damage due to freeze–thaw, taking into account also the influence of temperature and ion composition, requires coupling the electrokinetic model with the micromechanical model presented in this paper. A hysteretic critical pressure curve will be obtained as the number of freeze–thaw cycles increase if the microcrack sizes are updated.
Before we conclude, we would like to briefly discuss the major simplifying assumptions considered in the model. For the sake of keeping the model simple, the microcrack network in the mortar material is assumed to be represented by three orthogonal families of ellipsoidal geometries. Ellipsoidal geometries have been assumed so that the analytical expressions [19] for the Eshelby tensors can be used for the homogenization procedure. As the stiffness is available analytically, computation of the derivative of the fourth-order tensor with respect to the microcrack density becomes easier. In this paper, the complex-step derivative is used to compute the derivatives. Secondly, the theoretical estimate of the stiffness of mortar without microcracks is assumed to be obtained from a multiscale model. The accuracy of this estimate can be improved by using data from hydration modeling. In addition to the aforementioned major assumptions, minor model assumptions such as the Mori–Tanaka model for the stiffness of ice-saturated liquid–solid phase can be replaced by a more accurate model. Moreover, the geometry of the microcracks can be considered as a distribution instead of averaged values. Finally, as we use the concept of the REV for the analysis, the spatial homogeneity requires that the model be implemented at the Gauss-Point level of a finite element code for taking into account gradients. Such a multiscale analysis can provide quantitative predictions of the critical pressure required for microcracking depending on the temperature profile. The accuracy of the model can further be improved by considering partially saturated conditions for the liquid phase. A holistic analysis of the influence of temperature and ion composition in the pore-fluid on damage is possible by coupling a kinetics model with the presented multiscale model.

6. Conclusions

The theoretical critical pressure required for freeze–thaw induced damage in mortar has been analyzed with a multiscale micromechanics model using the framework of continuum micromechanics, microfracture mechanics and micro-poromechanics. The main conclusions of the analysis are listed below:
  • Multiscale modeling using a combination of micromechanics, fracture mechanics and poromechanics provides a deeper insight into the mechanism of damage and failure of cementitious materials such as concrete and mortar during freezing and thawing.
  • All parameters in the model are physical and can be measured experimentally.
  • Microcrack initiation occurs when the internal pressure is above the unsaturated tensile strength of the material.
  • The critical pressure for microcrack initiation depends on path history, i.e., for the same state of ice saturation, higher pressures are required for microcrack growth during freezing than during thawing.

Author Contributions

Conceptualization, J.J.T.; methodology, J.J.T.; software, J.J.T.; validation, J.J.T.; formal analysis, J.J.T.; investigation, J.J.T.; resources, J.J.T. and C.G.; data curation, J.JT. and A.H.; writing—original draft preparation, J.J.T.; writing—review and editing, J.J.T., A.H., T.K. and C.G.; visualization, J.J.T.; supervision, J.J.T.; project administration, J.J.T., A.H. and T.K.; funding acquisition, C.G. All authors have read and agreed to the published version of the manuscript.

Funding

This work is supported by the German Research Foundation (DFG), project number 428338963. This support is gratefully acknowledged.

Institutional Review Board Statement

Not applicable.

Informed Consent Statement

Not applicable.

Data Availability Statement

Data are available from the authors on request.

Acknowledgments

We would like to thank Maik Hobusch for assisting with the experimental measurements.

Conflicts of Interest

The funders had no role in the design of the study; in the collection, analyses, or interpretation of data; in the writing of the manuscript; or in the decision to publish the results.

Abbreviations

The following abbreviations are used in this manuscript:
REVRepresentative Elementary Volume
w/cWater-to-cement ratio

References

  1. UN. World Urbanization Prospects: The 2018 Revision; Technical Report; UN Department of Economic and Social Affairs Population Division: New York, NY, USA, 2018. [Google Scholar]
  2. Powers, T.C.; Helmuth, R. Theory of volume changes in hardened portland-cement paste during freezing. In Proceedings of the Highway Research Board, Washington, DC, USA, 13–16 January 1953; Volume 32. [Google Scholar]
  3. Scherer, G.W.; Valenza, J. Mechanisms of frost damage. Mater. Sci. Concr. 2005, 7, 209–246. [Google Scholar]
  4. Scherer, G.W. Freezing gels. J. Non-Cryst. Solids 1993, 155, 1–25. [Google Scholar] [CrossRef]
  5. Coussy, O.; Monteiro, P.J. Poroelastic model for concrete exposed to freezing temperatures. Cem. Concr. Res. 2008, 38, 40–48. [Google Scholar] [CrossRef]
  6. Setzer, M.J. Micro-ice-lens formation in porous solid. J. Colloid Interface Sci. 2001, 243, 193–201. [Google Scholar] [CrossRef]
  7. Zhou, T.; Mirzadeh, M.; Pellenq, R.J.M.; Bazant, M.Z. Freezing point depression and freeze-thaw damage by nanofluidic salt trapping. Phys. Rev. Fluids 2020, 5, 124201. [Google Scholar] [CrossRef]
  8. Guo, J.; Sun, W.; Xu, Y.; Lin, W.; Jing, W. Damage Mechanism and Modeling of Concrete in Freeze–Thaw Cycles: A Review. Buildings 2022, 12, 1317. [Google Scholar] [CrossRef]
  9. Vu, G.; Diewald, F.; Timothy, J.J.; Gehlen, C.; Meschke, G. Reduced order multiscale simulation of diffuse damage in concrete. Materials 2021, 14, 3830. [Google Scholar] [CrossRef] [PubMed]
  10. Timothy, J.J.; Meschke, G. A cascade continuum micromechanics model for the effective elastic properties of porous materials. Int. J. Solids Struct. 2016, 83, 1–12. [Google Scholar] [CrossRef]
  11. Li, S.; Wang, G. Introduction to Micromechanics and Nanomechanics; World Scientific Publishing Company: Hackensack, NJ, USA, 2008. [Google Scholar]
  12. Qu, J.; Cherkaoui, M. Fundamentals of Micromechanics of Solids; Wiley Online Library: Hoboken, NJ, USA, 2006; Volume 735. [Google Scholar]
  13. Benveniste, Y. A new approach to the application of Mori-Tanaka’s theory in composite materials. Mech. Mater. 1987, 6, 147–157. [Google Scholar] [CrossRef]
  14. Mori, T.; Tanaka, K. Average stress in matrix and average elastic energy of materials with misfitting inclusions. Acta Metall. 1973, 21, 571–574. [Google Scholar] [CrossRef]
  15. Pichler, B.; Hellmich, C.; A. Mang, H. A combined fracture-micromechanics model for tensile strain-softening in brittle materials, based on propagation of interacting microcracks. Int. J. Numer. Anal. Methods Geomech. 2007, 31, 111–132. [Google Scholar] [CrossRef]
  16. Dormieux, L.; Kondo, D.; Ulm, F.J. Microporomechanics; John Wiley & Sons: Hoboken, NJ, USA, 2006. [Google Scholar]
  17. Pichler, B.; Hellmich, C. Upscaling quasi-brittle strength of cement paste and mortar: A multi-scale engineering mechanics model. Cem. Concr. Res. 2011, 41, 467–476. [Google Scholar] [CrossRef]
  18. Iskhakov, T.; Giebson, C.; Timothy, J.J.; Ludwig, H.M.; Meschke, G. Deterioration of concrete due to ASR: Experiments and multiscale modeling. Cem. Concr. Res. 2021, 149, 106575. [Google Scholar] [CrossRef]
  19. Mura, T. Micromechanics of Defects in Solids; Springer Science & Business Media: Berlin/Heidelberg, Germany, 2013. [Google Scholar]
Figure 1. Schematic of the multiscale approach for modeling freezing mortar showing the choice of the representative elementary volumes. Also shown is the ellipsoidal microcrack that is filled with partially saturated liquid-ice mixture (light blue color denotes ice and dark blue color denotes the liquid phase), and the representative elementary volume of partially saturated liquid-ice mixture during freezing and thawing.
Applmech 03 00074 g001
Figure 2. Micromechanics model calibration using data from compressive strength measurements for two different concrete compositions: w/c = 0.40 and w/c = 0.55. Also shown is the predicted tensile strength.
Applmech 03 00074 g002
Figure 3. Illustration depicting partially frozen ice generating an internal pressure P j , which leads to microcrack growth. The blue colored inclusions correspond to microcracks that are filled with partially saturated ice and the grey color corresponds to the mortar matrix material. The arrows illustrate the expansive pressure acting on the mortar matrix.
Applmech 03 00074 g003
Figure 4. Pressure in the microcracks required for initiation of microcrack growth (damage) according to the theoretical predictions of the micromechanics model for two different mortar compositions. The dotted horizontal lines denote the tensile strength of the unsaturated (i.e., empty microcracks) mortar specimens. The green region shows the range of pressures predicted by the multiscale electrokinetic theory [7].
Applmech 03 00074 g004
Table 1. Experimental data for model calibration.
PropertyM-40M-55
Cement typeCEM I
Water-to-Cement ratio (w/c)0.40.55
Cement content680 kg/m 3 560 kg/m 3
Water content272 kg/m 3 308 kg/m 3
Fine aggregate content1360 kg/m 3 1312 kg/m 3
Young’s Modulus34.5 GPa30.15 GPa
Compressive strength78.90 MPa54.9 MPa
Microcrack size100 μm
Microcrack aspect ratio (w/a)0.1
Calibrated Model Parameters
ϕ c r 0 0.073 [-]0.025 [-]
g f 0.22 N/m0.09 N/m
Publisher’s Note: MDPI stays neutral with regard to jurisdictional claims in published maps and institutional affiliations.

