Abstract
The study of opinion formation and dynamics is one of the core topics in sociophysics. In this paper, the results of computer simulation of opinion dynamics based on social impact theory are presented. The simulations are based on Latané theory in its computerised version proposed by Nowak, Szamrej and Latané. The active parameters of the model describe the volatility of the actors (social temperature T) and the effective range of interaction (governed by an exponent in a scaling function of distance between actors). Initially, every actor i has his/her own opinion. Our results indicate that ultimately at least 90% of the initial opinions available are removed from the society. For a low social temperature and a long range of interaction, only one opinion survives. Also, a rough sketch of the system phase diagram is presented. It indicates a set of () leading either to (1) the dominance of the unanimity of the opinions or (2) mixtures of unanimity and polarisation, or (3) taking random opinions by actors, or (4) a mixture of the final fates of the systems. The drastic reduction of finally observed opinions vs. their initial variety may be generic for many sociophysical models of opinions formation but masked by assuming an initially small pool of available opinions (in the worst case, in models with only binary opinions).
1. Introduction
The studies of opinion formation and dynamics are one of the core topics in sociophysics [1,2,3,4,5,6]. For example, Galam models of opinion dynamics [7,8,9,10,11,12,13,14,15,16,17,18,19,20] are based on the reaction–diffusion model: the dynamics operates via local update rules and reshuffling. In these models, three kinds of actors correspond to floaters, contrarians, and inflexibles. The models assume two or three opinions available in the society [21]. Among other discrete models of opinion formation, one should mention the majority rule [8,10,22,23], voter [24,25,26,27], and Sznajd [28,29,30,31,32] models. In these models, usually only binary opinions are considered, which naturally causes society polarisation. However, modifications that allow for multiple opinions were also studied [33,34,35,36,37,38,39,40,41,42,43,44,45].
The Nowak–Szamrej–Latané model [46] is based on the Latané social impact theory [47,48,49]. Latané himself defined his theory as a “bulb theory” of social impact. According to this physical analogy, every actor plays simultaneously the role of an isotropic single wavelength light emitter and a multi-wavelength light detector. We assume that every actor can emit and detect easily distinguished K various light colours. Every discrete time step t actor i switches the emitted wave length (colour) to that perceptible illuminance is detected in his/her position as the strongest. The decision of which colour will be emitted by actor i depends on (i) the number of each colour sources, (ii) the distance from this point to every other source of light, (iii) and intensities (illuminance flux, “bulb” power) of each light source.
The earlier attempts to employ this model for sociophysical studies included: observing the influence of the strong leader on opinion formation [50]; studying the noise-induced order/disorder phase transition [35,51]; searching for self-organised criticality in opinion systems [36]; observing the disappearance of some opinions [37] (see Ref. [52] for review).
In this paper, with a computer simulation based on the Nowak–Szamrej–Latané model [46], we check how the initial diversity of opinions influences the possibility of reaching a unanimity of opinions. Namely, we build a phase diagram in the social temperature and the effective range of the interaction space based on the number of surviving opinions; numbers of clusters of opinions; and the probability distribution of the size of the largest cluster. Unlike previous works—where the number of available opinions was usually small (two [50,51], up to three [36], or up to five [35,37])—we proposed as a starting point a situation in which each actor has their own opinion.
2. Model Formalisation
Every actor i at time t has an opinion . The social impact exerted in time t on an actor i by all actors who share opinions is calculated as
or
where is j-th actor supportiveness, is j-th actor persuasiveness, stands for Euclidean distance between actors i and j, is an arbitrary distance scaling function, and Kronecker delta when and when . The sum in Equations (1) and (2) reflects the increase in impact by increasing the number of “bulbs” (point (i) of the model description in Section 1), the decrease in impact with the distance between “bulbs” (fraction denominator, point (ii) of the model description in Section 1), and the fraction nominator corresponds to the intensities of “bulbs” (point (iii) of the model description in Section 1). The terms with Kronecker’s delta are equal to either zero or to one:
The parameters supportiveness and persuasiveness describe i-th actor intensity of interaction with actors sharing their opinions or with believers in opposite opinions, respectively. We decided to use (as in Ref. [35]) because whether it is easier to stick to our opinion or change it depends on numerous factors, such as the social context, emotions, beliefs, authorities, and persuasion strategies. People’s decisions on this matter can vary widely and depend on individual circumstances and preferences. On the one hand, there are theories that explain the tendency to change opinions, such as: social influence theory and conformity [53]; motivation and belief theory [54]; authority influence theory [55] or persuasion theory [56]. On the other hand, there are theories that point to an advantage in trying to keep our opinions, such as cognitive consistency theory [57] or cognitive dissonance theory [58]. Furthermore, keeping the supportiveness and persuasiveness equal for each actor makes the initial variety of opinions (next to social temperature and range of interactions) the dominant factor in the results of our studies. With such assumption, the social impact (1) and (2) may be reduced to
To ensure a lower impact on the opinions of actors from a more distant neighbour, the distance scaling function must be an increasing function of its argument. Here, we assume that
where the exponent is a model control parameter while the first addition component ensures finite self-supportiveness . The parameter qualitatively describes the effective range of interaction between the actors. Its quantitative meaning was delivered recently in Ref. [37] where it was shown that for , about 25% of the impact comes from only nine nearest neighbours. This ratio increases to approximately 59%, 80% and 96% for , 4 and 6, respectively. Calculating the relative impact exerted by 25 nearest neighbours gives about 39%, 76%, 92%, and 99% of the total social impact for , 3, 4, and 6, respectively (see Ref. [37], Figure 2, Table 1). In Ref. [37], it is concluded that “the parameter says how influential the nearest neighbours are with respect to the entire population: the larger , the more influential the nearest neighbours are”.
The example of calculating the social impact of nine actors and three colours is available as supporting information in Ref. [36].
In the deterministic version of the algorithm [37], the actor’s opinion , when has the maximum value among all impacts for (3). Following our previous studies [35,36,37], we employ the actors with “free will” by allowing them to avoid taking the opinions that believers exert the greatest impact on them. This scenario is realised in a probabilistic way by introducing a parameter T often termed “information noise” or “social temperature”. Quoting Ref. [59]: “Using the statistical mechanical foundation, [⋯] the most probable collective behaviour depends on a group’s social temperature, a measure of the group’s decision-making volatility. The extreme of zero temperature leads to stable, unchanging collective behaviour with pockets of minority and majority opinions. As group temperatures increase, the model’s collective behaviour tends toward a uniform decision without clustering of minority opinions. When the social temperature exceeds a certain limit, the group will have a well defined average opinion, but individuals are no longer stable and vacillate in a nearly random manner between different possible opinions”. Quoting Ref. [60] by the same authors: “Individuals are influenced by the group’s temperature. When a group’s social temperature is high, very little provocation is necessary to induce an individual to change opinion. At low group temperatures, individuals appear more phlegmatic or stubborn, and much greater provocation is required to induce a change in opinion. High social temperatures amplify the slightest excuse for change, whereas low temperatures diminish the arguments for change. Note that each individual’s opinion strength is unaltered, but as the group’s temperature changes, so does an individual’s decision making abilities.”
In our recent studies [36,37], we observed the exact same effects on the system evolution as described above, when social temperature T is introduced as a parameter in probabilities in time t of taking in the next time step opinion by actor i based on Boltzmann-like factors,
which yet requires proper normalisation,
In contrast to our earlier attempt, due to a huge number of available opinions in the system, we reset to zero probability when the impact from opinion holders is zero, i.e., when believers of this opinion vanished.
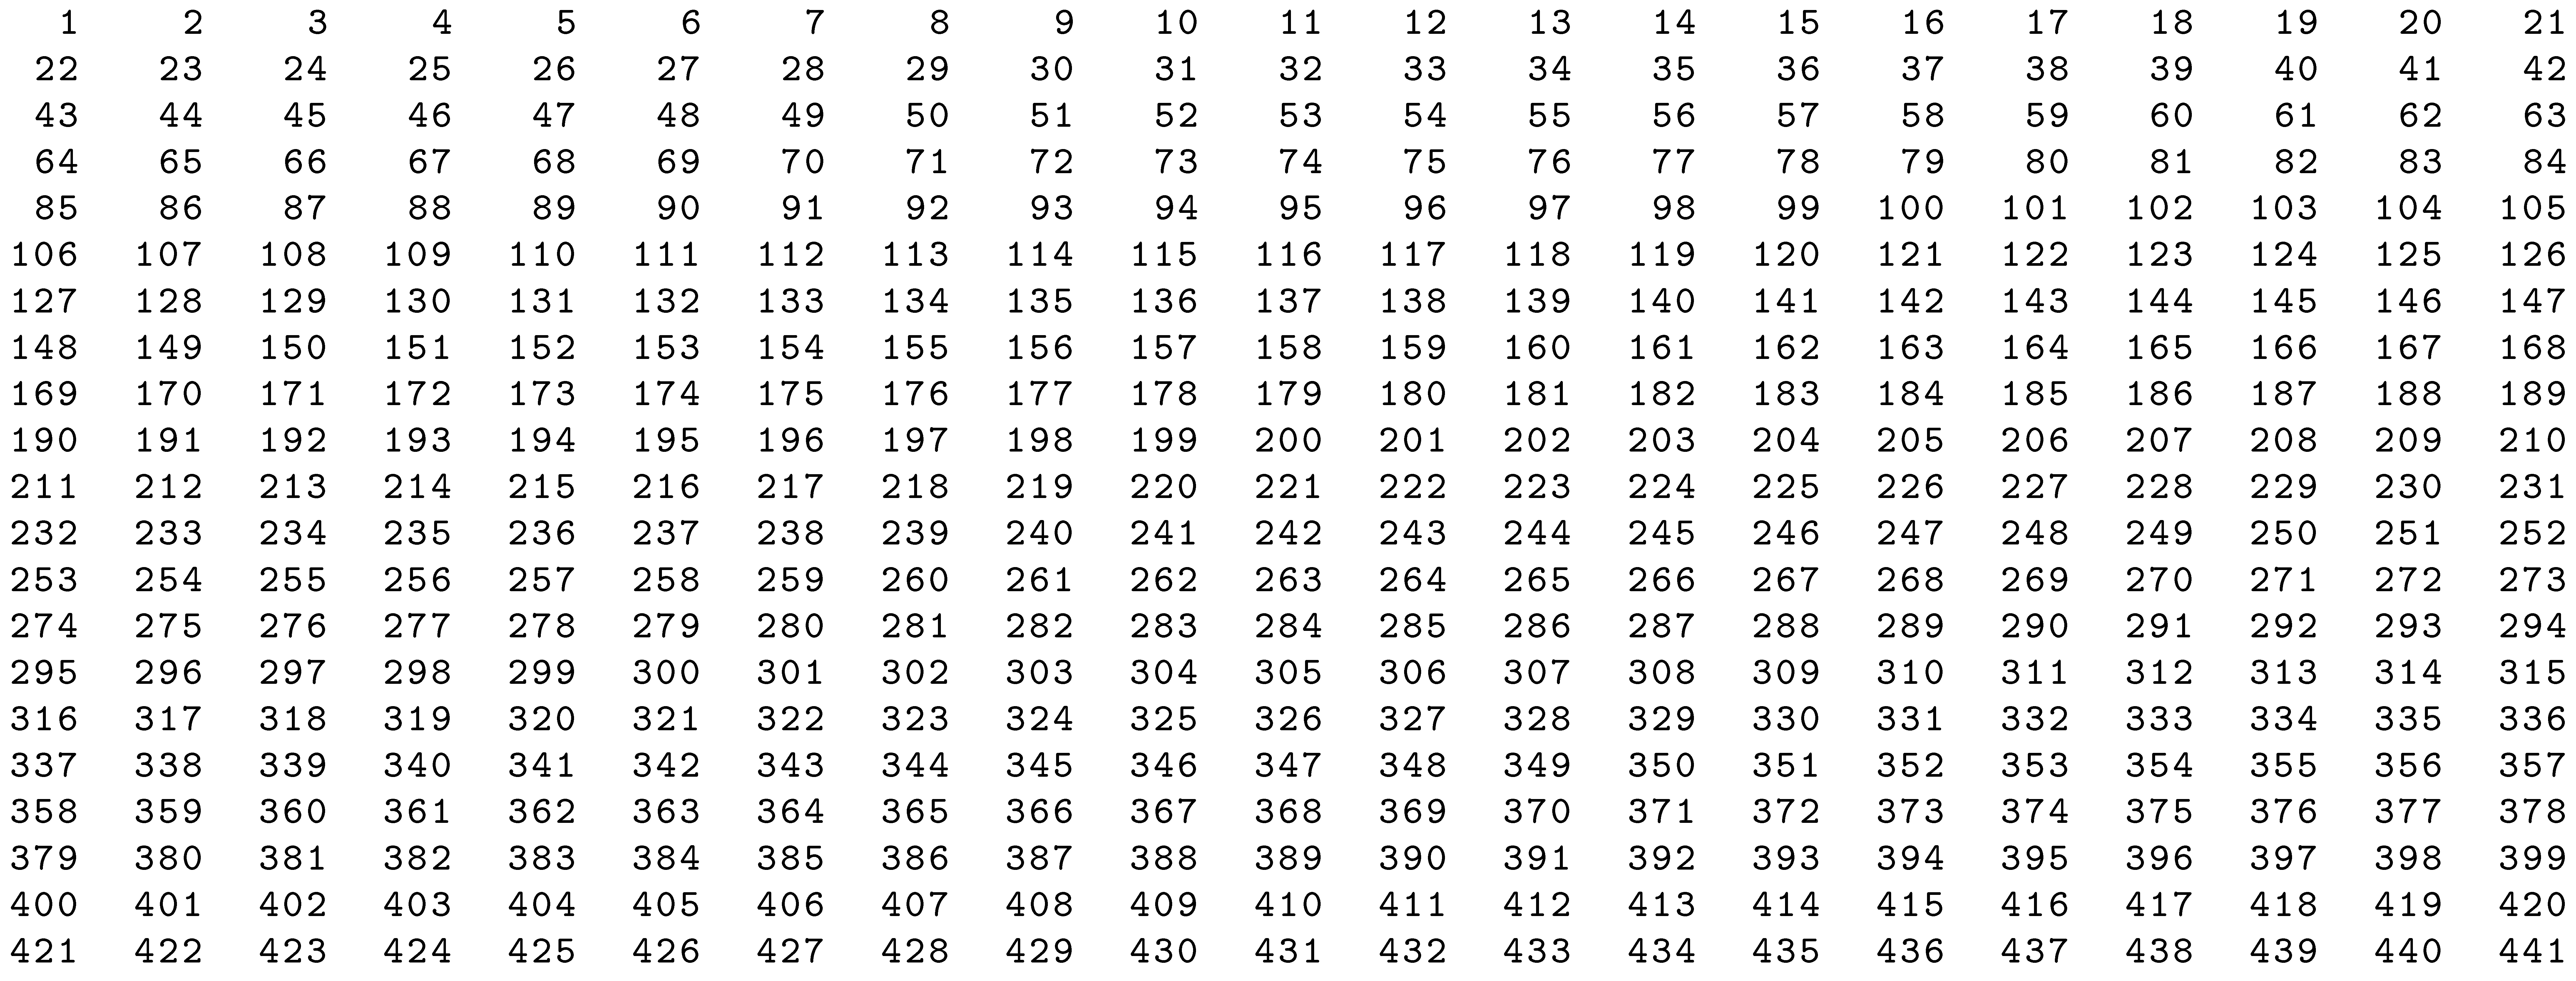
Initially, every actor i has his/her opinion among the opinions available in the system (see the Listing A1 in Appendix B). The time evolution for actors who decorate the nodes of the square network takes time steps. The single step is completed when all actors attempt to change their opinions. The results are averaged over independent simulations. The averaging procedure is marked by a . The open boundary conditions are assumed.
To learn more about the spatial distribution of opinions, we detect, count, and measure the sizes of clusters of agents sharing the same opinion. To this end, we apply the Hoshen–Kopelman algorithm [61] (see also [62] (pp. 59–60), [63,64]) allowing the labelling of every actor in such a way that actors who share the same opinions in various clusters are labelled with various labels and actors belonging to a given cluster are labelled with the same label. The number of clusters and the size of the largest cluster at time are indicated as and , respectively.
3. Results
In this Section, we present the results of computer simulation—based on a computer programme written in Fortran—for and . Typically, simulation for this set of parameters and R and a single pair of takes around 3 days of Central Processing Unit (CPU) time on the Dell Precision Rack 7920 Workstation with a 3.20 GHz CPU clock.
In Figure 1, the results of simulations concerning the average final (at ): number of opinions, (Figure 1a), number of clusters (Figure 1b), and their largest size, (Figure 1c), are presented. The values of and are normalised to the number K of opinions available in the system while is normalised to the system size . Thus, these numbers are presented as percentages.
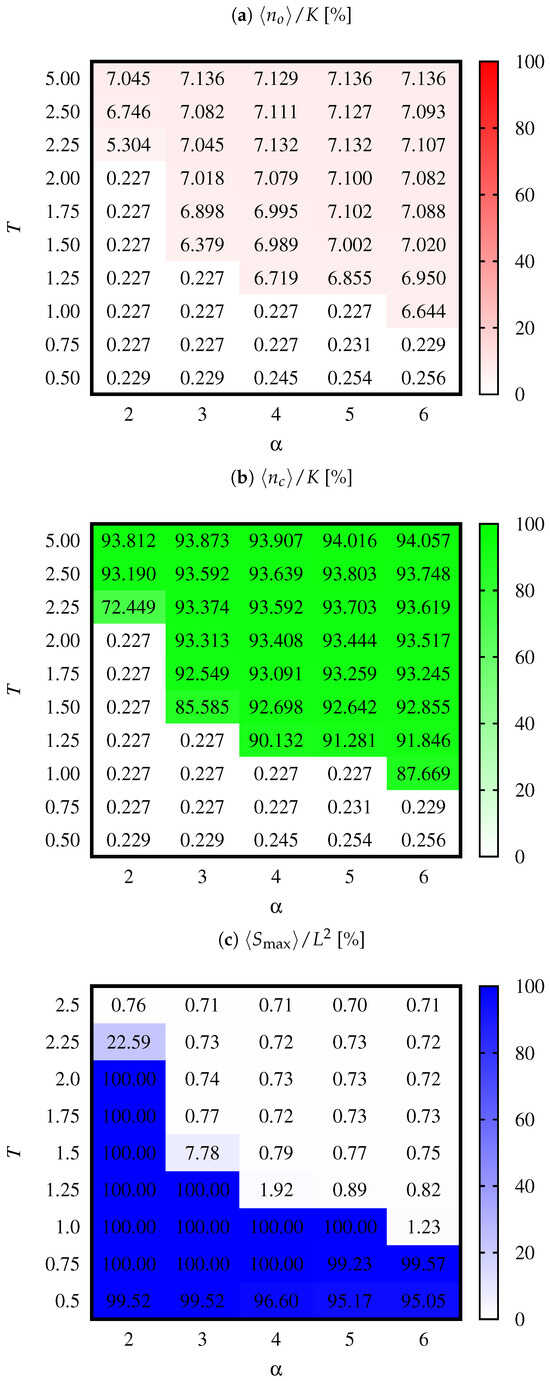
Figure 1.
Ultimate (at time steps) averaged (over simulations) numbers (a) of observed opinions, , (b) clusters of opinions, , and (c) the largest cluster size, . The data are normalised to the initial available number of opinions, K (a,b), and the system size, (c).
In Figure 2, examples of probability distribution function, F, for the size of the largest clusters are presented. Figure 2a shows the initial distribution (i.e., at , when ) of the largest cluster size, while Figure 2b–j show examples of the typical distribution obtained at the end of simulations, i.e., at . In Figure 2b,c,h,i, the probability distribution of the largest cluster size for the “corners” of the parameter system plane —see Figure 1—are presented. Furthermore, in Figure 2j, we present the function F for the limiting case , .
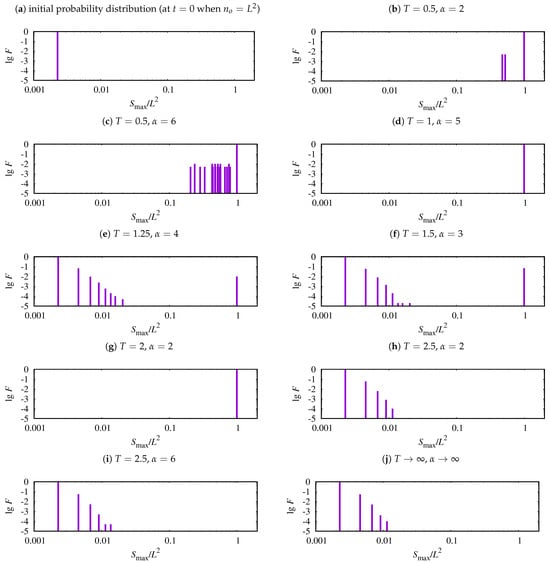
Figure 2.
Examples of probability distribution function, F, of the size of the largest clusters for (a) initial configuration (at , ), (b) , (the lowest left corner of Figure 3), (c) , (the lowest right corner of Figure 3), (d) , , (e) , , (f) , , (g) , , (h) , (the highest left corner of Figure 3), (i) , (the highest right corner of Figure 3), (j) , .
In the system of opinions studied, independently of the control parameters of the model, at least about 90% initially available opinions are removed from the system. For low social temperature (small T) and effectively long range of interactions (small ), only a single opinion (when consensus on common opinion in society occurs) or two opinions survive (when system polarisation takes place). For high social temperature (large T) and effectively short range of interactions (large ), no clustering of opinions is observed (with their number reduced as mentioned above). Unlike many binary models, these effects are not embedded in the model rules themselves. With computer simulations of the opinion dynamics model, we have shown that successive disappearing of opinions are naturally associated with social impact theory, and the initial diversity of opinion vanishes in several time steps of system evolution. As mentioned in Section 2, the disappearing of any opinion in a given simulation is irreversible—this is not different from the sociological equivalent of Muller’s ratchet [65] observed also in Eigen’s quasi-species [66].
In Appendix A, we show six examples of the time evolution of the number of opinions observed in the system. The presented results are for , (Figure A1a), , (Figure A1b), , (Figure A1c), and , (Figure A1d).
4. Discussion
In a single simulation, the number is always a monotonically nonincreasing function of time (see Figure A1). The assumed simulation time seems to be long enough to ensure reaching a plateau in the time evolution of . Please note that vanishing during evolution any of the initially available opinion , i.e., when at time none of the actors share this opinion , then for any , this opinion will not be restored. Here, we deal with the sociological equivalent of the famous Muller’s ratchet [65] known in evolutionary genetics.
Changes in the number of observed opinions (surviving temporal evolution) (Figure 1a) are accompanied by changes in the number of clusters (Figure 1b) and their largest size (Figure 1c). These numbers bring complementary quantitative information on the system: for instance, for and , one simultaneously has , and —which are straightforward signatures of unanimity of opinion.
The analyses of the averages , , and presented in Figure 1 together with the analyses of the probability distribution function shown in Figure 2 allow the identification of four possible phases observed in the system. These phases correspond to:
- reaching unanimity of opinions (, , , probability distribution function of the largest cluster size as in Figure 2d,g);
- reaching unanimity of opinions or society polarisation (probability distribution function of the largest cluster size as in Figure 2b,c);
- taking random opinions by actors (probability distribution function of the largest cluster size as in Figure 2h,i);
- mixture of the phases mentioned above (probability distribution function of the largest cluster size as in Figure 2e,f).
These four scenarios, observed after system time evolution up to time steps, can be mapped into space to create the phase diagram of the computerised model of the Nowak–Szamrej–Latané social impact theory [46]. This diagram is presented in Figure 3 and the numbers there correspond to the list enumerator given above.
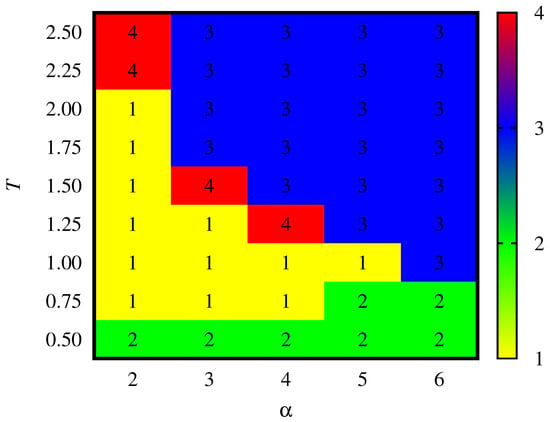
Figure 3.
Model phase diagram on plain. The numbers correspond to the list enumerator given in Section 4.
Looking for sociological theories that would explain the disappearance of some of the available opinions, one can refer to Nan Lin’s hypothesis on the theory of social capital [67,68]. According to Lin’s concept, opinions may be treated as a resource in a social network. The process by which resources in social networks become meaningful and valuable for members of these networks can be considered in relation to several principles ([67], pp. 30–33):
- The first principle has to do with consensus or influence developed or exercised within a group. Consent as to whether a resource is valuable or not can be achieved as a result of persuasion (communication and interaction without sanctions or penalties lead to the formation of an internal conviction in individuals as to the value of a given resource), request (appeals or lobbying result in recognising a given resource as valuable even when the individual does not understand its meaning but wants to remain a member of the group or identify with it), or coercion (an alternative to not recognising the value of a given resource is the threat of sanctions or penalties).
- The second mechanism that allows one to assign value to resources boils down to taking actions by all actors aimed at promoting their own interests by protecting or acquiring valuable resources. For example, it is in the community’s well-understood interest to give a higher status to those who, in the opinion of its members (between whom consensus is reached), have valuable resources (knowledge, physical strength, knowledge of members of other communities, etc.). In this sense, the self-interest of individual members of the community becomes convergent with the collective interest (development, security, and cooperation). The devaluation of a given asset requires more than individual effort—it requires the consent of others who make similar demands.
- The third principle regarding valuable resources assumes that their maintenance and acquisition are the two basic motives of individuals’ actions, although the former is more important than the latter. Only when the group’s resources are secured can its members make an effort to acquire additional resources.
In the case of social resources, two types of mechanisms can be distinguished: network resources to which an individual has access by virtue of membership in that network and contact resources that an individual actually uses in the course of action. The first of them represents constantly available resources due to the durability of social relations in the network, the second represents resources that can be mobilised in order to achieve specific benefits. The nature of the resources contained in the social network to which an individual has access is determined by several factors. First, the range of resources in the network is important, that is, the “distance” between the most valuable and least valuable resource. Second, the most valuable resource available to an individual within the entire hierarchy of resources contained in the network is of importance. Third, the diversity or heterogeneity of resources in a social network plays an important role, and fourth, the composition of resources shaped by those of them that are average or the most typical composition is also significant [67] (p. 37), [68]. In the field of social sciences, Lin’s theory is one of the most coherent and well-established theories of social capital. It deals with the exchange of resources in social networks. Like most sociological theories, it does not attempt to indicate how exchange occurs (in quantitative terms), but rather why it occurs. Therefore, it creates a context for understanding the complexity of interpersonal relationships in their social dimension.
The existence of these two mechanisms was confirmed by Luca Valori and coleeagues research [69], which used a large and detailed data set [69]. They have characterised the empirical properties of the large-scale distribution of individuals in multidimensional cultural space. By using simple models, they showed that ultrametricity has profound and nontrivial consequences on short- and long-term cultural dynamics. In the short term, they found the existence of a symmetry-breaking phase transition where collective behaviour arises out of purely local interactions. However, in the long term, the same ultrametric property suppresses cultural convergence by restricting it within disjoint domains, implying a strong sensitivity to the initial conditions. Thus, the apparent paradox of the coexistence of short-term collective social behaviour and long-term cultural diversity might have, as a simple and parsimonious explanation, the empirically observed hierarchical distribution of individuals in cultural space.
The character of actors’ connections in social networks determines the availability of social resources and their size. If one treats information or opinion as a social network resource, then some members of the social network (opinion leaders) play a greater role in its propagation [70] than the sender of the message itself. In the first model (two-step flow), the key role is played by opinion leaders who mediate between the sender (mass media) and the rest of society. In this model, unlike the one-step or “hypodermic” model [71], individuals are not treated as atomised recipients of media influence.
Depending on whether the actors in social networks are similar or different from each other, the links between them can be bonding or bridging [72]. Ronald Burt [73,74] characterised two mechanisms of social contagion in the diffusion of innovation (opinions) in social networks depending on their structure: cohesion-induced contagion and equivalence-induced contagion. Cohesion-induced contagion occurs in cohesive networks between actors that maintain frequent and emphatic relationships. It is based on socialising communication. However, equivalence-induced contagion occurs in bridging networks as a result of competition between two actors who have similar relationships with other people. This applies to the competition of people who just use each other to evaluate their relative adequacy. Quoting Ref. [73] (p. 1291): “The more similar ego’s and alter’s relations with other persons are—that is, the more that alter could substitute for ego in ego’s role relations, and so the more intense that ego’s feelings of competition with alter are—the more likely it is that ego will quickly adopt any innovation perceived to make alter more attractive as the object or source of relations.” Ultimately, a large number of bridges connecting diverse groups is essential for reducing opinion fractionalisation within societies [75]. A large number of bridges also has the effect of reducing distances between unconnected citizens [76].
5. Conclusions
In this paper, the Latané social impact theory is employed to build a model of opinion formation. With computer simulation, we investigate how the initial variety of opinions assigned to actors in such a way that initially every actor has his/her own opinion influences the final opinions number and their spatial distribution. The latter may be, to some extent, automatically checked (without direct analysis of snapshots from simulations) by means of techniques known from studies of site percolation phenomena.
As was pointed out in Refs. [36,37], a small noise dose (not too high a social temperature T) helps to reach consensus (not necessarily observed for the deterministic version of this model, i.e., for , cf. Figure 3 in Ref. [37] and Figure 7 in Ref. [36], where, however, the number of available opinions was restricted to several, namely [36] and [37]). This is well seen in Figure 1 and also in Figure 3 for and .
Independently of the model control parameters, at least 90% of the initially available opinions are removed from the system. In some cases, only two opinions (when society polarisation occurs) or even a single opinion (when consensuses on a common opinion takes place) survive. As explained by Lin [68], there are various mechanisms that connect the individual to the group around shared resources [67,68]. The group provides the individual with a more effective way of pursuing their interests than if the individual were to act individually. In order to remain a member of the group, one must agree to a consensus on the value of the resources held by the group. This consensus also applies to opinions. In Burt’s theory [73,74], opinion reduction is caused by the action of opinion leaders. Opinion leaders are the people whose conversations trigger contagion across the social boundaries between status groups. As a consequence of such actions, groups can become more similar in terms of opinions.
Finally, it would be interesting to investigate if the observed vanishing of opinions is generic, i.e., if it may also be observed in other discrete models of opinion formation. Further studies of the model may also include investigating the influence of the network topology on obtained results: the studies may either deal with regular lattices—triangular (six neighbours) or honeycomb (three neighbours)—or complex networks (including small world networks). The latter requires, however, a redefinition of the distance, , from its Euclidean definition to the shortest paths between actors.
Author Contributions
Conceptualization, K.M. and T.M.; methodology, K.M.; software, K.M.; validation, K.M. and T.M.; formal analysis, K.M. and T.M.; investigation, K.M.; writing—original draft preparation, K.M.; writing—review and editing, K.M. and T.M.; visualization, K.M.; supervision, K.M. All authors have read and agreed to the published version of the manuscript.
Funding
This research received no external funding.
Data Availability Statement
The data generated by simulations are available from the authors upon a reasonable request.
Acknowledgments
K.M. is grateful to Serge Galam for his hospitality at Pierre and Maria Curie University in Paris in July 2004 within the framework of European Cooperation in Science and Technology (COST) Action “Physics of risk” and a fruitful discussion on application of percolation theory for social systems [77,78].
Conflicts of Interest
The authors declare no conflict of interest.
Appendix A. Examples of Time Evolution of the Observed Number of Opinions
In Figure A1 the time evolution of the observed number of opinions for , (Figure A1a), , (Figure A1b), , (Figure A1c) and , (Figure A1d).
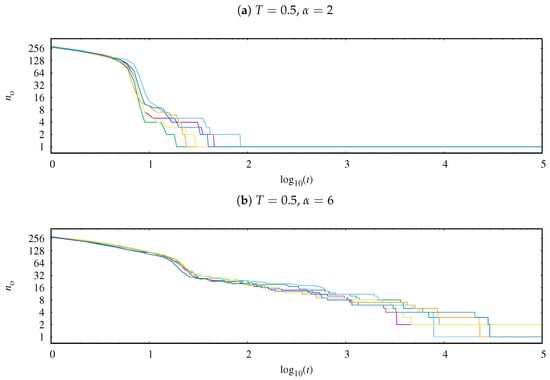
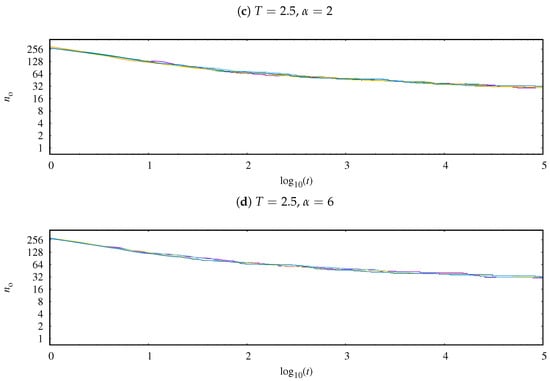
Figure A1.
Time evolution of the observed number of opinions for (a) , , (b) , , (c) , and (d) , .
Appendix B. Examples of Spatial Opinion Distribution
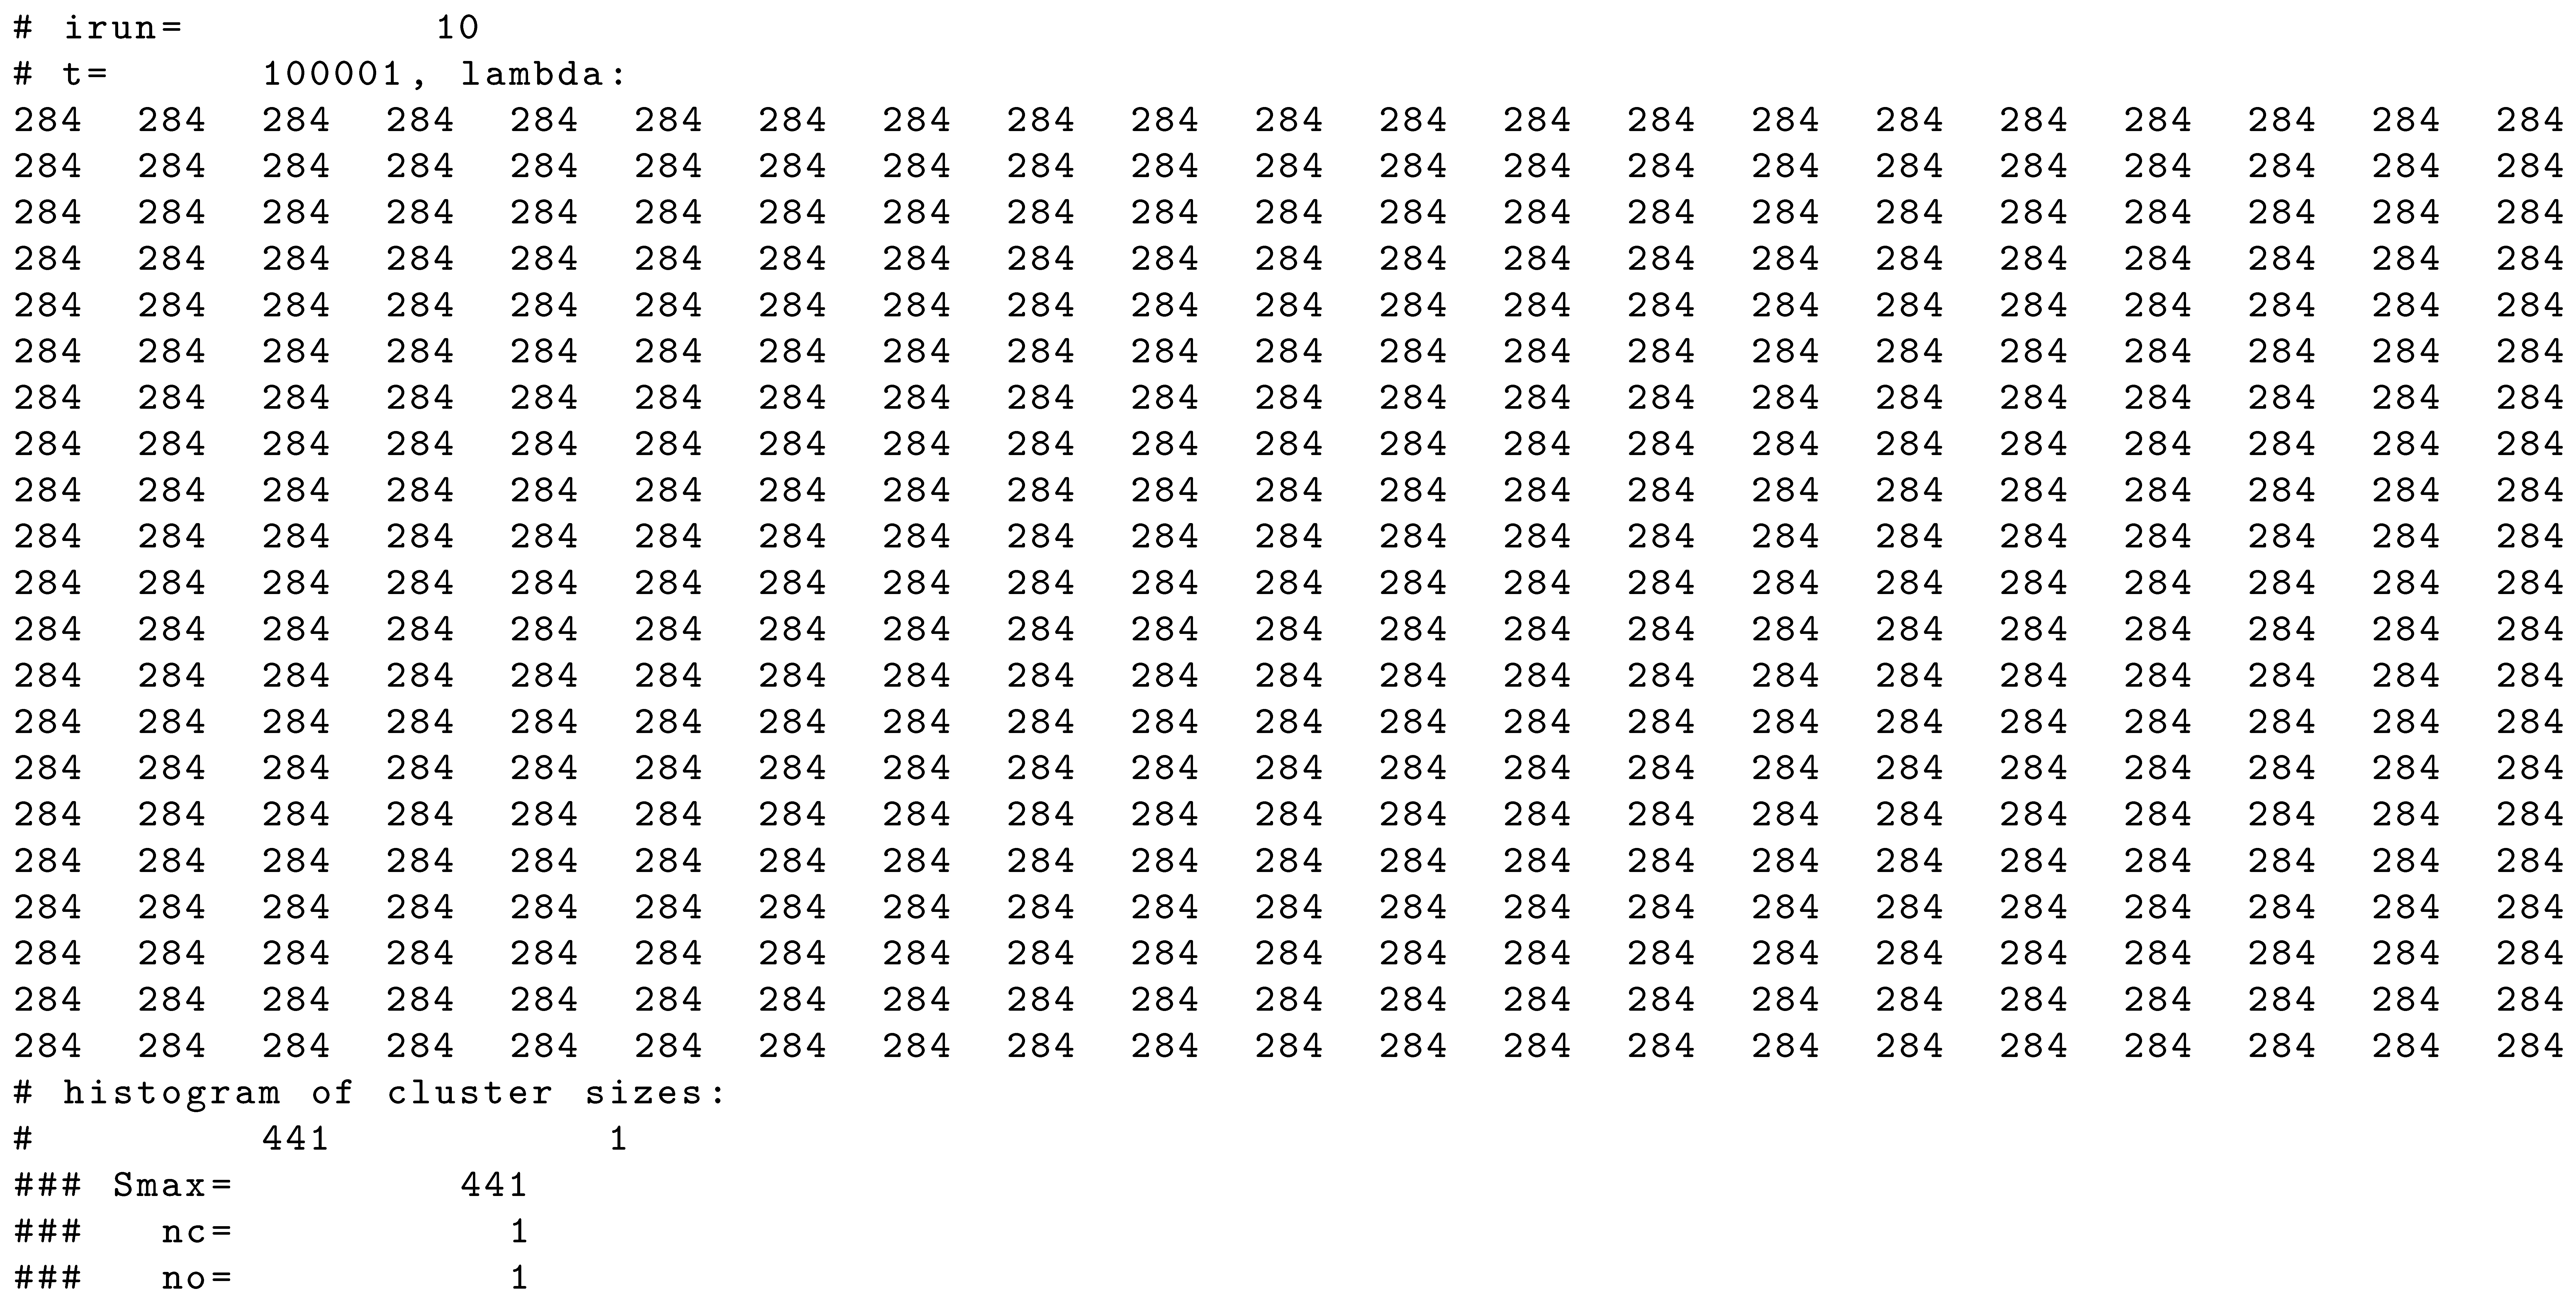
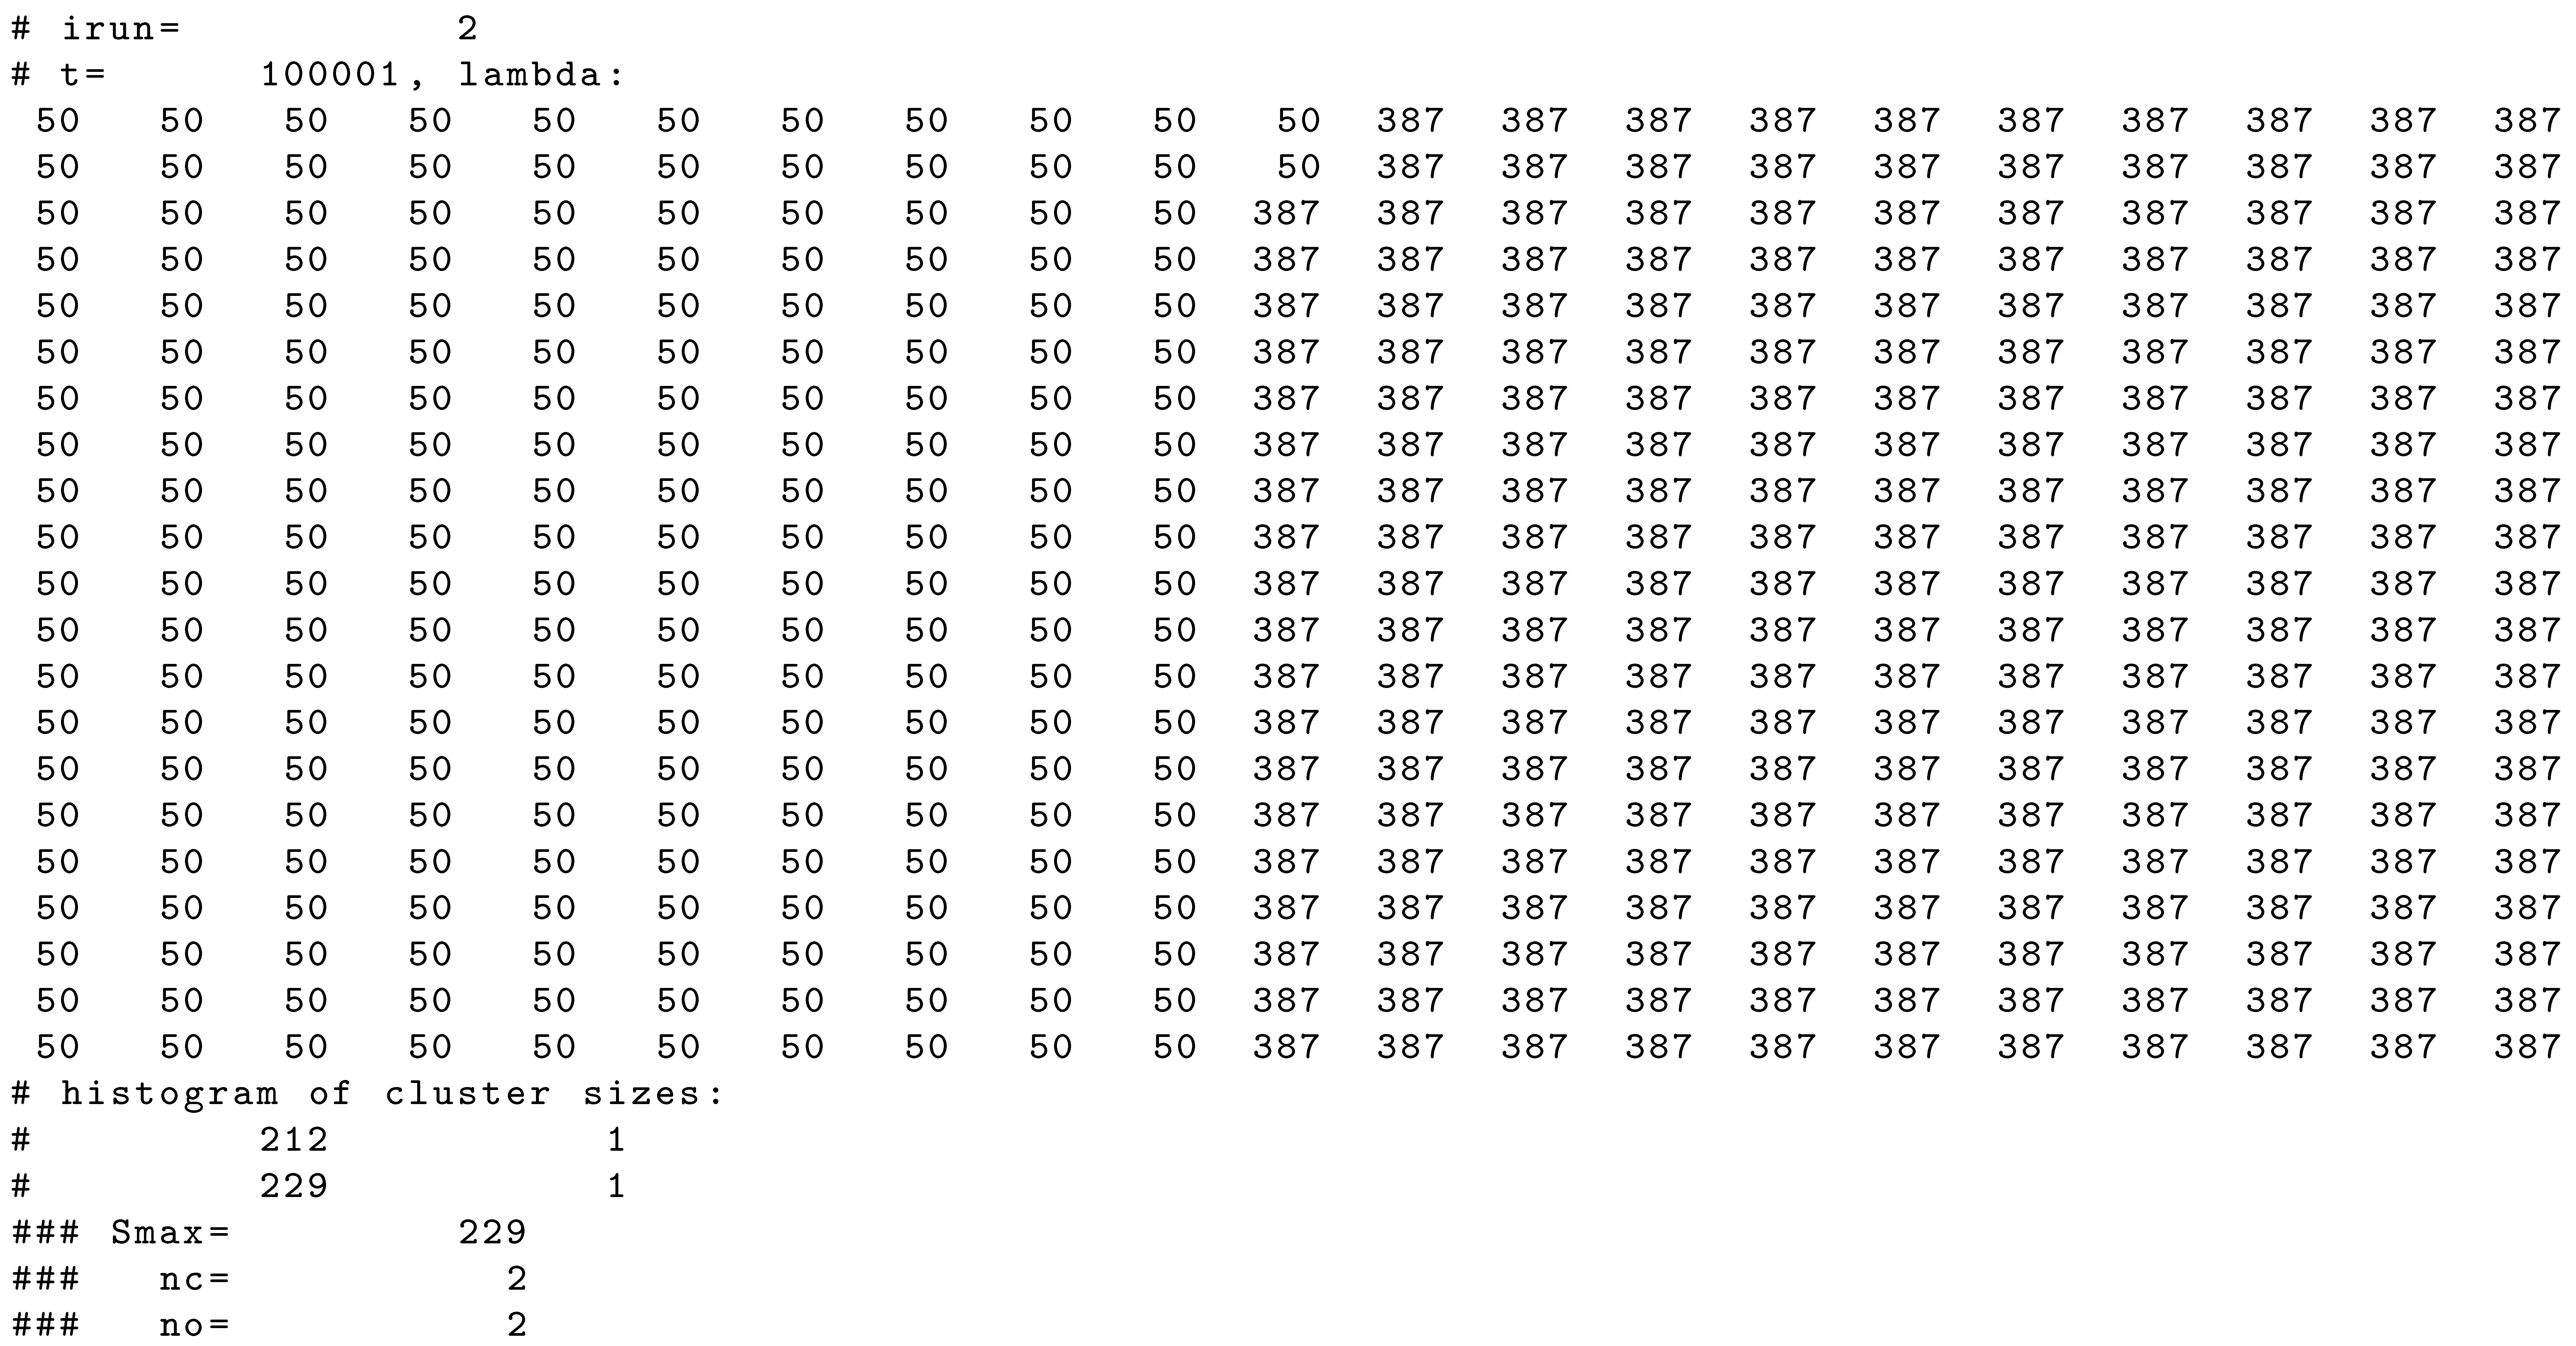
An initial state of the system for and is presented in Listing A1. In Listings A2–A7, examples of the final state of the system evolution for after time steps are presented. The numbers represent opinions. The examples are associated with four phases identified and presented in Figure 3. In Listing A2, the case of unanimity of opinions is presented. In Listings A3–A5, three variants of society polarization (with and ) are presented. In Listings A6 (with , ) and A7 (with , ), snapshots of the (still dynamical) state of the system are presented.
| Listing A1. An initial state of the system for and . The numbers represent opinions. Every agent starts with his/her own opinion, which is different from the opinions of any other actor. |
 |
| Listing A2. , , , , . |
 |
| Listing A3. , , , , . |
 |
| Listing A4. , , , , . |
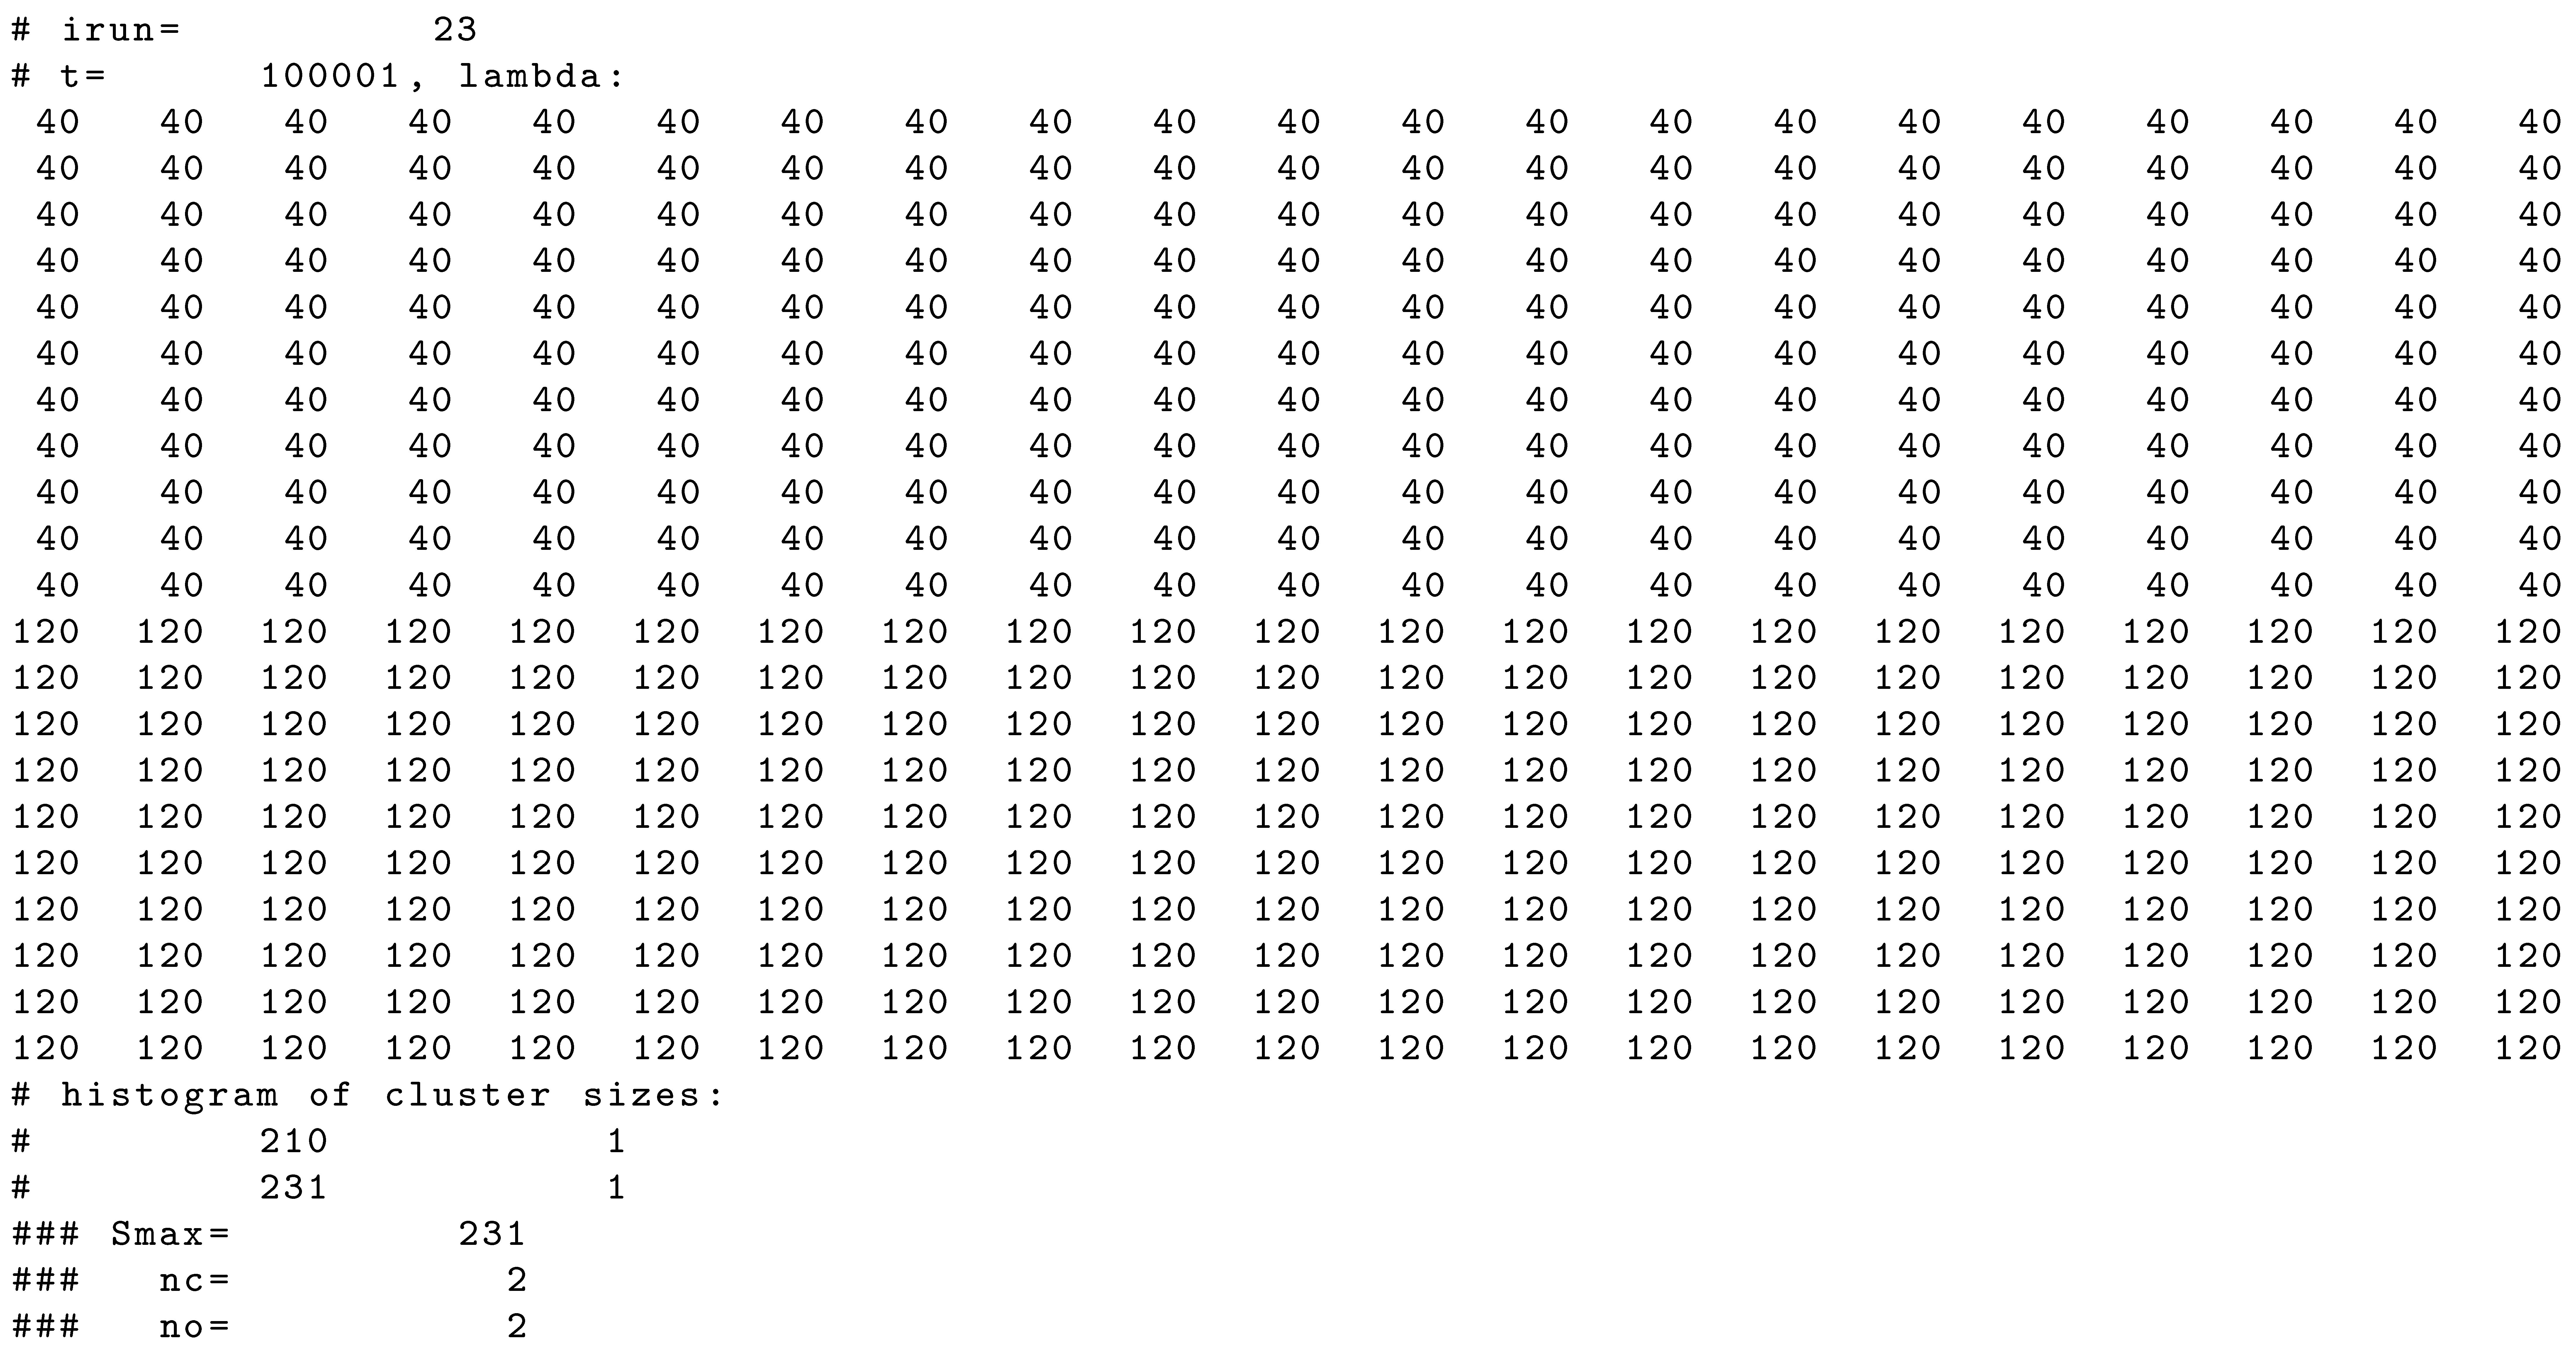 |
| Listing A5. , , , , . |
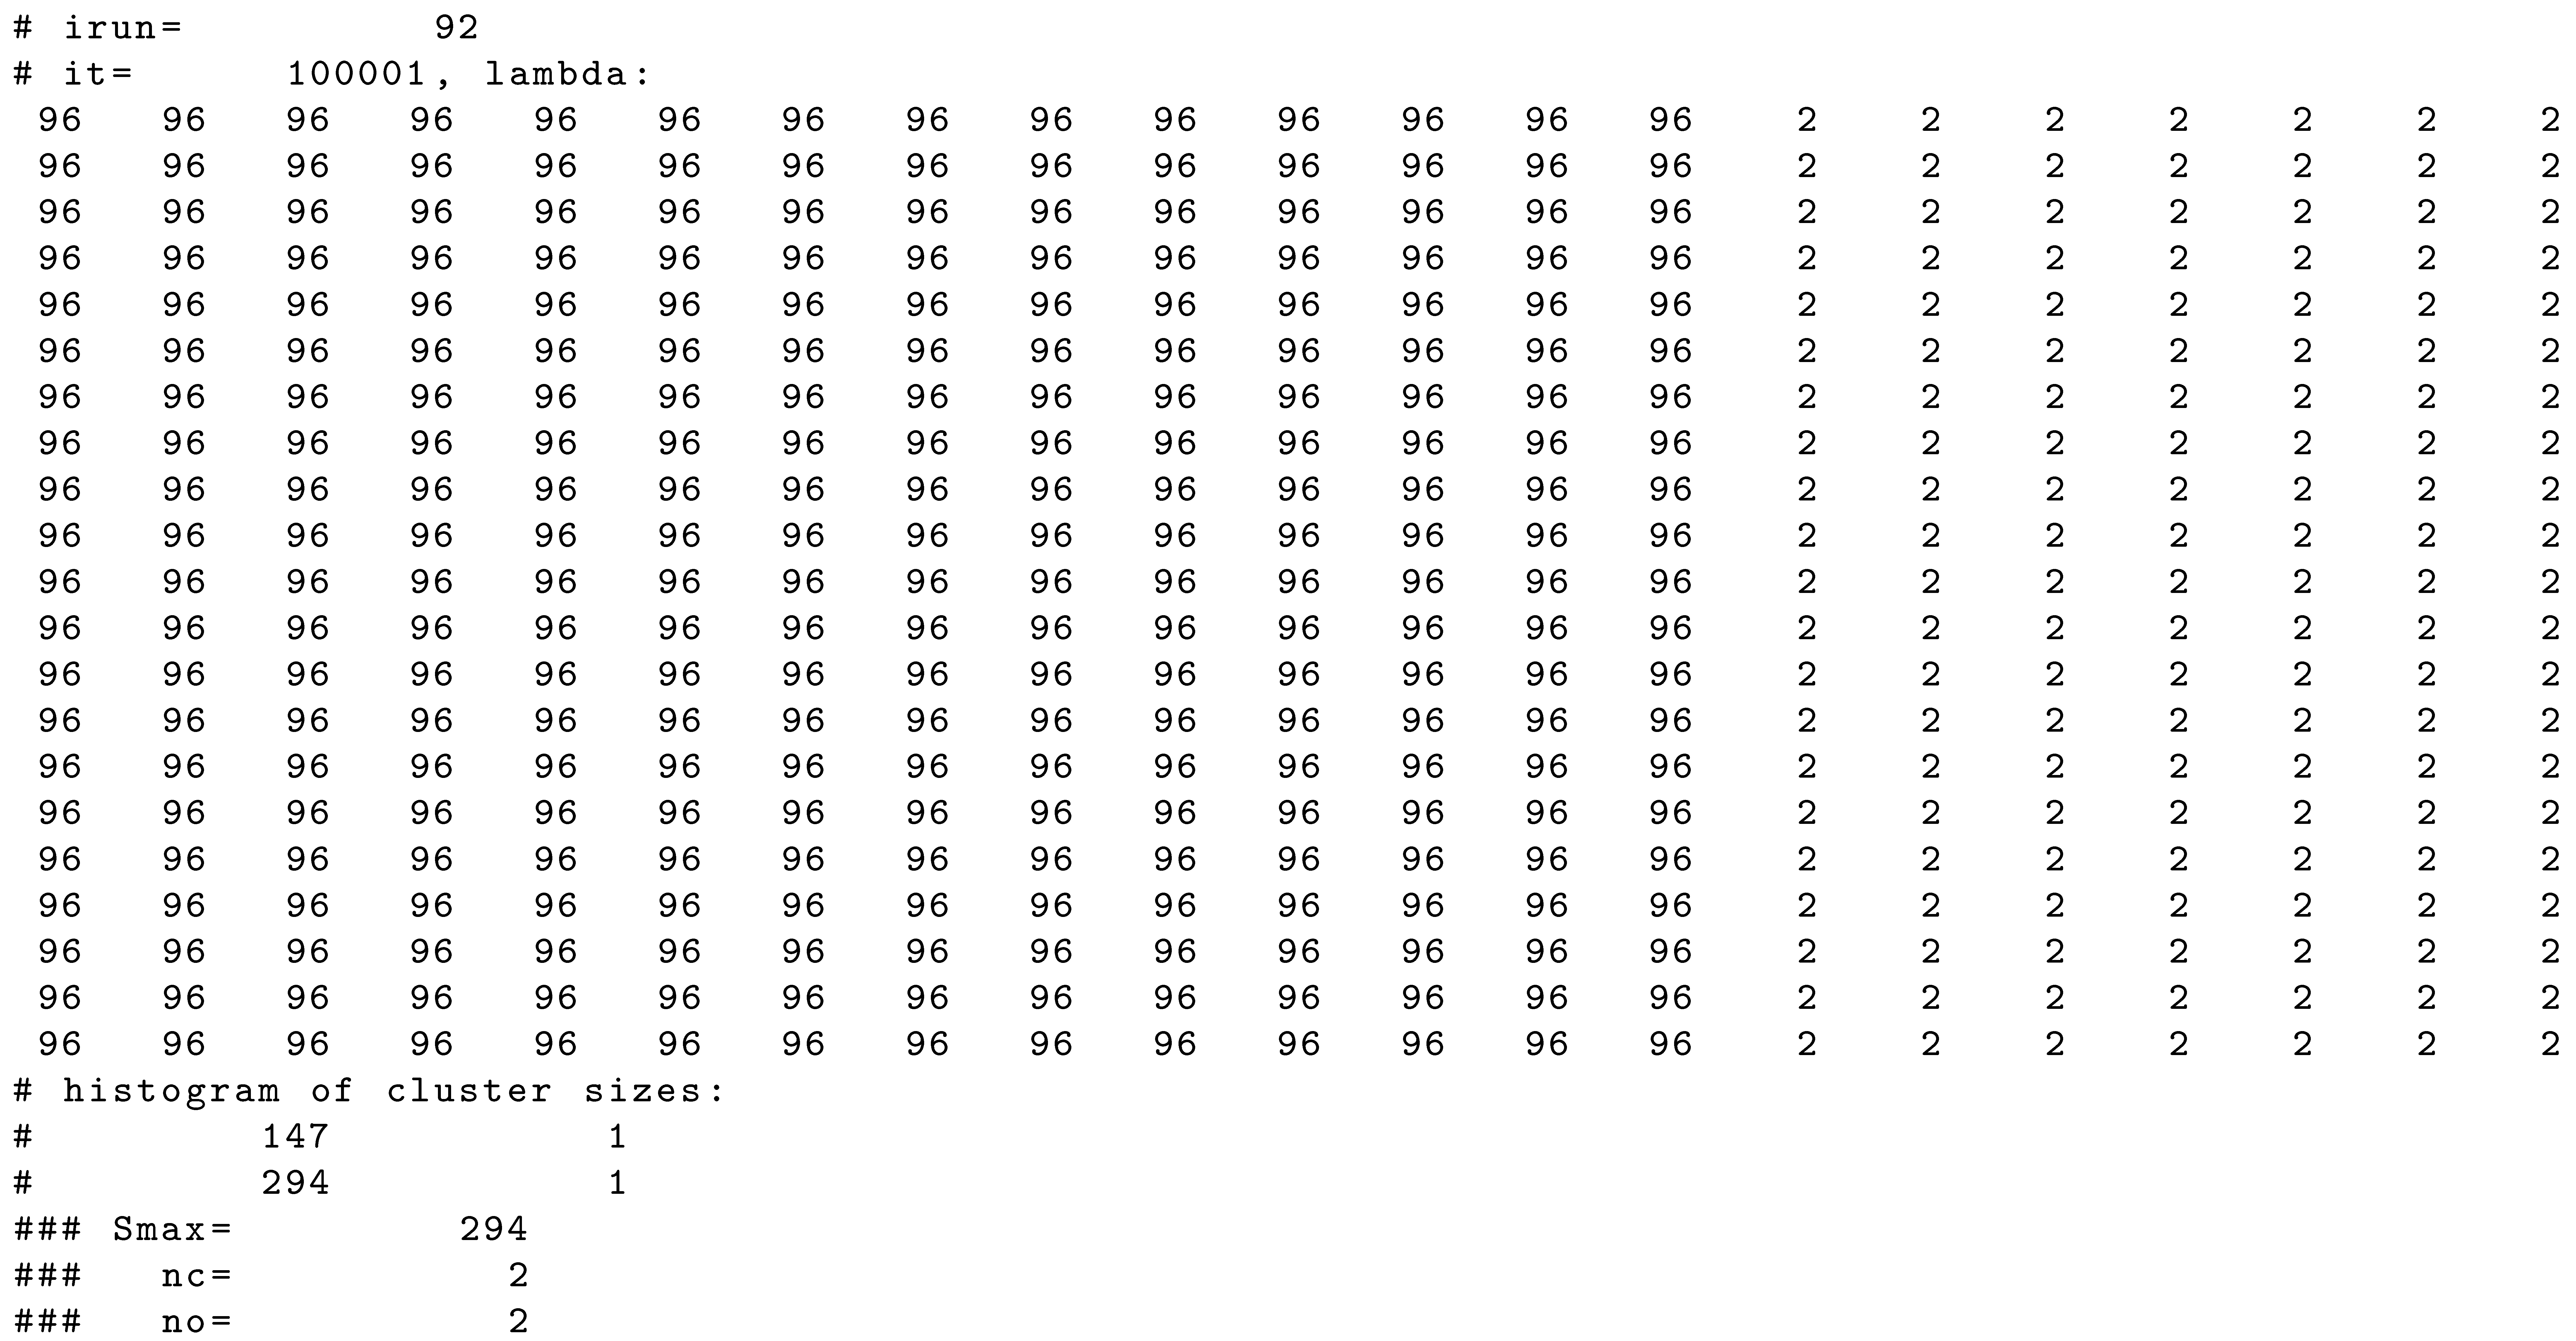 |
| Listing A6. , , , , . |
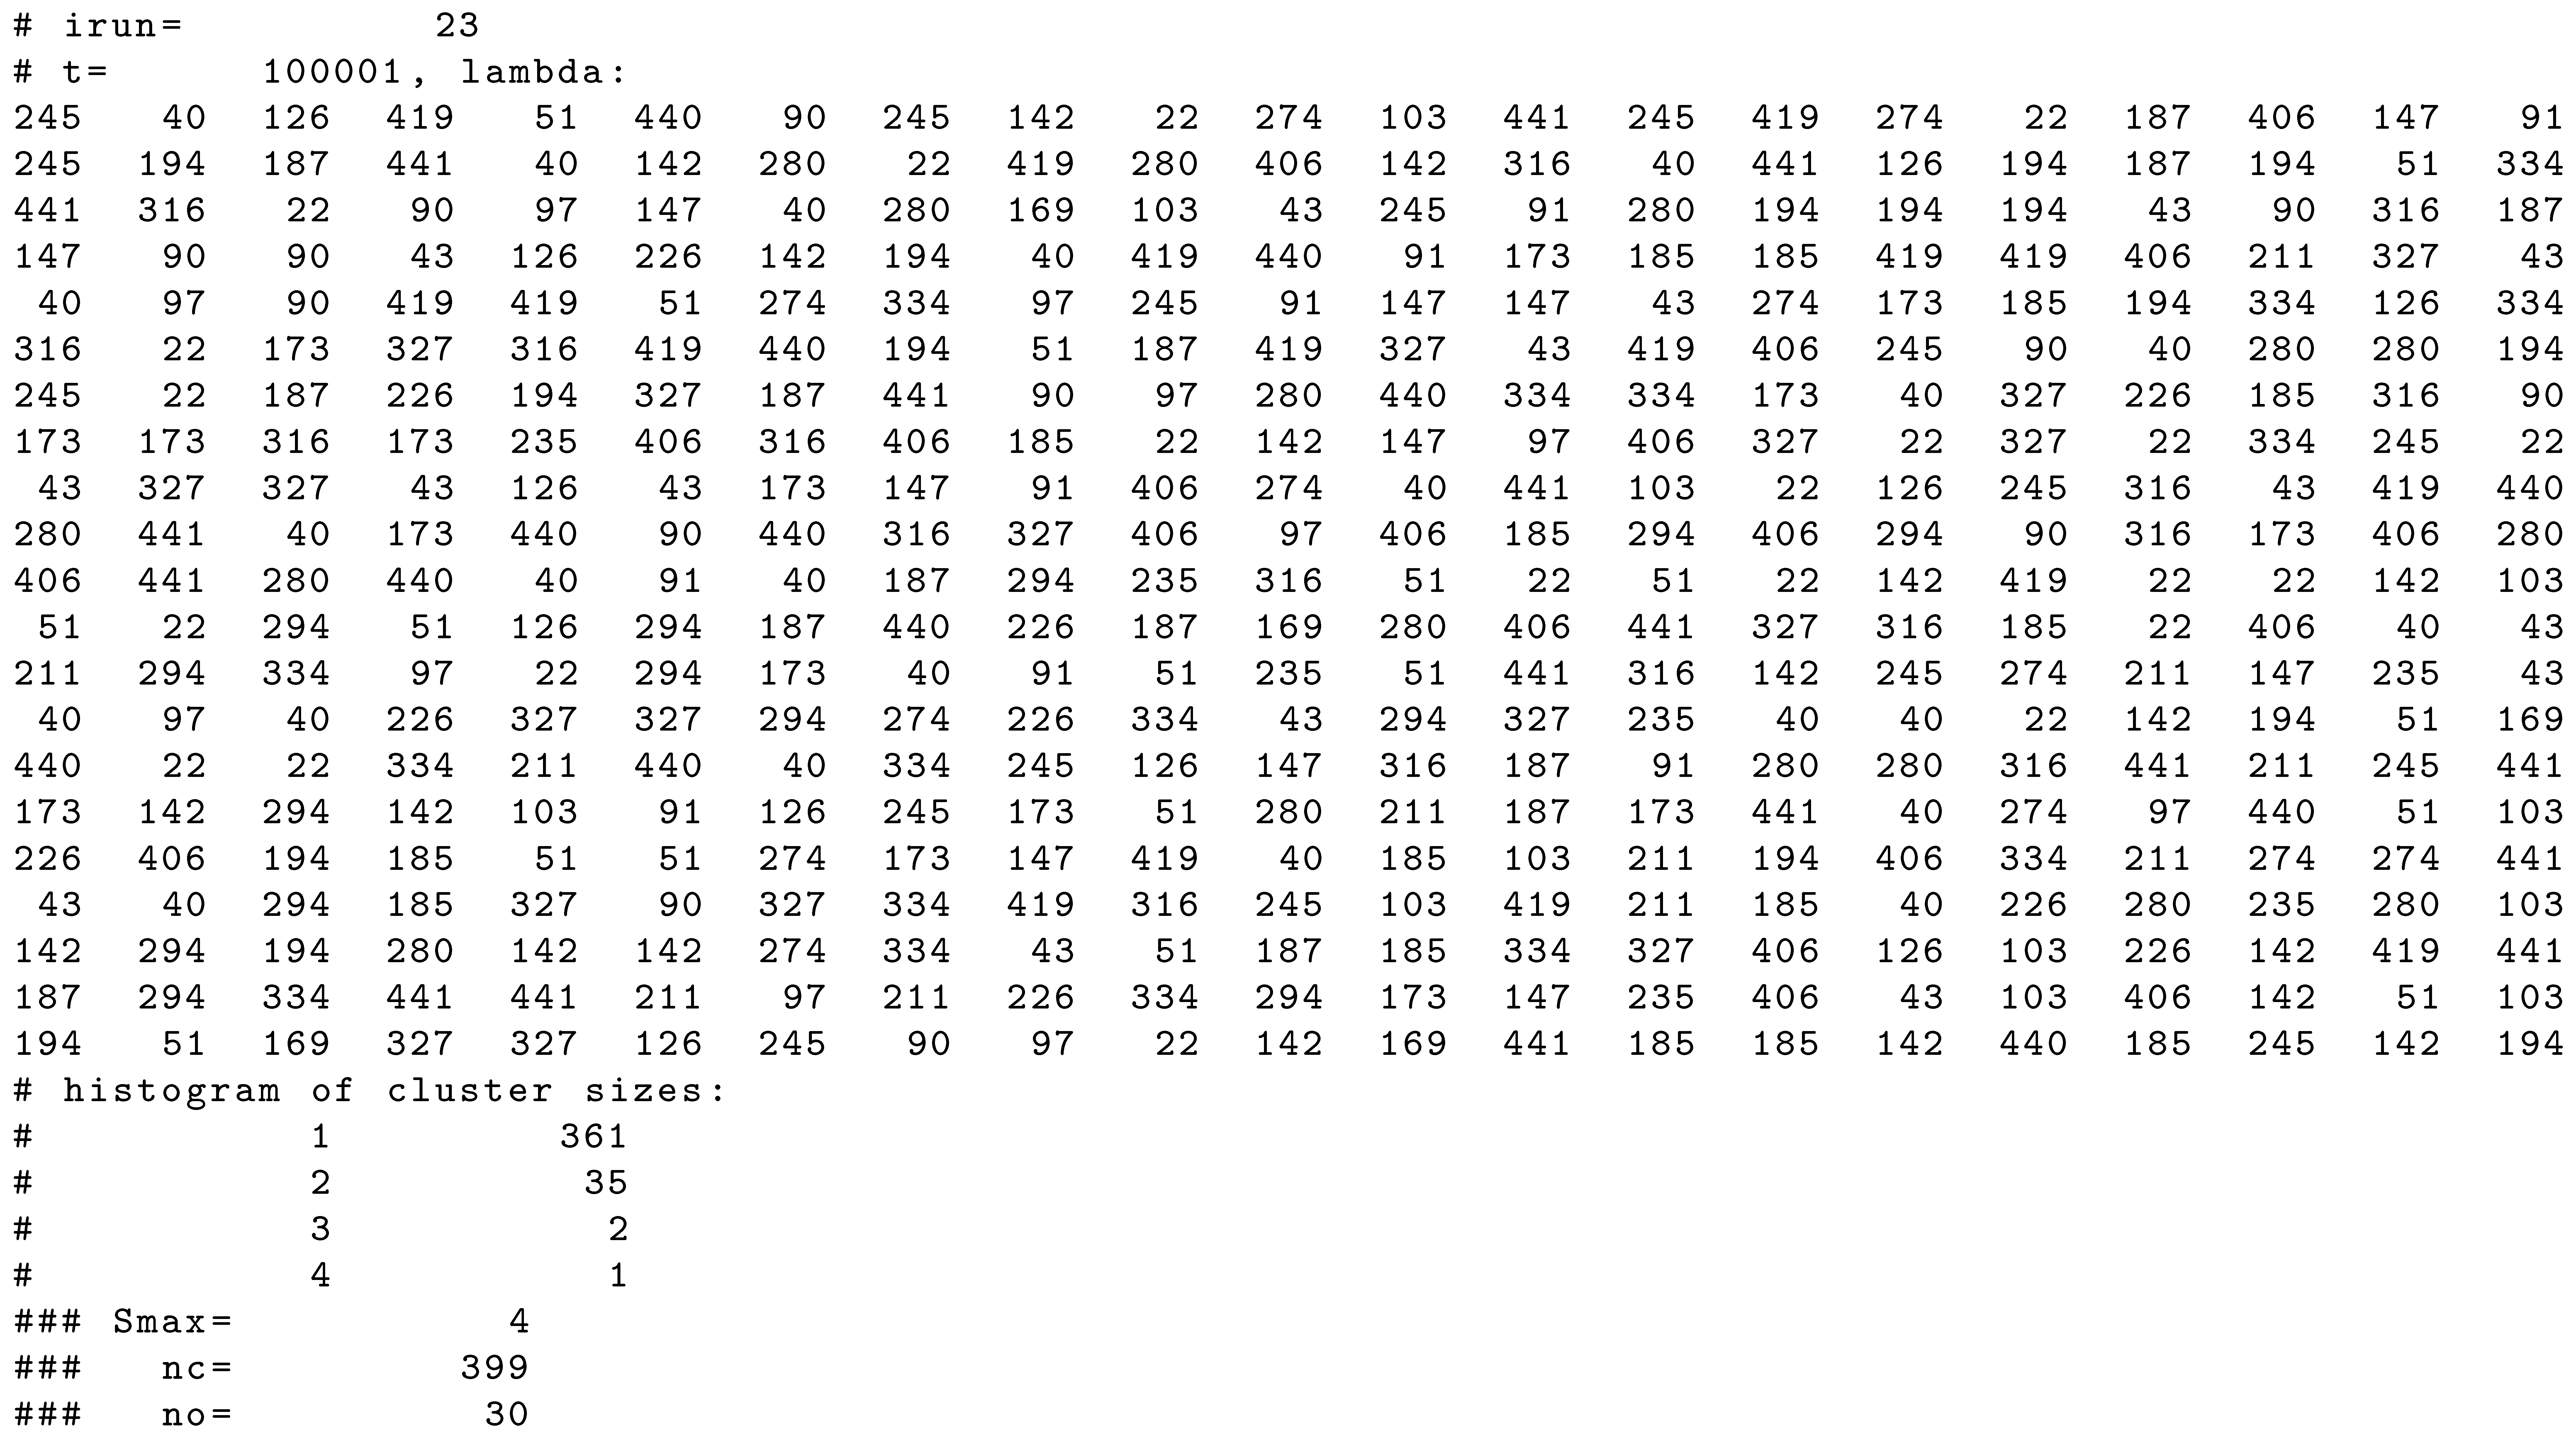 |
| Listing A7. , , , , . |
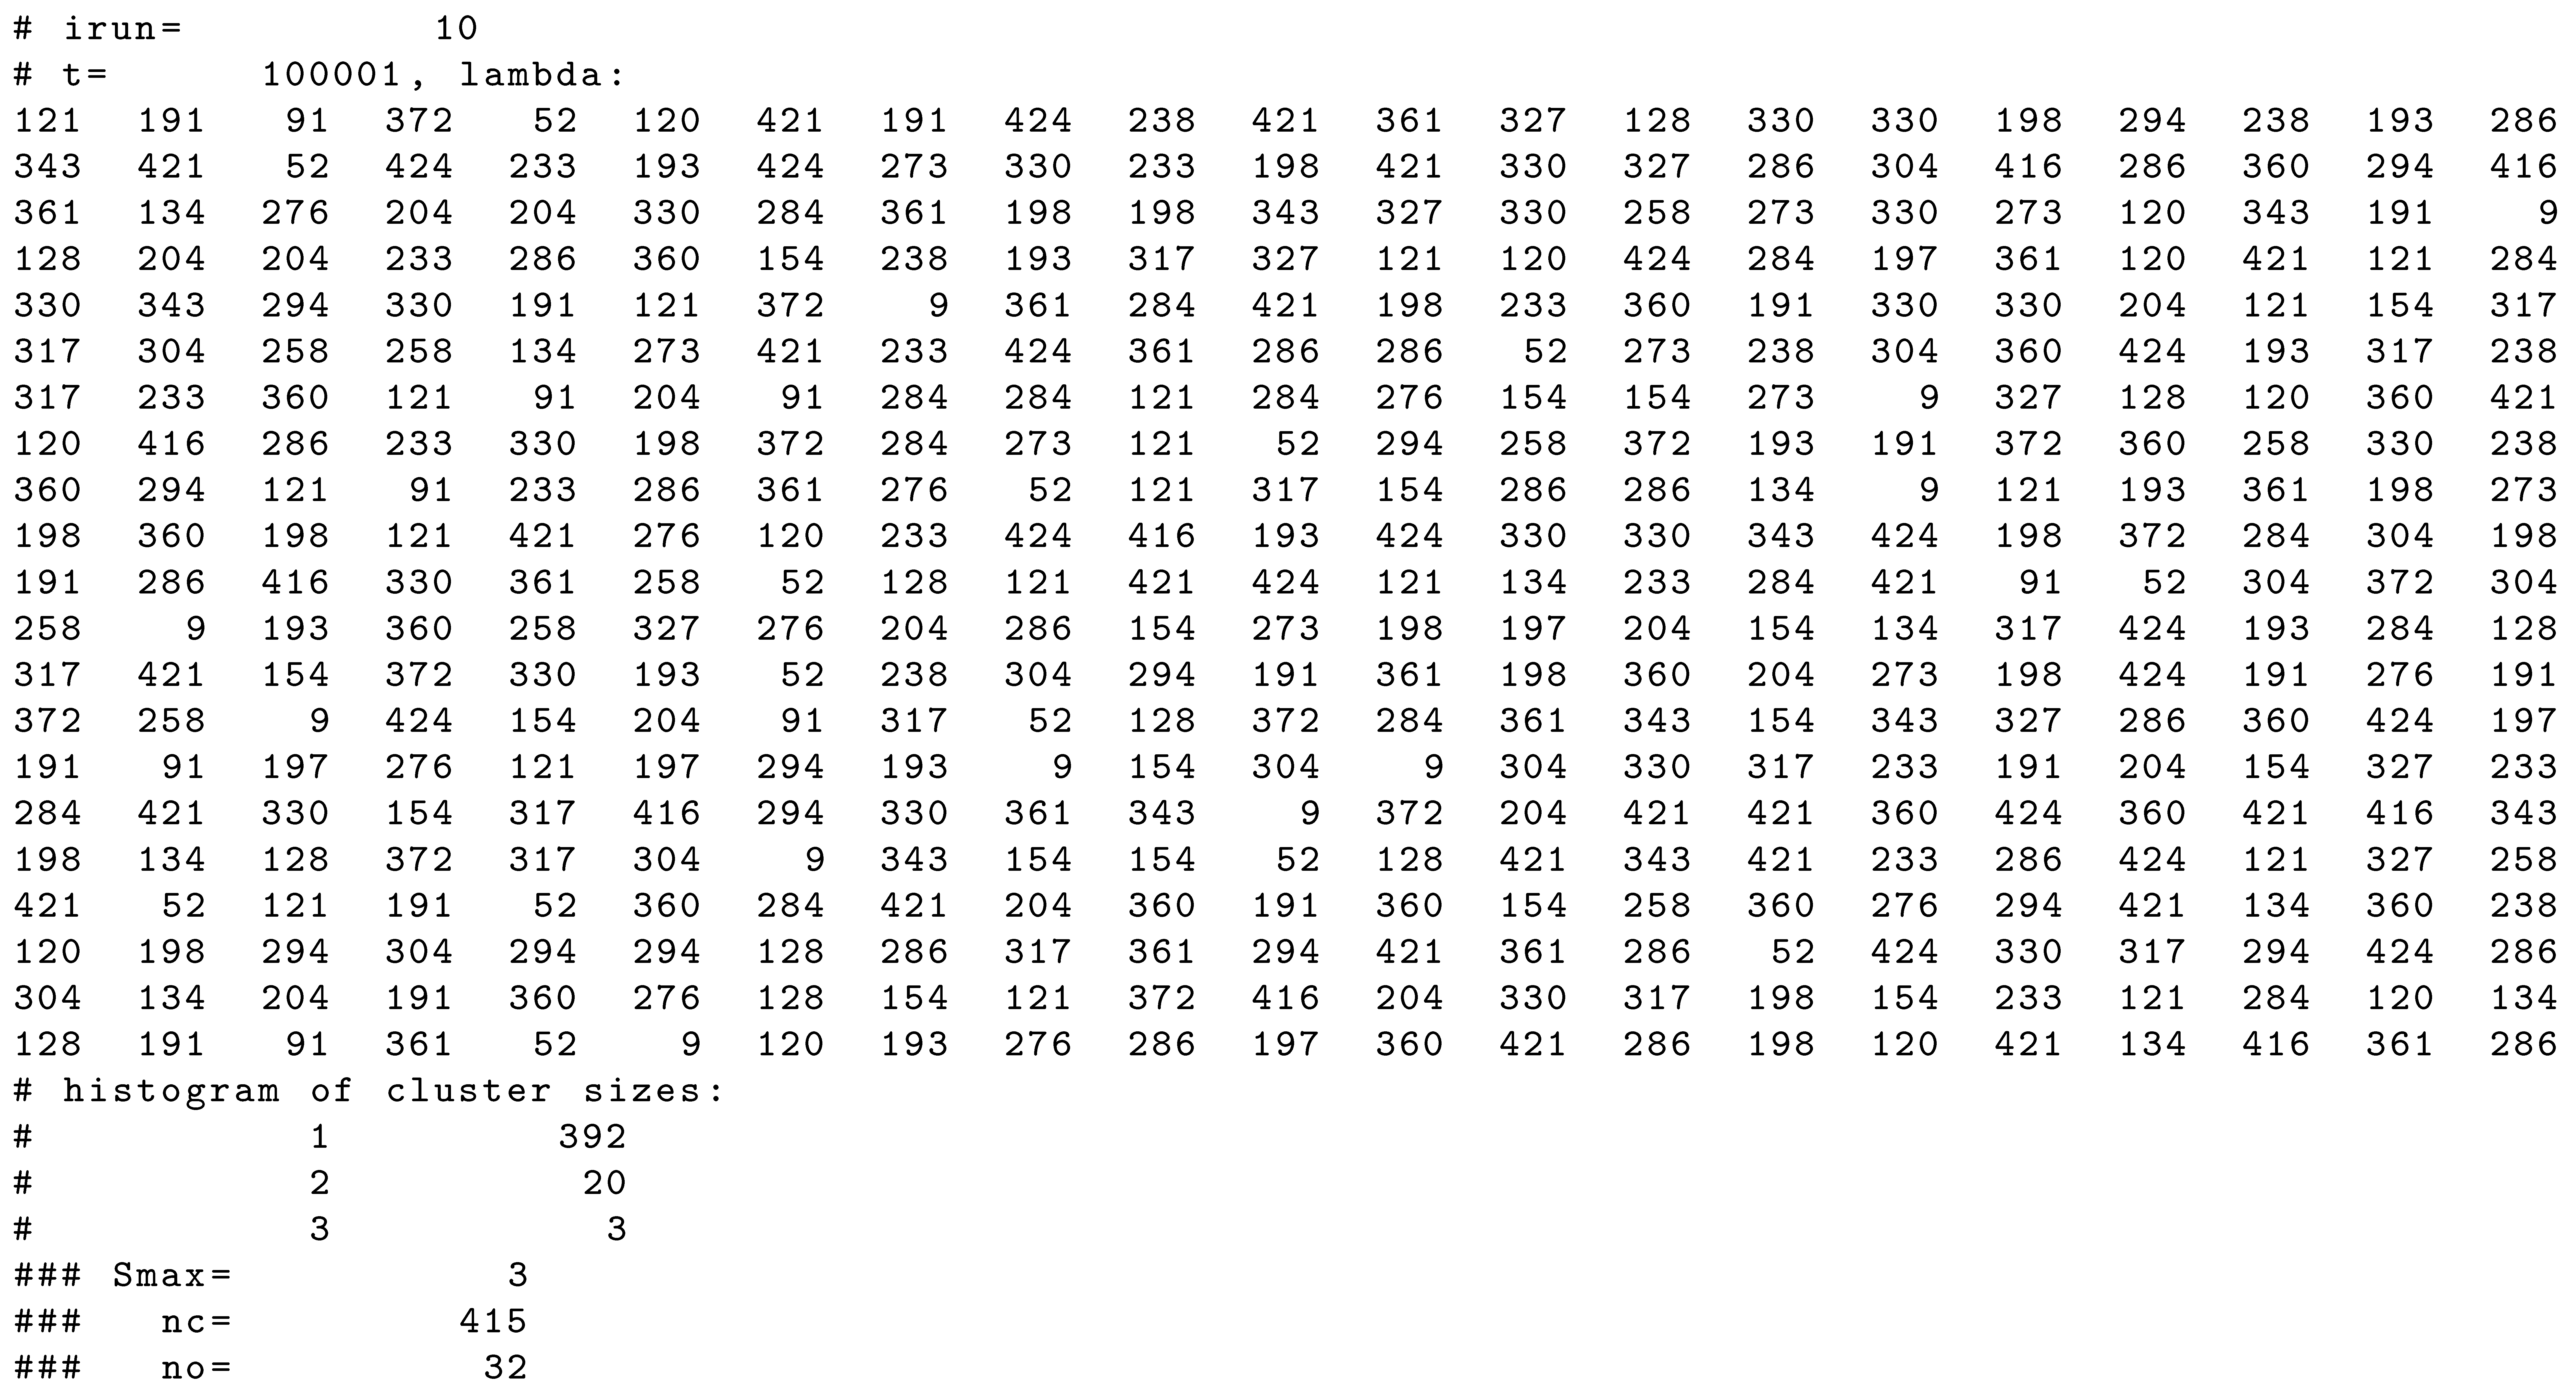 |
References
- Castellano, C.; Fortunato, S.; Loreto, V. Statistical physics of social dynamics. Rev. Mod. Phys. 2009, 81, 591–646. [Google Scholar] [CrossRef]
- Stauffer, D. A biased review of sociophysics. J. Stat. Phys. 2013, 151, 9–20. [Google Scholar] [CrossRef]
- Sen, P.; Chakrabarti, B.K. Sociophysics: An Introduction; Oxford Univeristy Press: Oxford, UK, 2014; Available online: https://archive.org/details/sociophysicsintr0000senp/ (accessed on 13 October 2023).
- Schweitzer, F. Sociophysics. Phys. Today 2018, 71, 40–46. [Google Scholar] [CrossRef]
- Sobkowicz, P. Social simulation models at the ethical crossroads. Sci. Eng. Ethics 2019, 25, 143–157. [Google Scholar] [CrossRef] [PubMed]
- Jusup, M.; Holme, P.; Kanazawa, K.; Takayasu, M.; Romić, I.; Wang, Z.; Geček, S.; Lipić, T.; Podobnik, B.; Wang, L.; et al. Social physics. Phys. Rep. 2022, 948, 1–148. [Google Scholar] [CrossRef]
- Galam, S.; Chopard, B.; Masselot, A.; Droz, M. Competing species dynamics: Qualitative advantage versus geography. Eur. Phys. J. B 1998, 4, 529–531. [Google Scholar] [CrossRef]
- Galam, S. Application of statistical physics to politics. Phys. A Stat. Mech. Its Appl. 1999, 274, 132–139. [Google Scholar] [CrossRef]
- Chopard, B.; Droz, M.; Galam, S. An evolution theory in finite size systems. Eur. Phys. J. B 2000, 16, 575–578. [Google Scholar] [CrossRef]
- Galam, S. Minority opinion spreading in random geometry. Eur. Phys. J. B 2002, 25, 403–406. [Google Scholar] [CrossRef]
- Galam, S.; Chopard, B.; Droz, M. Killer geometries in competing species dynamics. Physica A 2002, 314, 256–263. [Google Scholar] [CrossRef]
- Galam, S. Modelling rumors: The no plane Pentagon French hoax case. Physica A 2003, 320, 571–580. [Google Scholar] [CrossRef]
- Galam, S. Contrarian deterministic effects on opinion dynamics: ‘The hung elections scenario’. Physica A 2004, 333, 453–460. [Google Scholar] [CrossRef]
- Galam, S. The dynamics of minority opinions in democratic debate. Physica A 2004, 336, 56–62. [Google Scholar] [CrossRef]
- Galam, S.; Vignes, A. Fashion, novelty and optimality: An application from Physics. Physica A 2005, 351, 605–619. [Google Scholar] [CrossRef]
- Gekle, S.; Peliti, L.; Galam, S. Opinion dynamics in a three-choice system. Eur. Phys. J. B 2005, 45, 569–575. [Google Scholar] [CrossRef]
- Galam, S. Heterogeneous beliefs, segregation, and extremism in the making of public opinions. Phys. Rev. E 2005, 71, 046123. [Google Scholar] [CrossRef]
- Borghesi, C.; Galam, S. Chaotic, staggered, and polarized dynamics in opinion forming: The contrarian effect. Phys. Rev. E 2006, 73, 066118. [Google Scholar] [CrossRef]
- Galam, S. From 2000 Bush–Gore to 2006 Italian elections: Voting at fifty-fifty and the contrarian effect. Qual. Quant. 2007, 41, 579–589. [Google Scholar] [CrossRef]
- Galam, S.; Jacobs, F. The role of inflexible minorities in the breaking of democratic opinion dynamics. Physica A 2007, 381, 366–376. [Google Scholar] [CrossRef]
- Galam, S. Sociophysics: A review of Galam models. Int. J. Mod. Phys. C 2008, 19, 409–440. [Google Scholar] [CrossRef]
- Chen, P.; Redner, S. Majority rule dynamics in finite dimensions. Phys. Rev. E 2005, 71, 036101. [Google Scholar] [CrossRef]
- Oliveira, L.S.; Rodrigues, A.C.; Forgerini, F.L. Reputation in Majority Rule Model leading to democratic states. J. Phys. Conf. Ser. 2019, 1391, 012042. [Google Scholar] [CrossRef]
- Holley, R.A.; Liggett, T.M. Ergodic theorems for weakly interacting infinite systems and voter model. Ann. Probab. 1975, 3, 643–663. [Google Scholar] [CrossRef]
- Lima, F.W.S.; Malarz, K. Majority-vote model on (3,4,6,4) and (34,6) Archimedean lattices. Int. J. Mod. Phys. C 2006, 17, 1273–1283. [Google Scholar] [CrossRef]
- Lambiotte, R.; Redner, S. Dynamics of vacillating voters. J. Stat. Mech. Theory Exp. 2007, 2007, L10001. [Google Scholar] [CrossRef]
- Fernandez-Gracia, J.; Suchecki, K.; Ramasco, J.J.; San Miguel, M.; Eguiluz, V.M. Is the voter model a model for voters? Phys. Rev. Lett. 2014, 112, 158701. [Google Scholar] [CrossRef] [PubMed]
- Sznajd-Weron, K.; Sznajd, J. Opinion evolution in closed community. Int. J. Mod. Phys. C 2000, 11, 1157–1165. [Google Scholar] [CrossRef]
- Sznajd-Weron, K. Sznajd model and its applications. Acta Phys. Pol. B 2005, 36, 2537–2547. Available online: https://www.actaphys.uj.edu.pl/fulltext?series=Reg&vol=36&page=2537 (accessed on 13 October 2023).
- Sznajd-Weron, K.; Sznajd, J. Who is left, who is right? Physica A 2005, 351, 593–604. [Google Scholar] [CrossRef]
- Malarz, K.; Kułakowski, K. The Sznajd dynamics on a directed clustered network. Acta Phys. Pol. A 2008, 114, 581–588. [Google Scholar] [CrossRef]
- Sznajd-Weron, K.; Sznajd, J.; Weron, T. A review on the Sznajd model—20 years after. Physica A 2021, 565, 125537. [Google Scholar] [CrossRef]
- Malarz, K.; Kułakowski, K. Indifferents as an interface between Contra and Pro. Acta Phys. Pol. A 2010, 117, 695–699. [Google Scholar] [CrossRef]
- Öztürk, M.K. Dynamics of discrete opinions without compromise. Adv. Complex Syst. 2013, 16, 1350010. [Google Scholar] [CrossRef]
- Bańcerowski, P.; Malarz, K. Multi-choice opinion dynamics model based on Latané theory. Eur. Phys. J. B 2019, 92, 219. [Google Scholar] [CrossRef]
- Kowalska-Styczeń, A.; Malarz, K. Noise induced unanimity and disorder in opinion formation. PLoS ONE 2020, 15, e0235313. [Google Scholar] [CrossRef]
- Dworak, M.; Malarz, K. Vanishing opinions in Latané model of opinion formation. Entropy 2023, 25, 58. [Google Scholar] [CrossRef] [PubMed]
- Martins, A.C.R. Discrete opinion dynamics with M choices. Eur. Phys. J. B 2020, 93, 1. [Google Scholar] [CrossRef]
- Zubillaga, B.; Vilela, A.; Wang, M.; Du, R.; Dong, G.; Stanley, H. Three-state majority-vote model on small-world networks. Sci. Rep. 2022, 12, 282. [Google Scholar] [CrossRef]
- Li, L.; Zeng, A.; Fan, Y.; Di, Z. Modeling multi-opinion propagation in complex systems with heterogeneous relationships via Potts model on signed networks. Chaos 2022, 32, 083101. [Google Scholar] [CrossRef]
- Doniec, M.; Lipiecki, A.; Sznajd-Weron, K. Consensus, polarization and hysteresis in the three-state noisy q-voter model with bounded confidence. Entropy 2022, 24, 983. [Google Scholar] [CrossRef]
- Xiong, F.; Liu, Y.; Wang, L.; Wang, X. Analysis and application of opinion model with multiple topic interactions. Chaos 2017, 27, 083113. [Google Scholar] [CrossRef] [PubMed]
- Galam, S. The drastic outcomes from voting alliances in three-party democratic voting (1990–2013). J. Stat. Phys. 2013, 151, 46–68. [Google Scholar] [CrossRef]
- Wu, D.; Szeto, K.Y. Analysis of timescale to consensus in voting dynamics with more than two options. Phys. Rev. E 2018, 97, 042320. [Google Scholar] [CrossRef]
- Mobilia, M. Polarization and consensus in a voter model under time-fluctuating influences. Physics 2023, 5, 517–536. [Google Scholar] [CrossRef]
- Nowak, A.; Szamrej, J.; Latané, B. From private attitude to public opinion: A dynamic theory of social impact. Psychol. Rev. 1990, 97, 362–376. [Google Scholar] [CrossRef]
- Darley, J.M.; Latané, B. Bystander intervention in emergencies—Diffusion of responsibility. J. Personal. Soc. Psychol. 1968, 8, 377–383. [Google Scholar] [CrossRef] [PubMed]
- Latané, B.; Harkins, S. Cross-modality matches suggest anticipated stage fright a multiplicative power function of audience size and status. Percept. Psychophys. 1976, 20, 482–488. [Google Scholar] [CrossRef]
- Latané, B. The psychology of social impact. Am. Psychol. 1981, 36, 343–356. [Google Scholar] [CrossRef]
- Kacperski, K.; Hołyst, J.A. Phase transitions as a persistent feature of groups with leaders in models of opinion formation. Physica A 2000, 287, 631–643. [Google Scholar] [CrossRef]
- Hołyst, J.A.; Kacperski, K.; Schweitzer, F. Phase transitions in social impact models of opinion formation. Physica A 2000, 285, 199–210. [Google Scholar] [CrossRef]
- Hołyst, J.A.; Kacperski, K.; Schweitzer, F. Social impact models of opinion dynamics. In Proceedings of the Annual Reviews of Computational Physics IX; Stauffer, D., Ed.; World Scientific: Singapore, 2011; pp. 253–273. [Google Scholar] [CrossRef]
- Asch, S.E. Studies of independence and conformity: I. A minority of one against a unanimous majority. Psychol. Monogr. 1956, 70, 1–70. [Google Scholar] [CrossRef]
- Bandura, A. Social Learning Theory; General Learning Press: New York, NY, USA, 1971; Available online: https://archive.org/details/BanduraSocialLearningTheory/ (accessed on 13 October 2023).
- Milgram, S. Obedience to Authority: An Experimental View; Harper & Row, Publishers: New York, NY, USA, 1974; Available online: https://archive.org/details/obediencetoautho0000milg/ (accessed on 13 October 2023).
- Cialdini, R.B. Influence: The Psychology of Persuation; HarperCollins e-books: New York, NY, USA, 1983; Available online: https://archive.org/details/influence_202107/ (accessed on 13 October 2023).
- Abelson, R.P.; Aronson, E.; McGuire, W.J.; Newcomb, T.M.; Rosenberg, M.J.; Tannenbaum, P.H. (Eds.) Theories of Cognitive Consistency: A Sourcebook; Rand McNally and Company: Chicago, IL, USA, 1968; Available online: https://archive.org/details/theoriesofcognit0000unse_m8y1/ (accessed on 13 October 2023).
- Fesinger, L. A Theory of Cognitive Dissonance; Stanford University Press: Stanford, CA, USA, 1968; Available online: https://archive.org/details/FestingerLeonATheoryOfCognitiveDissonance1968StanfordUniversityPress/ (accessed on 13 October 2023).
- Bahr, D.B.; Passerini, E. Statistical mechanics of opinion formation and collective behavior: Micro-sociology. J. Math. Sociol. 1998, 23, 1–27. [Google Scholar] [CrossRef]
- Bahr, D.B.; Passerini, E. Statistical mechanics of collective behavior: Macro-sociology. J. Math. Sociol. 1998, 23, 29–49. [Google Scholar] [CrossRef]
- Hoshen, J.; Kopelman, R. Percolation and cluster distribution. 1. Cluster multiple labeling technique and critical concentration algorithm. Phys. Rev. B 1976, 14, 3438–3445. [Google Scholar] [CrossRef]
- Landau, D.P.; Binder, K. A Guide to Monte Carlo Simulations in Statistical Physics; Cambridge University Press: New York, NY, USA, 2009. [Google Scholar] [CrossRef]
- Frijters, S.; Krüger, T.; Harting, J. Parallelised Hoshen–Kopelman algorithm for lattice-Boltzmann simulations. Comput. Phys. Commun. 2015, 189, 92–98. [Google Scholar] [CrossRef]
- Kotwica, M.; Gronek, P.; Malarz, K. Efficient space virtualisation for Hoshen–Kopelman algorithm. Int. J. Mod. Phys. C 2019, 30, 1950055. [Google Scholar] [CrossRef]
- Muller, H. Some genetic aspects of sex. Am. Nat. 1932, 66, 118–138. [Google Scholar] [CrossRef]
- Malarz, K.; Tiggemann, D. Dynamics in Eigen quasispecies model. Int. J. Mod. Phys. C 1998, 9, 481–490. [Google Scholar] [CrossRef]
- Lin, N. Social Capital: A Theory of Social Structure and Action; Cambridge University Press: Cambridge, UK, 2001. [Google Scholar] [CrossRef]
- Lin, N. Building a network theory of social capital. Connections 1999, 22, 28–51. Available online: https://faculty.washington.edu/matsueda/courses/590/Readings/ (accessed on 13 October 2023).
- Valori, L.; Picciolo, F.; Allansdottir, A.; Garlaschelli, D. Reconciling long-term cultural diversity and short-term collective social behavior. Proc. Natl. Acad. Sci. USA 2012, 109, 1068–1073. [Google Scholar] [CrossRef]
- Katz, E.; Lazarsfeld, P.F. Personal Influence: The Part Played by People in the Flow of Mass Communications; The Free Press/Mcmillan Publishers Co., Inc.: New York, NY, USA, 1955; Available online: https://archive.org/details/personalinfluenc0000katz/ (accessed on 13 October 2023).
- Bineham, J.L. A historical account of the hypodermic model in mass communication. Commun. Monogr. 1988, 55, 230–246. [Google Scholar] [CrossRef]
- Putnam, R.D. Bowling alone: The collapse and revival of American community. In CSCW’00: Proceedings of the 2000 ACM Conference on Computer Supported Cooperative Work, Philadelphia, PA, USA, 2–6 December 2000; Kellog, W., Whittaker, S., Eds.; Association for Computing Machinery: New York, NY, USA, 2000; p. 357. [Google Scholar] [CrossRef]
- Burt, R.S. Social contagion and innovation: Cohesion versus structural equivalence. Am. J. Sociol. 1987, 92, 1287–1335. [Google Scholar] [CrossRef]
- Burt, R.S. The social capital of opinion leaders. Ann. Am. Acad. Polit. Soc. Sci. 1999, 566, 37–54. [Google Scholar] [CrossRef]
- Mavridis, C.; Tsakas, N. Social capital, communication channels and opinion formation. Soc. Choice Welf. 2021, 56, 635–678. [Google Scholar] [CrossRef]
- Iijima, R.; Kamada, Y. Social distance and network structures. Theor. Econ. 2017, 12, 655–689. [Google Scholar] [CrossRef]
- Malarz, K.; Galam, S. Square-lattice site percolation at increasing ranges of neighbor bonds. Phys. Rev. E 2005, 71, 016125. [Google Scholar] [CrossRef] [PubMed]
- Galam, S.; Malarz, K. Restoring site percolation on damaged square lattices. Phys. Rev. E 2005, 72, 027103. [Google Scholar] [CrossRef]
Disclaimer/Publisher’s Note: The statements, opinions and data contained in all publications are solely those of the individual author(s) and contributor(s) and not of MDPI and/or the editor(s). MDPI and/or the editor(s) disclaim responsibility for any injury to people or property resulting from any ideas, methods, instructions or products referred to in the content. |
© 2023 by the authors. Licensee MDPI, Basel, Switzerland. This article is an open access article distributed under the terms and conditions of the Creative Commons Attribution (CC BY) license (https://creativecommons.org/licenses/by/4.0/).