Abstract
Effective mitigation of geotechnical risk and safety management of underground mine requires accurate estimation of rockburst damage potential. The inherent complexity of the rockburst phenomena due to nonlinear, high dimensional, and interdependent nature of the geological factors involved, however, makes predictive modeling a difficult task. The proposed research is based on the use of the K-Nearest Neighbor (KNN) algorithm to predict the risk of rockbursts with the use of microseismic monitoring data. Several key features like the ratio of total maximum principal stress to uniaxial compressive strength, energy capacity of support system, excavation span, geology factor, Richter magnitude of seismic event, distance between rockburst location and microseismic event, and rock density were applied as input parameters to extract critical rockburst precursor activities. In the test stage, the proposed KNN model recorded an accuracy of 75.50%, a precision of 91.3, a recall value of 50.9, and F1 Score of 57.6. The model is reliable with a significant performance indicating its efficacy in practice. The KNN model showed better classification results as compared to recently available models in literature and provided better generalization and interpretability. The model exhibited high prediction in classified low-risk incidents and had strong indicative capabilities towards high-risk situations, attributed to being a useful tool in rockburst hazard measurement.
1. Introduction
The effective mitigation of geotechnical risks and safe operation of the underground mining systems require accurate assessments and evaluation of the possible causes of rockburst damage. The fact that rockburst events are extremely complex due to their nonlinear effects, multi-dimensional parameters, and interrelationships between geological and stress-related variables makes predictive modeling especially harsh. Rockburst is a violent shock release of the elastic energy accumulated in both rock and coal masses that occurs during underground workings. This leads to the ejection of rock fragments, which might bring injuries, collapse, and deformation accordingly to the supporting structures along with the damage of the facilities [1,2,3]. Similar activity exists in open cuts in the bulk of the joint rock [4,5]. Its economic implications are significant in both areas of civil and mining engineering. The mechanism is not still imagined very well due to the complexity and uncertainty of rockburst. It may be necessary to estimate the realistic potential of rockburst in order to reduce the risks associated with rockburst, including damage to equipment, closure of accesses, delays, and loss of lives and property to facilitate the safety of people and effective construction and service consent of underground projects. Traditional approaches based on mechanics do not allow accurate identification of the risk of rockbursts because the connection between geological, geometric, and mechanical parameters of rock masses in underground conditions is very complex. Also, mechanics-based approaches possess multiple assumptions that, in case ignored, can result in biased predictions of a model. This has compelled many researchers over the past few decades to explore other ways through which they can improve the prediction of hazards and the detection of rockburst event. A number of indicators were proposed in order to judge burst potential by several researchers.
Depending on the variance between the location of the rock damage and place of the seismic occurrence, rockbursts may be categorized as self-induced rockburst and remotely induced rockburst [6]. In the case of the former, the damage and seismic event location are coherent. In the case of the latter, rockburst is induced by distant and comparatively high-level magnitude earthquake. In the case of various types of rockburst, influencing factors are different, and that is why the evaluation of the rockburst damage potential is also dissimilar. This paper will evaluate the damage potential of remotely induced rockburst. Owing to the fact that the place of the damage does not correspond to the place of the microseismic event, it is not easy to assess the potential damage only based on the microseismic event. The information of the microseismic events, the paths of the stress waves, and the conditions of the rock mass on the face of the excavation must be taken into consideration at the same time. The assessment of the potential damage caused by rockbursts remains a challenging problem since there are intricate processes and many factors that can influence the process.
In recent years, data mining methods have been demonstrated to be effective when obtaining complex non-linear dependences between predictor and response variables [7,8,9,10,11,12,13,14,15,16,17,18] and can be applied in the determination of sites at risk of rockburst incidents since the case history data is becoming more prevalent. Several researchers have recommended a number of methods which can be used to predict the rockburst, such as Support Vector Machine (SVM) [19], Artificial Neural Networks (ANNs) [20], Distance Discriminant Analysis (DDA) [21], Bayes Discriminant Analysis (BDA) [22], and Fisher Linear Discriminant Analysis (LDA) [23]; moreover, some systems are based upon hybrid (Zhou et al. [24]; Adoko et al. [25]; Liu et al. [26]) or ensemble (Ge and Feng [27]; Dong et al. [28]) learning methods in long-term prediction of rockburst, and their prediction accuracies are compared. Zhao and Chen [29] in a recent study compared and developed a data-driven model with the help of a convolutional neural network (CNN) to that of a conventional neural network. The proposed CNN model will be of high potential over the conventional neural network in rockburst prediction. These algorithms were fed with several rockburst indicators as input, and the training samples of different sizes were fed. Most or rather all the above techniques have been successful in forecasting rockburst risk, but there are faults in them. In such a way, e.g., in the ANN approach, the optimal structure (number of inputs, hidden layers, and transfer functions) has to be defined beforehand. This is normally done through the trial and error process. Another major limitation of ANN model is the black box nature of the model, not to mention that the relationship between input and output parameters of the system is expressed in terms of the weight matrix and biases, the latter not being accessible to the user [30]. The K-Nearest Neighbor (KNN) algorithm was chosen in this research because it is effective in dealing with complex, non-linear, and locally structured data pertaining to microseismic data. Since it is a non-parametric approach, KNN lacks distribution assumptions and is used to classify new observations as similar to previous outcomes, which is why it is relevant to recognize patterns related to rockburst events. Nonetheless, the KNN provided more flexible and interpretable predictions in instances of small and imbalanced datasets, which have been seen to outperform various benchmark models, illustrating its applicability to the task of assessing rockburst risks.
The main objective of this research is to investigate the importance of microseismic data in the prediction of the risk of rockburst using KNN algorithm. The study offered a data-driven classification model based on microseismic predictors such as the ratio of total maximum principal stress to uniaxial compressive strength, the energy capacity of support system, excavation span, geology factor, Richter magnitude of seismic event, distance between rockburst location and microseismic event, and rock density to determine the potential rockburst risks. The predictive accuracy of the KNN model is measured and compared to similar methods in order to determine its efficiency. Finally, the research aims at improving early warning systems and risk mitigation approaches to underground rock engineering.
2. Data Collection and Analytics
As per the original article by Heal [31], the number of rockburst cases included in the study amounted to 254 and were obtained in 13 underground metal mines in Canada and Australia. The acquisition of these cases was dependent on the rock mass failure conditions resulting due to one microseismic event. The microseismic event and failure location data comprise 83 and 254, respectively, and are in this database. It shows that certain failure spots are associated with the same microseismic event. According to the degree of damage of the rock mass and support, the level of the degree of risk damage of rockburst was classified into five levels, namely, none (L1), low (L2), moderate (L3), high (L4), and strong (L5). These included L1 implying the rock mass exhibited no damage or small loss and the support was undamaged; L2 implying the rock mass was slightly damaged with less than 1 ton of rock displaced, support system was loaded consequently causing the meshes to become loose and plates to be deformed; L3 indicating 1 to 10 tons of rock was displaced and some bolts were broken; L4 indicating 10 to 100 tons of rock was displaced and the support system was significantly damaged; L5 indicating the rock mass displaced above 100 tons of rock. Since the investigation has not specified the location of damage in L1, its original database only had L2, L3, L4, and L5. The sample size at these levels was 116, 48, 63, and 27, respectively. The dataset is compiled from previously published studies and has undergone verification by several research groups. Consequently, no duplicate or conflicting samples were present for further cleaning. The original database contained nine parameters: the ratio of the total maximum principal stress to uniaxial compressive strength (I1), the energy capacity of the support system (I2), excavation span (I3), geology factor (I4), Richter magnitude of the seismic event (I5), distance between the rockburst location and the microseismic event (I6), peak particle velocity (I7), rock density (I8), and the types of supports (I9). Literature can be referred to the specific meaning of each indicator [31]. The significant effect on the evaluation results is associated with different indicator combinations. Heal [31] and Zhou et al. [32] selected I1, I2, I3, I4, and I7; and Li et al. [33] chose I1, I2, I3, I4, I5, I7, and I8. Since I7 was calculated by I5 and I6 with the use of an empirical formula and I9 was hard to be quantified, I1, I2, I3, I4, I5, I6, and I8 in this paper were used to assess the rockburst damage. From this dataset, it can be noted that duplicate sample data existed in the dataset, and some samples had the same indicator value but different rockburst damage levels. The duplicate samples were eliminated to enhance the accuracy of prediction. In the case of the samples that have the same value of an indicator but different levels, the samples with highest level were chosen, to be on the safe side. As a result, the sample size in the new dataset comprised 236 entries, the size of samples at L2, L3, L4, and L5 was 107, 45, 57, and 27, respectively. The ratio of the sample size in different levels was 4.0:1.7:2.1:1.0. It demonstrates that the distribution is rather uneven, which could influence the evaluation outcome.
Figure 1 shows the violin plots of the main parameters of input (I1 to I8) in terms of rockburst hazard assessment. The distributions indicate a balanced dataset with a large variation of geomechanical and seismic cases. Parameters like the ratio of the total maximum principal stress to underlying uniaxial compressive strength (I1), and excavation span (I3) have a wide range of distribution, especially at the high end, and this is useful in noticing high-risk cases. Energy capacity of the support system (I2) and density of rock (I8) display significant variation as well, so far as the dataset is able to portray the distinguishing characteristics of a wide range of support designs and geological materials. The geology factor (I4) and seismic magnitude (I5) are quite uniform, which facilitates the consistent site representation; distance to microseismic events (I6) is concentrated, but still informative. In general, these plots corroborate that the data is dense, varied, and well-organized—features that are desirable in making the data more effective in developing reliable and generalizable predictive rock burst hazard models.
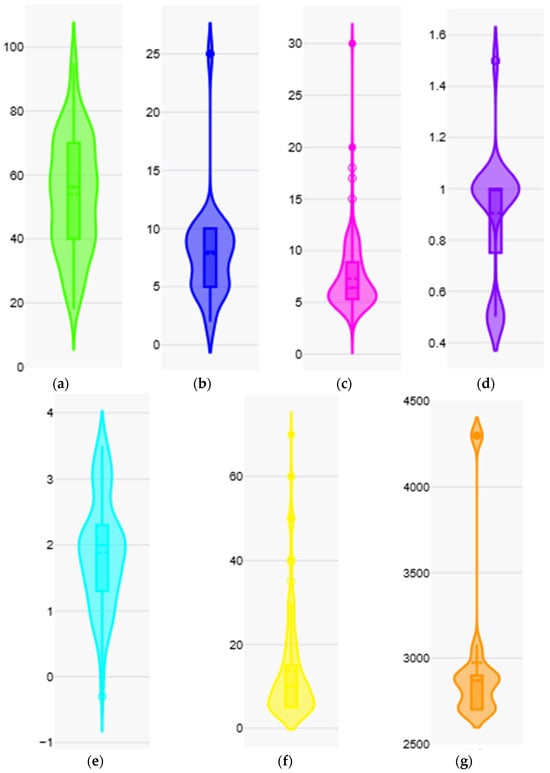
Figure 1.
Violin plots showing the distribution of input parameters used in rockburst hazard assessment: (a) I1, (b) I2, (c) I3, (d) I4, (e) I5, (f) I6, and (g) I8.
Sample data and a summary of the statistical features of important parameters affecting the rockburst hazard according to 236 recorded rockburst cases are presented in Table 1; the details are available in Appendix A. The ratio between the total-maximum stress principal and uniaxial compressional strength (I1) has an average of 53.90 and standard deviation of 17.80, which goes between 18 and 95. The mean of the energy capacity of the support system (I2) is 7.83 and is highly skewed to the positive direction (skewness = 2.38; kurtosis = 8.28) which is an indication of the existence of some support systems which have been devised to absorb high levels of energy in some situations. The excavation span (I3) is averagely 7.30 m, and some values are as high as 30 m; it has significant positive-skew (2.64) and a kurtosis of 13.64, representing a large number of high-capacity excavation work done in a high-risk environment. The geology factor (I4) and Richter magnitude of seismic events (I5) have relatively symmetric distributions, with a mean of 0.90 and 1.88, respectively, though the latter contains a minimum value of −0.3 that could be either a limit of measurement, or a modeling artifact. The range of the distance of the rockburst position and induced microseismic event (I6) is difficult to determine, as it varies considerably between 5 and 70 m (m) (mean = 13.73). Finally, the rock density (I8) varies between 2700 and 4300 kg/m3 with its average of 2974.53 kg/m3. All parameters exhibit acceptable levels of wide variability, which means that the dataset has sufficient coverage of both normal and extreme cases, and thus, makes it more suitable in the development of robust and generalizable predictive models that can be used in classification of rockburst hazard. The rating of the intensity of a rockburst was divided into four different levels, and the actual distribution of these levels within the data is depicted in Figure 2.

Table 1.
Representative data and statistical properties of the key factors affecting rockburst risks.
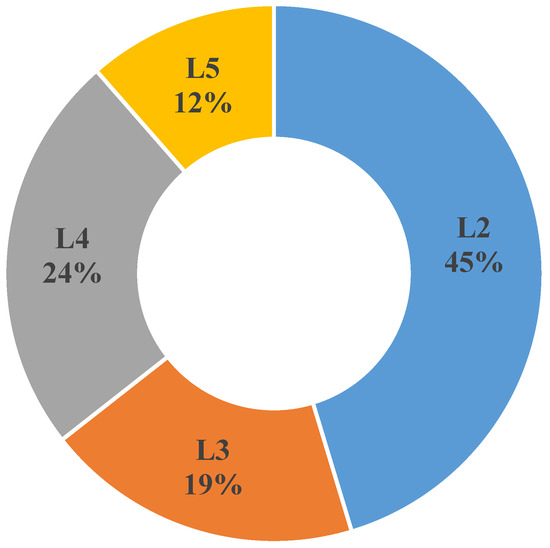
Figure 2.
The distribution of the actual intensity levels in rockbursts.
3. K-Nearest Neighbor (KNN)
The KNN algorithm is based on the distance of eigenvectors. Its principle of operation is that it identifies a set of k samples which are closest to the unknown samples in the dataset. Based on the k samples, the label of the unknown sample is executed by calculating the mean of the response variables [34,35]. There are two important parameters in the KNN classification algorithm: “n_ neighbors” and “weights” [36]. The value “n_neighbors” specifies the number of nearest neighbors to utilize in the learning process, that is, the k value; the parameter “weights” is utilized to determine the weight of neighbor samples of each sample. The prediction of possible values is realized with the help of the Weight function: The option uniform denotes the case when all nearest neighbor samples have an equal weight; distance takes place in cases when the weight and the distance are inversely proportional to one another [37]. KNN algorithm is a generalization of nearest neighbor rules. The label of the k-sample most similar to the nearest one is its inductive offset to the class label that will be tested. In contrast to the nearest neighbor, it is different because knowing the smallest neighbor, it enlargens to k during the decision-making process. This addition enables the KNN algorithm to acquire additional information and make use of it. It does not contain the learning processing process compared to other classification algorithms that have a given training process. Figure 3 displays the KNN classification diagram.
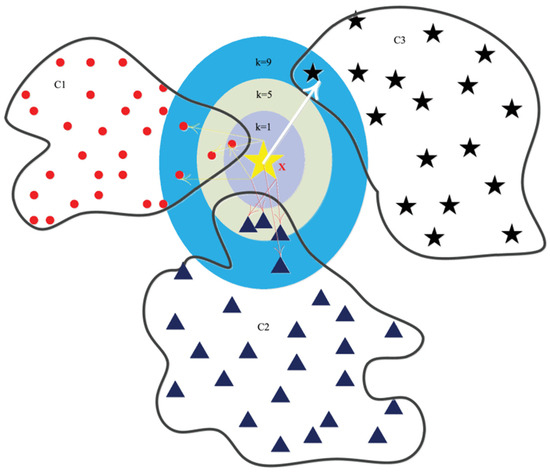
Figure 3.
Schematic diagram of KNN classification.
The nearest neighbor rule is the long-established form of class-reasoning. Its concept of decision-making is quite rudimentary, namely, the sample used as the test sample is the same as the sample category which is the nearest to it. Given that the training collection and the distance function remain in the same draw-off, the decision outcome of the nearest neighbor rule is always unique regardless of the instance that it will have to test. By taking all sample instances in set E, and letting y and x be such that y is the nearest neighbor instance to x, the category of y is the output that is the nearest neighbor rule. Suppose the specific decision process is that of an unknown category sample, X.
Then the decision result is .
In this case, the nearest neighbor rule is presented under two perspectives, convergence and generalization error. To test the same point again x, the nearest neighbor x′ obtained when two training sets comprising different samples are used is different. The classification result will depend on the nearest neighbor category label of the label set of the nearest neighbor, is thus obtained. It is the conditional error rate, and it depends on both x and x′. In this case, the mean of x′ is can be derived as follows:
The is a conditional probability density function. Suppose is a non-zero continuous function, then the probability that any point lies on the hyper-sphere centered S as x is
The likelihood that none of n samples is within the hypersphere is . In case , the probability approaches zero. One can conclude that when the nearest neighbor x′ becomes such that x converges towards the point x′ that is to be measured as per the probability, then tends to the Dirac delta function as the probability approaches infinity. In the same way, when the KNN decision rule is taken, then the k neighbors can converge to the point x to be measured. The probability that the point to be measured x is not the same as the category c of the nearest neighbor point is x′ is understood as the probability error rate of the nearest neighbor, and the error rate is
In this case, it is assumed that there is independence and equality of distribution of each sample. The Bayesian classifier can always be based upon a sample x lying in the d distance set of x so that
Now
The nearest neighbor rule is found not only simple, but also the general error rate of the rule is not more than twice the Bayesian error rate.
4. Performance Evaluation
When the multiclass classifications are considered, the metrics defined by binary classification are not applicable in the complete extent. A multiclass confusion matrix (see Figure 4) is N by N where N is the number of the different class labels C0, C1, …, CN. Thus, it cannot be used, as the True Positive (TP), True Negative (TN), False Positive (FP), and False Negative (FN) cases are not applicable. In its place, one can conduct an analysis of a particular class according to the characterization given in the example of Figure 4. To this end, a set of indicators can be developed against each of the classes. Further, based on a sufficient set of these metrics, one may provide the metrics of confusion matrix in aggregate. Table 2 gives a summary of the measures that are used to specify a multiclass confusion matrix and specifically accuracy, recall, precision, and F1 Score.
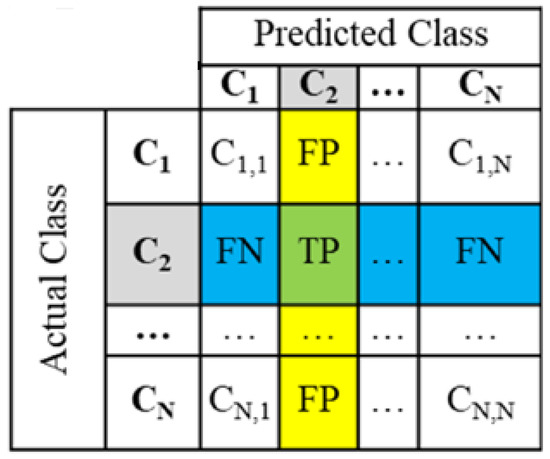
Figure 4.
Confusion matrix (N × N) for classification problem.
Table 2.
Performance metrics for a multiclass confusion matrix.
5. Results and Discussion
To enhance predictive performance, optimization of the KNN model was used, and the main hyperparameters were adjusted. The best configuration was the number of neighbors (n_neighbors) to be set to 4 with a uniform weighting scheme (weights = ‘uniform’), and to use the Mahalanobis distance metric that takes correlations between the features into consideration and scales the data. This distance measure provides a more-informed similarity measure, when features are well-suited to handling datasets with different feature scales or when there are inter-feature relationships. The model applied uniform weights along with considering feature covariance and treated all neighbors equally; thus, it was able to provide high accuracy and a successful trade-off between precision and recall. Mahalanobis distance was chosen because it accounts for inter-feature correlations and scale differences, which are present in the rockburst dataset, whereas Euclidean and Manhattan distances assume independent variables. Superior performance of these optimized hyperparameters had a considerable role in generating robustness and generalization of this model. In the process of training, the model showed exceptional results in the classification of rockburst hazard levels (see Table 3). It has demonstrated a high accuracy of 99.4% in the most frequent L2 class with a correct classification of 172 out of 173 samples, which reveals a successful learning process in the most common hazard level. Although the size of the sample used in L3, L4, and L5 was smaller, the model was still able to classify correctly some of the instances, such as 14.3% of L4 cases. The majority of the misclassification represented neighboring classes, which is natural since the difference between the levels of hazards is not so strong. The training phase performance of the KNN model is remarkable, providing a high classification accuracy of 93.0%, which means that it is highly predictive. The F1 Score (0.964), precision (0.935), and recall (0.994) are additional indications of the adept performance of the model in terms of accuracy and sensitivity, with close to perfect recognition of positive cases. These findings support the strength and validity of the model to learn using the training data.
Table 3.
Confusion matrix results for the KNN model during training and testing phases.
Analysis of the testing data indicates that the model performs well in identifying the most common and critical level of L2 hazards, with a perfect recall rate of 100% and a high value of precision of 72.7%. This implies that the model has a high probability of identifying conditions at low-risk of rockbursts and this is critical in efficient monitoring and timely response. In addition, there is high precision (100%) in the model when it comes to making predictions of higher-risk levels (L3, L4, L5), which means when it does show higher-risk levels, it is always right. The KNN model was very suitable in the testing stage, with the model achieving a high accuracy (75.5%) and very good precision (91.30) showing a reliable and stable model in terms of predictions. Although the recall (50.9%) shows improvement could be achieved in detecting every positive case, the overall F1 Score (57.6%) indicates a proper and balanced classification strategy, especially when there is need to have high level of confidence about predictions. The obtained results show the model is highly accurate in indicating safe conditions and multi-confident in signaling increase in hazard on the part projected, offering a robust tool that can help in the management of hazards of rockbursts. Table 4 presents the evaluation results of the various approaches. As it was observed, the KNN model turned out to be the most promising, as it yielded the largest overall accuracy rate of 75.5%. It also had balanced F1 Scores across the four classes: [0.842, 0.667, 0.400, 0.444]. On the other hand, the calculated performance of a grouping of Gaussian Process Classifiers (GPCs) used without prior training of the data during preprocessing stage produced an accuracy of mere 48.98% and F1 Score of 0.1818 at level L5 with a paltry, which underscores the deleterious effects of raw, imbalanced data on the performance of the model. With the GPC ensemble, preprocessing and sampling improved the performance (accuracy: 63.27%; F1 Scores: [0.7907, 0.6, 0.5455, 0.3077]), though it was not entirely accurate to capture all the hazard levels. Among the GPC-based configurations, some did not manage to predict the level L5 at all (F1 Score = 0), which indicates a lack of robustness. The KNN model was superior to all the others in accuracy alone, but also was consistent in its generalization between the majority and minority classes. Its capacity to provide relatively accurate predictions without any overfitting and minimal complex architecture of the ensemble illustrates its strengths and applicability to practical rockburst hazard classification training.
Table 4.
Comparison of results of evaluation in other literatures.
The values of precision, recall, and F1 Score at different levels were obtained as calculated in Table 2 and represented in Figure 5. As can be observed, the level L2 evaluation performance was the best and the level L5 the worst. The results show that the model performs best for L2 rockburst levels, with high recall and balanced precision, making it reliable for lower-risk detection. However, for L3–L5, especially the high and extreme risk levels (L4–L5), the model is overly conservative: precision is high, but recall is very low, meaning many dangerous rockburst events are missed. This imbalance leads to reduced F1 scores and poses a serious safety concern, as recall is more critical than precision for high-severity rockburst prediction. The order of the evaluation performance of the various levels after all the values of precision, recall, and F1 Score were put into consideration was L2 > L3 > L4 > L5.
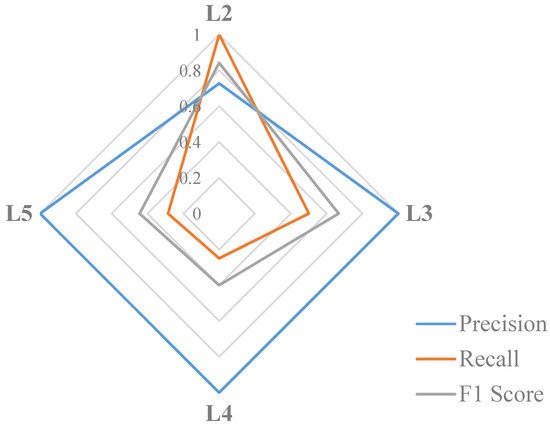
Figure 5.
Radar plot depicts the performance of the classification model with regards to precision, recall, and F1 Score in terms of different rockburst hazard levels.
6. Engineering Application
The rockburst damage within Perseverance nickel mine has been evaluated by means of the proposed methodology. Its orebody is situated in ultramafic rocks which are mined under a sub-level caving method of mining. The hanging wall is composed of stiff Felsic volcanics and metasediments and is prone to mining-tsunami. The microseismic monitoring system is deployed at this mine, and it can manage the risk of rockburst based on the microseismic information. Because most of the ramp and infrastructure is part of the hanging wall, it is essential to estimate the potential of rockburst damage. The Perseverance nickel mine was selected as the engineering verification case due to its complex geological conditions and well-documented rockburst history. At present, comparable engineering datasets from other mines are not publicly available; therefore, the inclusion of additional cases is not feasible.
Heal [31] recorded 12 cases of rockburst damages in this mine, with 6 microseisms cases at the depth of between 950–1100 m). The exact data was depicted in Table 5. Microseismic events of Richter magnitude were between 1.5–2.2, and the actual damages in rockbursts were L2 or L4. The proposed methodology was validated on twelve cases of different intensities of rockburst damages. As indicated in the final column of Table 5, it can be ascertained that the trained KNN model was able to predict the levels of rockburst damages in all twelve cases. To further examine how accurate the KNN model is, six events with twelve true cases of engineering projects were selected to be confirmed, nine of that being an L2 test case, one was L3 test cases and one was an L4 test case [31]. Table 5 shows the actual and the predicted classes of these twelve actual engineering cases. As per the findings of the evaluation shown in Table 5, the only cases not consistent with the actual scenario and correctness of the expectation of 75% are the three cases of the levels of rockburst damages caused by the microseismic events 2 and 6. Based on the KNN, the extent of the damage of the rockbursts, caused by a microseismic event 2 and 6, was not identified, and the accuracy is 66.67%. The results acquired in the evaluation of seven cases in the approach of Heal [31] did not match the real situation, and even the accuracy is only 41.67%. Likewise, four cases in the GPC approach [38] did not match the real situation, and the accuracy is 66.67%. Therefore, the methodology offered in the current study assisted in increasing the level of accuracy of rockburst, i.e., 75% damage to a certain degree.
Table 5.
Rockburst damage incidents at Perseverance nickel mine.
7. Conclusions and Future Prospect
To achieve the aim of this study, a KNN model was developed to classify the rockburst risk using microseismic data. The inputs to model the variables to frame the rockburst risk were set to the ratio of total maximum principal stress to uniaxial compressive strength (I1), energy capacity of support system (I2), excavation span (I3), geology factor (I4), Richter magnitude of seismic event (I5), distance between rockburst location and microseismic event (I6), and rock density (I8). The performance of the KNN model was measured by calculating accuracy, precision, recall, and F1 Score, as performance metrics in both stages, training, and testing. The KNN model performed well in the testing phase, achieving high accuracy (75.5%) and excellent precision (91.3), indicating reliable and consistent predictions. While the recall (50.9) suggests some room for improvement in identifying all positive cases, the overall F1 Score (57.6) confirms a balanced and effective classification approach, especially for practical applications requiring high confidence in predictions. These findings indicate that the model has a high potential of predicting the level of hazards precisely, hence providing a robust and technically effective tool to aid in rockburst hazard evaluation and management. The proposed model may be improved in future research mines with different geological settings and the inclusion of other input parameters, such as support types and peak particle velocity. The combination of these parameters with microseismic indicators can obtain a more detailed explanation of the rockburst mechanisms. In addition, the performance of KNN classification can be enhanced by implementing different hybrid algorithms (KNN-PSO, KNN-RF, or KNN-SVM, etc.) to enhance its performance, in particular, to demonstrate high accuracy on complex and imbalanced data.
Author Contributions
Conceptualization: M.A.; Methodology: Z.U., S.H. (Shay Haq), and F.A.; Data Curation: M.N.K.; Model Development and Analysis: M.A., F.A., and S.H. (Shay Haq); Visualization: R.C.O.; Validation: A.A., R.C.O., S.H. (Shay Haq), Z.U., S.H. (Sabahat Hussan), and M.N.K.; Writing—Original Draft: M.A.; Writing—Review & Editing: M.A., F.A., Z.U., S.H. (Sabahat Hussan), and M.N.K.; Supervision: R.C.O. and A.A. All authors have read and agreed to the published version of the manuscript.
Funding
This research received no external funding.
Data Availability Statement
The original contributions presented in this study are included in the article. Further inquiries can be directed to the corresponding authors.
Conflicts of Interest
Author Zia Ullah was employed by the company Broadridge Financial Solutions Inc. The remaining authors declare that the research was conducted in the absence of any commercial or financial relationships that could be construed as a potential conflict of interest.
Appendix A
Table A1.
Rockburst dataset used in KNN modeling.
Table A1.
Rockburst dataset used in KNN modeling.
| S. No. | I1 | I2 | I3 (m) | I4 | I5 | I6 (m) | I8 (kg/m3) | Level |
|---|---|---|---|---|---|---|---|---|
| 1 | 60 | 5 | 4.2 | 0.5 | 1.7 | 20 | 2700 | 4 |
| 2 | 60 | 8 | 4.2 | 0.5 | 1.7 | 25 | 2700 | 2 |
| 3 | 80 | 8 | 6 | 0.5 | 1.8 | 10 | 2700 | 4 |
| 4 | 80 | 5 | 6.2 | 1 | −0.3 | 5 | 2700 | 4 |
| 5 | 70 | 8 | 4 | 1 | 1.8 | 15 | 2700 | 2 |
| 6 | 40 | 5 | 3.8 | 1 | 0.4 | 5 | 2700 | 2 |
| 7 | 80 | 8 | 5.9 | 1 | 0.6 | 5 | 2700 | 2 |
| 8 | 90 | 8 | 6.8 | 1 | 0 | 5 | 2700 | 4 |
| 9 | 80 | 8 | 7 | 1 | 0 | 10 | 2700 | 2 |
| 10 | 80 | 8 | 7 | 1 | 2 | 5 | 2700 | 4 |
| 11 | 80 | 8 | 4.1 | 1 | 2 | 10 | 2700 | 4 |
| 12 | 70 | 8 | 9.5 | 1 | 2.2 | 5 | 2700 | 4 |
| 13 | 75 | 8 | 3.8 | 1 | 2.2 | 10 | 2700 | 3 |
| 14 | 75 | 8 | 4 | 1 | 2.2 | 10 | 2700 | 4 |
| 15 | 60 | 8 | 6.2 | 1 | 1.6 | 5 | 2700 | 2 |
| 16 | 60 | 10 | 10.5 | 0.5 | 1.6 | 5 | 2700 | 2 |
| 17 | 65 | 8 | 4.3 | 1 | 0.3 | 5 | 2700 | 2 |
| 18 | 60 | 5 | 5.6 | 0.5 | 1.5 | 5 | 2700 | 4 |
| 19 | 45 | 10 | 9.1 | 0.5 | 1.8 | 5 | 2700 | 5 |
| 20 | 43 | 5 | 9.3 | 0.5 | 1.8 | 5 | 2700 | 4 |
| 21 | 43 | 10 | 9.3 | 1 | 1.8 | 5 | 2700 | 2 |
| 22 | 43 | 10 | 9.4 | 0.5 | −0.2 | 5 | 2700 | 2 |
| 23 | 54 | 8 | 3.5 | 0.5 | 1.3 | 5 | 2700 | 2 |
| 24 | 45 | 8 | 3.6 | 1 | 1.3 | 10 | 2700 | 2 |
| 25 | 80 | 8 | 5.4 | 1 | 1.3 | 10 | 2700 | 2 |
| 26 | 50 | 8 | 7.8 | 1 | 1.3 | 15 | 2700 | 2 |
| 27 | 50 | 5 | 6.2 | 1 | 1 | 5 | 2700 | 3 |
| 28 | 50 | 5 | 5.1 | 0.5 | 1.2 | 5 | 2700 | 4 |
| 29 | 50 | 5 | 5.1 | 1 | 1.2 | 5 | 2700 | 2 |
| 30 | 50 | 8 | 8.3 | 1 | 0.7 | 5 | 2700 | 2 |
| 31 | 50 | 8 | 5.5 | 1 | 0.7 | 5 | 2700 | 2 |
| 32 | 60 | 10 | 8.8 | 1 | 2 | 5 | 2700 | 2 |
| 33 | 60 | 5 | 6.2 | 1 | 2 | 5 | 2700 | 2 |
| 34 | 60 | 5 | 5.2 | 1 | 2 | 5 | 2700 | 2 |
| 35 | 60 | 5 | 8.4 | 1 | 2 | 5 | 2700 | 2 |
| 36 | 60 | 5 | 6 | 1 | 2 | 5 | 2700 | 2 |
| 37 | 60 | 10 | 8.4 | 1 | 2 | 5 | 2700 | 2 |
| 38 | 60 | 5 | 5.3 | 1 | 2 | 5 | 2700 | 2 |
| 39 | 60 | 10 | 7 | 1 | 2 | 5 | 2700 | 2 |
| 40 | 60 | 10 | 5.4 | 0.5 | 2 | 5 | 2700 | 4 |
| 41 | 75 | 5 | 5.1 | 1 | 0.6 | 15 | 2700 | 3 |
| 42 | 70 | 5 | 5.1 | 1 | 0.6 | 10 | 2700 | 2 |
| 43 | 70 | 5 | 5.1 | 1 | 0.6 | 5 | 2700 | 3 |
| 44 | 75 | 5 | 5.2 | 1 | 1.3 | 10 | 2700 | 2 |
| 45 | 75 | 5 | 6.7 | 1 | 1.3 | 15 | 2700 | 2 |
| 46 | 75 | 5 | 5.1 | 1 | 1.3 | 20 | 2700 | 2 |
| 47 | 75 | 8 | 7 | 1 | 1.8 | 5 | 2700 | 3 |
| 48 | 75 | 8 | 5 | 1 | 1.8 | 10 | 2700 | 2 |
| 49 | 75 | 5 | 5.3 | 1 | 1.8 | 5 | 2700 | 3 |
| 50 | 35 | 2 | 5.3 | 1 | 3.1 | 15 | 2700 | 5 |
| 51 | 35 | 2 | 10.6 | 1 | 3.1 | 15 | 2700 | 5 |
| 52 | 35 | 10 | 10.6 | 1 | 3.1 | 20 | 2700 | 2 |
| 53 | 35 | 5 | 5.9 | 1.5 | 3.1 | 25 | 2700 | 4 |
| 54 | 35 | 2 | 10.6 | 1.5 | 3.1 | 25 | 2700 | 4 |
| 55 | 35 | 5 | 11.8 | 1.5 | 3.1 | 20 | 2700 | 2 |
| 56 | 35 | 5 | 10.6 | 0.5 | 3.1 | 25 | 2700 | 3 |
| 57 | 35 | 8 | 7.6 | 0.5 | 3.1 | 15 | 2700 | 4 |
| 58 | 41.7 | 5 | 7.6 | 1.5 | 3.1 | 15 | 2700 | 2 |
| 59 | 41.7 | 2 | 7 | 1 | 3.1 | 10 | 2700 | 4 |
| 60 | 35 | 10 | 10.6 | 0.5 | 3.1 | 15 | 2700 | 2 |
| 61 | 35 | 5 | 7 | 1 | 3.1 | 15 | 2700 | 4 |
| 62 | 40 | 2 | 14 | 1 | 2.8 | 15 | 2900 | 5 |
| 63 | 39 | 2 | 7 | 1 | 2.8 | 10 | 2900 | 4 |
| 64 | 39 | 2 | 6.5 | 1 | 2.8 | 50 | 2900 | 4 |
| 65 | 40 | 2 | 5.7 | 1 | 1.6 | 25 | 2900 | 3 |
| 66 | 42.86 | 2 | 6.4 | 1.5 | 1.6 | 20 | 2900 | 3 |
| 67 | 35.1 | 2 | 6.8 | 1.5 | 3.5 | 50 | 2900 | 2 |
| 68 | 38 | 10 | 9 | 0.5 | 3.5 | 10 | 2900 | 5 |
| 69 | 32.3 | 2 | 4.5 | 1.5 | 3.5 | 35 | 2900 | 3 |
| 70 | 43.7 | 8 | 7.7 | 0.5 | 3.5 | 20 | 2900 | 3 |
| 71 | 43.7 | 10 | 7 | 0.5 | 3.5 | 20 | 2900 | 3 |
| 72 | 43.7 | 2 | 4.2 | 1 | 3.5 | 15 | 2900 | 4 |
| 73 | 42.8 | 2 | 5 | 0.5 | 3.5 | 30 | 2900 | 5 |
| 74 | 42.8 | 10 | 10 | 0.5 | 3.5 | 30 | 2900 | 3 |
| 75 | 39.5 | 5 | 5 | 0.5 | 3.5 | 10 | 2900 | 4 |
| 76 | 44.4 | 10 | 15 | 1 | 3.5 | 15 | 2900 | 4 |
| 77 | 47.3 | 8 | 8.3 | 1 | 3.5 | 50 | 2900 | 3 |
| 78 | 47.3 | 8 | 5.5 | 1 | 3.5 | 50 | 2900 | 3 |
| 79 | 51.43 | 5 | 9.3 | 1.5 | 1.9 | 10 | 2900 | 3 |
| 80 | 39.4 | 5 | 9.5 | 1.5 | 2.1 | 15 | 2900 | 2 |
| 81 | 39.4 | 2 | 4.5 | 1 | 2.1 | 20 | 2900 | 3 |
| 82 | 39.4 | 10 | 11 | 1 | 2.1 | 25 | 2900 | 2 |
| 83 | 41.7 | 2 | 4.5 | 0.5 | 2.1 | 60 | 2900 | 3 |
| 84 | 40.8 | 10 | 10 | 0.5 | 2.1 | 30 | 2900 | 3 |
| 85 | 40.8 | 5 | 8 | 0.5 | 2.1 | 25 | 2900 | 3 |
| 86 | 44.1 | 5 | 18 | 1 | 2.1 | 50 | 2900 | 2 |
| 87 | 36 | 8 | 14 | 1 | 1.2 | 10 | 2900 | 2 |
| 88 | 36 | 8 | 6.5 | 0.5 | 1.2 | 15 | 2900 | 2 |
| 89 | 37.7 | 8 | 5.2 | 1 | 0.4 | 5 | 2900 | 3 |
| 90 | 40.8 | 8 | 4.2 | 1 | 1.8 | 5 | 2900 | 2 |
| 91 | 30 | 10 | 5.3 | 0.5 | 1.2 | 5 | 2800 | 3 |
| 92 | 30 | 8 | 5.4 | 0.5 | 1.2 | 5 | 2800 | 2 |
| 93 | 30 | 10 | 5.3 | 1 | 1.2 | 10 | 2800 | 2 |
| 94 | 30 | 10 | 5.2 | 1 | 1.2 | 10 | 2800 | 3 |
| 95 | 74 | 8 | 5.9 | 0.5 | 1.5 | 5 | 2800 | 5 |
| 96 | 74 | 8 | 5.3 | 1 | 1.5 | 10 | 2800 | 3 |
| 97 | 74 | 8 | 5.9 | 1 | 1.5 | 10 | 2800 | 2 |
| 98 | 74 | 8 | 6.5 | 1 | 1.5 | 20 | 2800 | 2 |
| 99 | 74 | 8 | 6.5 | 0.5 | 1.5 | 15 | 2800 | 4 |
| 100 | 71 | 8 | 8 | 1 | 0.9 | 5 | 2800 | 4 |
| 101 | 71 | 8 | 5.3 | 1 | 0.9 | 10 | 2800 | 2 |
| 102 | 71 | 10 | 8 | 1 | 0.9 | 10 | 2800 | 2 |
| 103 | 71 | 8 | 5.6 | 1 | 0.9 | 10 | 2800 | 2 |
| 104 | 71 | 10 | 20 | 0.5 | 2.1 | 5 | 2800 | 5 |
| 105 | 40 | 8 | 5.9 | 0.5 | 2.1 | 5 | 2700 | 4 |
| 106 | 40 | 8 | 5.3 | 0.5 | 2.1 | 5 | 2700 | 2 |
| 107 | 40 | 8 | 5.9 | 1 | 2.1 | 5 | 2700 | 2 |
| 108 | 40 | 8 | 6.5 | 1 | 2.1 | 10 | 2700 | 2 |
| 109 | 40 | 2 | 5.6 | 1 | 2.1 | 10 | 2700 | 4 |
| 110 | 40 | 2 | 5.8 | 1 | 2.1 | 5 | 2700 | 4 |
| 111 | 40 | 8 | 5.5 | 1 | 2.1 | 20 | 2700 | 2 |
| 112 | 70 | 5 | 8 | 1 | 0.8 | 5 | 2800 | 4 |
| 113 | 70 | 10 | 8 | 1 | 0.8 | 10 | 2800 | 2 |
| 114 | 70 | 10 | 5.5 | 1 | 0.8 | 10 | 2800 | 2 |
| 115 | 70 | 5 | 8 | 1 | 0.8 | 10 | 2800 | 4 |
| 116 | 70 | 8 | 5.1 | 1 | 0.8 | 10 | 2800 | 3 |
| 117 | 70 | 5 | 5.1 | 1 | 0.8 | 5 | 2800 | 2 |
| 118 | 70 | 5 | 5.1 | 1 | 0.8 | 10 | 2800 | 2 |
| 119 | 54 | 5 | 5.7 | 1 | 0.8 | 20 | 2700 | 2 |
| 120 | 54 | 10 | 9.1 | 0.5 | 0.8 | 25 | 2700 | 2 |
| 121 | 39 | 8 | 5.7 | 1 | 0.8 | 30 | 2800 | 2 |
| 122 | 84 | 5 | 7.7 | 1 | 2.9 | 10 | 2900 | 5 |
| 123 | 45 | 5 | 4.8 | 1 | 2.9 | 50 | 2900 | 2 |
| 124 | 84 | 10 | 7.4 | 1 | 2.9 | 50 | 2900 | 3 |
| 125 | 45 | 10 | 6.9 | 1 | 2.9 | 10 | 2900 | 2 |
| 126 | 45 | 5 | 7.4 | 1 | 2.9 | 10 | 2900 | 4 |
| 127 | 56 | 5 | 4.6 | 1 | 2.9 | 25 | 2900 | 2 |
| 128 | 18 | 5 | 5.8 | 0.5 | 0.4 | 10 | 3030 | 4 |
| 129 | 24 | 5 | 8.6 | 0.5 | 0.4 | 10 | 3030 | 3 |
| 130 | 95 | 10 | 6.9 | 1 | 1.5 | 5 | 2900 | 2 |
| 131 | 95 | 5 | 6.6 | 1 | 0.9 | 5 | 2900 | 5 |
| 132 | 45 | 10 | 5.1 | 1 | 1.6 | 5 | 2900 | 2 |
| 133 | 21 | 5 | 11.2 | 1.5 | 0.9 | 5 | 3030 | 2 |
| 134 | 21 | 5 | 6.1 | 1.5 | 0.9 | 5 | 3030 | 2 |
| 135 | 95 | 10 | 8 | 1 | 1.6 | 5 | 2900 | 5 |
| 136 | 39 | 10 | 5.3 | 1 | 1.6 | 15 | 2900 | 3 |
| 137 | 21 | 5 | 5.5 | 1 | 1.9 | 20 | 3030 | 3 |
| 138 | 24 | 5 | 8.7 | 0.5 | 1.5 | 10 | 3030 | 5 |
| 139 | 24 | 5 | 11 | 1 | 1.5 | 15 | 3030 | 2 |
| 140 | 67 | 10 | 5 | 1 | −0.2 | 5 | 2900 | 2 |
| 141 | 21 | 5 | 9 | 0.5 | 1.8 | 10 | 3030 | 4 |
| 142 | 21 | 10 | 9 | 1 | 1.8 | 10 | 3030 | 2 |
| 143 | 95 | 10 | 6.8 | 1 | 1 | 5 | 2900 | 4 |
| 144 | 73 | 25 | 6.8 | 1 | 1 | 5 | 2900 | 3 |
| 145 | 27 | 5 | 11.5 | 1 | 3.1 | 30 | 3030 | 4 |
| 146 | 27 | 5 | 7.6 | 1 | 3.1 | 40 | 3030 | 4 |
| 147 | 35 | 5 | 11.5 | 1 | 3.1 | 30 | 3030 | 4 |
| 148 | 50 | 25 | 4.5 | 1 | 3.1 | 40 | 2900 | 2 |
| 149 | 95 | 25 | 7.1 | 1 | 3.1 | 20 | 2900 | 2 |
| 150 | 73 | 25 | 4.7 | 1 | 3.1 | 30 | 2900 | 2 |
| 151 | 95 | 25 | 6.3 | 1 | 3.1 | 30 | 2900 | 2 |
| 152 | 73 | 25 | 4.4 | 1 | 3.1 | 40 | 2900 | 2 |
| 153 | 73 | 25 | 9.6 | 1 | 3.1 | 50 | 2900 | 2 |
| 154 | 54 | 25 | 4.8 | 1 | 3.1 | 60 | 2900 | 2 |
| 155 | 34 | 5 | 4.5 | 1 | 3.1 | 70 | 2900 | 3 |
| 156 | 25 | 10 | 11.6 | 0.5 | 1.4 | 5 | 3030 | 4 |
| 157 | 25 | 5 | 11.6 | 0.5 | 1.4 | 5 | 3030 | 4 |
| 158 | 24 | 5 | 12 | 1 | 2 | 5 | 3030 | 5 |
| 159 | 39 | 5 | 9 | 1 | 2 | 5 | 2900 | 4 |
| 160 | 25 | 5 | 5.1 | 1 | 1.3 | 5 | 3080 | 4 |
| 161 | 25 | 5 | 10.5 | 1 | 1.3 | 10 | 3080 | 3 |
| 162 | 25 | 5 | 7.8 | 1 | 1.3 | 10 | 3080 | 2 |
| 163 | 25.97 | 10 | 17 | 0.5 | 2 | 5 | 3080 | 5 |
| 164 | 25.97 | 8 | 6.2 | 0.5 | 2 | 10 | 3080 | 3 |
| 165 | 25.97 | 8 | 5.7 | 0.5 | 2 | 5 | 3080 | 4 |
| 166 | 25.97 | 5 | 5.4 | 1 | 2 | 10 | 3080 | 3 |
| 167 | 25.97 | 8 | 5.3 | 1 | 2 | 10 | 3080 | 2 |
| 168 | 25.97 | 8 | 5.6 | 0.5 | 2 | 5 | 3080 | 4 |
| 169 | 75 | 5 | 5.2 | 1 | 1.6 | 10 | 2800 | 5 |
| 170 | 75 | 5 | 5 | 1 | 1.6 | 5 | 2800 | 5 |
| 171 | 65 | 5 | 2 | 1 | 1.6 | 5 | 2800 | 2 |
| 172 | 50 | 5 | 9.1 | 1 | 1.4 | 5 | 2800 | 3 |
| 173 | 50 | 5 | 4.6 | 0.5 | 1.9 | 30 | 2800 | 3 |
| 174 | 70 | 8 | 5 | 0.5 | 1.6 | 5 | 4300 | 4 |
| 175 | 70 | 8 | 8 | 1 | 2 | 5 | 4300 | 4 |
| 176 | 70 | 8 | 6 | 0.5 | 2 | 5 | 4300 | 4 |
| 177 | 70 | 8 | 12 | 1 | 2 | 10 | 4300 | 3 |
| 178 | 67 | 10 | 11 | 0.5 | 2.5 | 15 | 4300 | 5 |
| 179 | 67 | 25 | 5 | 1 | 2.5 | 15 | 4300 | 2 |
| 180 | 67 | 5 | 5 | 1 | 2.5 | 15 | 4300 | 2 |
| 181 | 76 | 10 | 6 | 0.5 | 2.7 | 5 | 4300 | 5 |
| 182 | 40 | 10 | 9.2 | 0.5 | 1.1 | 5 | 4300 | 3 |
| 183 | 40 | 5 | 4.8 | 1 | 1.1 | 10 | 4300 | 2 |
| 184 | 40 | 10 | 11.7 | 0.5 | 2.5 | 5 | 4300 | 5 |
| 185 | 50 | 10 | 9 | 1 | 2.7 | 20 | 4300 | 4 |
| 186 | 50 | 5 | 6 | 1 | 2.1 | 5 | 4300 | 4 |
| 187 | 55 | 5 | 8 | 1 | 1.9 | 5 | 4300 | 5 |
| 188 | 55 | 5 | 6 | 1 | 2.3 | 5 | 4300 | 4 |
| 189 | 65 | 10 | 11 | 1 | 2.3 | 10 | 4300 | 4 |
| 190 | 55 | 5 | 6 | 0.5 | 0.9 | 5 | 4300 | 4 |
| 191 | 60 | 5 | 5.5 | 1 | 2.2 | 20 | 4300 | 4 |
| 192 | 50 | 5 | 5.5 | 0.5 | 1.4 | 5 | 4300 | 5 |
| 193 | 50 | 10 | 8.5 | 0.5 | 1.4 | 20 | 4300 | 2 |
| 194 | 50 | 10 | 5.5 | 0.5 | 1.4 | 40 | 4300 | 2 |
| 195 | 50 | 5 | 6 | 1 | 1.5 | 5 | 4300 | 3 |
| 196 | 50 | 10 | 30 | 1 | 1.7 | 5 | 4300 | 5 |
| 197 | 70 | 5 | 4.4 | 1.5 | 1.7 | 20 | 2700 | 2 |
| 198 | 70 | 10 | 4.6 | 0.5 | 2 | 5 | 2800 | 4 |
| 199 | 90 | 10 | 4.5 | 1.5 | 2 | 10 | 2850 | 2 |
| 200 | 70 | 5 | 5.2 | 1 | 2.1 | 5 | 2700 | 5 |
| 201 | 56.2 | 8 | 10 | 1 | 1 | 5 | 2870 | 4 |
| 202 | 56.2 | 10 | 10 | 1 | 1 | 10 | 2870 | 2 |
| 203 | 56.2 | 8 | 6 | 1 | 1 | 20 | 2870 | 2 |
| 204 | 57.8 | 8 | 6.1 | 1 | 1 | 5 | 2870 | 3 |
| 205 | 57.8 | 8 | 6.1 | 1.5 | 1 | 10 | 2870 | 3 |
| 206 | 57.8 | 8 | 6.5 | 1 | 1.5 | 5 | 2870 | 4 |
| 207 | 57.8 | 10 | 11.3 | 1 | 1.5 | 10 | 2870 | 2 |
| 208 | 57.8 | 10 | 6.5 | 1 | 1.5 | 10 | 2870 | 2 |
| 209 | 57 | 8 | 6.7 | 1 | 2.2 | 5 | 2870 | 4 |
| 210 | 57 | 10 | 9.5 | 1 | 2.2 | 5 | 2870 | 4 |
| 211 | 57 | 10 | 11.2 | 1 | 2.2 | 10 | 2870 | 2 |
| 212 | 57 | 8 | 6.4 | 1 | 2.2 | 25 | 2870 | 2 |
| 213 | 57 | 8 | 6.5 | 1 | 2.2 | 10 | 2870 | 2 |
| 214 | 57 | 10 | 11.5 | 0.5 | 1.7 | 5 | 2870 | 4 |
| 215 | 57 | 10 | 11 | 1 | 1.7 | 5 | 2870 | 2 |
| 216 | 57 | 10 | 11 | 1 | 1.7 | 10 | 2870 | 2 |
| 217 | 57 | 10 | 11.5 | 1 | 1.7 | 10 | 2870 | 2 |
| 218 | 57 | 10 | 7.4 | 1 | 1.7 | 15 | 2870 | 2 |
| 219 | 57.8 | 10 | 6.4 | 0.5 | 2.5 | 5 | 2870 | 5 |
| 220 | 57.8 | 10 | 11.2 | 0.5 | 2.5 | 5 | 2870 | 5 |
| 221 | 57.8 | 10 | 6.4 | 1 | 2.5 | 10 | 2870 | 2 |
| 222 | 57.8 | 10 | 10.6 | 1 | 2.5 | 10 | 2870 | 2 |
| 223 | 58.6 | 10 | 12.4 | 0.5 | 2.2 | 30 | 2870 | 2 |
| 224 | 58.6 | 10 | 5.9 | 1 | 2.2 | 30 | 2870 | 2 |
| 225 | 58.6 | 10 | 6.1 | 1 | 2.2 | 30 | 2870 | 2 |
| 226 | 59.3 | 8 | 8 | 1 | 2.2 | 5 | 2870 | 5 |
| 227 | 59.3 | 8 | 5.4 | 1 | 2.2 | 15 | 2870 | 3 |
| 228 | 59.3 | 8 | 10 | 1 | 2.2 | 10 | 2870 | 2 |
| 229 | 59.3 | 8 | 8 | 1 | 2.2 | 15 | 2870 | 3 |
| 230 | 59.3 | 8 | 8.4 | 1 | 2.2 | 15 | 2870 | 2 |
| 231 | 59.3 | 8 | 5 | 1 | 2.2 | 20 | 2870 | 2 |
| 232 | 70.3 | 10 | 6.9 | 0.5 | 2.3 | 5 | 2900 | 5 |
| 233 | 70.3 | 10 | 11 | 1 | 2.3 | 10 | 2900 | 2 |
| 234 | 70.3 | 10 | 5.5 | 1 | 2.3 | 15 | 2900 | 3 |
| 235 | 70.3 | 10 | 5.4 | 1 | 2.3 | 15 | 2900 | 2 |
| 236 | 72.2 | 8 | 4 | 1 | 1.6 | 5 | 2900 | 3 |
References
- Ortlepp, W.; Stacey, T. Rockburst mechanisms in tunnels and shafts. Tunn. Undergr. Space Technol. 1994, 9, 59–65. [Google Scholar] [CrossRef]
- Dou, L.; Chen, T.; Gong, S.; He, H.; Zhang, S. Rockburst hazard determination by using computed tomography technology in deep workface. Saf. Sci. 2012, 50, 736–740. [Google Scholar] [CrossRef]
- Cai, M. Principles of rock support in burst-prone ground. Tunn. Undergr. Space Technol. 2013, 36, 46–56. [Google Scholar] [CrossRef]
- Al-Shayea, N. Failure of Rock Anchors along the Road Cut Slopes of Dhila Decent Road, Saudi Arabia. In Proceedings of the International Conference on Problematic Soils (GEOPROB 2005), Famagusta, Cyprus, 25–27 May 2005; Eastern Mediterian University: Famagusta, Cyprus, 2005; Volume 3, pp. 1129–1136. [Google Scholar]
- Al-Shayea, N.A. Pullout Failure of Rock Anchor Rods at Slope Cuts, Dhila Decent Road, Saudi Arabia. In Proceedings of the 17th International Road Federation (IRF) World Meeting and Exhibition, Riyadh, Saudi Arabia, 10–14 November 2013. [Google Scholar]
- Kaiser, P.; McCreath, D.R.; Tannant, D.D. Canadian Rockburst Research Program 1990–1995; Camiro Mining Division: Sudbury, ON, Canada, 1997. [Google Scholar]
- Ahmad, M.; Tang, X.-W.; Qiu, J.-N.; Ahmad, F.; Gu, W.-J. Application of machine learning algorithms for the evaluation of seismic soil liquefaction potential. Front. Struct. Civ. Eng. 2021, 15, 490–505. [Google Scholar] [CrossRef]
- Ahmad, M.; Amjad, M.; Al-Mansob, R.A.; Kamiński, P.; Olczak, P.; Khan, B.J.; Alguno, A.C. Prediction of liquefaction-induced lateral displacements using Gaussian process regression. Appl. Sci. 2022, 12, 1977. [Google Scholar] [CrossRef]
- Ahmad, F.; Tang, X.-W.; Qiu, J.-N.; Wróblewski, P.; Ahmad, M.; Jamil, I. Prediction of slope stability using Tree Augmented Naive-Bayes classifier: Modeling and performance evaluation. Math. Biosci. Eng. 2022, 19, 4526–4546. [Google Scholar] [CrossRef]
- Ahmad, F.; Tang, X.-W.; Ahmad, M.; González-Lezcano, R.A.; Majdi, A.; Arbili, M.M. Stability risk assessment of slopes using logistic model tree based on updated case histories. Math. Biosci. Eng. 2023, 20, 21229–21245. [Google Scholar] [CrossRef] [PubMed]
- Ahmad, M.; Al Zubi, M.; Almujibah, H.; Sabri, M.M.S.; Mustafvi, J.B.; Haq, S.; Ouahbi, T.; Alzlfawi, A. Improved prediction of soil shear strength using machine learning algorithms: Interpretability analysis using SHapley Additive exPlanations. Front. Earth Sci. 2025, 13, 1542291. [Google Scholar] [CrossRef]
- Ahmad, M.; Al-Mansob, R.A.; Ramli, A.B.B.; Ahmad, F.; Khan, B.J. Unconfined compressive strength prediction of stabilized expansive clay soil using machine learning techniques. Multiscale Multidiscip. Model. Exp. Des. 2024, 7, 217–231. [Google Scholar] [CrossRef]
- Al-Zubi, M.A.; Ahmad, M.; Abdullah, S.; Khan, B.J.; Qamar, W.; Abdullah, G.M.S.; González-Lezcano, R.A.; Paul, S.; El-Gawaad, N.S.A.; Ouahbi, T. Long short term memory networks for predicting resilient Modulus of stabilized base material subject to wet-dry cycles. Sci. Rep. 2024, 14, 27928. [Google Scholar] [CrossRef]
- Ahmad, F.; Tang, X.; Ahmad, M. Predicting Rainfall-Induced Failure Potential of Highway Slopes: Taking Route T-18 in Taiwan as Case of Illustration. In Proceedings of the 1st International Conference of Climate Change and Emerging Trends in Civil Engineering, Topi, Pakistan, 12–13 February 2024. [Google Scholar]
- Ahmad, F.; Tang, X.; Hu, J.; Ahmad, M.; Gordan, B. Improved Prediction of Slope Stability under Static and Dynamic Conditions Using Tree-Based Models. CMES—Comput. Model. Eng. Sci. 2023, 1, 3. [Google Scholar] [CrossRef]
- Kamran, M.; Ullah, B.; Ahmad, M.; Sabri, M.M.S. Application of KNN-based isometric mapping and fuzzy c-means algorithm to predict short-term rockburst risk in deep underground projects. Front. Public Health 2022, 10, 1023890. [Google Scholar] [CrossRef] [PubMed]
- Ahmad, M.; Alsulami, B.T.; Hakamy, A.H.; Majdi, A.; Alqurashi, M.; Sabri, M. The Performance Comparison of the Decision Tree Models on the Prediction of Seismic Gravelly Soil Liquefaction Potential Based on Dynamic Penetration Test. Front. Earth Sci. 2023, 11, 1105610. [Google Scholar] [CrossRef]
- Ahmad, M.; Al-Zubi, M.A.; Kubińska-Jabcoń, E.; Majdi, A.; Al-Mansob, R.A.; Sabri, M.M.S.; Ali, E.; Naji, J.A.; Elnaggar, A.Y.; Zamin, B. Predicting California bearing ratio of HARHA-treated expansive soils using Gaussian process regression. Sci. Rep. 2023, 13, 13593. [Google Scholar] [CrossRef]
- Hong-Bo, Z. Classification of rockburst using support vector machine. Rock Soil Mech. 2005, 26, 642–644. [Google Scholar]
- Chen, D.; Feng, X.; Yang, C.; Chen, B.; Qiu, S.; Xu, D. Neural network estimation of rockburst damage severity based on engineering cases. In Proceedings of the ISRM SINOROCK 2013 (the 3rd ISRM Symposium on Rock Mechanics), Shanghai, China, 18–20 June 2013; pp. 457–463. [Google Scholar]
- Gong, F.; Li, X. A distance discriminant analysis method for prediction of possibility and classification of rockburst and its application. Chin. J. Rock Mech. Eng. 2007, 26, 1012–1018. [Google Scholar]
- Gong, F.; Li, X.; Zhang, W. Rockburst prediction of underground engineering based on Bayes discriminant analysis method. Rock Soil Mech. 2010, 31, 370–377. [Google Scholar]
- Zhou, J.; Shi, X.-Z.; Dong, L.; Hu, H.-Y.; Wang, H.-Y. Fisher discriminant analysis model and its application for prediction of classification of rockburst in deep-buried long tunnel. J. Coal Sci. Eng. (China) 2010, 16, 144–149. [Google Scholar] [CrossRef]
- Zhou, J.; Li, X.; Shi, X. Long-term prediction model of rockburst in underground openings using heuristic algorithms and support vector machines. Saf. Sci. 2012, 50, 629–644. [Google Scholar] [CrossRef]
- Adoko, A.C.; Gokceoglu, C.; Wu, L.; Zuo, Q.J. Knowledge-based and data-driven fuzzy modeling for rockburst prediction. Int. J. Rock Mech. Min. Sci. 2013, 61, 86–95. [Google Scholar] [CrossRef]
- Liu, Z.; Shao, J.; Xu, W.; Meng, Y. Prediction of rock burst classification using the technique of cloud models with attribution weight. Nat. Hazards 2013, 68, 549–568. [Google Scholar] [CrossRef]
- Ge, Q.; Feng, X. Classification and prediction of rockburst using AdaBoost combination learning method. Rock Soil Mech.-Wuhan 2008, 29, 943. [Google Scholar]
- Dong, L.-J.; Li, X.-B.; Kang, P. Prediction of rockburst classification using Random Forest. Trans. Nonferrous Met. Soc. China 2013, 23, 472–477. [Google Scholar] [CrossRef]
- Zhao, H.; Chen, B. Data-Driven Model for Rockburst Prediction. Math. Probl. Eng. 2020, 2020, 5735496. [Google Scholar] [CrossRef]
- Javadi, A.A.; Ahangar-Asr, A.; Johari, A.; Faramarzi, A.; Toll, D. Modelling stress–strain and volume change behaviour of unsaturated soils using an evolutionary based data mining technique, an incremental approach. Eng. Appl. Artif. Intell. 2012, 25, 926–933. [Google Scholar] [CrossRef]
- Heal, D. Observations and Analysis of Incidences of Rockburst Damage in Underground Mines. Ph.D. Thesis, The University of Western Australia, Perth, Australia, 2010. [Google Scholar]
- Zhou, J.; Shi, X.-Z.; Huang, R.-D.; Qiu, X.-Y.; Chen, C. Feasibility of stochastic gradient boosting approach for predicting rockburst damage in burst-prone mines. Trans. Nonferrous Met. Soc. China 2016, 26, 1938–1945. [Google Scholar] [CrossRef]
- Li, N.; Zare Naghadehi, M.Z.; Jimenez, R. Evaluating short-term rock burst damage in underground mines using a systems approach. Int. J. Min. Reclam. Environ. 2020, 34, 531–561. [Google Scholar] [CrossRef]
- Akbulut, Y.; Sengur, A.; Guo, Y.; Smarandache, F. NS-k-NN: Neutrosophic set-based k-nearest neighbors classifier. Symmetry 2017, 9, 179. [Google Scholar] [CrossRef]
- Wei, C.; Huang, J.; Mansaray, L.R.; Li, Z.; Liu, W.; Han, J. Estimation and mapping of winter oilseed rape LAI from high spatial resolution satellite data based on a hybrid method. Remote Sens. 2017, 9, 488. [Google Scholar] [CrossRef]
- France, S.L.; Carroll, J.D.; Xiong, H. Distance metrics for high dimensional nearest neighborhood recovery: Compression and normalization. Inf. Sci. 2012, 184, 92–110. [Google Scholar] [CrossRef]
- Yesilbudak, M.; Sagiroglu, S.; Colak, I. A new approach to very short term wind speed prediction using k-nearest neighbor classification. Energy Convers. Manag. 2013, 69, 77–86. [Google Scholar] [CrossRef]
- Chen, Y.; Da, Q.; Liang, W.; Xiao, P.; Dai, B.; Zhao, G. Bagged ensemble of gaussian process classifiers for assessing rockburst damage potential with an imbalanced dataset. Mathematics 2022, 10, 3382. [Google Scholar] [CrossRef]
Disclaimer/Publisher’s Note: The statements, opinions and data contained in all publications are solely those of the individual author(s) and contributor(s) and not of MDPI and/or the editor(s). MDPI and/or the editor(s) disclaim responsibility for any injury to people or property resulting from any ideas, methods, instructions or products referred to in the content. |
© 2026 by the authors. Licensee MDPI, Basel, Switzerland. This article is an open access article distributed under the terms and conditions of the Creative Commons Attribution (CC BY) license.