Abstract
In 2011, a M 5.7, earthquake struck near Mineral, Virginia, about 130 km southwest of Washington, D.C., prompting studies on paleoliquefaction to better understand the earthquake potential of the Central Virginia seismic zone and the hazard it poses to the Mid-Atlantic region. Researchers identified earthquake-induced liquefaction features along the Appomattox and Rapidan rivers, dated sediment and estimated the ages of these liquefaction features as well as features previously found along several other rivers in the seismic zone, and evaluated scenario earthquakes to constrain the locations and magnitudes of past earthquakes. Evidence suggests that historical earthquakes (M 5.25–5.5) in 1758, 1774, and 1875 C.E. caused liquefaction along the Appomattox, James, and Pamunkey Rivers, and a paleoearthquake (M 6.5–6.75) around 2640 ± 80 yr B.P. near Wyndham Forest caused liquefaction along the Appomattox River and across the seismic zone. Similarly, an earthquake (M 5.5–5.75) around 1690 ± 50 yr C.E. may have triggered liquefaction along the Rapidan River.
1. Background
The, moment magnitude, M, 5.7 Mineral, Virginia, earthquake occurred southwest of Washington, D.C. within an area of diffuse seismicity known as the Central Virginia seismic zone (CVSZ; Figure 1) [1,2]. The earthquake induced localized liquefaction and caused widespread damage in the epicentral area [3] and as far away as Washington, DC, USA [4]. The earthquake generated peak acceleration of 0.38 g recorded at the North Anna nuclear power station, 18 km northeast of the epicenter, triggering an automatic shutdown of the plant [5]. The event raised concerns about the earthquake potential of the seismic zone, leading to investigations of the source of the earthquake and the paleoearthquake history of the region.
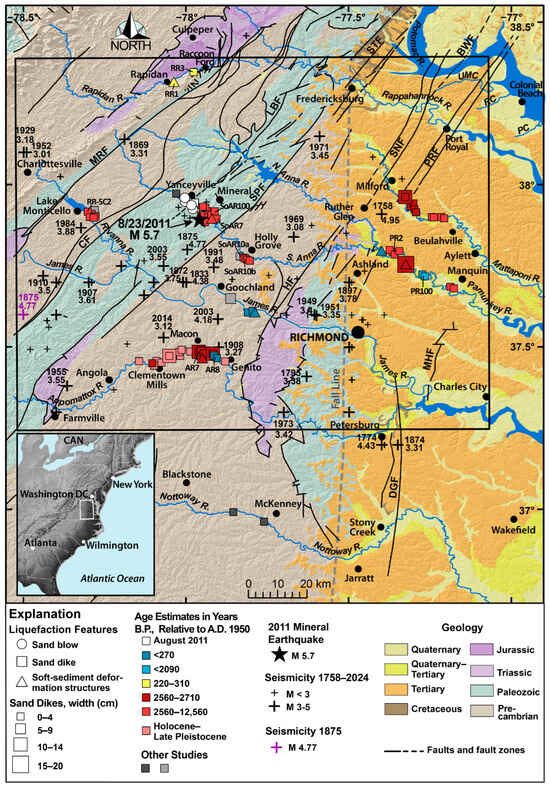
Figure 1.
Map showing 2011, M 5.7 earthquake [1] and seismicity [6,7,8,9] in CVSZ, liquefaction features that formed during 2011 mainshock and other features found during paleoliquefaction studies. Additional surveys for earthquake-induced liquefaction features were conducted along several rivers in the CVSZ. Dark gray squares represent features from [10,11] and light gray squares represent features from [12]. Inset shaded relief map shows location of study area (white rectangle) in Mid-Atlantic region of eastern United States. Geology is from [13,14] and faults from [14,15,16]: CF = Chopawamsic; DGF = Dutch Gap; HF = Hylas; LBF = Long Branch; MHF = Malvern Hill; MRF = Mountain Run; SNF = Skinkers Neck; SPF = Spotsylvania; PRF= Port Royal. The Fall Line is the boundary between Coastal Plain sedimentary rocks to the east and Piedmont crystalline rocks to the west. Large black rectangle outlines the area shown on Figure A1 in Appendix A on which study sites are labeled.
As the result of the 2011 Mineral earthquake and subsequent studies, the CVSZ was recognized as a significant earthquake source and added to the 2023 National seismic hazard model (NSHM) for the Central and Eastern U.S. and Southeast Canada [17]. Subsequent studies identified a likely source area of the Mineral earthquake 6–8 km below the surface [1] and a blind reverse fault, named the Quail fault, as the possible source of the earthquake [4]. Geomorphic features associated with this fault zone include deformation and uplift of river terraces and changes in sinuosity of the South Anna River [18,19]. Liquefaction features found in the CVSZ were interpreted to record one or two historical earthquakes in the M 5–5.75 range and one or two paleoearthquakes in the M 6–6.75 range, with preference given to one M 6.25–6.5 event near Holly Grove [20]. In the 2023 NSHM, liquefaction data was used to delineate a large regional fault-zone polygon for the CVSZ, to place an upper limit of M 6.5 on the magnitude distribution, and to define a recurrence interval range of 429–7692 for large earthquakes [21,22].
Paleoliquefaction studies have been ongoing in the CVSZ and include additional searches for features along rivers to better define areas of liquefaction, additional dating of host sediment of features to further constrain event timing, and liquefaction potential analysis of additional scenario earthquakes to further interpret locations and magnitudes of past earthquakes (Figure 2). This paper presents the results of these recent paleoliquefaction studies and updates the interpretation of the earthquake potential of the CVSZ. These findings may warrant revisions of the CVSZ earthquake source in the NSHM, including changes to the regional fault-zone polygon, Mmax, and the recurrence interval range of large earthquakes.
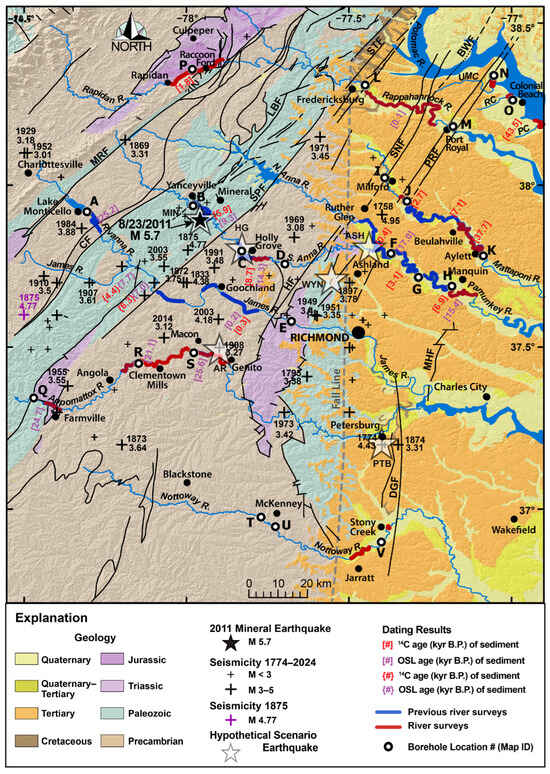
Figure 2.
Map of the study area showing portions of rivers surveyed for liquefaction features including the Appomattox, South Anna, Pamunkey, Mattaponi, Nottoway, Rappahannock, Potomac, and Rapidan rivers; radiocarbon (14C) and optically-stimulated luminescence (OSL) ages—shown in the Explanation as [#] are from this study and {#} are from [23]—of sediment exposed along rivers surveyed; and locations of geotechnical data gleaned from boreholes logs used to evaluate scenario earthquakes at the indicated locations: AR = Appomattox River, ASH = Ashland, MIN = Mineral, and WYN = Wyndham Forest. See Figure 1 caption for references to seismicity, geology, and faults shown on this figure.
2. Previous Paleoliquefaction Studies
Prior to the 2011 Mineral earthquake, a study found 1–10 cm wide sand dikes at one site each on the James and South Anna rivers and on Stigger Creek, a tributary to the Rivanna River [12,24] (Figure 1). The features were interpreted to indicate that one, possibly three, M 5–6 earthquakes had occurred in the area during the past 10 thousand years (kyr), though a M 6–7 earthquake was not precluded.
Within several days of the 2011, M 5.7 earthquake, evidence of earthquake-induced liquefaction, including several small sand blows, was found along the South Anna River near Yanceyville [3] (Figure 1, white circles). During reconnaissance after several storms that caused flooding, no additional sand blows were found in the Yanceyville area, but a 1 cm wide, slightly iron-stained, sand dike was discovered in a cutbank of the river [20] (Figure 1, white square). No unweathered sand dikes that formed during the 2011 earthquake were found farther downstream; whereas, very weathered (bioturbated and mottled) sand dikes, thought to have formed during a paleoearthquake, were found between 6.4–18 km downstream from Yanceyville and between 3.7–9 km downstream from Holly Grove (Figure 1). The weathered dikes ranged from 1–5 cm in width and generally increased in size towards the southeast.
Holocene sediment with strata lithology conducive to the formation of liquefaction features occurs along both the Mineral segment, near Yanceyville, and the Holly Grove segment of the South Anna River [20]. Given that sediment conditions are similar along both segments of the river and that the paleoliquefaction features are mostly larger, more numerous, and occur over a larger area than the few small features found only in the immediate epicentral area near Yanceyville, suggest that the paleoearthquake was of greater magnitude and located farther to the southeast, than the 2011, M 5.7 Mineral earthquake [20].
In 2015, 2018, and 2019, searches for and study of liquefaction features were conducted west of the Fall Line (the boundary between Piedmont crystalline rocks to the west and Coastal Plain sedimentary rocks to the east) along the James, South Anna, and Rivanna rivers and Stigger Creek as well as east of the Fall Line along the Mattaponi, North Anna, and Pamunkey rivers [20] (Figure 2). During the studies, paleoliquefaction features were verified along the James and South Anna rivers and Stigger Creek. Additional liquefaction features were found at nineteen sites on all the rivers, except for the North Anna (Figure 1). In a separate study by [6], the South Anna River was surveyed upstream from Yanceyville, where liquefaction features were discovered and documented at a site named Horseshoe Farm.
The liquefaction features were interpreted to have formed as the result of at least two earthquakes prior to 2011 [20]. The younger features exhibit little to no iron staining or mottling and occur in sediment deposited since 430 yr B.P. (before present, meaning before 1950 C.E.). The younger features include sand dikes ≤3 cm wide and soft-sediment deformation features (SSDs), such as sand diapirs, load casts, and pseudonodules, and occur along the James and Pamunkey rivers (Figure 1). In contrast, the older features are more weathered, bioturbated, and mottled, and occur in sediment deposited between 2730 to 9460 yr B.P. Also, they are larger, up to 20 cm wide, and more numerous than the younger features, and they are broadly distributed across the area, occurring along the Mattaponi, Pamunkey, and South Anna rivers and Stigger Creek. Given the absence of crosscutting relationships and no significant differences in their weathering characteristics, the older features were interpreted to have formed during the same Late Holocene earthquake, though earlier earthquakes were not ruled out.
The three largest known pre-instrumental earthquakes in the CVSZ are the 1758 C.E., M 4.95, event near Ruther Glen, the 1774 C.E., M 4.43, event near Petersburg, and the 1875 C.E., M 4.77, event northwest of Goochland or possibly southwest of Lake Monticello (Figure 1) [7,8,9]. There are significant uncertainties in the locations (34–50 km) and magnitudes (0.35–0.5) of the three earthquakes known only from sparse felt reports. Using liquefaction potential analysis, scenario earthquakes were evaluated to help constrain the location and magnitude of earthquakes that could account for the observed distribution of historical liquefaction features. It was determined that two earthquakes of M 5–5.25 and located within 14 km of the liquefaction sites on the James and Pamunkey rivers, or one earthquake of M 5.75 located between the two rivers could account for the features [20] (Figure 1). Given their locations, it seemed plausible that the two of the 1758, 1774, and 1875 C.E. earthquakes were responsible for the historical features if they were slightly larger than previously estimated.
For the paleoliquefaction features, scenario earthquakes were evaluated for hypothetical sources near the 2011 Mineral, VA, USA, earthquake, Holly Grove, near the middle of the distribution of features, and Ashland, where a cluster of small earthquakes have occurred since 1974. Liquefaction potential analysis indicated that the regional distribution of the older features could be explained by one event of M 6.25–6.5 if located near Holly Grove, of M 6.75 if located near Ashland, or of M 7.0 if located near Mineral. Alternatively, two events of M 6.0 and M 6.25 located near Mineral and Ashland, respectively, could account for the regional distribution of the features [20].
During recent geological mapping along the Nottoway River south-southwest of Richmond, several sand dikes were found west of the Fall Line [11]. Initial dating of the features suggest that the features formed between 4–9 thousand years ago (ka) as a result of an event that predates the Late Holocene paleoearthquake in the CVSZ. This finding raises the possibilities that the CVSZ is broader than previously thought or that there is a separate earthquake source area in southeastern Virginia. Additional surveys for, and dating of, liquefaction features were recommended to test the various interpretations and to further develop the paleoearthquake chronology of the seismic zone.
3. Materials, Methods, and Analyses
This paleoliquefaction study uses best practices discussed in NUREG Guidance document [25] and Geosciences review article [26]. Accurate identification of earthquake-induced liquefaction features is of utmost importance. Therefore, possible liquefaction features are carefully examined and evaluated using diagnostic criteria developed from studies of liquefaction features that formed during known earthquakes [25,27]. Confidence values are assigned to possible liquefaction features found during this and the prior study [20], and those features in which there is high or medium confidence are used to interpret likely locations and magnitudes of earthquakes responsible for their formation.
During river surveys, cutbanks were examined and all liquefaction features described. Information gathered during the surveys (e.g., exposure, sediment condition and age, absence or presence of liquefaction features, and their estimated ages) is summarized in Table 1. In Appendix A, locations of study sites are identified on Figure A1 and detailed information about the sites is provided in Table A1. Information about liquefaction features (e.g., dike width, average dike width, weathering, age constraints, and event timing) is summarized in Table 2. Photographs of several examples of features thought to have resulted from earthquake-induced liquefaction are included as figures in Section 4 below. Liquefaction data were entered into a geodatabase and maps were generated within an ArcGIS framework, displaying the locations, sizes, and estimated ages of liquefaction features in which there is high or medium confidence (e.g., Figure 1).

Table 1.
Information from river surveys including exposure, sedimentary conditions, liquefaction features.
Table 2.
Information about liquefaction features found during river surveys.
Samples were collected at study sites to date sediment and liquefaction features. Radiocarbon (14C) ages of organic samples were derived using accelerator mass-spectrometry and 14C ages calibrated using the probability density range method and the INTCAL20 database [28,29]. Results of 14C dating are presented in Table B1 in Appendix B. Results of radiocarbon dating from [20] referred to in this paper are provided in Table B2. Calibrated 14C ages and calendar dates with error ranges of both 1 standard deviation (68.2% probability) and 2 standard deviation (95.4% probability) are given in the two tables. Geoluminescence Dating Laboratory at Baylor University carried out optically-stimulated luminescence (OSL) dating and calculated systematic and random errors at one standard deviation [30]. Results of OSL dating are presented in Table B3. Due to improvements in methodology (e.g., algorithms that optimize equivalent dose determinations and more robust statistical analyses to reduce errors) during the course of this study, some of the OSL ages were recalculated and are presented in Table B4. Unlike 14C ages, OSL ages reflect the mean with error ranges at 1 standard deviation. In order to use both 14C and OSL dating results to estimate the ages of liquefaction features, and thus the timing of past earthquakes, 14C ages with error ranges of 1 standard deviation are used in this analysis. Results of the analysis are reflected in Table 1, Table 2 and Table A1.
Liquefaction features in the CVSZ are comprised of mostly small (<10 cm) sand dikes as well as a few sills and SSDs such as sand diapirs and pseudonodules. Although no sand blows have been found, that is not to say that no sand blows formed during the liquefaction events. Any small sand blow that formed is likely to have been removed by erosion during flooding or destroyed by bioturbation over the course of decades, leaving only subsurface features as evidence of past events. The upper portions and margins of many dikes have been bioturbated, making it difficult to determine how high in the sediment profile dikes intruded. In addition, the Holocene and Late Pleistocene (0–0.0117 million years ago, or Ma, and 0.0117–0.129 Ma, respectively [31]) deposits, including contacts between deposits in which the liquefaction features formed, are also bioturbated. As a result, there are few opportunities to obtain minimum constraining ages from deposits that clearly post-date the liquefaction features. In the CVSZ, therefore, age estimates of liquefaction features are based on only a few minimum constraining ages and more maximum constraining ages that are not necessarily close to the time of their formation.
Number and timing of earthquakes are interpreted from age estimates, crosscutting relationships, and weathering characteristics of liquefaction features. Liquefaction features with well-constrained age estimates are given more weight in estimating the timing of past earthquakes. Only small, unweathered dikes have been observed crosscutting larger weathered (mottled and bioturbated) dikes. No crosscutting relationships between weathered liquefaction features have been observed. Therefore, most unweathered features reflect historical earthquakes and most weathered features are associated with a paleoearthquake(s) whose timing is estimated on the basis of a few, relatively close, minimum and maximum constraining ages. Information gathered during this and the prior study is considered together to make interpretations about earthquakes responsible for the formation of liquefaction features. Liquefaction features are correlated across the region based on their estimated ages and weathering characteristics. The distribution and relative size of similar-age features help to infer likely source areas of past events.
Liquefaction potential analysis is performed to determine whether or not scenario earthquakes of certain magnitudes and distances are likely or not to induce liquefaction along the various rivers. The cyclic stress method (e.g., [32,33,34,35,36]) is used in the analysis and regionally appropriate ground motion prediction equations [37] are used to calculate peak ground accelerations for scenario earthquakes. Geotechnical data used in the analysis were taken from borehole logs collected at bridge crossings of river segments that were surveyed for liquefaction features (Figure 2; Table C1 in Appendix C). Because the water table usually occurs within a meter of the ground surface, but can drop several meters during drought [38], 1 m and 3 m water-table depths were used in the analysis; only 1 m depth was used to evaluate historical earthquakes. Magnitude estimates of scenario events that best match observed liquefaction for historical and paleoearthquakes are summarized in Table 3. Detailed results can be found in [39].
Table 3.
Estimates of magnitude for historical earthquakes and paleoearthquakes.
4. Surveys for and Dating of Liquefaction Features
Building on prior investigations, this study extends the search for and dating of liquefaction features towards the east along the Mattaponi and Pamunkey rivers, south along the Appomattox and Nottoway rivers, and north along the Rapidan, Rappahannock, and Potomac rivers and estuaries of three tributaries of the Potomac (Figure 1 and Figure 2). During these surveys, numerous features, including dikes, sills, and SSDs, were discovered along the Appomattox River west of Richmond and a few features, including one small dike and SSDs, were found along the Rapidan River west of Fredericksburg.
Liquefaction features were not found along surveyed segments of the Nottoway, Rappahannock, and Potomac rivers and estuaries of its three tributaries. Either sediment conditions were unfavorable for liquefaction features to form or exposure was inadequate for finding features, if present (Table 1). Along the Nottoway River, sediment conditions are favorable for the formation of liquefaction features downstream from Jarratt but not near Stony Creek. However, exposure was poor to very poor due to recent deposition of flood deposits on the river banks. Along the Rappahannock River, sediment conditions conducive to the formation of liquefaction features are limited to sediment underlying the lowest (1–2 m) terrace in which there were few exposures. In addition, dating of the sediment exposed in the few cutbanks suggests that it was deposited during the past 100 ± 80 yr B.P., and therefore, is too young to record earthquake-induced liquefaction prior to about 1850 C.E. Along the Potomac River and several of its tributaries, Holocene deposits were very sparse; there were exposures of Late Pleistocene sandy deposits but they occurred high in the sections and were rarely capped by clay or silt layers which promote liquefaction. Therefore, detailed descriptions of the surveys of the Nottoway, Rappahannock, and Potomac rivers and estuaries of its three tributaries are not included in this article, but are summarized in Table 1.
Several previously found liquefaction sites on the Pamunkey, Rivanna, and South Anna rivers were revisited and samples collected to improve age estimates of liquefaction features. River surveys and dating of liquefaction features are discussed below.
4.1. Appomattox River
Survey was conducted along several segments of the Appomattox, including 6 km near Farmville, 14 km between Angola and Clementine Mills, 18.5 km between Clementine Mills and Macon, and 13.5 km between Macon and Genito for a total of 52 km (Figure 1 and Figure 2). Along these river segments, Holocene alluvium is inset into Quaternary and Tertiary deposits [40].
River cutbanks were 2–4 m high with the upper 0.5–2 m covered with vegetation (Table 1 and Table A1). Otherwise exposure was fair to good, especially in river bends, except for the lower 6 km of the Macon-Genito segment where more of the banks were vegetated. Many cutbanks revealed an upper unit of drab silt, or sand fining upward to silt, underlain by a lower unit of mottled, clayey silt, silt, and silty sand. Layers of sand and pebbly sand sometimes occurred at the bottom of the cutbank. Probing below the cutbanks, silt, sandy silt, and sand were encountered down to 1.6 m. Sand became coarser and more common with depth. Where the river channel approached the margin of the floodplain, bedrock was often encountered 1–1.5 m below the cutbank during probing. Occasionally, rock cropped out along the river banks.
No liquefaction features were found along the Farmville segment where sediment conditions are less than ideal for the formation of liquefaction features. Along this segment, the sediment section is about 3 m thick and sand layers that may be susceptible to liquefaction are fairly thin (≤10 cm). Both these factors may reduce the likelihood that liquefaction features will form as the result of strong ground shaking.
Liquefaction features were found along the downstream 7 km of the Angola-Clementine Mills segment, the Clementine Mills-Macon segment, and the upstream 7 km of the Macon-Genito segment where the sediment conditions are favorable for the formation of liquefaction features (Figure 1 and Figure 2). Along the Angola-Clementine Mills segment, the sediment section is about 4–5 m thick and sand and pebbly sand, 0.25–1.2 m thick, occur below clay, clayey silt, and sandy silt in several locations. Along the Clementine Mills-Macon segment and the upper 7 km of the Macon-Genito segment, conditions are similar and even more favorable, where sand and pebbly sand become more common and thicker.
There appears to be two generations of liquefaction features, primarily sand dikes, along the Appomattox. Few younger sand dikes are relatively unweathered, crosscut older features, and range up to 2 cm in width (Table 2). These features are interpreted as historical in age due to the lack of weathering. The older sand dikes are very weathered (mottled and bioturbated) and range from 0.5–12 cm in width. At site AR8, sand dikes crosscut silt with manganese nodules and approach a depositional contact between a silt loam and silty, very fine sand above (Figure 3). Dating of samples AR8-OSL1 (BG5409) and AR8-OSL2 (BG5408) collected above and below the contact, respectively, provide minimum and maximum constraining ages of 2655 ± 95 and 3490 ± 125 yr B.P. (Table B4), suggesting that the older, weathered sand dikes at the site formed between 2560 and 3615 yr B.P. Dating of older, weathered features at other sites along the river is limited to maximum constraining ages that range from ca. 4.2 to 86.4 ka (Figure 1 and Figure 4; Table 2, Table A1, Table B3 and Table B4). There are no apparent crosscutting relations among the older liquefaction features, and they exhibit similar pedogenic effects; thus, they are hypothesized to be contemporaneous. However, it remains a viable hypothesis that some of these features may have formed during different events, spanning from the Middle Holocene to the Late Pleistocene.
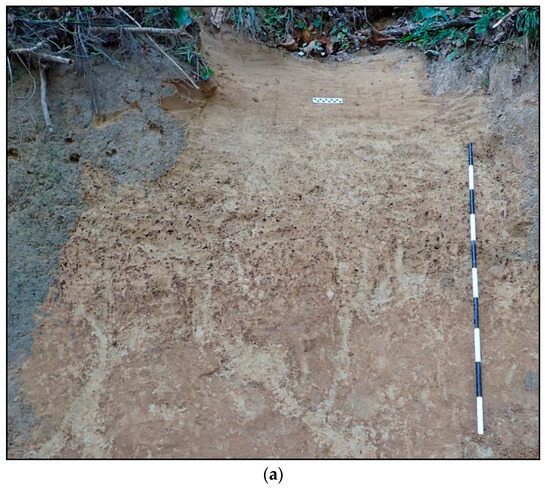
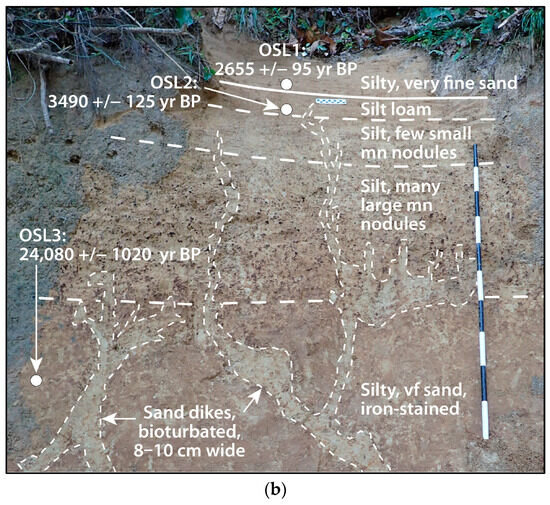
Figure 3.
Photographs (a) unannotated; (b) annotated of weathered sand dikes observed in cutbank at site AR8 along the Macon-Genito segment of the Appomattox River. Several dikes intruded through krotovinas (filled-in animal burrows), branched and narrowed upward, and extended to ~1.6 m below the top of the cutbank. No dikes crosscut the depositional boundary between silt loam and overlying silty sand. OSL dating of AR8-OSL1 and AR8-OSL2 on either side of that boundary provides minimum and maximum constraining ages of 2560 yr B.P. and 3615 yr B.P., respectively. The dikes were mottled and bioturbated, especially along their margins. Several small and relatively unweathered dikes crosscut the weathered dikes and terminated low in the cutbank. Probing below the cutbank, silty sand is underlain by sand, the likely source of the sand dikes. For scale, the meter stick’s black and white intervals represent decimeters; the smaller scale’s intervals represent centimeters.
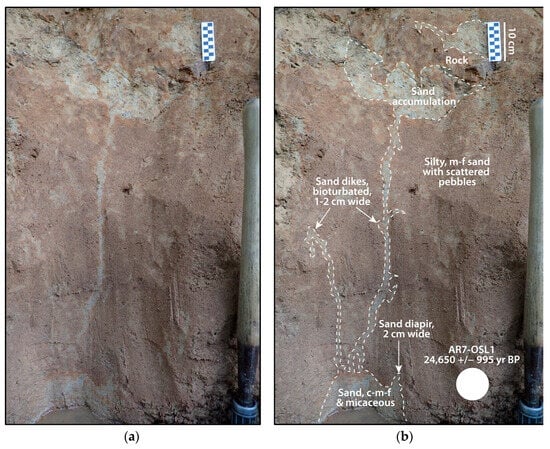
Figure 4.
Photographs (a) unannotated; (b) annotated of two sand dikes and diapir observed in lower 0.7 m of cutbank at site AR7 along the Macon-Genito segment of the Appomattox River. Dating of AR7-OSL1 provides a maximum constraining age of 24,650 +/− 995 yr B.P. The dikes and diapir extend upward from a larger dike at the bottom of the exposure. A 2 cm wide dike extended upsection to the bottom of a rock fragment where sand accumulated. The dike wrapped around the fragment and pinched out 65 cm above the river level. Similar phenomenon was observed in excavations of sand blows and related dikes that formed during the 1988 M 5.9 Saguenay, Quebec, earthquake in Canada. Probing detected silty sand underlain by likely source sand of the dikes. The scale’s black and white squares represent centimeters; shovel handle is 50 cm long.
4.2. South Anna River
Previously, several sites of liquefaction had been found along the Holly Grove segment of the South Anna River; however, the ages of the liquefaction features were poorly constrained. Therefore, the Holly Grove segment was resurveyed to collect samples for dating the liquefaction features and to look for more features (Figure 1 and Figure 2). In addition, the next 6 km downstream were surveyed. Holocene and Late Pleistocene sediment occurs along this portion of the river [19]. The South Anna alluvium, beneath the modern flood plain as well as beneath older terraces, is composed of silt, clay, sand, and gravel [41].
Along the Holly Grove segment, exposure was poor, becoming progressively worse downstream. Most banks were vegetated and covered with recently deposited silt (Table 1). Along the upper 8 km, 2–2.5 m high cutbanks revealed greenish gray or drab silt underlain by interbedded sandy silt and silty sand followed by coarse sand and pebbly sand. Probing below cutbanks, bedrock was encountered between 0.4–1.4 m depth. Along the lower 6 km, 3 m high cutbanks revealed yellowish red, interbedded silty, very fine sand and very fine sandy silt. As determined during probing, sediment became sandier below the cutbanks and bedrock usually was encountered within 1.25 m depth. Rock cropped out on the south side of the river where it impinged on the adjacent hillslopes. Along the lowermost 1.5 km, there was a large log jam which impeded river flow. This is consistent with recent silt deposition and vegetated growth on banks upstream from the log jam.
During the survey, liquefaction site SoAR10 (here renamed 10a) was relocated but covered by vegetation; however, a new cutbank exposure ~20 m downstream revealed a similar sedimentology of bioturbated and mottled silt and sand, underlain by sand. At this site, SoAR10b, four sand dikes, 1–6 cm wide, originating in the sand layer near the base of the cutbank, intruded the overlying sediment (Table 2 and Table A1). Two of the dikes branched and pinched upward, extending to 1.45 m BS where they became discontinuous for another 10–20 cm and terminated in drab silt (Figure 5). The other two dikes appeared to have intruded polygonal cracks in the sediment and terminated below the drab silt.
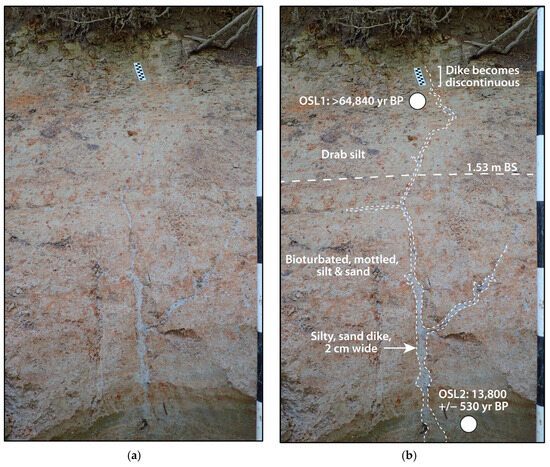
Figure 5.
Photographs (a) unannotated; (b) annotated of cutbank exposure at site SoAR10b along the Holly Grove segment of the South Anna shows a silty, sand dike crosscutting bioturbated and mottled silt and sand, branching upsection, and extending into drab silt where it becomes discontinuous. OSL dating of sediment sample SoAR10b-OSL2 indicates that the sand dikes formed since 14,330 yr B.P.; unfortunately, sediment sample SoAR10b-OSL1 collected near the termination of the dike returned an erroneous result. However, 14C dating of an organic sample collected 1.8 m B.S. from mottled sandy silt at nearby site SoAR10b suggests the sand dikes at the two sites formed since 8689 yr B.P. The meter stick’s black and white intervals represent decimeters; whereas, the small scale intervals represent centimeters.
The dikes were bioturbated and mottled, suggesting they are more than a few hundred years old. OSL dating of sample SoAR10b-OSL1 (BG-5416) collected near the termination of the dike returned an erroneous result and sample SoAR10b-OSL 2 (BG-5417) collected 98 cm below the dike tips yielded an age of 13,800 ± 530 yr B.P. (Table B4). 14C dating of organic sample SoAR10a-C1 (BA647241) collected 20 cm below the dike tip provided a maximum constraining age of 8696 yr B.P. This suggests that the sand dikes at both SoAR10a and SoAR10b formed since ca. 8.7 ka (Table 2, Table A1 and Table B1). Except for SoAR10b, no additional liquefaction sites were found during the survey which is not surprising given the poor exposure of sediment at the time. Because sedimentary conditions appear favorable for liquefaction features to form, resurvey of this portion of the river may be warranted after the log jam is removed and active erosion of meander bends resumes.
During the previous study, there was considerable uncertainty about the age of liquefaction features along the Mineral segment of the river. These sand dikes were estimated to have formed since 4440 yr B.P. (2-sigma) based on 14C dating of sample, SoAR100-C1 (BA414599, Table B2), retrieved during augering below the cutbank at site SoAR100 [20]. For the current study, samples previously collected at liquefaction sites along the Mineral segment were reviewed, and an organic sample, SoAR7-C4 (BA-647240), was selected for 14C dating (Figure 6). The sample was collected from a root cast within clayey silt at site SoAR7, where 1–1.5 cm wide sand dikes crosscut several root casts within mottled clayey silt (Table A1). The silty sand dikes exhibited bioturbation and mottling, suggesting that they are more than a few hundred years old. Dating of SoAR7-C4 provides a maximum constraining age of 5891 yr B.P. for the dikes (Table B1). This age is younger than the OSL age of 9015 ± 310 yr B.P. for sample SoAR7-OSL1 (BG4001.B, Table B4) also collected at the site and older than the 14C age of 4420 yr B.P. (1-sigma) for the sample collected at nearby site SoAR100. The maximum constraining age of 5891 yr B.P. is preferred since sample SoAR7-C4 was collected in situ, whereas sample SoAR100-C1 was collected during auguring and may have been reworked. Therefore, the sand dikes at site SoAR7 are reinterpreted to have formed since ca. 5.9 ka, as are the weathered dikes at nearby sites SoAR5, 6, 8, and 100 with similar sedimentology to site SoAR7 (Table 2 and Table A1).
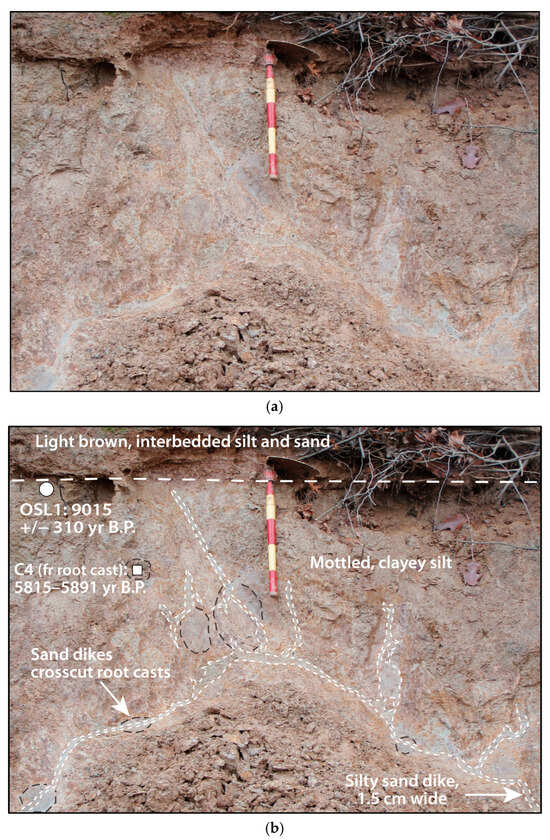
Figure 6.
Photographs (a) unannotated; (b) annotated of cutbank exposure at site SoAR7 along the South Anna River south of Mineral. Silty, sand dikes intrude mottled, clayey silt and root casts (black dashed lines). Dikes branch upsection, and one dike extends 1 m above the water level, where it terminates below the contact with overlying light brown, interbedded silt and sand. 14C dating of sample SoAR7-C4 collected from a root cast suggests that the dikes formed since 5891 yr B.P. For scale, red and yellow intervals on the shovel handle represent 10 cm.
4.3. Rivanna River-Stigger Creek
West of Mineral, a site of liquefaction along Stigger Creek near its confluence with the Rivanna River, was originally found in the 1990s [12,24] (Figure 1). Following the 2011 Mineral earthquake, the site was relocated and sand dikes were verified at the site. Dating of sample RR-SC1-OSL1 (BG4002.B) collected from the source strata for several sand dikes returned an OSL age of 11,010 ± 425 yr B.P. [20] (Table B4, age recalculated). During this study, the site, RR-SC1, was revisited to collect additional samples for dating, but it was overgrown with vegetation. About 25 m upstream, however, an actively eroding cutbank revealed a similar sedimentary section crosscut by several bioturbated and mottled sand dikes (Table A1). At this site, RR-SC2, three sediment samples were collected from the section, including from the source strata for the dikes, a mottled silty fine sand crosscut by the dikes, and an overlying reddish silt in which the most extensive dike terminated highest in the section (Figure 7). The OSL ages for the three samples are consistent with one another, showing that the sediments young upward. The uppermost sample RR-SC2-OSL1 (BG5820) yielded an age of 12,030 ± 525 yr B.P., suggesting that the sand dikes at this site and nearby site RR-SC1 formed since ca. 12.6 ka. (Table 2, Table A1 and Table B3).
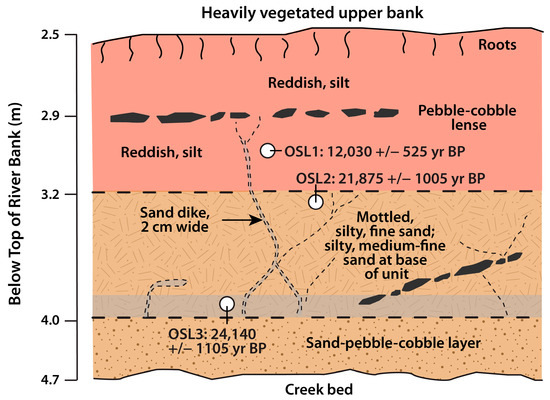
Figure 7.
Sketch of cutbank exposure at site RR-SC2 along Stigger Creek. OSL dating at the site suggests that the sand dikes formed since 12,555 yr B.P. This site is located ~25 m upstream from RR-SC1 which was heavily vegetated during field work in 2023. Previous dating at RR-SC1 suggested that sand dikes at that site formed since 11,435 yr B.P.
4.4. Pamunkey River
Previously, the Pamunkey River was surveyed downstream from the confluence of the North and South Anna rivers to the vicinity of Manquin (Figure 1 and Figure 2). It appeared that sand dikes were smaller and less frequent downriver towards the southeast. This study extended the survey from Manquin for another 15 km downriver. Along this river segment, Holocene fluvial deposits are inset into Quaternary and Tertiary deposits [40]. During the survey, three terrace levels were noted: a 1–1.5 m high terrace; a ~9 m high terrace; and a ~24 m high terrace. From low to high, the three terraces are Holocene, Pleistocene, and probably Tertiary in age [40]. This portion of the river is influenced by tidal variations and the river banks become increasingly marsh-like downstream.
Along the Manquin segment, cutbank exposure was mostly fair to poor, but better in river bends (Table 1). Most of the exposures were in the low Holocene terrace and revealed yellowish-reddish, silty very fine sand to clayey silt. Probing below the cutbanks, silt became interbedded with sand and the sand layers became more frequent and thicker, ~10 cm, with depth. The few cutbanks in the Pleistocene terrace exposed yellowish sand underlain by grayish-reddish silt containing shell fragments. Probing below the cutbanks, silt was interbedded with thin, 2–3 cm, layers of sand occurring with greater frequency with depth. At site PR201 in the Pleistocene terrace, OSL dating of samples PR201-OSL2 (BG5414) and PR201-OSL1 (BG5413) collected from the upper pebbly sand and lower reddish silt, respectively, returned ages of 13,065 ± 645 yr B.P. and 14,590 ± 790 yr B.P. (Table 1, Table A1 and Table B4). No cutbank exposure was observed in the highest terrace.
Sediment conditions in the Holocene section, specifically clayey silt underlain by interbedded silt and sand, followed by sand, and possibly the Pleistocene section, specifically silt underlain by interbedded silt and sand, appear to be conducive to the formation of liquefaction features; however, no liquefaction feature was found in either section. This may indicate that ground shaking was insufficient to induce liquefaction in this area. Unfortunately, only 1–1.5 m of Holocene sediment is exposed and there are relatively few exposures of Late Pleistocene sediment, adding uncertainty to this interpretation.
Along the Ashland segment, liquefaction sites PR2 and PR100 were revisited to collect sediment samples for OSL dating. During the previous study [20], organic sample for 14C dating could not be found at either site. At PR2, five sand dikes, 2.7–7.3 cm wide intruded mottled, very fine sandy, silt exposed in the lower part of the 4–4.5 m high cutbank (Table A1). Several of the dikes branched and narrowed upsection and extended to about 0.9 m above the water level. The upper portions of the dikes were bioturbated and their margins iron-stained. During this study, samples PR2-OSL1 (BG5411) and PR2-OSL2 (BG5412), collected at the level of the dike tips and near the bottom of the cutbank, yielded OSL ages of 8075 ± 305 yr B.P. and 16,345 ± 675 yr B.P., respectively. These results indicate that sediment of the lower 1.6 m of the cutbank was deposited during the early Holocene and Late Pleistocene and that the dikes formed since ca. 8.4 ka (Table 2).
At site PR100, two silty sand dikes, 4 cm and 0.5 cm wide, intruded mottled silt and pinched out about 0.4 m above the river level (Table A1). Sandy domains, extending another 20 cm above the dikes, were likely bioturbated remnants of the dikes. During this study, sediment sample PR100-OSL1 (BG5418), collected at the upper level of the continuous portions of the dikes, but below the sandy domains, yielded an OSL age of 1990 ± 100 yr B.P. (Table B4). Given that they likely extended another 20 cm above the position of the collected sample, the dikes probably formed well after ca. 2.1 ka (Table 2). This would be much younger than other dikes thought to have formed during a paleoearthquake about 2.6 ka, suggesting that the dikes at this site formed as the result of one of the CVSZ historical earthquakes.
4.5. Mattaponi River
During this study, survey of the Mattaponi River was conducted downstream from the end of the previous survey, from Beulahville to Aylett, a distance of 24.5 km (Figure 1 and Figure 2). Holocene and Pleistocene alluvium inset into older Quaternary deposits of the Tabb, Shirley, Charles City formations and Tertiary deposits, including the Chesapeake Group, are mapped along this segment of the river [40]. Three terraces occur along this segment of the river: a 1.5–3.0 m high terrace; a 5–6 m high terrace; and the a ~20 m high terrace. From low to high, the three terraces are Holocene, Pleistocene, and probably Tertiary in age [40]. This portion of the river is tidal and low river banks become marshy near Aylett.
Many banks of the river were vegetated or covered with organic debris from recent floods; however, there were cutbank exposures in river bends (Table 1 and Table A1). Along the upper 15 km of the segment, cutbanks occurred mostly in the lower two terraces and exposed Holocene and Late Pleistocene sediment; whereas, along the lower 8 km of the segment, cutbanks occurred mostly in the highest terrace and exposed sediment of the Chesapeake Group.
Cutbanks in the 1.5–3.0 m terrace revealed sand underlain by mottled gray and yellowish silt followed by interbedded pebbly sand, silty sand, sandy silt, and silt. Silty sand low in the cutbanks appeared to be susceptible to liquefaction. Probing detected interbedded silt and sand to a depth of at least 1.5 m below the cutbank. At site MR200, where a recent point-bar had formed, sample MR200-C1 (BA609013) was collected from silty sand near the bottom of the cutbank. 14C dating of the sample indicates that much of the point bar had been deposited ≤ 470 yr B.P. (Table A1 and Table B1). Cutbanks in the 5–6 m terrace revealed sand underlain by bioturbated and mottled silt and silty sand followed by grayish olive and dark olive gray, clayey silt with subparallel high-angle fractures. In places, The clayey silt had vestiges of laminations disturbed by bioturbated. As determined by probing, clayey silt continued for 0.25–0.5 m and was underlain by 1.0–1.25+ m of sand. At site MR201 in the 5–6 m terrace, sample MR201-W1 (BA609014) was collected from mottled silty sand above clayey silt. 14C dating of the sample indicates that it was deposited ≤ 37,671 yr B.P. (Table A1 and Table B1). Cutbanks in the 20-m terrace exposed pale yellowish, grayish olive, and dark olive gray, dense, clayey silt with high-angle fractures, likely representative of the Chesapeake Group.
Along the upper 15 km of the Beulahville-Aylett segment, the strata lithology (e.g., interbedded sand, silt, and clay) in the Holocene sediment, and to a lesser degree in the Late Pleistocene sediment, is favorable for the formation of liquefaction features. The younger sediment has the potential to record at least Late Holocene earthquakes, while the older sediment has the potential to record Late Pleistocene and Holocene earthquakes. Despite favorable conditions, no liquefaction feature was observed in either Holocene or Late Pleistocene sediment, suggesting that there may not have been sufficient ground shaking in this area to induce liquefaction during these time periods.
4.6. Rapidan River
West of Fredericksburg, the Rapidan River was surveyed for 23 km downstream from the town of Rapidan and past Raccoon Ford (Figure 1 and Figure 2). Along this river segment, Holocene and Pleistocene alluvium occurs below the floodplain and is composed of 6 m-thick fining-upward sequences of gravel and sand, interbedded silt and sand, and silt [42]. Also, Pleistocene-Pliocene deposits occur below upland benches above and adjacent to the floodplains and are composed of about 10 m of gravel, sand, silt, and clay.
Two terrace levels were noted during the survey (Table 1). There were few cutbank exposures in the lower 3.0–4.5 m terrace, mostly in river bends. Since the upper portion of cutbanks were vegetated, most exposures of sediment occurred in the lower half. They revealed interbedded silt and iron-stained sand or mottled silt with a few interbeds of sand. In a few places, sandy silt or pebbly sand with a few cobbles occurred low in the cutbanks. As determined by probing, interbedded silt and sand or silt continued for 0.5–1.5 m below the cutbanks, where bedrock was usually encountered.
SSDs, including a sand dike, pseudonodules, and diapirs that might be related to earthquake-induced liquefaction, were found at sites RnR1 and RnR3 (Figure 1 and Table A1). At site RnR1, sandy pseudonodules extended downward into the underlying silty sand layer and sandy diapirs intruded the overlying silty sand layer (Figure 8). 14C dating of samples RnR1-C2 (BA609016) and RnR1-C1 (BA609015) collected 30 cm above and 35 cm below the SSDs, respectively, yielded minimum and maximum constraining ages of 142 yr B.P. and 1818 yr B.P. (Table B1). The site was revisited to collect additional samples to try to further constrain the age of the SSDs. Sediment samples RnR1-OSL1 (BG5823) and RnR1-OSL2 (BG5824) were collected 20 cm above and 10 cm below the SSD, respectively (Table B3). OSL dating of the samples returned ages of 230 ± 15 yr B.P. and 295 ± 15 yr B.P., suggesting that the SSDs formed between 215 and 310 yr B.P. (Table 2 and Table A1). At site RnR3, downstream from RnR1, a small, 1 cm wide, sand dike, intruded the overlying mottled silt, branched upward, and extended 25 cm upsection, where it became difficult to trace due to bioturbation (Table A1). Also, a small flame structure, verging upstream, extended from a thin layer of sand into the overlying silt. Probing determined that interbedded silt and sand continued downsection for only 0.5 m, where bedrock was encountered. Dating of sediment sample RnR3-OSL1 (BG5425) from a sandy layer crosscut by the dike provided an age of 330 ± 15 yr B.P., suggesting that the dike formed since 345 yr B.P. (Table B3).
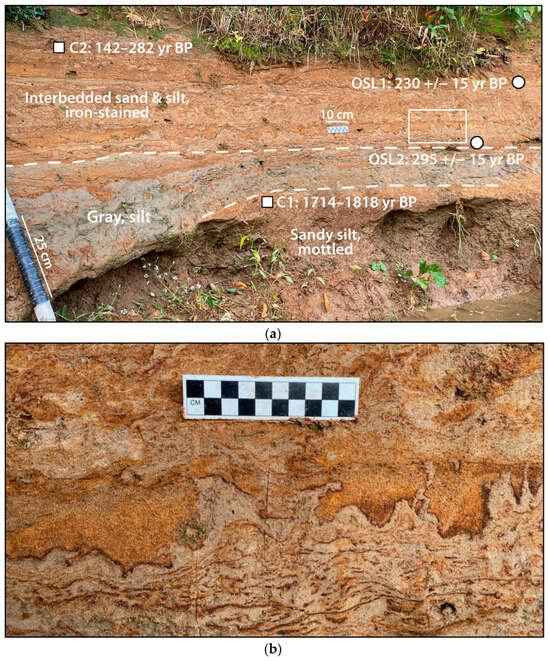
Figure 8.
Photographs of SSDs at site RnR1 along the Rapidan River west of Fredericksburg: (a) Photograph shows SSDs in iron-stained interbedded sand and silt. OSL dating of samples RnR1-OSL1 and RnR1-OSL2 from above and below the SSDs, respectively, indicates that they formed between 215–310 yr B.P. (b) Closeup photograph of SSDs, including pseudonodules of sand extending downward into underlying silty sand and diapirs of sand extending upward into the overlying silty sand layer. Black interval on hoe handle represents 25 cm and black and white squares on the small scale represent centimeters.
SSDs similar to those at RnR1 and RnR3 have been attributed to liquefaction resulting from earthquakes [26,43] of Modified Mercalli intensities of VIII [44] or of M ≥ 5 [45]. Multiple occurrences of similar age SSDs such as these support an earthquake origin. Given age constraints, the features could have formed during the same event between 1735–1640 C.E. (Table 2).
Conditions favorable for liquefaction features to form do exist along the Rapidan river; however, the formation of liquefaction features is likely limited by the distribution and thickness of sand layers susceptible to liquefaction. Also, the sediment section appears to be fairly young, limiting the record of earthquakes to the past ~2 kyr.
5. Discussion
Findings during this study (1) add confidence to the previous interpretation that there was at least one large paleoearthquake in the CVSZ during the Late Holocene, (2) narrows the age estimate of the paleoearthquake, and (3) further constrains estimates of the source area and magnitude of the event. Also, findings suggest an additional earthquake source west of Fredericksburg that may have produced a moderate earthquake during the early colonial period.
5.1. Earthquake-Induced Liquefaction and Event Timing
Likely liquefaction features were discovered along the Appomattox River west of Richmond and along the Rapidan River west of Fredericksburg (Figure 1 and Table 2). Along the Appomattox River, at least two generations of liquefaction features, including sand dikes and intruded krotovina, occur in Holocene and Late Pleistocene deposits. The older features are bioturbated and mottled; whereas, the younger features are relatively unweathered and crosscut older features.
On the basis of OSL dating of host sediment, some of the weathered features along the Appomattox River are estimated to have formed between 2560 and 3615 yr B.P. This age estimate overlaps with maximum constraining ages of 2710 yr B.P. (1-sigma age of MR102-C1) and 3030 yr B.P. (1-sigma age of PR101-C1) for some of the weathered liquefaction features along the Mattaponi and Pamunkey rivers (Table 2 and Table B2). By combining the most restrictive minimum (2560 yr B.P.) and maximum (2710 yr B.P.) constraining ages for the weathered features along the Appomattox, Mattaponi and Pamunkey rivers, the timing of the paleoearthquake is estimated to be ca. 2640 ± 80 yr B.P.
Some of the unweathered liquefaction features along the Appomattox River are crosscut by older features that formed during the paleoearthquake ca. 2640 ± 80 yr B.P. Therefore, the unweathered sand dikes formed much more recently than 2.7 ka. In addition, their weathering characteristics are similar to historical sand dikes and SSDs on the James and Pamunkey rivers. Therefore, unweathered features on the Appomattox River are thought to have formed during one of the larger historical earthquakes in the CVSZ, either the 1758, 1774, or 1875 C.E. event.
There are other weathered liquefaction features on the Appomattox, Mattaponi, Pamunkey, Rivanna (Stigger Creek), and South Anna rivers, with maximum constraining ages, spanning from 4235–86,440 yr B.P. Poor age constraints of many of the weathered features would allow for earlier earthquakes, but there is no unequivocal evidence to support multiple large (M ≥ 6) earthquakes during the Holocene or Late Pleistocene (Table 2). Given the lack of crosscutting relationships or differences in weathering characteristics, however, the weathered features along all five rivers may have formed as a result of the same contemporaneous paleoearthquake. This interpretation is supported by the size distribution of the weathered sand dikes. Average dike width is greatest, 6.3 cm (or 4 cm if the largest dike width of 20 cm is excluded as an outlier) for the Pamunkey River and smaller, 3.8 and 3.9 cm, for the Mattaponi and Appomattox rivers, north and south of the Pamunkey River (Table 2). In addition, average dike width decreases towards the west from 6.3 cm (or (or 4 cm) for the Pamunkey River, 2.6 cm for the South Anna near Holly Grove, 2.3 cm for the South Anna near Mineral, to 1.8 cm for Rivanna River-Stigger Creek. This size distribution, with average dike width decreasing away from a somewhat central area is consistent with a liquefaction field resulting from one event with the larger features more likely occurring near the source of the earthquake.
Along the Rapidan River, liquefaction features, including a small sand dike, pseudonodules, diapirs, and flames, occur in Late Holocene deposits and are estimated to have formed ca. 1690 ± 50 yr C.E. There is no known historical earthquake in the CVSZ or surrounding region during this time period. However, a map by [46] published in 1718 C.E. labels the area in the vicinity of the Rapidan River as “terre tremblante” or “trembling earth” (Figure 9), suggesting that early colonists had experienced earthquakes in the area.
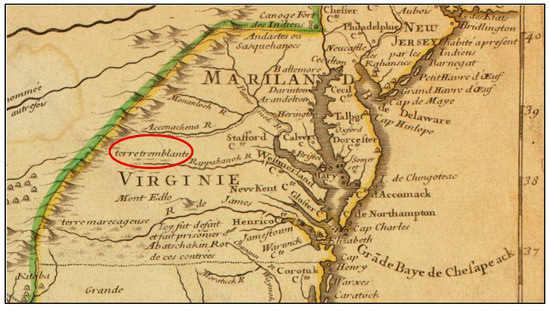
Figure 9.
Map published in 1718 depicts area encircled with red ellipse along the western stretch of the Rappahannock River as “terre tremblante,” translates to “trembling earth” [46]. This area is in the vicinity of the Rapidan River, a tributary to the Rappahannock, where possible liquefaction features formed between 215–310 yr B.P. or 1735–1640 C.E.
5.2. Locations and Magnitudes of Past Earthquakes
Building on the previous study [20], scenario earthquakes are evaluated to improve estimates of locations and magnitudes of earthquakes that induced liquefaction along the Appomattox and Rapidan rivers and other rivers in the region. As described in Section 3, liquefaction potential analysis is performed to ascertain if scenario earthquakes of certain magnitudes and distances are likely, or not, to induce liquefaction along the various rivers and to see which scenario earthquake(s) best matches the observed distribution of features.
For historical liquefaction features, scenario earthquakes are evaluated ranging from M 4.8–6.0 at distances of 5 to 55 km. The results of the analysis suggest that these features along the Appomattox, James, and Pamunkey rivers could have formed during the following: (1) three M 5.25–5.5 earthquakes located within 10 km of each group of features, or (2) one M 5.75–6.0 earthquake between the features on the James and Pamunkey rivers (Table 3). Because none of the historical earthquakes were assigned magnitudes greater than 5.32, it seems unlikely that one M ≥ 5.75 earthquake led to the formation of the young liquefaction features on all three rivers. Given the uncertainty in their locations (34–50 km) as well as their magnitudes (0.35–0.5 magnitude units), it is plausible that some combination of the 1758, 1774, and 1875 C.E. earthquakes were responsible for the features and that one of these events was of M 5.25–5.5, slightly larger than previously estimated.
There is now robust data and observations to better constrain the location and magnitude of the 2640 ± 80 yr B.P. earthquake reflected by paleoliquefaction features along the Appomattox, Mattaponi, Pamunkey, Rivanna (Stigger Creek), and South Anna rivers. Using liquefaction potential analysis, scenario earthquakes were evaluated for hypothetical source areas near the following: (1) the 2011 Mineral, VA, earthquake, (2) Holly Grove near the middle of the distribution of liquefaction features, (3) Ashland, where numerous small earthquakes have been recorded since 1974, (4) Wyndham Forest, halfway between liquefaction features on the Appomattox and Mattaponi River, and (5) Macon, near some of the larger features on the Appomattox River (Figure 1 and Figure 2).
According to the analysis, paleoliquefaction features along the five rivers could be the result of one earthquake of M 6.5–6.75 near either Holly Grove, Macon, or Wyndham Forest or a larger event of M 6.75–7.0 near either Mineral or Ashland (Table 3). Alternatively, the features could have formed during three M 6.25–6.5 earthquakes located near Mineral, Holly Grove, and Ashland. If it is assumed that only the weathered dikes on the Appomattox, Mattaponi, and Pamunkey rivers with maximum constraining ages <4240 yr B.P. formed during the ca. 2640 ± 80 yr B.P. event, and all other weathered features formed during an earlier earthquake(s), the analysis suggests that they could be the result of a M 6.25 earthquake near Wyndham Forest. However, currently, there is no unequivocal evidence, such as crosscutting relations of liquefaction features, to support multiple large earthquakes during the late Holocene or prior to ca. 2.7 ka.
As mentioned above, average dike width is greatest for the Pamunkey River, somewhat smaller for the Mattaponi and Appomattox rivers, north and south of the Pamunkey River, and decreases towards the west from the Pamunkey River to the South Anna followed by the Rivanna River-Stigger Creek (Table 2). The size distribution, with the largest average dike width along the Pamunkey River, suggests that the source of the event ca. 2640 ± 80 yr B.P may be in the Ashland area. However, amplification of ground motion in the Coastal Plain [47], where unconsolidated sediment overlies crystalline bedrock, may have contributed to liquefaction along the Pamunkey and Mattaponi rivers. Average dike width for the Appomattox River is similar to that for the Mattaponi River, but this portion of the Appomattox River is located west of the Fall Line where amplification of ground motion would be less of a factor. Therefore, a M 6.5–6.75 earthquake located closer to Wyndham Forest is our preferred interpretation.
Possible liquefaction features along the Rapidan River may be the result of a previously unrecognized earthquake ca. 1690 ± 50 yr C.E. This finding along with a map by L’Isle published in 1718 depicting “terre tremblante” in the vicinity of the liquefaction features suggest that there may be an active earthquake source in the area. Liquefaction potential analysis suggests that a local (within 10 km) event of M 5.5–5.75 could have induced liquefaction along the Rapidan River (Table 3). Such an event would have been similar in magnitude to the 2011 Mineral earthquake and like the Mineral earthquake only produced relatively small liquefaction features in the epicentral area.
6. Conclusions
The main findings of this study are as follows:
- (1)
- Earthquake-induced liquefaction features were discovered in cutbanks of the Appomattox River west of Richmond and of the Rapidan River west of Fredericksburg;
- (2)
- A large paleoearthquake about 2640 ± 80 yr B.P. is thought to have induced liquefaction along the Appomattox River and other rivers across the region;
- (3)
- On the basis of the size distribution of weathered liquefaction features and the evaluation of scenario earthquakes, the paleoearthquake is estimated to be of M 6.5–6.75 and located near Wyndham Forest, northwest of Richmond;
- (4)
- Historical earthquakes in 1758, 1774, and 1875 C.E. likely were of M 5.25–5.5 and responsible for relatively unweathered liquefaction features discovered in cutbanks of the Appomattox, James, and Pamunkey rivers;
- (5)
- An earthquake around 1690 ± 50 yr C.E. induced minor liquefaction along the Rapidan River; and
- (6)
- This previously unrecognized historical earthquake is estimated to be of M 5.5–5.75 earthquake, similar to the 2011 Mineral earthquake, and to have been located in the Rapidan area.
These findings may warrant revisions to the characterization of the Central Virginia earthquake source in the national seismic hazard model for the U.S. The revisions may include enlargement of the regional fault-zone polygon to encompass liquefaction features along the Appomattox River, an increase of the upper limit placed on Mmax to 6.75, and reduced uncertainty in the recurrence interval range for large earthquakes.
Despite recent advances, uncertainties remain regarding the ages of many of the liquefaction features, and to a lesser degree, the regional extent of liquefaction. Additional survey for, and dating of, liquefaction features, especially along segments of the South Anna River not previously surveyed, might help to further reduce these uncertainties.
Author Contributions
Conceptualization, M.P.T.; methodology, M.P.T., S.L.F. and K.D.-W.; OSL dating software, S.L.F.; liquefaction potential analysis software, K.D.-W.; formal analysis, M.P.T., S.L.F. and K.D.-W.; field investigation, M.P.T. and C.V.; data curation, K.T.; writing—original draft preparation, M.P.T.; writing—review and editing, M.P.T., S.L.F., K.D.-W. and C.V.; visualization, M.P.T. and K.T.; supervision, M.P.T.; project administration, M.P.T.; funding acquisition, M.P.T. All authors have read and agreed to the published version of the manuscript.
Funding
This research was funded by U.S. Nuclear Regulatory Commission, contracts 31310019C0028 and 31310023C0012 and by the U.S. Geological Survey, grant G21AP10219. The views expressed in this paper are not necessarily those of the U.S. Nuclear Regulatory Commission or the U.S. Geological Survey. Any use of trade, firm, or product names is for descriptive purposes only and does not imply endorsement by the U.S. Government.
Data Availability Statement
Liquefaction data presented in Table 2 and Table A1 and shown on Figure 1 and Figure 2 are from several paleoliquefaction studies [3,10,11,12,20,39]. Data collected by Tuttle and collaborators can be downloaded as Excel files or Shapefiles from https://mptuttle.com/databases.html, accessed on 26 February 2025. Seismicity shown on Figure 1 and Figure 2 is from [6] at https://earthquake.usgs.gov/earthquakes/search/, accessed on 5 July 2024 [7,8] at https://www.sciencebase.gov/catalog/item/5d559635e4b01d82ce8e3fe7, accessed on 5 July 2024 and [9] at http://ceus-ssc.com/Report/Downloads.html, accessed on 5 July 2024. Geology and faults shown on Figure 1 and Figure 2 are from [13,14] at https://pubs.usgs.gov/of/2005/1325/, accessed on 29 February 2024 and from [15,16]. The U.S. Geological Survey shaded relief base map used in the inset on Figure 1 is from The National Map, https://basemap.nationalmap.gov/arcgis/rest/services/USGSShadedReliefOnly/MapServer, accessed on 8 February 2025. Geotechnical data used in liquefaction potential analysis and summarized in Table C1 was provided by staff of the Virginia Department of Transportation (VDOT) and downloaded from ArcGIS online https://www.arcgis.com/, accessed on 28 August 2023. Water-table depths and fluctuations were reviewed in VDOT borehole logs and historical well data available through U.S. Geological Survey Groundwater Data for the Nation https://waterdata.usgs.gov/nwis/gw?, accessed on 28 August 2023. Otherwise, all data in this paper were collected by the authors or derived from other published sources listed in the references.
Acknowledgments
Laurel Bauer of the U.S. Nuclear Regulatory Commission assisted with several river surveys and site visits. Mark Carter of the U.S. Geological Survey assisted with river survey and shared information about his findings along the Nottoway and South Anna rivers. Beta Analytic, Inc. and Geoluminescence Dating Research Lab at Baylor University dated samples. Thanks to the property owners who gave us permission to access rivers and to the National Park Service for the research permit to work along rivers within the George Washington Birthplace National Monument. Rasool Anooshepoor (formerly of the U.S. Nuclear Regulatory Commission) provided guidance and support through the course of this research. Thomas Weaver of the U.S. Nuclear Regulatory Commission and three anonymous reviewers provided helpful comments and suggestions that improved this manuscript.
Conflicts of Interest
The authors declare no conflicts of interest. Laurel Bauer of the U.S. Nuclear Regulatory Commission and Mark Carter of the U.S. Geological Survey assisted with field work. However, neither they nor any other member of the U.S. Nuclear Regulatory Commission or the U.S. Geological Survey had any role in the design of the study; analyses or interpretation of data; or in the writing of this manuscript. Thomas Weaver of the U.S. Nuclear Regulatory Commission reviewed the manuscript and made several suggestions that helped clarify certain points and granted permission to submit the manuscript for publication.
Abbreviations
The following abbreviations are used in this manuscript:
| B.P. | Before present (before 1950 C.E.) |
| BS | Below surface |
| 14C | Radiocarbon |
| C | Confidence |
| CVSZ | Central Virginia seismic zone |
| C.E. | Common era |
| D.C. | District of Columbia |
| ID | Identification |
| M | Moment magnitude |
| NRC | Nuclear Regulatory Commission |
| NSHM | National seismic hazard model |
| OSL | Optically-stimulated luminescence |
| U.S. | United States |
| WL | Water level |
Appendix A. Study Sites
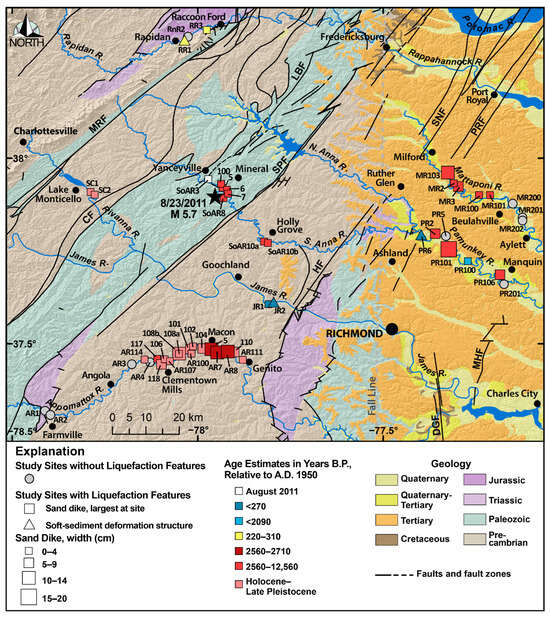
Table A1.
Summary of information gathered at study sites in the CVSZ.
Table A1.
Summary of information gathered at study sites in the CVSZ.
| Site | Latitude Longitude | Cutbank Exposure 1 | Liquefaction Feature 1,2 | Weathering of Feature | Constraining Ages (yr B.P.) 1,3 |
|---|---|---|---|---|---|
| Appomattox River | |||||
| AR1 | 37.3178 −78.4098 | 2.35 m high—loose sand layer at surface, overlying brown, micaceous, fine-medium sand fining upward to silt; below the silt is mottled, silty, sand and silt; probe: same as above with thin (5–10 cm) sand layers; rock 1 m BWL | None | Not applicable | Modern AR1-OSL1 from base of upper sandy unit; ≤23,190 ± 1525 AR1-OSL2 from base of lower silty unit |
| AR2 | 37.3063 −78.3956 | 2 m high—loose sand layer at surface, underlain by reddish brown, silt followed by interbedded grayish silt & brownish sand (3–5 cm); micaceous | None | Not applicable | Modern AR1-OSL1 from upper sandy unit; ≤23,190 ± 1525 AR1-OSL2 from lower silty unit |
| AR3 | 37.4433 −78.1759 | 3 m high—loose sand layer at surface, overlying reddish brown, micaceous silty fine sand, underlain by mottled silty sand, silt, clayey silt, and sandy silt with lines of pebbles & lenses of pebbly coarse sand; probe: same as above with several thin layers of sand to 1.25 m BWL | None | Not applicable | ≤260 AR3-C1 from base of upper sandy sand; 2570 ± 130 AR3-OSL2 from mottled silt; >46,390 AR3-OSL3 from pebble lense within lower portion sandy silt |
| AR4 | 37.4487 −78.1266 | 3 m high—sand underlain by mottled very fine sandy silt followed by mottled interbedded silt and sand; probe: same as above; pebbly sand at 1 m BWL | None | Not applicable | >53,940 AR4-OSL1 from sand layer in interbedded silt & sand near base of cutbank |
| AR5 | 37.4845 −77.9629 | 3 m high—lower meter exposed; yellowish-red, micaceous, sandy silt, with pebbles and cobbles; probe: sandy silt followed by sand at 1.4+ m BWL | C2: Three dikes, 10, 1, & 0.5 cm wide, intrude cracks and extend to 2.4 m BS | Bioturbated & mottled; dike margins, iron stained | 2560–3615 >2560 AR8-OSL1; <3615 AR8-OSL2; <26,525 ± 2195 AR5-OSL1 |
| AR6 | 37.4815 −77.9531 | 2.5 m high—lower 2 m exposed; mottled, sandy silt; probe to 1.6 m BWL: similar to above except for layers of sand up to 15 cm thick | C2: One, 2 cm wide dike, branches upward, extends to 1.9 m BS | Bioturbated & mottled, especially upper part of dikes | 2560–3615 >2560 AR8-OSL1; <3615 AR8-OSL2 |
| AR7 | 37.4794 −77.9474 | 3 m high—lower 2.5 m exposed; mottled, silty sand that fines upward; probe: silty sand underlain by 30 cm layer of sand | C1: One, 12 cm wide, dike feeds into small diapir and two, 2 cm wide dikes that extend to 2.35 m BS | Bioturbated & mottled, especially upper part of dike; iron staining along lower margins | 2560–3615 >2560 AR8-OSL1; <3615 AR8-OSL2; <24,650 ± 995 AR7-OSL1 |
| AR8 | 37.4783 −77.9193 | 3.8 m high—lower 2.3 m exposed; silty sand underlain by silt loam developed in mottled silt with manganese nodules, underlain by mottled silty sand; probe to 1.5 m BWL: same as above for 82 cm, followed by 12 cm of sand and 56 cm of silty sand | C1: Six dikes—10, 8, 7, 3, 2, & 2 cm wide, extend to 1.76 m BS; discontinuous portion of dikes continues upsection to 1.55 m BS; krotovina casts injected by sand dikes and continue higher in section; older dikes crosscut by younger dikes | Older dikes—iron stained, mottled, & bioturbated especially margins; younger dikes, uweathered | Older dikes, 2560–3615 >2560 AR8-OSL1; <3615 AR8-OSL2; younger dikes, probably historic <270 |
| AR100 | 37.4722 −78.0167 | 3 m high—drab silt underlain by reddish, silty sand followed by bioturbated and mottled silt and silty sand with Fe & Mn staining and few nodules, pebbly near base of unit, underlain by loose, fine-medium sand to pebbly medium-coarse sand; rock outcrop at WL | C1: Seven dikes, 3, 3, 3, 3, 2, 1, & 0.5 cm wide, and one sill, 5 cm thick; several dikes extend to 2 m BS into reddish, silty sand; sill intrudes along base of reddish, silty sand; dikes branch upward from sill and extend to 1 m BS pinching out in drab silt | Dikes & sill bioturbated and mottled | <74,340 AR100-OSL1 from drab silt provides maximum age constraint for dikes higher in cutbank; <86,440: AR100-OSL3 from mottled silty sand provides maximum age constraint for dikes and sills lower in cutbank; provides minimum age constraint for source sand of dikes |
| AR101 | 37.4843 −78.0194 | 3.4 m high—drab silt underlain by reddish, silty sand followed by bioturbated and mottled silty sand with Fe and Mn staining | C1: Four dikes, 8.5, 6, 3, & 3 cm wide, & one sill, 3 cm thick; sill intruded within mottled silty sand; three dikes branch upward from sill, two dikes extend into reddish, silty sand and pinch at 2 m BS | Dikes biotur-bated & mottled; finer portions of sill gleyed, coarser portion Fe-stained | <77,540 AR100-OSL2 from reddish, silty sand provides maximum age constraint for dikes that pinch out in this unit <86,440 AR100-OSL3 from mottled silty sand provides maximum age constraint for dikes and sills lower in cutbank |
| AR102 | 37.4914 −78.0125 | 2.8 m high—brown, sandy loam underlain by drab silt followed by mottled silty sand with Fe & Mn staining which becomes pebbly sand near base of cubank | C2: Two dikes, 4 & 3 cm wide; both crosscut mottled silty sand & extend into drab silt, pinching at 1.7 and 1.6 m BS | Bioturbated & mottled | <77,540 AR100-OSL2 from reddish, silty sand provides maximum age constraint for sand dikes |
| AR103 | 37.4952 −77.9974 | 3.2 m high—upper 0.5 m covered by vegetation & roots; drab silt underlain by reddish, silty sand | C3: One possible dike, 3.5 cm wide; crosscuts reddish, silty sand, extends into drab silt, pinching at 1.2 m BS | Not noted | <74,340 AR100-OSL1 from drab silt provides maximum age constraint for dikes that terminate higher in cutbank |
| AR104 | 37.4862 −77.9859 | 3.9 m high—upper 1–2 m covered by vegetation & slump; mottled silt underlain by mottled, interbedded sandy silt & sand; layers of pebbly sand and coarse-medium sand towards bottom of cutbank | C2: Two dikes, 5 & 2.5 cm wide; one originates in pebbly sand, crosscuts interbedded sandy silt & sand, extends into mottled silt, pinching at 2 m BS; slump covers upper part of second dike | Bioturbated & mottled | <86,440 AR100-OSL3 from mottled silty sand provides maximum age constraint |
| AR105 | 37.4559 −78.0924 | 3 m high—upper 1.5 m covered by vegetation; reddish brown, silt underlain by reddish, silty sand; probe: same as above to cemented layer at 0.5 m BWL; finer below | C3: Two possible dikes, 2 & 2 cm wide; intrude red-dish, silty sand; one dike branches upward & pinches at contact with overlying silt at 1.9 m BS; other dike pinches within silty sand | Bioturbated & mottled | <19,420 ± 695 AR106-OSL1 from reddish, sand provides maximum age constraint for dikes |
| AR106 | 37.4570 −78.0892 | 3 m high—upper 1.5–2 m covered by vegetation; mottled silty sand underlain by reddish, medium-fine sand, micaceous; probe: loose sand to 0.25 m BWL, then difficult to push probe | C2: Two dikes, 3 & 1 cm wide; both dikes originate in reddish, medium-fine sand, widen below contact with overlying mottled silty sand, branch into multiple dikes that extend into overlying silty sand, pinching at 2.1–2.0 m BS | Bioturbated & mottled | <19,420 ± 695 AR106-OSL1 from reddish, sand provides maximum age constraint for dikes |
| AR107 | 37.4523 −78.0746 | 3 m high—upper 1.5 m covered by vegetation; reddish, slightly sandy silt with few pebbles lines, and interbeds of sand towards bottom of cutbank; probe: cemented pebbly sand BWL | C2: Two dikes, 2 & 1 cm wide, crosscut reddish silt & sandy interbed, branch upward, & pinch at 2.4 m BS and 2.7 m BS; dikes proba-bly originate in pebbly sand BWL | Bioturbated & mottled | <19,420 ± 695 AR106-OSL1 from reddish, sand provides maximum age constraint for dikes |
| AR108a | 37.4717 −78.0508 | 3 m high—upper 1.5 m covered by vegetation; reddish silty sand followed by bioturbated & mottled silty sand with Fe & Mn staining; gray, silty very fine sand at WL | C1: Three dikes, 2.5, 2, & 0.5 cm wide; two larger dikes originate in silty, very fine sand near base of cutbank, crosscut mottled, silty sand and reddish, silty sand, branching upward & pinching at 1.6 m BS | Bioturbated & mottled | <18,960 ± 880 AR108b-OSL1 from reddish brown silty sand and adjacent to dike tip provides maximum age constraint |
| AR108b | 37.4721 −78.0501 | 3 m—drab silt underlain by reddish brown and reddish, silty sand followed by bioturbated & mottled silty sand with Fe & Mn staining | C1: Two dikes, 12 & 6 cm wide; crosscut mottled, silty sand, and reddish, silty sand, branch upward, and pinch out at 1.7 m and 1.55 m BS; composition of dikes similar to source layer observed at nearby OSL108a | Bioturbated & mottled | <18,960 ± 880 AR108b-OSL1 from reddish brown silty sand provides maximum age constraint |
| AR109 | 37.4717 −78.0289 | 3 m high—upper 1.5 m covered by vegetation and colluvium; mottled silty sand; probe: same as above | C3: Two possible dikes, 3 & 2 cm wide; crosscut mottled, silty sand, pinch at 2.3 and 2.2 m BS | Bioturbated & mottled; difficult to track | Probably similar in age to dikes at AR108 |
| AR110 | 37.4768 −77.9165 | 3.7 m high—upper 1.4 m covered by vegetation; loose, silty, medium-fine sand underlain by reddish, silty sand, followed by bioturbated sandy silt and silty sand with Fe & Mn staining and large krotovina casts; probe: medium-fine sand underlain by rock at 0.3 m BWL | C1–2: Three dikes, 7, 4, & 2.5 cm wide; crosscut bioturbated and mottled, silty sand and sandy silt, branching upward; one dike extends into reddish, silty sand, becomes discontinuous and pinches at 1.45 m BS; two other dikes pinch in mottled sandy silt | Bioturbated & mottled | <13,055 ± 620 AR110-OSL2 from reddish, silty sand and adjacent to dike tips provides maximum age constraint; other dikes probably similar in age |
| AR111 | 37.4554 −77.8782 | 3 m high—upper 2 m vegetated; bioturbated & mottled silt; probe: similar to above, underlain by sand 0.5–0.76 m BWL, cemented | C2: One dike, 2 cm wide; intrudes mottled silt, branches laterally and upward, and pinches at 2.6 m BS | Bioturbated & mottled; lower 10 cm gleyed | Correlation uncertain |
| AR112 | 37.4535 −78.1480 | 2.5 m high—upper 1 m covered by vegetation; reddish sand underlain by mottled silty clay with pebble lines; probe: similar to above, underlain by sand 0.45–0.7 m BWL, followed by rock | C3: Two possible dikes: 1.5 & 1 cm wide; subvertical near base of cutbank, branch and become low-angle dikes upsection; pinch at 1.8 and 2.1 m BS | Gleyed; difficult to trace | <19,160 ± 840 AR112-OSL1 from mottled, silty clay and adjacent to dike tip provides maximum age constraint |
| AR113 | 37.4559 −78.1462 | 3 m high—upper 1 m covered by vegetation; reddish sand underlain by mottled silty sand | C3: Two dikes: largest up to 9 cm wide, branches upward and terminates at 2.05 m BS; 1 cm wide dike with lateral continuity extends upward from krotovina cast, also pinches within silty sand | Bioturbated margins; gleyed | <19,160 ± 840 AR112-OSL1 probably provides maximum age constraint |
| AR114 | 37.4563 −78.1434 | 3 m high—upper 0.5 m loose sand, deposited on reddish sand underlain by mottled, silty sand & interbedded silt and sand, lower 30 cm Fe & Mn stained; probe: similar to above, with sand from 0.1–1 m BWL, followed by rock | C2: Three dikes, 2.5, 1.5, 1 cm wide, one dike originates below water level, other two originate in sand layers within interbedded silt & sand unit; two dikes pinch at 2.4 m BS in another sand layer | Bioturbated margins; gleyed | <28,485 ± 1175 AR115-OSL1 from mottled, silty sand with Fe & Mn staining provides maximum age constraint |
| AR115 | 37.4546 −78.1318 | 3.8 m high—upper 0.5 m covered by vegetation; 1.9 m reddish sand underlain by mottled silty sand, lower 0.3 m Fe & Mn stained; probe: similar to above, underlain by sand from 0.45–1 m BWL, followed by rock | C3: One possible dike: 2 cm wide; intrudes mottled silty sand and pinches at 3.24 m BS | Bioturbated & mottled | <28,485 ± 1175 AR115-OSL1 from mottled, silty sand with Fe & Mn staining & adjacent to dike tip provides maximum age constraint |
| AR116 | 37.4488 −78.1268 | 3 m high—upper 0.5 m covered by vegetation; reddish sand underlain by mottled silty sand, lower 0.5 m Fe & Mn stained | C3: One possible dike: 1 cm wide; intrudes mottled silty sand & pinches 2.3 m BS; also, two smaller discontinuous dikes; all within a 10 cm wide zone | Bioturbated margins; gleyed | <4100 ± 135 AR117-OSL1 from mottled, silty sand provides maximum age constraint |
| AR117 | 37.4495 −78.1055 | 4 m high—upper 2.75 m vegetated; brownish silt with crumb structure, likely soil, coars-ening downward to mottled silty sand, lower 0.5 m Fe & Mn stained; probe: similar to above, underlain by sand from 0.3–1.45+ m BWL | C2: Two dikes: 4 & 4 cm wide, intrude silty sand, branch upward, & terminate at 3.2 m BS at base of likely soil | Bioturbated & mottled | <4100 ± 135 AR117-OSL1 from mottled, silty sand and adjacent to dike terminations at base of likely soil provides maximum age constraint |
| AR118 | 37.4430 −78.0973 | 3 m high—upper 1 m drab silt underlain by reddish sand; followed by mottled, silty clay, lower 0.3 m Fe & Mn stained | C2: Three dikes—4.5, 4, and 1.5; intrude silty clay and branch upward; two dikes terminate within silty clay; third dike extends into reddish sand and pinches at 2.2 m BS | Bioturbated margins; gleyed | <19,420 ± 695 AR106-OSL1 from reddish, sand provides maximum age constraint for dikes |
| Mattaponi River | |||||
| MR200 | 37.8765 −77.1492 | 1 m high—mottled silt, underlain by interbedded pebbly, white sand and gray silt; pebbles at WL | None | Not applicable | ≤470 MR200-C1 about 0.75 m BS from silty sand |
| MR201 | 37.8390 −77.1229 | 6 m high—exposure of lower 4 m; sand, underlain by bioturbated and mottled silty sand, followed by brownish clayey silt with subvertical joints; probe: same as above for 50 cm, followed by 50+ cm of sand | None | Not applicable | ≤37,671 MR201-W1 4.1 m BS from mottled silty sand |
| MR202 | 37.8309 −77.1224 | 6 m high—exposure of lower 2 m; pebbly sand, underlain by bioturbated and mottled silty sand, followed by brownish clayey silt with subvertical joints; probe: same as above, for 25 cm, followed by sand | None: root casts & joints filled with loose silt and sand | Not applicable | 37,671 MR201-W1 4.1 m BS from mottled silty sand |
| Nottoway River | |||||
| NR1 | 36.8708 −77.4575 | 4 m high—reddish brown silt loam, underlain by reddish clayey silt followed by coarse-medium sand | None | Not applicable | 140–170 NR1-OSL1 from clayey silt; >39,940 NR1-OSL2 from coarse-medium sand |
| Pamunkey River | |||||
| PR2 | 37.7972 −77.3603 | 4–4.5 m high—upper 2.5 m vegetated, exposure of lower 1.5 m; reddish, silty very fine sand followed by mottled, very fine sandy silt, underlain by mottled silt; probe: silt with 5 cm thick sand layers | C2: Four sand dikes—2.7–7.3 cm wide, extend to about 3.5 cm BS; tabular, branch & narrow up-section | Upper part of dikes biotur-bated & iron stained | <8075 ± 305 PR2-OSL1 from mottled sandy silt, level of dike tips; ≤16,345 ± 675 PR2-OSL2 from silty sand, base of cutbank |
| PR5 | 37.7893 −77.3297 | 4–5 m high—silty fine sand with pebbles underlain by white sand followed by mottled clayey silt | None | Not applicable | ≤4618–4818 PR5-C2 from lower part of white sand |
| PR100 | 37.7218 −77.2731 | 3.5 m high—exposure of lower 0.6 m; mottled silt | C2: Two, 4 cm & 0.5 cm wide sand dikes; intrude mottled silt and extend to 3.3 and 3.1 m BS | Upper part of dikes some-what bioturbated | <1990 ± 100 PR100-OSL1 3.3 m BS from mottled silt level with lower dike tips |
| PR201 | 37.6591 −77.1723 | 1.85 m high—fairly well-exposed; upper unit of reddish pebbly sand fines upward to yellowish sand; underlain by mottled, silt with manganese nodules; probe: silt with interbeds of sand | None | Not applicable | ≤13,065 ± 645 PR201-OSL2 1 m BS from base of upper sandy unit; ≤14,590 ± 790 PR201-OSL1 1.6 m BS from reddish silt |
| Rapidan River | |||||
| RnR1 | 38.3186 −78.0359 | 4 m high—exposure of lower 1.5 m; iron-stained, interbedded sand & silt, underlain by gray silt containing rock fragments, followed by mottled sandy silt; probe: 75 cm thick sandy silt followed by rock | C2: SSDs—Pseudonodules, diapirs, and flames | Iron stained | 215–310 RnR1-OSL1 & OSL2 bracket age of SSDs; 142–1818 RnR1-C1 & C2 bracket age of SSDs |
| RnR2 | 38.3220 −78.0342 | 2 m high—lower 1 m exposed; loose & unweathered, interbedded sand & silty sand | None | Not applicable | Modern RnR2-C1 from unweathered silty sand |
| RnR3 | 38.3469 −77.9761 | 3 m high—lower 1.5 m exposed; reddish silt with thin layers of sand overlying bioturbated & mottled silt & sand; probe: 50 cm of inter-bedded silt & sand followed by rock | C2: Sand dike—1 cm wide, extends to 2.75 m BS; possibly related sandy domains in bioturbated and mottled silt; flames of sand at 2.6 m BS | Dike, gleyed; flames, iron stained | 215–310 probably formed at same time as SSDs at RnR1; ≤330 ± 15 RnR3-OSL1 provides maximum age constraint for dike and flames |
| Rivanna River-Stiggers Creek | |||||
| RR-SC2 | 37.9087 −78.2884 | 4.7 m high—upper 2.5 m covered by vegeta- tion, lower 2.2 m well exposed; reddish silt with lenses of cobbles and pebbles, underlain by some-what mottled silty fine sand grading downward to mottled silty medium-fine sand, followed by cobbly, pebbly sand | C1: Four dikes—2, 2, 1, 1 cm wide originate in cobbly, pebbly sand & medium-fine sand, crosscut silty fine sand, branch upward and pinch at contact with over-lying reddish silt; one dike extends into overlying silt & pinches at 2.9 m BS | Bioturbated & mott-led | <12,030 ± 525 RR-SC2-OSL1 near dike tip provides max constraining age; 24,140 ± 1105 RR-SC2-OSL 3 from source layer of dikes |
| South Anna River | |||||
| SoAR7 | 37.9158 −77.9307 | 2 m high—upper 1 m somewhat vegetated, lower 1 m well exposed; interbedded silt and sand underlain by mottled clayey silt; probe to 1.5 m BWL: clayey silt, underlain by 90 cm of sand, followed by silt | C2: Sand dikes—1 to 1.5 cm wide, branch upward; extends to 1 m BS | Mottling in dikes | <5891 SoAR7-C4 from root cast in mottled clay silt crosscut by dikes; <9015 ± 310 SoAR7-OSL1 from mottled clayey silt |
| SoAR10a | 37.7760 −77.8219 | 2 m high—exposure of lower 1 m; bioturbated and mottled, sandy silt | C2: Sand dike—4 cm wide, branches upward; extends to 1.7 m BS | Some bioturbation & mottling | <8696 SoAR10a-C1 from mottled sandy silt, 20 cm below dike tip |
| SoAR10b | 37.7761 −77.8217 | 2.5 m high—exposure of lower 1.25 m; drab silt underlain by mottled silt & sand, with hint of layering, followed by interbedded silty sand & silt; probe: same above to 50 cm BWL, followed by coarser sand for 10 cm to rock | C2: Silty sand dikes—4 cm, 2 cm, 2 cm, 1 cm wide, branch upward; two dikes extend to 1.45 m BS, discontinuous to 1.25 m BS; two other dikes intrude polygonal cracks | Some bioturbation & mottling in upper part of dikes | <8696 SoAR10a-C1 from mottled sandy silt, 20 cm below dike tip; <13,800 ± 530 SoAR10b-OSL2 from interbedded sand & silt, 98 cm below dike tips |
1 Abbreviations: BWL = below water level; WL = water level; BS = below ground surface/top of cutbank. 2 Confidence (C): 1 = high; 2 = medium; 3 = low. Liquefaction features with C values of 1 and 2 are shown in Figure 1, Figure 2 and Figure A1. 3 Calibrated 14C and OSL ages in years B.P. or before 1950 C.E.; <= after, >= before.
Appendix B. Dating Results
Table B1.
Results of radiocarbon dating of samples collected at study sites in the CVSZ.
Table B1.
Results of radiocarbon dating of samples collected at study sites in the CVSZ.
| Site-Sample Lab No. 1 | 13C/12C Ratio | Conventional 14C Age Yr B.P. 2 | Calibrated Age Yr B.P. 3 1-Sigma | Calibrated Calendar Date 3 1-Sigma | Prob. % | Calibrated Age Yr B.P. 3 2-Sigma | Calibrated Calendar Date 3 2-Sigma | Prob. % | Sample Description 4 |
|---|---|---|---|---|---|---|---|---|---|
| Appomattox River | |||||||||
| AR3-C1 BA633122 | −26.5 | 120 ± 30 | 29–47 56–120 124–142 222–233 238–260 | AD 1921–1903 AD 1894–1830 AD 1826–1808 AD 1728–1717 AD 1712–1690 | 9.2 34.3 8.4 5.3 11 | 10–151 186–198 210–270 | AD 1940–1799 AD 1764–1752 AD 1740–1680 | 67.2 2.4 25.8 | Charred material from silty fine sand ~3 cm above buried soil; 62 cm BS |
| Mattaponi River | |||||||||
| MR200-C1 BA609013 | −25.9 | 350 ± 30 | 322–377 428–470 | AD 1628–1573 AD 1522–1480 | 38 30.2 | 315–411 420–490 | AD 1635–1539 AD 1530–1460 | 55.4 40 | Charred material from silty very fine sand; collected 75 cm BS |
| MR201-W1 BA609014 | −21.6 | 32,940 ± 230 | 36961–37671 | BC 35012–35722 | 68.2 | 36679–38474 | BC 36525–34730 | 95.4 | Flat piece of wood from mottled silty sand; collected 10 cm above clayey silt; 4.1 m BS |
| Pamunkey River | |||||||||
| PR5-C2 BA647238 | −24.6 | 4150 ± 30 | 4618–4726 4750–4765 4788–4818 | 2669–2777 BC 2801–2816 BC 2839–2869 BC | 48.3 6.5 13.4 | 4575–4825 | BC 2626–2876 | 95.4 | Organic sediment from basal portion of white sand; 1.5 m AWL & 3.5 m BS; 15 cm above mottled clayey silt |
| Rapidan River | |||||||||
| RnR1-C1 BA609015 | −24.3 | 1850 ± 30 | 1714–1750 1760–1792 1810–1818 | AD 236–200 AD 190–158 AD 140–132 | 35.4 26 6.8 | 1644–1652 1702–1830 | AD 306–298 AD 248–120 | 1.1 94.3 | Charred material from mottled very fine sandy silt; collected 35 cm below SSD & 3.55 m BS |
| RnR1-C2 BA609016 | −25.4 | 170 ± 30 | Post 0–28 142–154 168–222 260–282 | Post AD 1950– 1922 AD 1808–1796 AD 1782–1728 AD 1690–1668 | 16.1 6.5 32.6 13 | Post 0–43 60–118 135–230 250–290 | Post AD 1950– 1907 AD 1890–1832 AD 1815–1720 AD 1700–1660 | 19.5 12.5 46.1 17.4 | Charred material from mottled sand within interbedded sand & silt; collected 30 cm above SSD & 3.08 m BS |
| RnR2-C1 BA609017 | −24.6 | 100.88 ± 0.38 pMC | −5 to −6 | AD 1955–1954 | 68.2 | −5 to −6 | AD 1955–1954 | 95.4 | Charred material from unweathered silty sand; collected 1.4 m BS |
| South Anna River | |||||||||
| SoAR7-C4 BA647240 | −23.7 | 5030 ± 30 | 5722–5760 5815–5891 | BC 3773–3811 BC 3866–3942 | 21.8 46.4 | 5661–5694 5707–5897 | BC 3712–3745 BC 3758–3948 | 7.6 87.8 | Organic sediment; from root cast in mottled clayey silt; 1.5 m BS |
| SoAR10a-C1 BA647241 | −23.4 | 7860 ± 30 | 8592–8649 8673–8696 | BC 6643–6700 BC 6724–6747 | 56 12.2 | 8549–8575 8585–8772 | BC 6600–6626 BC 6636–6823 | 3.9 91.5 | Organic sediment; from mottled very fine sandy silt; 1.8 m BS; 20 cm below dike tip |
1 BA abbreviation for Beta Analytic, Inc. 2 Beta Analytic, Inc determined conventional radiocarbon ages in years B.P. or before present (1950). Errors represent 1 standard deviation statistics or 68% probability. 3 Beta Analytic, Inc., determined calibrated age ranges and calendar dates using the high probability density range method [28] and INTCAL20 [29]. 1-sigma error ranges represent 68.2% probability and 2-sigma ranges represent 95.4% probability. 4 Abbreviations: BS—below ground surface/top of cutbank.
Table B2.
Results of radiocarbon dating of samples collected in the CVSZ during prior study [20].
Table B2.
Results of radiocarbon dating of samples collected in the CVSZ during prior study [20].
| Site-Sample Lab No. 1 | 13C/12C Ratio | Conventional 14C Age Yr B.P. 2 | Calibrated Age Yr B.P. 3 1-Sigma | Calibrated Calendar Date 3 1-Sigma | Calibrated Age Yr B.P. 3 2-Sigma | Calibrated Calendar Date 3 2-Sigma | Sample Description 4 |
|---|---|---|---|---|---|---|---|
| James River | |||||||
| JR1-C2 BA414596 | −28.6 | 130 ± 30 | Post 0 15–40 60–150 190–195 215–230 240–270 | Post AD 1950 AD 1935–1910 AD 1890–1800 AD 1760–1755 AD 1735–1720 AD 1710–1680 | Post 0–150 170–280 | Post 1950-AD 1800 AD 1780–1670 | Plant material from leaf mat 22 cm below dike base |
| Mattaponi River | |||||||
| MR102-C1 BA546852 | −25.6 | 2490 ± 30 | 2495–2597 2611–2638 2683–2711 | BC 546–648 BC 662–689 BC 734–762 | 2459–2730 | BC 510–781 | Charred material, from sand 66 cm below silt/sand contact; sand likely source of dikes |
| MR104-C1 BA547638 | −24.8 | 6140 ± 30 | 6958–7028 7057–7068 7112–7155 | BC 5009–5079 BC 5108–5119 BC 5163–5206 | 6951–7158 | BC 5002–5209 | Charred material from sand 15 cmbelow mottled sandy silt/sand contact; sand likely source of dikes |
| Pamunkey River | |||||||
| PR5-C1 BA414591 | −26.0 | 4800 ± 30 | 5485–5525 5580–5590 | BC 3535–3575 BC 3630–3640 | 5475–5550 5575–5595 | BC 3525–3600 BC 3625–3645 | Charred material; from mottled silt 25 cm AWL |
| PR6-W1 BA414592 | −29.7 | 270 ± 30 | 295–310 | AD 1655–1640 | 155–165 285–320 375–430 | AD 1795–1785 AD 1665–1630 AD 1575–1520 | Plant material; from leaf layer at water level |
| PR101-C1 BA547635 | −27.1 | 2860 ± 30 | 2925–3007 3013–3032 | BC 976–1058 BC 1064–1083 | 2878–3067 | BC 929–1118 | Charred material; collected from mottled sandy silt & silt intruded by diapirs and dike |
| PR106-C1 BA547636 | −25.7 | 5990 ± 30 | 6789–6860 6870–6881 | BC 4840–4911 BC 4921–4932 | 6741–6907 | BC 4792–4958 | Charred material; collected from mottled silt intruded by dikes |
| South Anna River | |||||||
| SoAR100-C1 BA414599 | −26.3 | 3930 ± 30 | 4360–4365 4405–4420 | BC 2410–2415 BC 2455–2470 | 4290–4435 | BC 2340–2485 | Plant material from sand 125 cm BWL |
See Table B1 for footnotes.
Table B3.
Results of optically-stimulated luminescence dating of quartz grains from samples collected in the CVSZ.
Table B3.
Results of optically-stimulated luminescence dating of quartz grains from samples collected in the CVSZ.
| Site-Sample Lab No. Depth (m) | Aliquots a | Grain Size (µm) | Equivalent Dose (De) (Gy) b | Over-Dispersion (%) c | U (ppm) d | Th (ppm) d | K2O (%) d | Rb (ppm) | H20 (%) | Cosmic Dose Rate (mGray/yr) e | Dose Rate (mGray/yr) | OSL Age (Yr) f | OSL Age Yr. B.P. (AD 1950) | Sample Description |
|---|---|---|---|---|---|---|---|---|---|---|---|---|---|---|
| Appomattox River | ||||||||||||||
| AR100-OSL1 BG5814 1.00 | 10/10 | 150–250 | >160 | NA | 2.59 ± 0.01 | 6.62 ± 0.01 | 1.67 ± 0.01 | 61.3 ± 0.1 | 20 ± 3 | 0.185 ± 0.018 | 2.15 ± 0.06 | >74,400 | >74,340 | Drab, silt; adjacent to dike tip |
| AR100-OSL2 BG5813 1.30 | 8/8 | 150–250 | >160 | NA | 2.30 ± 0.01 | 6.37 ± 0.01 | 1.65 ± 0.01 | 52.8 ± 0.1 | 20 ± 3 | 0.182 ± 0.018 | 2.06 ± 0.05 | >77,600 | >77,540 | Reddish, silty sand; crosscut by dikes |
| AR100-OSL3 BG5812 2.45 | 10/10 | 250–355 | >160 | NA | 2.24 ± 0.01 | 3.03 ± 0.01 | 1.78 ± 0.01 | 43.0 ± 0.1 | 20 ± 3 | 0.161 ± 0.016 | 1.85 ± 0.05 | >86,500 | >86,440 | Mottled, silty sand with Mn nodules; above source sand |
| AR106-OSL1 BG5810 2.40 | 20/20 | 250–355 | 38.89 ± 1.14 | 11 ± 2 | 2.17 ± 0.01 | 5.87 ± 0.01 | 1.74 ±0.01 | 56.7 ± 0.1 | 20 ± 3 | 0.161 ± 0.016 | 1.99 ± 0.05 | 19,480 ± 695 | 19,420 ± 695 | Mottled, medium-fine sand; crosscut by dikes |
| AR108B-OSL1 BG5811 1.57 | 20/20 | 150–250 | 45.28 ± 1.67 | 15 ± 3 | 3.20 ± 0.01 | 8.62 ± 0.01 | 1.68 ±0.01 | 83.4 ± 0.1 | 20 ± 3 | 0.177 ± 0.018 | 2.38 ± 0.07 | 19,020 ± 880 | 18,960 ± 880 | Reddish brown, silty sand; adjacent to dike tip |
| AR110-OSL1 BG5815 1.40 | 19/20 | 250–355 | 23.90 ± 0.74 | 12 ± 3 | 1.53 ± 0.01 | 3.92 ± 0.01 | 1.70 ± 0.01 | 52.6 ± 0.1 | 20 ± 3 | 0.180 ± 0.018 | 1.76 ± 0.08 | 13,550 ± 740 | 13,490 ± 740 | Tan, medium-fine sand; above dike tips |
| AR110-OSL2 BG5816 1.50 | 20/20 | 250–355 | 24.14 ± 0.38 | 5 ± 1 | 1.84 ± 0.01 | 4.43 ± 0.01 | 1.69 ± 0.01 | 55.9 ± 0.1 | 20 ± 3 | 0.178 ± 0.018 | 1.84 ± 0.08 | 13,115 ± 620 | 13,055 ± 620 | Reddish, silty sand; adjacent to dike tips |
| AR110-OSL3 BG5817 2.40 | 20/20 | 250–355 | 33.35 ± 0.70 | 7 ± 2 | 2.50 ± 0.01 | 6.53 ± 0.01 | 1.82 ± 0.01 | 73.7 ± 0.1 | 20 ± 3 | 0.161 ± 0.016 | 2.14 ± 0.06 | 15,575 ± 550 | 15,515 ± 550 | Bioturbated and mottled, sandy silt |
| AR112-OSL1 BG5809 1.84 | 19/20 | 150–250 | 42.88 ± 1.45 | 14 ± 3 | 3.05 ± 0.01 | 8.21 ± 0.01 | 1.54 ± 0.01 | 69.5 ± 0.1 | 20 ± 3 | 0.172 ± 0.017 | 2.23 ± 0.06 | 19,220 ± 840 | 19,160 ± 840 | Mottled, silty clay; near dike tip |
| AR115-OSL1 BG5818 3.28 | 26/30 | 150–250 | 61.39 ± 1.84 | 13 ± 2 | 2.57 ± 0.01 | 7.45 ± 0.01 | 1.66 ± 0.01 | 67.1 ± 0.1 | 20 ± 3 | 0.147 ± 0.015 | 2.15 ± 0.06 | 28,545 ± 1175 | 28,485 ± 1175 | Mottled, silty sand; adjacent to dike tip |
| AR117-OSL1 BG5819 3.24 | 24/24 | 150–250 | 10.80 ± 0.21 | 4 ± 1 | 3.76 ± 0.01 | 9.22 ± 0.01 | 1.83 ± 0.01 | 83.4 ± 0.1 | 20 ± 3 | 0.148 ± 0.015 | 2.59 ± 0.07 | 4160 ± 135 | 4100 ± 135 | Mottled, silty sand; adjacent to dike tip |
| Nottoway River | ||||||||||||||
| NR1-OSL1 BG5826 2.40 | 19/20 | 150–250 | 0.74 ± 0.04 | 22 ± 4 | 4.26 ± 0.01 | 11.75 ± 0.01 | 2.44 ± 0.01 | 108.5 ± 0.1 | 20 ± 3 | 0.160 ± 0.016 | 3.24 ± 0.09 | 215 ± 15 | 155 ± 15 | Reddish, clayey silt |
| NR1-OSL2 BG5827 2.90 | 15/15 | 500–710 | >124 | NC | 1.82 ± 0.01 | 10.65 ± 0.01 | 3.52 ± 0.01 | 113.0 ± 0.1 | 20 ± 3 | 0.152 ± 0.015 | 3.05 ± 0.12 | >40,000 | >39,940 | Coarse-medium sand |
| Rapidan River | ||||||||||||||
| RnR1-OSL1 BG5823 3.00 | 20/20 | 150–250 | 0.94 ± 0.03 | 14 ± 2 | 2.51 ± 0.01 | 6.94 ± 0.01 | 3.11 ± 0.01 | 92.2 ± 0.1 | 20 ± 3 | 0.152 ± 0.015 | 3.07 ± 0.09 | 290 ± 15 | 230 ± 15 | Sand layer 20 cm above SSDs |
| RnR1-OSL2 BG5824 3.30 | 27/27 | 150–250 | 1.26 ± 0.04 | 18 ± 3 | 3.12 ± 0.01 | 9.49 ± 0.01 | 3.12 ± 0.01 | 84.9 ± 0.1 | 20 ± 3 | 0.147 ± 0.015 | 3.43 ± 0.10 | 355 ± 15 | 295 ± 15 | Sand layer 10 cm below SSDs |
| RnR3-OSL1 BG5425 2.75 | 18/20 | 150–250 | 1.29 ± 0.04 | 13 ± 2 | 3.81 ± 0.01 | 13.80 ± 0.01 | 2.29 ± 0.01 | 134.5 ± 0.1 | 20 ± 3 | 0.156 ± 0.016 | 3.17 ± 0.09 | 390 ± 15 | 330 ± 15 | Sand within interbedded silt & sand unit crosscut by dike |
| Rivanna River-Stigger Creek | ||||||||||||||
| RR-SC2-OSL1 BG5820 3.05 | 19/20 | 150–250 | 41.60 ± 1.33 | 12 ± 3 | 3.37 ± 0.01 | 11.70 ± 0.01 | 2.77 ± 0.01 | 116.5 ± 0.1 | 20 ± 3 | 0.151 ± 0.015 | 3.44 ± 0.10 | 12,090 ± 525 | 12,030 ± 525 | Reddish, silt; near dike tip |
| RR-SC2-OSL2 BG5821 3.30 | 20/20 | 150–250 | 68.69 ± 2.53 | 14 ± 3 | 3.12 ± 0.01 | 10.60 ± 0.01 | 2.72 ± 0.01 | 104.0 ± 0.1 | 20 ± 3 | 0.147 ± 0.015 | 3.13 ± 0.09 | 21,935 ± 1005 | 21,875 ± 1005 | Mottled, silty sand; crosscut by dikes |
| RR-SC2-OSL3 BG5822 3.92 | 23/23 | 150–250 | 75.98 ± 2.79 | 14 ± 3 | 3.22 ± 0.01 | 11.50 ± 0.01 | 2.64 ± 0.01 | 106.0 ± 0.1 | 20 ± 3 | 0.138 ± 0.014 | 3.14 ± 0.07 | 24,200 ± 1105 | 24,140 ± 1105 | Mottled, medium-fine sand; source layer of dikes |
a Aliquots measured and used to define De population by Central Age or Minimum Age Model [48]. b Equivalent dose calculated on a pure quartz fraction with ultra-small aliquots with 20–80 grains/aliquot and analyzed under blue-light excitation (470 ± 20 nm) by Single Aliquot Regeneration protocols (SAR) [49,50]. Equivalent dose (De) was calculated by Central Age or Minimum Age model when overdispersion values are <20% (at two sigma) and >20% (at two sigma) and assuming a normal data distribution [30,48]. c Overdispersion values reflects precision beyond instrumental errors; values of ≤20% (at 1 sigma limit) indicate low dispersion in equivalent dose values and defines a unimodal distribution. Values > 20% are associated with mixed equivalent dose signature reflecting multiple grain populations or partial solar resetting. d U, Th, Rb and K content analyzed by inductively coupled plasma-mass spectrometry by ALS Laboratories, Reno, NV, USA. e Includes a cosmic dose rate calculated from parameters in [51] and includes soft components [30]. f Systematic and random errors calculated in a quadrature at one standard deviation by the Luminescence Dating and Age Calculator (LDAC) [30]. Datum year is AD 2010. OSL ages determined at Geoluminescence Dating Research Laboratory, Dept. of Geosciences, Baylor University, Waco, TX, USA.
Table B4.
Recalculated results of optically-stimulated luminescence dating of quartz grains from samples collected in the CVSZ.
Table B4.
Recalculated results of optically-stimulated luminescence dating of quartz grains from samples collected in the CVSZ.
| Site-Sample Lab No. Depth (m) | Aliquots a | Grain Size (µm) | Equivalent Dose (De) (Gy) b | Over-Dispersion (%) c | U (ppm) d | Th (ppm) d | K2O (%) d | H2O (%) | Cosmic Dose Rate (mGray/yr) e | Dose Rate (mGray/yr) | OSL Age (Yr) f | OSL Age Yr. B.P. (AD 1950) | Sample Description |
|---|---|---|---|---|---|---|---|---|---|---|---|---|---|
| Appomattox River | |||||||||||||
| AR1-OSL1 BG5380 1.55 | 34/35 | 150–250 | 0.08 ± 0.01 | 52 ± 8 | 1.94 ± 0.01 | 5.27 ± 0.01 | 1.12 ± 0.01 | 20 ± 2 | 0.178 ± 0.018 | 1.58 ± 0.04 | 40 ± 5 | −20 ± 5 | Base of upper sandy unit |
| AR1-OSL2 BG5381 2.05 | 27/35 | 150–250 | 43.64 ± 2.76 | 23 ± 4 | 2.54 ± 0.01 | 7.56 ± 0.01 | 1.23 ± 0.01 | 20 ± 2 | 0.168 ± 0.017 | 1.89 ± 0.06 | 23,250 ± 1525 | 23,190 ± 1525 | Base of lower mottled silt unit |
| AR3-OSL1 BG5382 0.62 | 34/35 | 150–250 | 6.23 ± 0.23 | 17 ± 2 | 1.84 ± 0.01 | 4.34 ± 0.01 | 1.52 ± 0.01 | 20 ± 2 | 0.208 ± 0.021 | 1.79 ± 0.05 | 235 ± 15 | 175 ± 15 | Base of upper sandy unit |
| AR3-OSL2 BG5383 0.90 | 34/35 | 100–150 | 6.23 ± 0.23 | 7 ± 1 | 3.15 ± 0.01 | 7.44 ± 0.01 | 1.67 ± 0.01 | 20 ± 2 | 0.187 ± 0.019 | 2.34 ± 0.07 | 2630 ± 130 | 2570 ± 130 | Lower mottled silt unit; below buried soil |
| AR3-OSL3 BG5384 2.55 | 35/35 | 150–250 | >110 | NA | 3.14 ± 0.01 | 9.50 ± 0.01 | 1.64 ± 0.01 | 20 ± 2 | 0.159 ± 0.016 | 2.36 ± 0.07 | >46,450 | >46,390 | Pebble lense within silt unit |
| AR4-OSL1 BG5415 2.91 | 13/13 | 150–250 | >110 | NA | 2.03 ± 0.01 | 5.23 ± 0.01 | 1.69 ± 0.01 | 20 ± 2 | 0.153 ± 0.015 | 2.05 ± 0.06 | >54,000 | >53,940 | Sand layer in interbedded silt & sand unit |
| AR5-OSL1 BG5422 2.91 | 35/35 | 100–150 | 54.91 ± 4.47 | 28 ± 4 | 2.24 ± 0.01 | 6.25 ± 0.01 | 1.72 ± 0.01 | 20 ± 2 | 0.153 ± 0.015 | 2.06 ± 0.06 | 26,585 ± 2195 | 26,525 ± 2195 | From yellow-ish red, very fine sandy silt, micaceous |
| AR7-OSL1 BG5419 2.91 | 30/35 | 150–250 | 54.88 ± 1.64 | 17 ± 2 | 2.65 ± 0.01 | 7.27 ± 0.01 | 1.68 ± 0.01 | 20 ± 2 | 0.153 ± 0.015 | 2.21 ± 0.06 | 24,710 ± 995 | 24,650 ± 995 | From reddish, silty medium-fine sand with few pebbles |
| AR8-OSL1 BG5409 1.45 | 35/35 | 150–250 | 6.18 ± 0.10 | 8 ± 1 | 2.88 ± 0.01 | 7.60 ± 0.01 | 1.68 ± 0.01 | 20 ± 2 | 0.179 ± 0.018 | 2.26 ± 0.07 | 2715 ± 95 | 2655 ± 95 | Near base of upper unit of brownish, silty very fine sand |
| AR8-OSL2 BG5408 1.59 | 34/34 | 100–250 | 8.35 ± 0.14 | 9 ± 1 | 3.05 ± 0.01 | 7.30 ± 0.01 | 1.76 ± 0.01 | 20 ± 2 | 0.176 ± 0.018 | 2.33 ± 0.07 | 3550 ± 125 | 3490 ± 125 | From very fine sandy silt below silt loam |
| AR8-OSL3 BG5410 2.39 | 36/36 | 100–250 | 49.66 ± 1.57 | 17 ± 2 | 2.00 ± 0.01 | 5.58 ± 0.01 | 1.80 ± 0.01 | 20 ± 2 | 0.162 ± 0.016 | 2.05 ± 0.06 | 24,140 ± 1020 | 24,080 ± 1020 | From mottled, silty very fine sand of lower unit |
| James River | |||||||||||||
| JR1-OSL1 BG4000.B 3.42 | 30/35 | 100–150 | 0.63 ± 0.01 | 34 ± 5 | 1.99 ± 0.01 | 6.93 ± 0.01 | 1.52 ± 0.01 | 20 ± 3 | 0.139 ± 0.013 | 2.15 ± 0.06 | 290 ± 10 | 230 ± 10 | From layer in which dike terminates |
| Pamunkey River | |||||||||||||
| PR2-OSL1 BG5411 3.08 | 35/35 | 150–250 | 19.86 ± 0.63 | 18 ± 2 | 2.92 ± 0.01 | 10.55 ± 0.01 | 1.73 ± 0.01 | 20 ± 2 | 0.143 ± 0.016 | 2.43 ± 0.07 | 8135 ± 305 | 8075 ± 305 | Mottled sandy silt; level of dike tips |
| PR2-OSL2 BG5412 3.70 | 34/36 | 150–250 | 40.37 ± 1.25 | 16 ± 2 | 3.04 ± 0.01 | 10.05 ± 0.01 | 1.78 ± 0.01 | 20 ± 2 | 0.140 ± 0.014 | 2.46 ± 0.07 | 16,405 ± 675 | 16,345 ± 675 | Silty sand near bottom of cutbank |
| PR100-OSL1 BG5418 3.33 | 37/40 | 150–250 | 4.81 ± 0.18 | 22 ± 3 | 2.72 ± 0.01 | 9.15 ± 0.01 | 1.74 ± 0.01 | 20 ± 2 | 0.146 ± 0.015 | 2.33 ± 0.07 | 2050 ± 100 | 1990 ± 100 | Mottled sandy silt; level with continuous portion of dike tips; 20 cm below discontinuous portions of dikes |
| PR201-OSL2 BG5414 1.0 | 34/35 | 250–500 | 19.36 ± 0.78 | 22 ± 3 | 3.00 ± 0.01 | 3.89 ± 0.01 | 0.86 ± 0.01 | 20 ± 2 | 0.185 ± 0.018 | 1.47 ± 0.05 | 13,125 ± 645 | 13,065 ± 645 | Base of upper pebbly sand unit |
| PR201-OSL1 BG5413 1.6 | 27/35 | 100–150 | 47.19 ± 2.19 | 22 ± 3 | 7.70 ± 0.01 | 9.76 ± 0.01 | 1.45 ± 0.01 | 20 ± 2 | 0.181 ± 0.018 | 3.21 ± 0.07 | 14,650 ± 790 | 14,590 ± 790 | Lower reddish silt unit |
| Rivanna River-Stigger Creek | |||||||||||||
| RR-SC1-OSL1 BG4002.B 4.0 | 33/35 | 100–150 | 36.40 ± 0.86 | 14 ± 2 | 3.13 ± 0.01 | 10.30 ± 0.01 | 2.37 ± 0.01 | 20 ± 3 | 0.138 ± 0.014 | 3.27 ± 0.09 | 11,070 ± 425 | 11,010 ± 425 | From sandy source layer of dikes |
| South Anna River | |||||||||||||
| SoAR7-OSL1 BG4001.B 1.10 | 31/36 | 100–150 | 16.22 ± 0.32 | 10 ± 1 | 2.28 ± 0.01 | 5.92 ± 0.01 | 1.02 ± 0.01 | 20 ± 3 | 0.179 ± 0.018 | 1.79 ± 0.05 | 9075 ± 310 | 9015 ± 310 | Mottled clayey silt, level with dike tip |
| SoAR10b-OSL1 BG5416 1.48 | 11/11 | 100–150 | >150 | NA | 2.61 ± 0.01 | 9.85 ± 0.01 | 1.52 ± 0.01 | 20 ± 2 | 0.179 ± 0.018 | 2.28 ± 0.06 | >64,900 | >64,840 | Upper silt unit; 3–28 cm below dike tips |
| SoAR10b-OSL2 BG5417 2.23 | 34/35 | 150–250 | 29.55 ± 0.70 | 39 ± 5 | 2.04 ± 0.01 | 11.40 ± 0.01 | 1.42 ± 0.01 | 20 ± 2 | 0.164 ± 0.016 | 2.12 ± 0.06 | 13,860 ± 530 | 13,800 ± 530 | Lower mottled silt & sand unit; 98 cm below dike tips |
See Table B3 for footnotes.
Appendix C. Geotechnical Data
Table C1.
Geotechnical data compiled from borehole logs provided by the Virginia DOT.
Table C1.
Geotechnical data compiled from borehole logs provided by the Virginia DOT.
| Location Name Borehole No. | Map ID 1 | Depth (m) | Description of Susceptible Sediment | Blow Count 2 |
|---|---|---|---|---|
| Rivanna River 1 BH 6 | A | 7.1 9.4 | cohesionless sand sand with some silt | 5 5 |
| So. Anna River 1 BH 31 | B | 4.0 5.0 7.0 | silty sand, trace clay with fine to coarse gravel, micaceous, loose silty sand, trace clay, containing fine to coarse gravel, very loose silty sand, micaceous, very loose | 6 2 4 |
| So. Anna River 2 BH 10 | C | 8.0 9.0 11.0 | fine, wet sand, micaceous, with organics same as above same as above | 6 11 9 |
| So. Anna River 3 65544 BH 8 745431 BH 5 BH7 BH 10 | D | 2.7–3.6 2.9–4.0 2.1–3.8 2.3–2.7 | alluvial sand sand, micaceous same as above same as above | 14 7 18 16 |
| James River BH 7 | E | 4.2 5.3 6.3 | sand, wet, loose to dense same as above same as above | 6 10 4 |
| Pamunkey River 1 BH 2 | F | 4.5 6.1 7.6 9.1 | gray sand same as above gray gravelly sand same as above | 1 5 8 18 |
| Pamunkey River 2 BH 1 | G | 6.6 7.7 8.6 | gray sand with heavy minerals same as above same as above | 4 4 4 |
| Pamunkey River 3 BH 2 | H | 7.9 9.4 11 | sand, fine, medium & coarse grain, micaceous, with organic matter same as above same as above | 2 10 20 |
| Mattaponi River 1 BH 1 | I | 1.8 3.4 | sand, fine grained, mottled with brown clay sand, fine grained, with clay & shell fragments | 15 11 |
| Mattaponi River 2 BH 4 | J | 3.1 4.6 | silty, fine sand, micaceous same as above | 3 8 |
| Mattaponi River 3 BH 5 | K | 4.0 5.5 |
sand with organics | 19 22 |
| Rappahannock R. 1 BH 5 | L | 3.4 6.4 | sand with some organics sand | 5 7 |
| Rappahannock R. 2 BH 40 | M | 3.1 | silty sand | 7 |
| Potomac River 1 BH 1 | N | 15.4 | sand | 9 |
| Potomac River 2 BH 006 | O | 1.5 4.6 | silty, very fine sand fine sand, trace of silt | 20 15 |
| Rapidan River BH 5 | P | 3.1 3.4 | silty. fine sand with medium gravel towards base | 4 22 |
| Appomattox R. 1 BH 4 | Q | 3.0 | Sand and gravelly sand | 19 |
| Appomattox R. 2 BH 1 BH 2 | R | 2.9–4.3 5.8 7.6 | fine to coarse sand, poorly graded, very loose fine to coarse sand, poorly graded, with trace silt gravel, with organic matter, very loose same as above except medium dense | 0 2 22 |
| Appomattox R. 3 BH R-8 | S | 2.4 4.3 5.6 | silty, fine sand, micaceous same as above same as above | 3 2 4 |
| Nottoway River 1 BH 4 BH 5 | T | 1.8 4.6 1.8 3.4 | silty sand same as above sand same as above | 1 4 1 25 |
| Nottoway River 2 BH 6 BH 10 | U | 3.6 4.9 | silty sand sand | 15 17 |
| Nottoway River 3 BH 4 | V | 4.9 | fine-grained sand with some clay | 6 |
1 Map ID shown on Figure 2. 2 Blow count (N) = total number of blows required to drive a split spoon sampler 0.3 m using standard hammer (63.5 kg) dropping 0.76 m. Blow counts reflect relative density of sediment, an important physical property that influences liquefaction susceptibility [25]. The lower the blow count, the looser the sediment. Cohesionless sediment with blow counts in the 0–25 range, especially in the 0–10 range, tend to be susceptible to liquefaction [27].
References
- Chapman, M.C. On the rupture process of the 23 August 2011 Virginia earthquake. Bull. Seismol. Soc. Am. 2013, 103, 613–628. [Google Scholar] [CrossRef]
- Chapman, M.C. Magnitude, recurrence interval, and near-source ground motion modeling of the Mineral, Virginia, earthquake of 23 August 2011. In The 2011 Mineral, Virginia, Earthquake, and Its Significance for Seismic Hazards in Eastern North America; Horton, J.W., Jr., Chapman, M.C., Green, R.A., Eds.; Geological Society of America: Boulder, CO, USA, 2015; Special Paper 509; pp. 27–45. [Google Scholar]
- Green, R.; Lasley, S.; Carter, M.W.; Munsey, J.W.; Maurer, B.W.; Tuttle, M.P. Geotechnical aspects in the epicentral region of the 2011 Mw 5.8 Mineral, Virginia, earthquake. In The 2011 Mineral, Virginia, Earthquake, and Its Significance for Seismic Hazards in Eastern North America; Horton, J.W., Jr., Chapman, M.C., Green, R.A., Eds.; Geological Society of America: Boulder, CO, USA, 2015; Special Paper 509; pp. 151–172. [Google Scholar] [CrossRef]
- Horton, J.W.; Chapman, M.C.; Green, R.A. The 2011 Mineral, Virginia, earthquake, and its significance for seismic hazards in eastern North America-Overview and synthesis. In The 2011 Mineral, Virginia, Earthquake, and Its Significance for Seismic Hazards in Eastern North America; Horton, J.W., Jr., Chapman, M.C., Green, R.A., Eds.; Geological Society of America: Boulder, CO, USA, 2015; Special Paper 509; pp. 1–25. [Google Scholar]
- Graizer, V.; Munson, C.G.; Li, Y. North Anna nuclear power plant strong-motion records of the Mineral, Virginia, earthquake of 23 August 2011. Seismol. Res. Lett. 2013, 84, 551–557. [Google Scholar] [CrossRef]
- U.S. Geological Survey. ANSS Comprehensive Earthquake Catalog. 2024. Available online: https://earthquake.usgs.gov/earthquakes/search/ (accessed on 5 July 2024).
- Mueller, C.S. Earthquake catalogs for the U.S. Geological Survey National Seismic Hazard maps. Seismol. Res. Lett. 2019, 90, 251–261. [Google Scholar] [CrossRef]
- Rukstales, K.S.; Petersen, M.D. Data Release for 2018 Update of the U.S. National Seismic Hazard Model: U.S. Geological Survey Data Release; U.S. Geological Survey: Reston, VA, USA, 2019. [Google Scholar] [CrossRef]
- Technical Report. Central and Eastern United States Seismic Source Characterization for Nuclear Facilities; Electric Power Research Institute, U.S. Department of Energy and U.S. Nuclear Regulatory Commission: Palo Alto, CA, USA, 2012. [Google Scholar]
- Carter, M.W. Characterizing pedogenic and potential paleoseismic features in South Anna River alluvium: Epicentral region of the 2011 earthquake Central Virginia seismic zone. In Proceedings of the 2015 Virginia Geological Research Symposium, Charlottesville, VA, USA, 13 April 2015. [Google Scholar]
- Carter, M.W.; Tuttle, M.P.; Mahan, S.; Merschat, A. Review of Recent and Ongoing Paleoliquefaction Studies in the Southeastern US: Results from Virginia and North Carolina. Presented at the Special Virtual Mini-Conference of the Association of Environmental and Engineering Geologists, USA, Spring. 2022. Available online: https://www.aegmeetings.org/symposium-schedule (accessed on 16 June 2022).
- Dominion Nuclear North Anna, LLC. North Anna Early Site Permit Application: Response to Request for Additional Information No. 3; Report ML042800292; U.S. Nuclear Regulatory Commission: Washington, DC, USA, 2004; 110p. Available online: https://www.nrc.gov/docs/ML0428/ML042800292.pdf (accessed on 13 July 2022).
- Virginia Division of Mineral Resources (DMR). Digital Representation of the 1993 Geologic Map of Virginia, Virginia Division of Mineral Resources, Charlottesville, VA, USA, 2003; Publication 174, map scale 1:500,000. Available online: https://ngmdb.usgs.gov/Prodesc/proddesc_78173.htm (accessed on 29 February 2024).
- Dicken, C.L.; Nicholson, S.W.; Horton, J.D.; Kinney, S.A.; Gunther, G.; Foose, M.P.; Mueller, J.A.L. Preliminary Integrated Geologic Map Databases for the United States. In Delaware, Maryland, New York, Pennsylvania, and Virginia, U.S. Geological Survey; Open-File Report; 2008; pp. 2005–2325. Available online: https://pubs.usgs.gov/of/2005/1325/ (accessed on 29 February 2024).
- Hughes, K.S.; Hibbard, J.P.; Bohnenstiehl, D.R. Relict Paleozoic faults in the epicentral area of the August 23, 2011 central Virginia earthquake: Assessing the relationship between preexisting strain and modern seismicity. In The 2011 Mineral, Virginia, Earthquake, and Its Significance for Seismic Hazards in Eastern North America; Horton, J.W., Jr., Chapman, M.C., Green, R.A., Eds.; Geological Society of America: Boulder, CO, USA, 2015; Special Paper 509; pp. 331–343. [Google Scholar]
- Powars, D.S.; Catchings, R.D.; Horton, J.W., Jr.; Schindler, S.; Pavich, M.J. Stafford fault system: 120 million year fault movement history of northern Virginia. In The 2011 Mineral, Virginia, earthquake, and Its Significance for Seismic Hazards in Eastern North America; Horton, J.W., Jr., Chapman, M.C., Green, R.A., Eds.; Geological Society of America: Boulder, CO, USA, 2015; Special Paper 509; pp. 407–431. [Google Scholar]
- Petersen, M.D.; Shumway, A.M.; Powers, P.M.; Field, E.H.; Moschetti, M.; Jaiswal, K.S.; Milner, K.R.; Rezaeian, S.; Frankel, A.D.; Llenos, A.L.; et al. The 2023 U.S. 50-State National Seismic Hazard Model: Overview and implications. Earthq. Spectra 2024, 40, 5–88. [Google Scholar] [CrossRef]
- Berti, C.; Pazzaglia, F.J.; Meltzer, A.S.; Harrison, R.W. Geomorphic evidence for persistent, cumulative deformation of the Virginia Piedmont in the vicinity of the 23 August, 2011 Mineral earthquake. In The 2011 Earthquake in Central Virginia and Its Significance for Seismic Hazards in Eastern North America; Horton, J.W., Chapman, M.C., Green, R.A., Eds.; Geological Society of America: Boulder, CO, USA, 2015; Special Paper 509; pp. 377–390. [Google Scholar]
- Pazzaglia, F.J.; Malenda, H.F.; McGavick, M.L.; Raup, C.; Carter, M.W.; Berti, C.; Mahan, S.; Nelson, M.; Rittenour, T.M.; Counts, R.; et al. River terrace evidence of tectonic processes in the eastern North American Plate interior, South Anna River, Virginia. J. Geol. 2021, 129, 595–624. [Google Scholar] [CrossRef]
- Tuttle, M.P.; Dyer-Williams, K.; Carter, M.W.; Forman, S.L.; Tucker, K.; Fuentes, Z.; Velez, C.; Bauer, L.M. The liquefaction record of past earthquakes in the Central Virginia seismic zone, Eastern United States. Seismol. Res. Lett. 2021, 92, 3126–3144. [Google Scholar] [CrossRef]
- Thompson Jobe, J.A.; Hatem, A.E.; Gold, R.D.; DuRoss, C.B.; Reitman, N.; Briggs, R.; Collett, C. Revised earthquake geology inputs for the central and eastern United States and southeast Canada for the 2023 U.S. 50-State National Seismic Hazard Model. Seismol. Res. Lett. 2022, 93, 3100–3120. [Google Scholar] [CrossRef]
- Shumway, A.M.; Petersen, M.D.; Powers, P.M.; Toro, G.; Altekruse, J.M.; Herrick, J.A.; Rukstales, K.S.; Thompson Jobe, J.A.; Hatem, A.E.; Girot, D.L.; et al. Earthquake rupture forecast model construction for the 2023 U.S. 50-State National Seismic Hazard Model update: Central and eastern U.S. fault-based source model. Seismol. Res. Lett. 2024, 95, 997–1029. [Google Scholar] [CrossRef]
- Witt, A.E.; Heller, M.; Spears, D.; Hancock, G. Investigation of Brittle Structures and Soft Sediment Deformation Associated with Paleoseismicity Along the Lakeside and Little Fork Church Faults in the Central Virginia Seismic Zone: Collaborative Research with the Virginia Department of Mines, Minerals and Energy and the United States Geological Survey; Final Technical Report; Grant G16AP00139; U.S. Geological Survey: Reston, VA, USA, 2017; 20p. [Google Scholar]
- Obermeier, S.F.; McNulty, W.E. Paleoliquefaction evidence for seismic quiescence in central Virginia during late and middle Holocene time [abs.]. EOS Trans. Am. Geophys. Union 1998, 79, S342, Transactions of the American Geophysical Union, Spring Meeting Supplement, Abstract T41A-9. [Google Scholar]
- Tuttle, M.P.; Wolf, L.W.; Mayne, P.W.; Dyer-Williams, K.; Lafferty, R.H. Guidance Document: Conducting Paleoliquefaction Studies for Earthquake Source Characterization; NUREG/CR-7238; U.S. Nuclear Regulatory Commission: Washington, DC, USA, 2018; 185p. Available online: https://www.nrc.gov/docs/ML1801/ML18012A048.pdf (accessed on 4 March 2025).
- Tuttle, M.P.; Hartleb, R.; Wolf, L.; Mayne, P.W. Paleoliquefaction studies and the evaluation of seismic hazard. Geosciences 2019, 9, 311. [Google Scholar] [CrossRef]
- Obermeier, S.F. Using Liquefaction-Induced Features for Paleoseismic Analysis. In Paleoseismology; McCalpin, J.P., Ed.; Academic Press: San Diego, CA, USA, 1996; pp. 331–396. [Google Scholar]
- Bronk Ramsey, C. Bayesian analysis of radiocarbon dates. Radiocarbon 2009, 51, 337–360. [Google Scholar] [CrossRef]
- Reimer, P.J.; Austin, W.E.N.; Bard, E.; Bayliss, A.; Blackwell, P.G.; Bronk Ramsey, C.; Butzin, M.; Cheng, H.; Edwards, R.L.; Frederick, M.; et al. The IntCal20 northern hemisphere radiocarbon age calibration curve (0–55 cal kBP). Radiocarbon 2020, 62, 725–757. [Google Scholar] [CrossRef]
- Liang, P.; Forman, S.L. LDAC: An Excel-based program for luminescence equivalent dose and burial age calculations. Ancient TL 2019, 37, 21–40. [Google Scholar] [CrossRef]
- Cohen, K.M.; Finney, S.C.; Gibbard, P.L.; Fan, J.X. The ICS International Chronostratigraphic Chart. Episodes 2022, 36, 199–204. Available online: https://www.stratigraphy.org/ICSchart/ChronostratChart2022-10.pdf (accessed on 21 September 2023). [CrossRef]
- Seed, H.B.; Idriss, I.M. Ground Motions and Soil Liquefaction During Earthquakes; Earthquake Engineering Research Institute: Berkley, CA, USA, 1982; 134p. [Google Scholar]
- Youd, T.L.; Idriss, I.M. Liquefaction resistance of soils: Summary report from the 1996 NCEER and 1998 NCEER/NSF workshops on evaluation of liquefaction resistance of soils. J. Geotech. Environ. Eng. 2001, 127, 297–313. [Google Scholar]
- Cetin, K.O.; Seed, R.B.; Der Kiureghian, A.; Tokimatsu, K.; Harder, L.F., Jr.; Kayen, R.E.; Moss, R.E.S. SPT-based probabilistic and deterministic assessment of seismic soil liquefaction potential. ASCE J. Geotech. Environ. Eng. 2004, 130, 1314–1340. [Google Scholar] [CrossRef]
- Robertson, P.K. Evaluation of flow liquefaction and liquefied strength using the CPT. J. Geotech. Environ. Eng. 2010, 136, 842–853. [Google Scholar]
- Juang, C.H.; Zhang, J.; Khoshnevisan, S.; Gong, W. Probabilistic Methods for Assessing Soil Liquefaction and Effect; Geo-Risk 2017: Keynote Lectures; American Society of Civil Engineers: Reston, VA, USA, 2017; pp. 122–145. [Google Scholar] [CrossRef]
- Atkinson, G.; Boore, D. Modification to existing ground-motion prediction equations in light of new data. Bull. Seismol. Soc. Am. 2011, 101, 1121–1135. [Google Scholar] [CrossRef]
- Kempthorne, D.; Myers, M.D. The Virginia Coastal Plain hydrogeologic framework, U.S. Geological Survey. Prof. Pap. 2006, 1731, 114. [Google Scholar]
- Tuttle, M.P.; Dyer-Williams, K.; Forman, S.L.; Tucker, K.; Velez, C. Follow-Up Paleoliquefaction Studies of the Central Virginia Seismic Zone; Technical Letter Report, TLR-RES-DE-SGSEB-2024-2; U.S. Nuclear Regulatory Commission: Washington, DC, USA, 2024; 69p. [Google Scholar]
- Mixon, R.B.; Berquist, C.R., Jr.; Newell, W.L.; Johnson, G.H. Geological Map and Generalized Cross Section of the Coastal Plain and Adjacent Parts of the Piedmont, Virginia; Miscellaneous Investigations Series Map I-2033; Scale 1:250,000; U.S. Geological Survey: Reston, VA, USA, 1989. [Google Scholar]
- Malenda, H.F.; Raup, C.; Pazzaglia, F.J.; Berti, C. Surficial Geologic Map of the South Anna River in the Ferncliff and Pendleton Quadrangles, Virginia; EDMAP, Open File Map G13AC0015; Scale 1:24,000; U.S. Geological Survey: Reston, VA, USA, 2014. [Google Scholar]
- Mixon, R.B.; Pavlides, L.; Powars, D.S.; Froelich, A.J.; Weems, R.E.; Schindler, J.S.; Newell, W.L.; Edwards, L.E.; Ward, L.W. Geological Map of the Fredericksburg 30’ × 60’ Quadrangle, Virginia and Maryland; Geological Investigations Series Map I-2607; scale 1:100,000; U.S. Geological Survey: Reston, VA, USA, 2000. [Google Scholar]
- Sims, J.D. Determining earthquake recurrence intervals from deformational structures in young lacustrine sediments. Tectonophysics 1975, 29, 141–153. [Google Scholar] [CrossRef]
- Sims, J.D. Earthquake-induced structures in sediments of Van Norman Lake, San Fernando California. Science 1973, 182, 161–163. [Google Scholar] [CrossRef] [PubMed]
- Uner, S. Seismogenic structures in Quaternary lacustrine deposits of Lake Van (eastern Turkey). Geologos 2014, 20, 79–87. [Google Scholar] [CrossRef]
- L’Isle, G.D.; Carte de Louisiane et du Cours du Mississippi. [Paris] [Map] Retrieved from the Library of Congress. 1718. Available online: https://www.loc.gov/item/98685731/ (accessed on 19 August 2024).
- Pratt, T.L.; Horton, J.W., Jr.; Muñoz, J.; Hough, S.E.; Chapman, M.C.; Olgun, C.G. Amplification of earthquake ground motions in Washington DC, implications for hazard assessments in central and eastern North America. Geophys. Res. Lett. 2017, 44, 12–150. [Google Scholar] [CrossRef]
- Galbraith, R.F.; Roberts, R.G. Statistical aspects of equivalent dose and error calculation and display in OSL dating: An overview and some recommendations. Quat. Geochronol. 2012, 11, 1–27. [Google Scholar] [CrossRef]
- Murray, A.S.; Wintle, A.G. The single aliquot regenerative dose protocol: Potential for improvements in reliability. Radiat. Meas. 2003, 37, 377–381. [Google Scholar] [CrossRef]
- Wintle, A.G.; Murray, A.S. A review of quartz optically stimulated luminescence characteristics and their relevance in single-aliquot regeneration dating protocols. Radiat. Meas. 2006, 41, 369–391. [Google Scholar] [CrossRef]
- Prescott, J.R.; Hutton, J.T. Cosmic ray contributions to dose rates for luminescence and ESR dating: Large depths and long-term time variations. Radiat. Meas. 1994, 23, 497–500. [Google Scholar] [CrossRef]
Disclaimer/Publisher’s Note: The statements, opinions and data contained in all publications are solely those of the individual author(s) and contributor(s) and not of MDPI and/or the editor(s). MDPI and/or the editor(s) disclaim responsibility for any injury to people or property resulting from any ideas, methods, instructions or products referred to in the content. |
© 2025 by the authors. Licensee MDPI, Basel, Switzerland. This article is an open access article distributed under the terms and conditions of the Creative Commons Attribution (CC BY) license (https://creativecommons.org/licenses/by/4.0/).