1. Introduction
Heavy rainfall is one of the major consequences of climate changes. Extensive environmental or infrastructural damage, as well as social decentralization, can occur due to continuous heavy rainfall. In the current scenario, slope failure is one of the major natural disasters. Slope failure includes both natural slope failures (landslides) and engineered slope failures, such as the collapse of railway embankments. Predicting slope failure under heavy rainfall is a significant challenge. Over the past few decades, many scientists have investigated slope failure under various conditions. The types of slope failure, remediation methods, and causes were discussed by Hamed Niroumand et al. (2012) [
1]. Slope failure can be classified into four types of ground movement: slides (both translational and rotational), flows, falls, and topples. Slides and flows have the potential to cause extensive damage to infrastructure. Many factors affect slope stability, including climatic, geomorphological, geological, hydrogeological, and geotechnical factors, as well as site-specific stress and strain fields. Certain types of slope failure, such as translational and rotational movement, initiate when heavy rainfall causes a critical reduction in shear strength or loss of cohesion at weak interfaces in layered terrain, leading to gravity-driven sliding or shear failure. In many countries worldwide, more than 90% of landslides occur during the summer due to heavy monsoons causing a loss of apparent cohesion (CGEIS, 2019 [
2]; Froude et al., 2018 [
3]). Much research has been undertaken on various elements of slope failure initiation, but current forecast models lack spatiotemporal accuracy in predicting slope failure. Geological models that forecast location, meteorological triggering conditions, and the potential extent of slope collapse have been elusive, and statistical models have limitations in identifying specific locations and the extent of impact for progressive slope failure (X Gu et al., 2023–2024, [
4,
5]). Making existing geotechnically based models more accurate requires geophysical data at a scale and certainty that is not generally available (Qiang, 2012) [
6]. Previous research that measured deformation fields and creep using physical sensors to understand the evolution of strain and stress fields in potential slope failure regions and attempted to forecast slope failure occurrences using the critical deformation fields demonstrated the difficulty of forecasting slope failure propagation and extent (Teza et al., 2008) [
7]. Conventional analytical or fracture mechanics models can only treat simple slope failures, such as translational landslides, and have difficulty forecasting progressive slope failure caused by critical rainfall (Milledge et al., 2014) [
8]. Traditional finite element methods have limitations in forecasting triggering conditions, propagation, and the extent of slope failure due to implicit characterization of discontinuities (Donze et al., 2009) [
9]. A standard cohesive zone model can only simulate the area of sliding land from a known failure surface, making it difficult to forecast landslide propagation from unknown failure surfaces (Quinn et al., 2012 [
10]; Zhang et al., 2015 [
11]). A particle finite element method (PFEM) (Zhang et al., 2019 [
12]) has been developed to simulate retrogressive slope collapse using the elastoviscoplastic model with strain softening to simulate the progressive failure process and the extent of slope collapse, presented by large plastic deformation instead of sliding fracture propagation along an initially prepared failure surface. However, the PFEM has limitations in forecasting initiation and the starting location of slope failure under heavy rainfall conditions.
Slope failure in layered terrain or infrastructures can initiate and propagate anywhere along unknown failure surfaces. The hypothesis of the ‘sliding failure mechanism’ is that the critical reduction in shear strength or cohesion, along with the related shear fracture energy lost in soil at the interfaces due to rainfall infiltration in layered terrain, leads to slope failure. Rainfall infiltration directly causes changes in soil moisture, which is a critical factor in the reduction of soil cohesion. Soil moisture content can be defined as a volumetric soil moisture content, which represents the volume of water in the soil as a fraction or percentage of the total soil volume [
13]. The soil moisture is mainly affected by rainfall intensity and soil depth. Other variables including rainfall duration and frequency, temperature, humidity, soil properties, land cover, water table depth, and underlying geology would also have influence. This is a rather complex topic. Progressively investigating different variables is a practical approach. This investigation focuses on the major factors, e.g., rainfall intensity and soil depth in a selected site with determined soil properties. The effect of short-intensive rainfall (average 2 h) on soil moisture and cohesion is considered by this study. The effects of other variables on soil moisture can be studied in detail in future work.
The correlation between rainfall intensity and moisture content was initially indicated by Kirsten (1997) [
14], MPhi Thesis (2006) [
15], and Andrzej et al. (2021) [
16]. In this paper, a novel approach is developed by incorporating the proposed soil moisture decohesion model (SMDM) into the extended cohesive damage element (ECDE) method to predict progressive railway embankment slope failure under heavy rainfall. This prediction of slope failure under heavy rainfall fills a research gap that was not addressed by previous investigations. The outcomes of this paper will be used by railway management sectors to make decisions based on weather forecasts. This paper first correlates rainfall intensity with soil moisture using weather forecast data. Then, the investigation of rainfall intensity effects shifts to the investigation of soil moisture effects on soil cohesion reduction. Considering that slope failure mechanisms involve the loss of soil or slope material cohesion due to heavy rainfall, the SMDM is developed to link soil cohesion with soil moisture and depth below the ground surface. Under rainfall conditions, soil moisture decreases with increasing soil depth, soil cohesion decreases with increasing soil moisture, and soil cohesion increases with increasing soil depth. The SMDM is incorporated into the ECDE method to forecast slope failure under heavy rainfall. As an example, the proposed SMECDE approach is applied to predict damage initiation, damage belt formation, and the damage scale of a selected railway embankment slope in the UK Kent region under varying soil moistures or rainfall intensities. The prediction shows that the critical rainfall intensity and soil moisture are 66 mm/h and 35%, respectively. These critical values are identified using previous field surveys and meteorological data. This paper also demonstrates that a soil moisture of 31% is an important transition point significantly changing the initial stiffness and damage scale of the investigated railway embankment slope. The corresponding slope damage scale prediction is validated with a large plastic deformation analysis using the commercial FEM package ABAQUS 2020.
2. The Correlation Between Rainfall Intensity and Soil Moisture Content
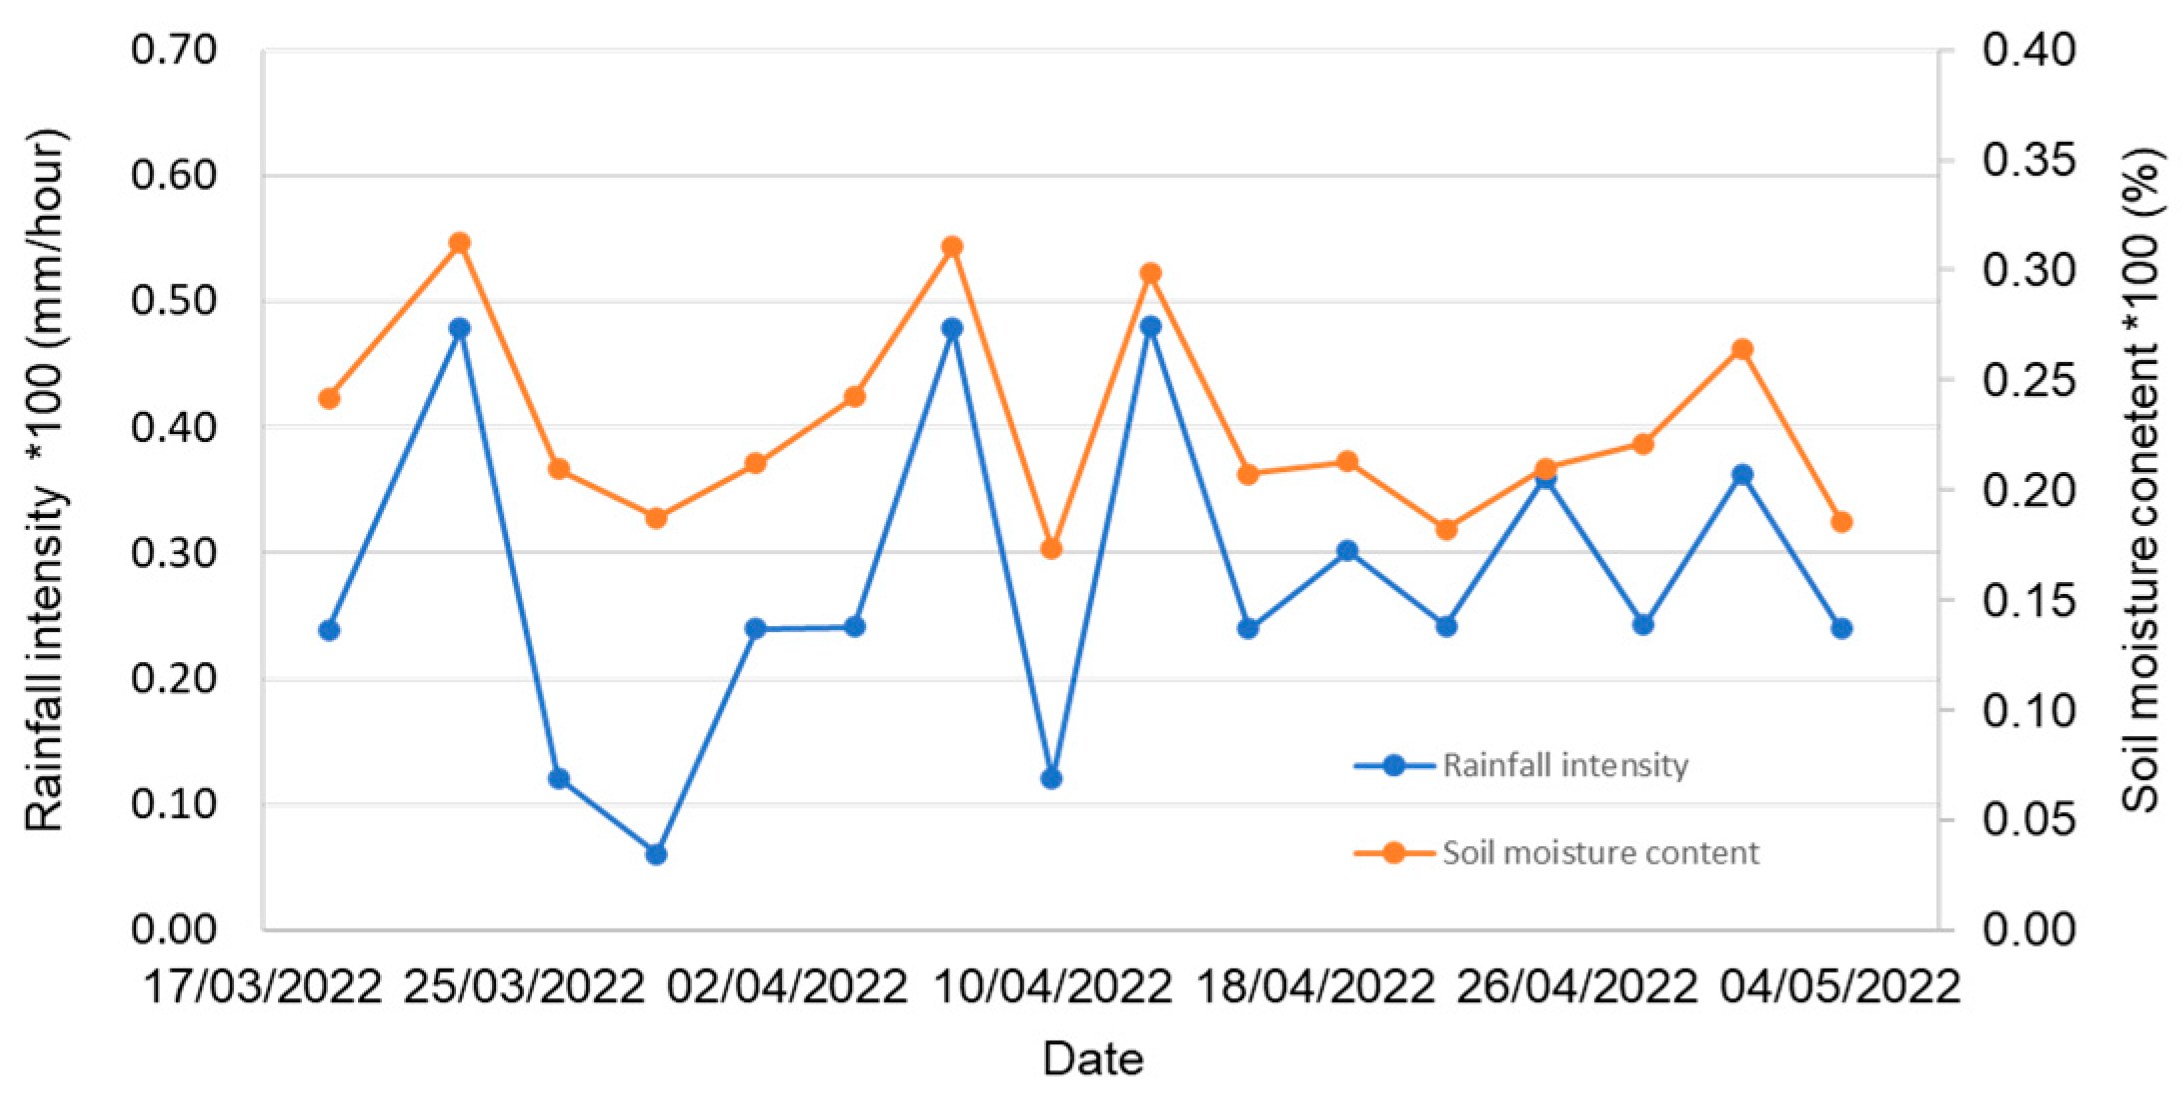
Usually, the weather-forecasted soil moisture is measured based on natural moisture content, α (%), in the ground surface or very shallow soil layer, which represents the percentage of water in the soil. Rainfall intensity, λ (mm/h), is measured using a standard rainfall measurement cylinder, based on the height of collected water per hour. Both α and λ are part of the weather-forecasted data.
Figure 1 shows an example of time histories for rainfall intensity and soil moisture over a certain time period in the Kent region, UK, provided by the website of the European Centre for Medium-Range Weather Forecasts (ECMWF) [
17].
This paper proposes a basic mathematic model as shown in Equation (1) to correlate soil moisture content with rainfall intensity using the meteorological data shown in
Figure 1.
Here, n and k are correlational parameters varying with locations and time periods. They could be taken as n = (0.1, 0.2, 0.3, 0.4, 0.5, …) and k = (1, 1/2, 1/3, 1/4, 1/5, …). The detailed meteorological data of time histories shown in
Figure 1 are given in
Table 1. When n and k are taken as 0.21 and 1/3, respectively, using a curve fitting approach, Equation (1) becomes Equation (2).
Table 1 also shows the calculated values of soil moisture α using Equation (2). The averaged error from Equation (2) is about 3% compared to forecasted values of soil moisture, which indicates that Equation (2) is a good correlation for rainfall intensity and soil moisture based on the provided meteorological data at Kent region, UK, from March to May 2022.
Table 1.
Meteorological data from March to May 2022 at Kent region, UK.
Table 1.
Meteorological data from March to May 2022 at Kent region, UK.
| Date | 20/03 | 23/03 | 26/03 | 29/03 | 01/04 | 04/04 | 07/04 | 10/04 | 13/04 | 16/04 | 19/04 | 22/04 | 25/04 | 28/04 | 01/05 | 04/05 |
|---|
λ
(mm/h) | 0.2392 | 0.4785 | 0.1214 | 0.061 | 0.2396 | 0.2412 | 0.4785 | 0.1203 | 0.4805 | 0.2396 | 0.3021 | 0.2425 | 0.3596 | 0.2427 | 0.3631 | 0.2398 |
| α (%) | 0.2421 | 0.3121 | 0.2097 | 0.1875 | 0.2123 | 0.2423 | 0.3105 | 0.1734 | 0.2984 | 0.2072 | 0.2132 | 0.1823 | 0.2101 | 0.2214 | 0.2642 | 0.1857 |
| Equation (2) | 0.2475 | 0.2610 | 0.2401 | 0.2345 | 0.2407 | 0.2475 | 0.2607 | 0.2307 | 0.2586 | 0.2395 | 0.2409 | 0.2332 | 0.2402 | 0.2429 | 0.2520 | 0.2341 |
3. The Soil Moisture Decohesion Model (SMDM)
A correlational model is generally proposed as a polynomial function between soil moisture α and soil cohesion C in the ground surface as shown in Equation (3).
Here, p, q, and s are correlational parameters. Combining Equations (1) and (3) results in Equation (4), which is a correlation between soil cohesion and rainfall intensity
.
Define w = p
, t = q
, and Equation (4) become Equation (5) as below.
In Equation (3), correlational parameters p, q, and s can be determined with experimental data through testing soil samples with variable water contents in the laboratory. Equation (5) is an incurred correlation between soil cohesion and rainfall intensity. Its parameters w, t, and s can be determined indirectly using Equations (1) and (3) with assistance from the curve fitting approach used for determining parameters in Equation (2).
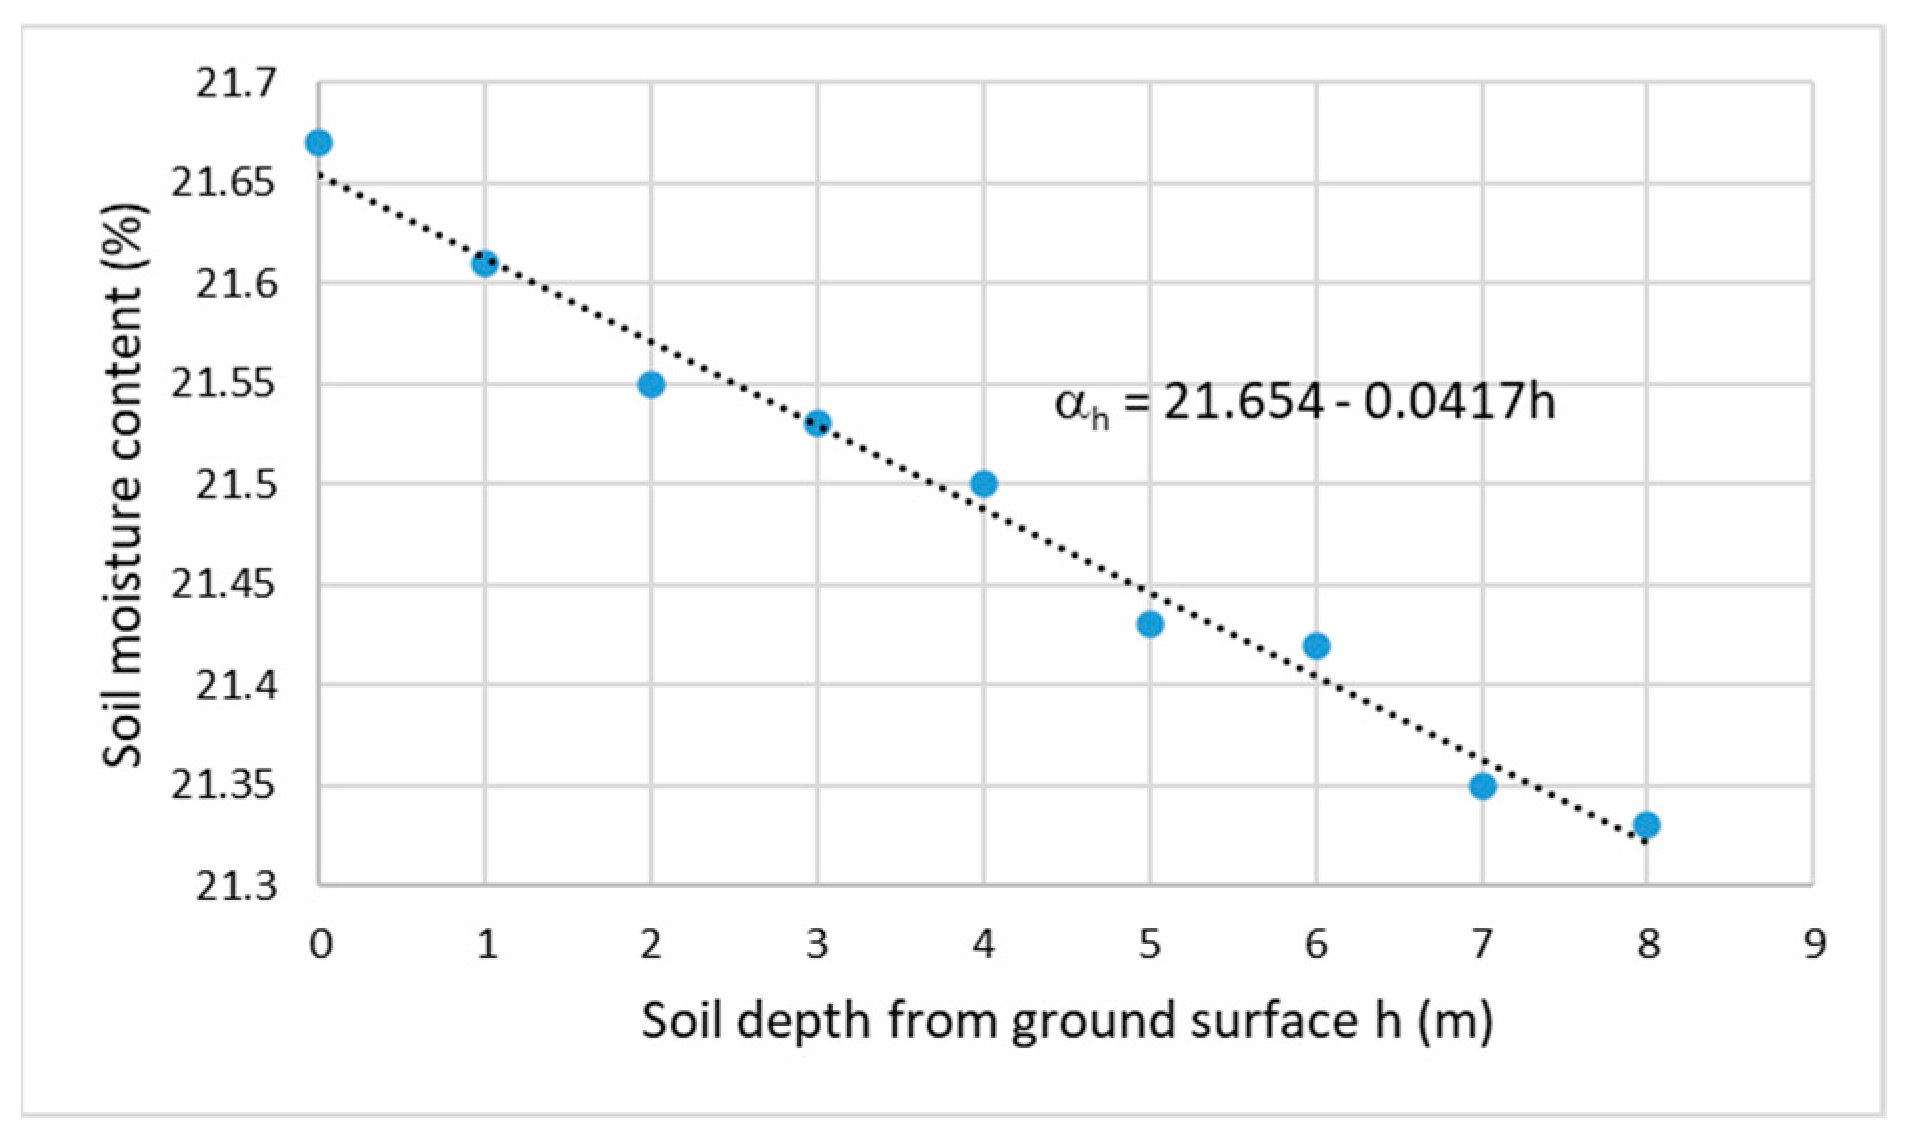
Considering the shallow soil layer underground, previous work [
18] investigated how soil moisture α almost linearly decreases with increasing soil depth, ℎ (meters), as shown in
Figure 2. It can be seen from
Figure 2 that α decreases from the ground surface moisture 21.654% along the linear path with a degradational ratio of −0.0417. It should be noted that the points shown on the figure are tested data from previous experiment work [
18,
19,
20,
21] (same for
Figure 2,
Figure 3,
Figure 4,
Figure 5 and
Figure 6). This was studied for native grassland and artificial grassland under rainfall conditions through a case study of a typical loess hilly area in the Anjiapo catchment of China during the 2010 growing season. Soil cohesion decreases with increasing soil moisture [
18,
19,
20]. As an example,
Figure 3 shows that soil cohesion decreases with increasing soil moisture at the ground surface. It is a polynomial decreasing function that is generally expressed using Equation (3). It should be noticed that this correlation between soil cohesion and moisture was conducted for the case of short-intensive rainfall (average 2 h) by previous experimental investigations [
18,
19,
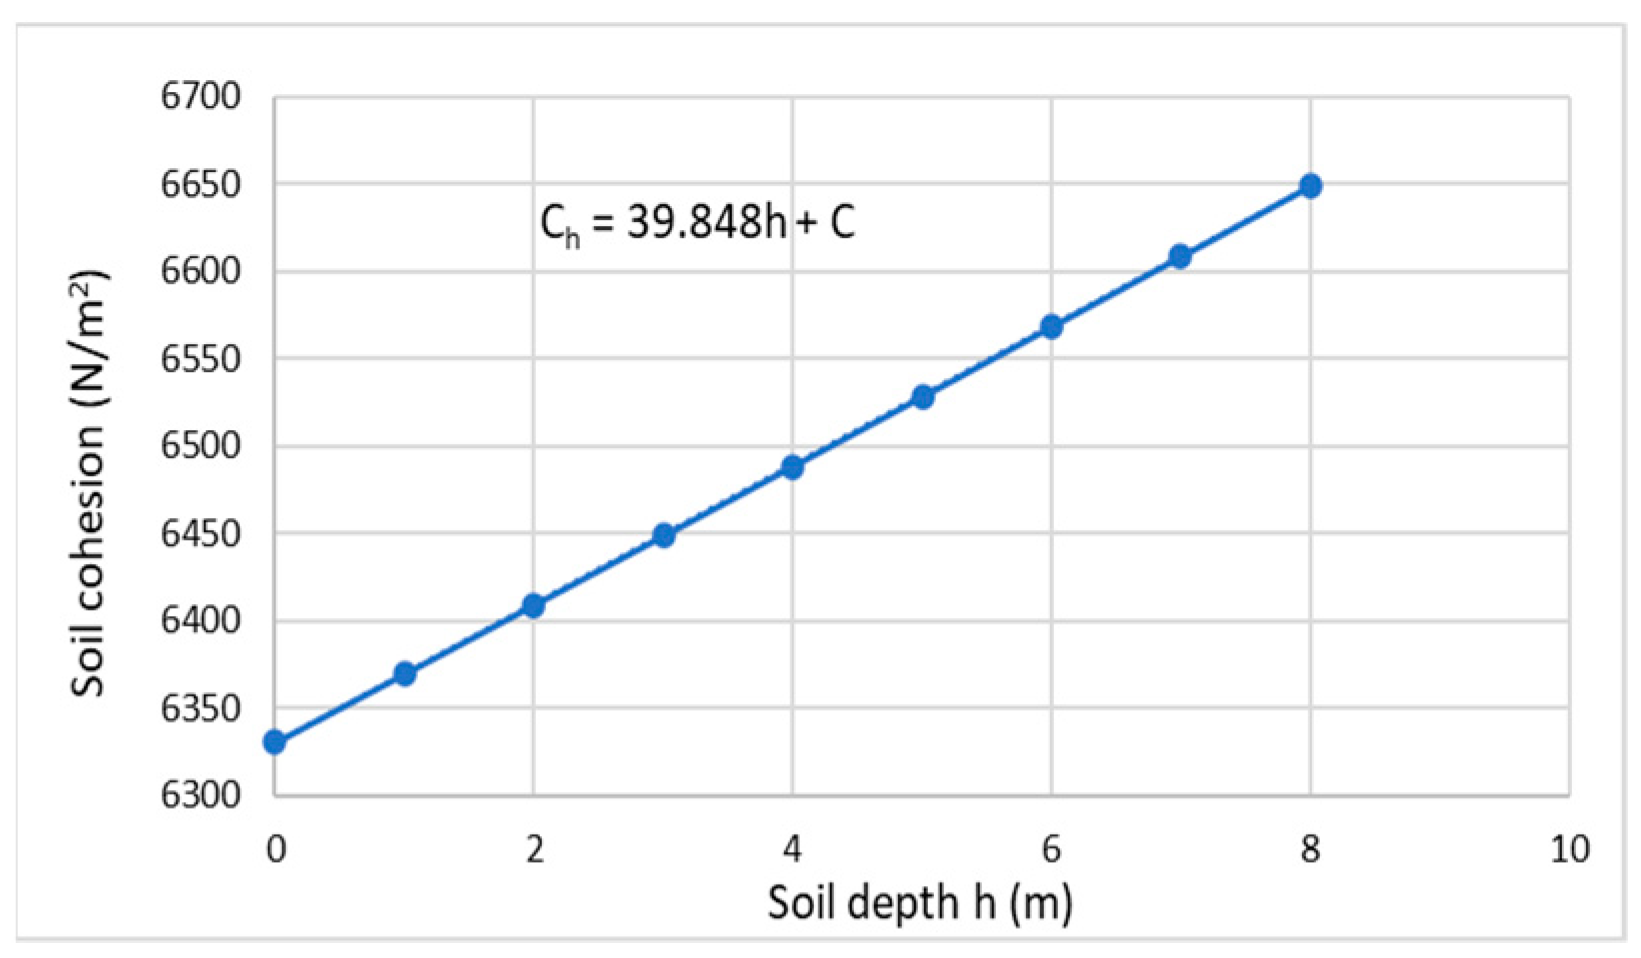
20]. Furthermore, soil cohesion increases with increasing soil depth [
21] under rainfall conditions. A correlation for loamy soil with 25% moisture can be proposed based on previous test work [
18,
19,
20,
21], as shown in
Figure 4. Equation (6) mathematically expresses the linear correlation between soil cohesion and depth below the ground surface.
Equation (3), together with Equation (6), is referred to as the general soil moisture decohesion model (SMDM). The parameters shown in Equation (3) vary with different soil types. Therefore, the parameters given in Equations (3)–(6) influence soil cohesion values for different soils at varying soil moisture levels and depths. Different types of soil can be identified by their liquid limit (LL). Previous experimental work [
18] and Matsushi et al. (2006) [
20] investigated the basic influence of soil moisture on cohesion variation. As an example, this paper selects a railway embankment slope in the UK Kent region for investigation, as Kent is one of the regions with the highest risk of railway slope failure, with over 4000 recorded slope failures in the past few decades. The soil type in the Kent region is primarily loamy soil with a liquid limit of 52%. The soil cohesion–moisture correlation in the Kent region is generated by interpolation using basic data from previous work [
18,
20], as shown in
Figure 3. Thus, the correlation parameters p, q, and s in Equation (3) can be determined through curve fitting using the data shown in
Figure 3, and their values are provided in
Table 2. Using Equations (2) and (3), and with the assistance of the curve fitting approach, the correlation parameters w, t, and s in Equation (5) can also be determined, with their values provided in
Table 3.
Using Equation (3) and parameters in in
Table 2, Equation (3) can be formed with details for soil LL52 as shown in Equation (7).
Equation (7) reflects the behavior of soil cohesion reduction when increasing moisture as a polynomial function shown in
Figure 3 in the ground surface or very shallow soil layer. Using Equations (2) and (5) and
Table 3, the incurred correlation between soil cohesion and rainfall intensity in Kent region can be expressed using Equation (8).
In Equation (6), C
h is the soil cohesion at the level that is h meters below ground surface, C is the cohesion in the ground surface, and Γ is a linear incredible parameter varying with different soil types. Here, Γ is taken as 0.004 based on the data analysis of the previous work [
18,
19,
20,
21]. Thus, a linear correlation between soil cohesion and depth using Equation (6) is shown in
Figure 4 for soil LL52 in the Kent region. It should be noticed that Equation (6) is valid under rainfall conditions, and there is no consideration of underground water resources.
4. Soil Material Properties
Most soils with LL are commonly recognized as a porous material consisting of particles (or grains), which are held together by cohesion. In general, soil’s LL, moisture content, particle scales, and density mainly determine the soil mechanical properties. This paper will focus on investigating the effects of soil moisture and depth on mechanical performance. The railway embankment slope consists of embankment filings and foundation, and the top layer consists of ash/ballast. It should be noted that embankment filings and foundation are the main body of the slope structure with manually prepared slope engineering materials. These materials would be local loamy soil mixed with others, including natural aggregates, thus named as loamy soil composites in this paper for a simple classification. In the UK railway embankment slope, aggregates with varying size from 5 mm to 40 mm are normally used to build the fillings, while the foundation layer consists of sand, gravel, or well-graded soil with particles up to 75 mm. More detailed information (e.g., grain size distribution, permeability, and compactness) of these engineering slope materials can be found in the references [
18,
19,
20,
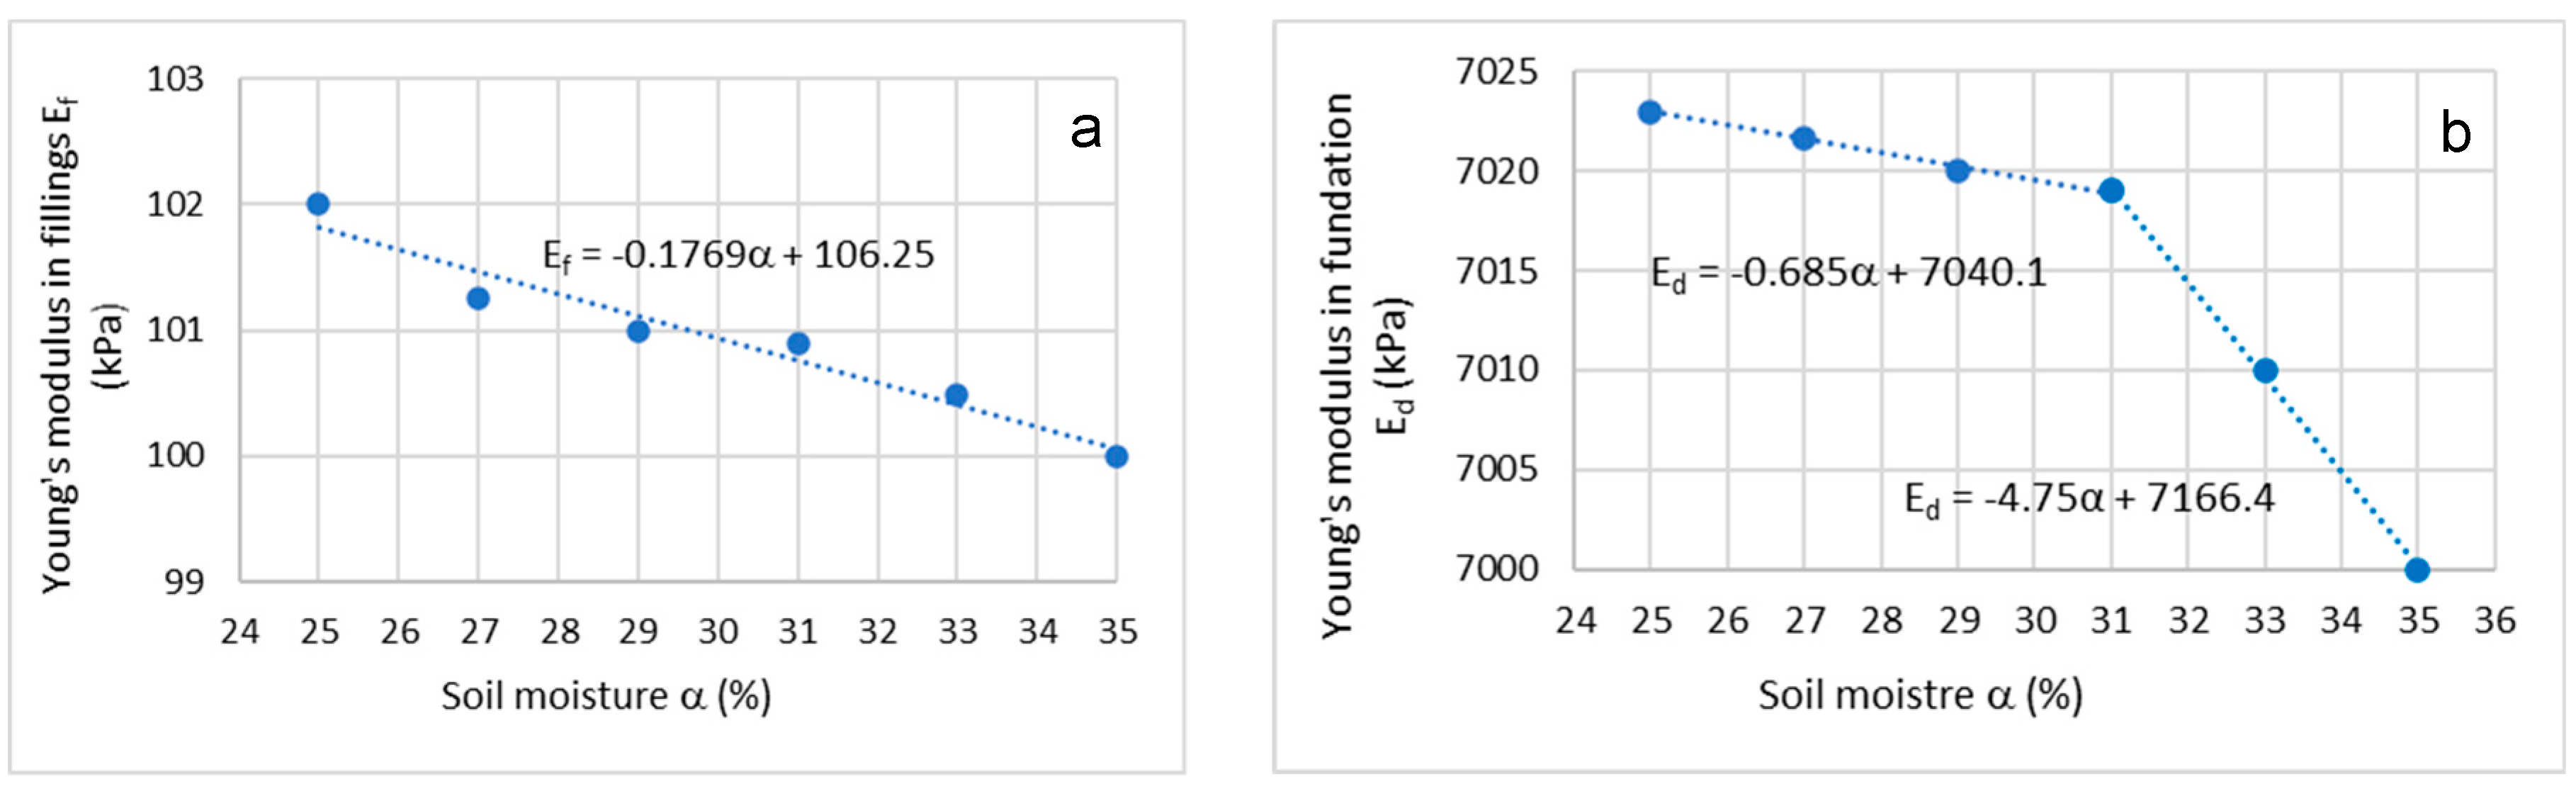
21]. Their properties include soil moisture (α), soil types with different liquid limits (LL), cohesion (C), Young’s modulus (E), friction angle (θ) and Poisson ratio (ν). The effects given their variable values with different moisture contents and soil depths on slope failure propagation of a selected railway embankment slope with geometrical slope angle, shape, and size are investigated in this paper. Using previous experimental data (Stirling 2014 [
22], Tetsuya 2017 [
23]), the Young’s modulus (E
f) of embankment fillings varies with soil moisture (α) and can be plotted as shown in
Figure 5a. It can be seen from
Figure 5a that the Young’s modulus (E
f) of embankment fillings of a loam soil type is gradually and almost linearly reduced when increasing soil moisture α, which can be expressed using a curve fitting equation as shown in Equation (9).
Figure 5a shows a deceasing correlation from E
f = 106.25 (KPa) at 25% moisture down to E
f = 100 (KPa) with a ratio of −0.1769.
Using the same references [
22,
23], the Young’s modulus (E
d) of the embankment foundation varying with soil moisture α is shown in
Figure 5b. A bi-linear correlation between E
d and α can be estimated using Equation (10).
Figure 5b shows that E
d slowly decreases by a ratio of −0.685 from 7040.1 KPa at 25% moisture before it reaches a moisture of 31%. Then, it rapidly drops by a ratio of −4.75 to 7000 KPa at a moisture of 35%. Approximately 31% moisture would cause a significant change to the Young’s modulus of the embankment foundation. This correlation aligns with previous work (Stirling, 2014; Tetsuya, 2017 [
22,
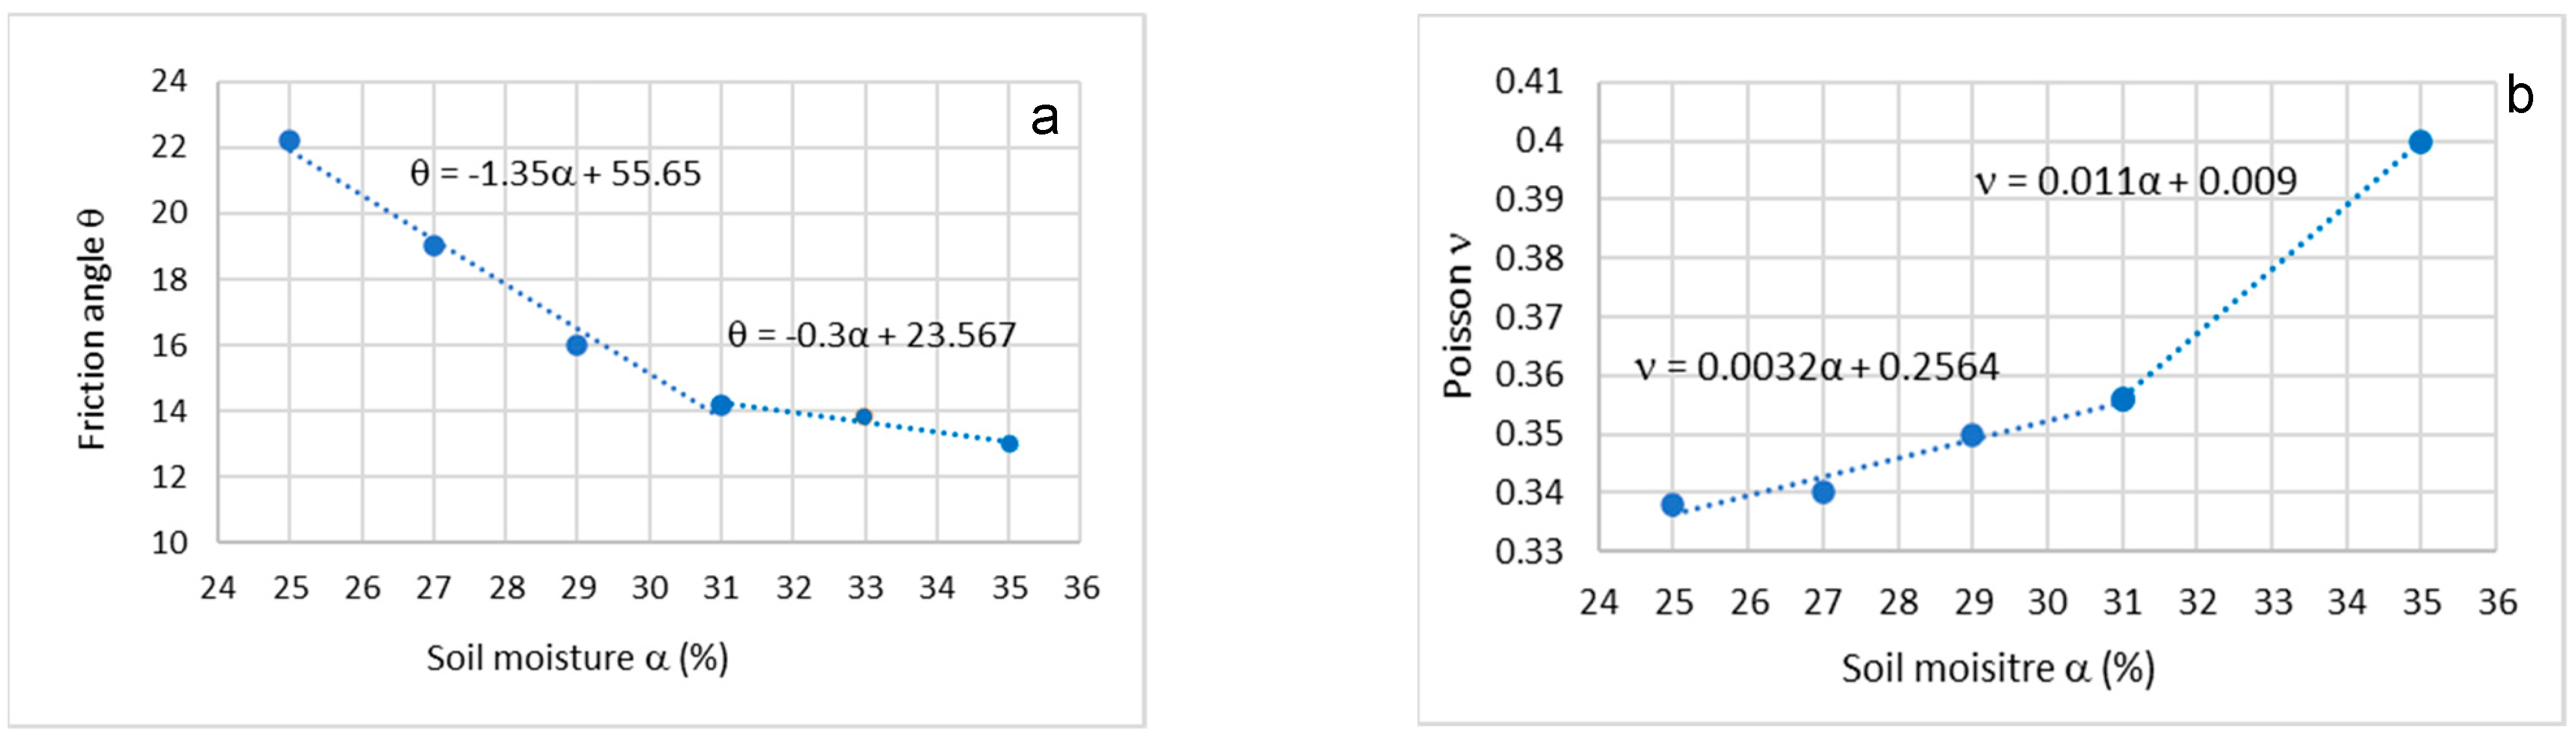
23]). Referring to the previous work by Li (2021) and Zhao (2018) [
24,
25], the friction angle θ of loamy soil varying with moisture content α is evaluated for the Kent region and shown in
Figure 6a. This can also be estimated using a bi-linear function shown in Equation (11).
This soil friction angle θ is quickly reduced when the moisture content increases from 25% to 31%, followed by a slow reduction process. Here, it takes 12.5 degrees when α = 35%. In addition, 31% moisture is also an important point as two different degradation ratios, namely, −0.135 and −0.3, estimate the reduction speed before and after that moisture point. After that, the friction angle would become stable. Meanwhile, the correlation between loamy soil’s Poisson ratio ν and moisture content α can be estimated in terms of previous work (Thota 2021 [
26], Oh W. T. 2011 [
27]), which is shown in
Figure 6b. It can be seen from
Figure 6b that Poisson’s ratio of loamy soil increases as the moisture content increases. Its correlation can also be expressed roughly using another bi-linear function as shown in Equation (12).
It can be seen from
Figure 6b that there is also important moisture point α (31%). Specifically, a slowly increased ratio of 0.0032 can be seen before 31%, followed by a significant increased ratio 0.011 after 31%. Poisson’s ratio of loamy soil is the only parameter that increases when the moisture content increases, which implies that this soil could have more plastic strain in any direction. In general, increases in soil moisture result in decreased soil cohesion, Young’s modulus, and friction angle. These changes will cause a reduction in the soil‘s stiffness and strength. Thus, soil gradually loses cohesion and stability and finally collapses under heavy rainfall and high moisture content. It can be seen from the above analysis that the Young’s modulus of fillings are stably decreased as soil moisture increases. Here, 31% soil moisture is an important transition point with significant increases in the foundation’s Young’s modulus and friction angle and deceases in Poisson’s ratio of the studied railway embankment slope.
It should be noted that, like soil cohesion, which varies with depth, basic soil properties, including Young’s modulus, also vary with depth. Other material parameters, e.g., friction angle and Poisson’s ratio, are less varied in depth considering the materials in the railway embankment slope because they are manually prepared. Therefore, two layers with different material properties, including cohesion and the Young’s modulus for embankment fillings and foundation, are applied. Additionally, two groups of constant materials for the friction angle and Poisson’s ratio, treated as depth-averaged materials, are proposed for the embankment fillings and foundation in this investigation. Alternatively, the correlation between soil moisture and depth obtained from
Figure 2,
(ϕ reflects degradation of moisture from ground surface and taken as 0.04 in terms of references [
18,
19,
20,
21]), can be used together with Equations (9)–(12) to calculate different parameters varying with depth.
5. The Basic SMECDE Equations
Physically, slope sliding is a progressive failure process involving shear damage and fracture propagation. The Soil Moisture Extended Cohesive Damage Element (SMECDE) method integrates the computational Extended Cohesive Damage Element (ECDE) model with the Soil Moisture Distribution Model (SMDM) to analyze railway embankment slope failure propagation while accounting for soil moisture effects. This approach includes predictions for slope failure initiation, failure location, and the progressively formed failure area.
The ECDE method, developed by the corresponding author Chen and his colleagues, is designed for predicting damage and fracture propagation in engineering materials and structures (Chen et al., 2022; Li and Chen, 2016, 2017) [
28,
29,
30,
31,
32,
33,
34,
35]. The fundamental theory of the SMECDE is detailed below. Specifically, the incorporation of the SMDM is discussed in
Section 3, and its applications is outlined in
Section 7.
Considering that soil material properties vary with soil moisture, the soil element stiffness K and displacement field u are a function of soil moisture α. Before cracks occur at low soil moisture content, u is the ordinary displacement field. Here, K and u can be used to form a basic equilibrium equation with applied force F shown in Equation (13).
Here, F is also a function of soil moisture α due to the variable amount of water in the soil. When soil moisture reaches the critical content, crack/fracture will occur; thus, the displacement field with discontinuity must consider approximating the crack/fracture propagation in the slope body. Equation (14) shows the test and trial function of the discontinuous displacement field.
In Equation (14), the ordinary displacement field and the displacement jump can be accounted for using u
s(x) and α(x), respectively. A step function Step
Γd(x) is used to reflect a physical jump when the element is completely separated as a crack or strong discontinuity. Equation (15) shows a discrete FEM form to approximate the displacement field.
In Equation (15), u
i and a
i are ordinary displacement DoFs and additional enrichment DoFs, respectively, used to present the displacement jump or crack, and N
i and N
j are standard FEM shape functions. Equation (16) shows the basic Heaviside step function
.
Define
as a shifted Heaviside function for modelling a crack, expressing the displacement jump as show in Equation (17).
Equation (17) shows a combination with two enriched items, which results in a real displacement with a jump Δu. A single value for any crack geometry at any node can be ensured by this shifted enrichment at the displacement basis. It should be notes that the enriched contribution has a certain value at material integration points but vanishes at enriched nodes. Equation (13) can be changed to the discrete form of the equilibrium equation expressed by Equation (18) using the Bubnov–Galerkin method and the weak form of equilibrium equation for static analysis.
In Equation (18), the stiffness matrices relating to the standard FE approximation and the enriched approximation can be accounted for using K
uu and K
aa, respectively. K
ua and K
au represent the coupling between the standard FE approximation and the enriched approximation; while, the equivalent nodal force vectors for standard FEM DoFs and enriched DoFs are approximated using
and
, respectively. Equation (19) gives the calculation of each submatrix required by Equation (18).
In Equation (19), details for the basic constitutive material matrices D, the deformation gradient matrices B produced for strain calculation, and the deformation gradient matrices B
a relating to the enriched DoFs can be obtained from [
28,
29,
30,
31,
32,
33,
34,
35]. It should be noted that their calculations use varied material properties at the critical soil moisture, as discussed in
Section 3 and
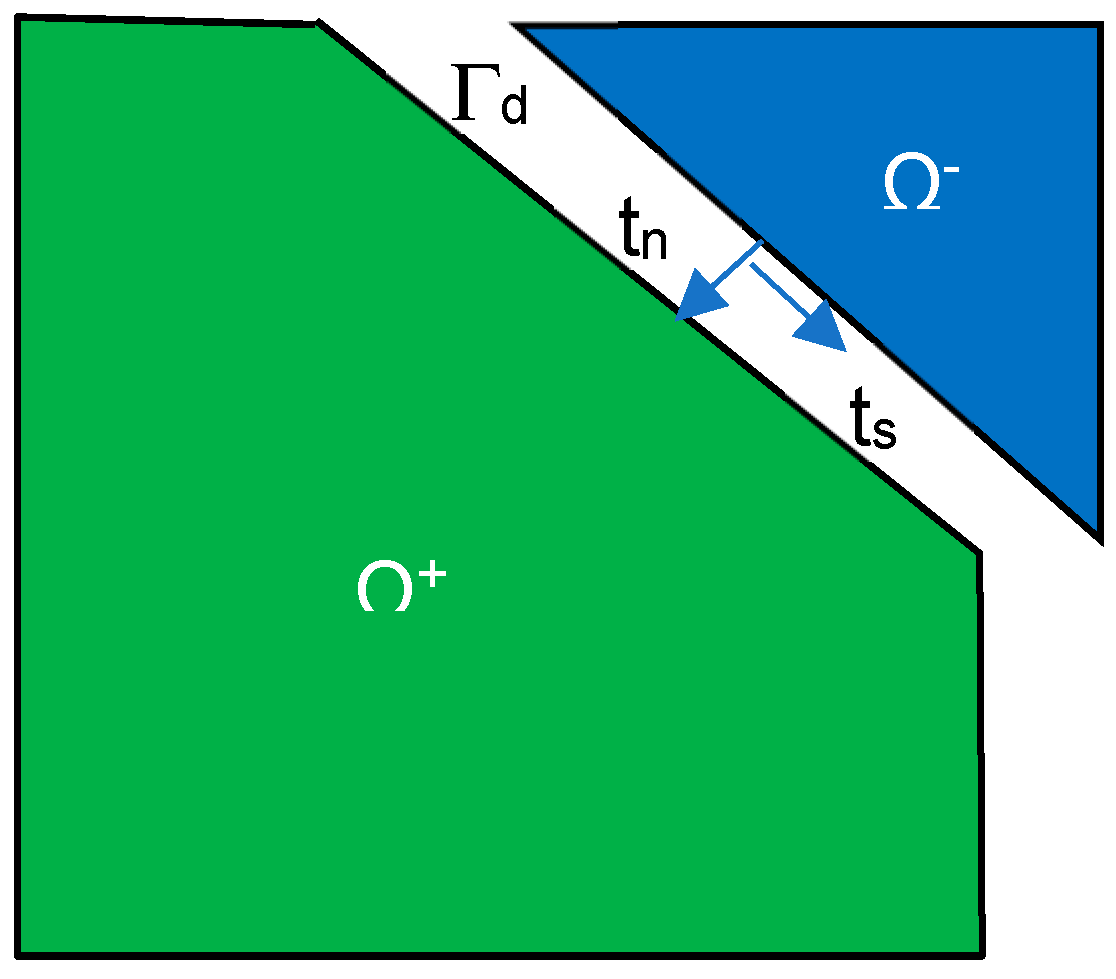
Section 4. It should be noted that the simulated crack is assumed as a cohesive crack, and the corresponding discontinuous boundary is a cohesive crack boundary. Thus, using Equation (20), the equivalent nodal force vectors in Equation (18) can be calculated.
The calculation of the internal nodal force vector due to cohesive traction t on the crack surface Γ
d, as shown in
Figure 7, can be expressed using Equation (21).
The calculation for the internal nodal force vector using the standard Gaussian integration scheme is presented in Equation (22).
Here, ξ
i is the coordinate of the Gauss integration point i (1 ≤ i ≤ n), and w(ξ
i) is a weight function. Using Equations (20)–(22), Equation (18) can be changed to Equation (23).
A mathematic matrix operation is used in this work to eliminate the additional enrichment a to form a fully condensed equilibrium system and to improve computing efficiency especially at the structural level. Thus, Equation (24) is obtained to present equilibrium equation using the standard FEM unknown quantities.
It can be seen from Equation (24) that the discontinuity-related enriched DoFs a make negative contributions to element stiffness on the left side and force on the right side. This change is obviously due to materials cracking at the critical soil moisture. Assume an equivalent elemental stiffness matrix
and equivalent force vector
to replace corresponding items on the left and right side, as shown in Equations (25) and (26), respectively.
Thus, the equivalent element equilibrium equation at the cracking stage can be simply expressed using Equation (27).
It should be noted that Equation (23) assumes that no external load is applied to the cohesive crack. The SMECDE formulation enables the calculation of nodal displacements for cracked elements using standard FEM degrees of freedom (DoFs) only, thereby improving computational efficiency and convergence in nonlinear iterations at the structural level.
This proposed mathematical procedure is rigorous and effectively captures the entire damage evolution process, transitioning from weak to strong discontinuities. By eliminating the need for enriched DoFs, the SMECDE method can be seamlessly integrated into the standard commercial FEM software package ABAQUS using the user-defined element (UEL) feature. This integration involves incorporating the formulations of Equations (3), (6), and (7) along with Equations (13)–(27).
The developed SMECDE approach is applied to predict railway slope failure propagation at the selected site.
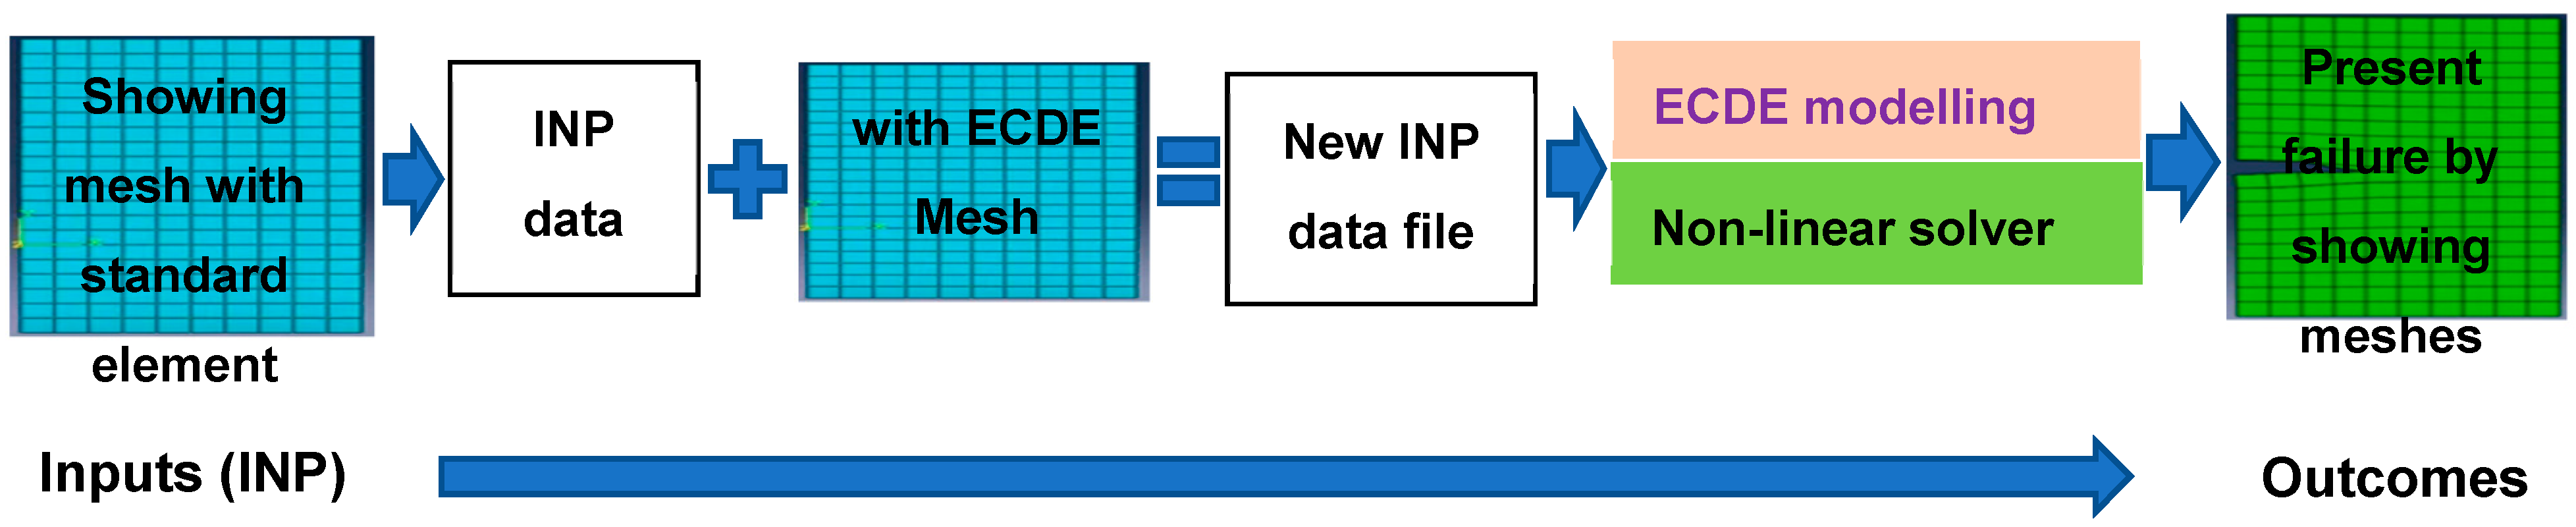
Figure 8 illustrates the ECDE modeling process implemented in ABAQUS. The procedure consists of the following five steps:
Create the geometry and standard FEM meshes in an ABAQUS input (INP) file.
Apply ECDE elements within the standard FEM meshes using double meshing technology.
Generate a new INP data file with user-defined ECDE elements.
Execute the ECDE modeling using the ABAQUS nonlinear solver, such as the Newton–Raphson method with a line search algorithm.
Visualize failure outcomes by transferring results into a mesh representation based on strain contours.
Figure 8.
ECDE modelling process using ABAQUS.
Figure 8.
ECDE modelling process using ABAQUS.
6. Slope Failure Modes and Damage Criteria
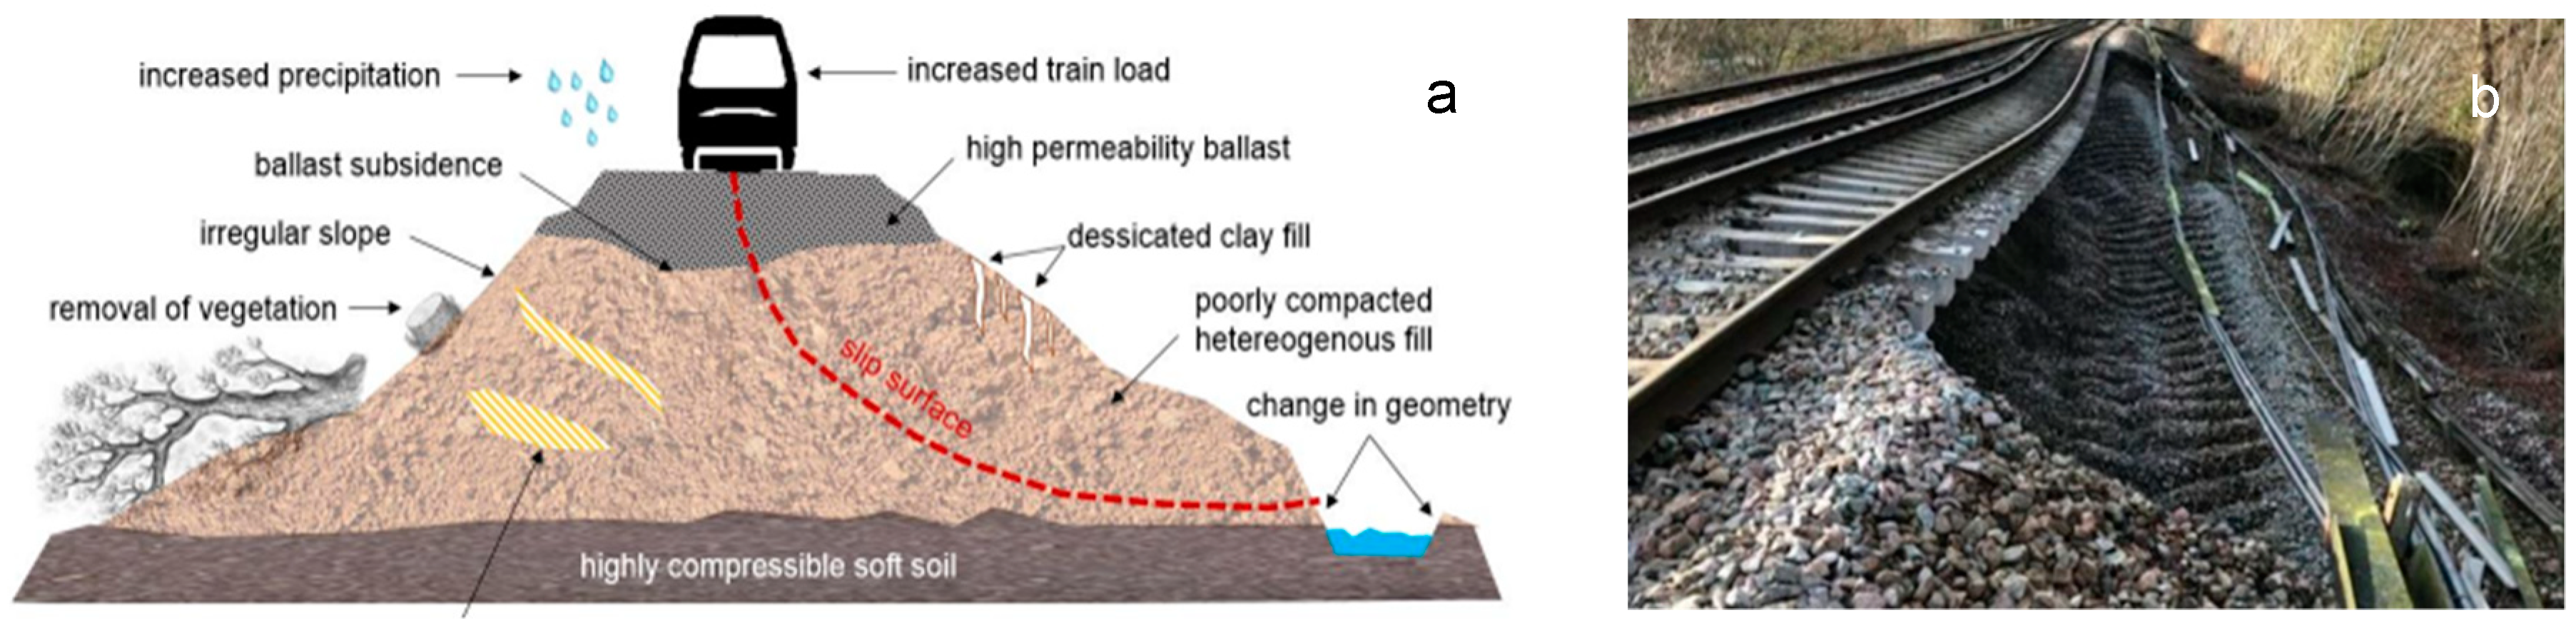
Slope collapses are characterized by the downward sliding of slope materials along a weak surface.
Figure 9a schematically illustrates a weak (slip) surface represented by red dashed lines (Mario Bačić et al., 2022 [
36]). A real example of a railway embankment slope collapse in the Kent region of the UK is shown in
Figure 9b. Generally, elements of slope collapse include the following features: a fracture at the top of the failed zone, flank fractures on the sides of the failed zone, and a dominant failure mode at the weak surface involving shear fractures and compressive damage. The fracture modes in slope collapse primarily represent mixed-mode damage. Specifically, the top fracture is a tensile (mode I) crack, the flank fractures are shear (mode II) cracks, and the failure at the weak surface exhibits mixed-mode damage, combining shear cracking and compressive crushing.
Based on observations, it is proposed that crack propagation at the weak surface is a form of mixed-mode damage in which porous materials are poorly connected (Gaume et al., 2018 [
37]; Philipp et al., 2020 [
38,
39]). Before a slope collapse is released, certain conditions must be met, including the initiation and propagation of top tensile fractures, shear flank fractures, and mixed-mode damage in the weak layer. Once fractures or damage initiate, the slope materials above the weak layer are released if external compression and the self-weight-related driving force overcome the friction of the bed surface. Thus, slope failure propagation can be divided into two stages: damage initiation and crack propagation.
Referring to previous work (Chen, et al. 2022) [
28], a general hybrid stress-based criterion for the mixed-mode damage initiation of porous materials is proposed as shown in Equation (28).
Here, σ
n, σ
t, and σ
c are tensile, shear, and compressive stress, respectively. σ
nc, σ
tc, and σ
cc are their critical values or strengths. Considering soil material features and failure mechanisms, tensile stress can be ignored when evaluating damage initiation, as the loss of cohesion and the influence of compressive stress due to self-weight and external compressive loads dominate. Compressive stresses bring soil particles together and increase shear strength and shear fracture energy according to the basic soil mechanics shown in Equation (29), which presents a relationship among soil shear strength, cohesion, the friction angle, and normal stress.
In Equation (29), normal compressive stress σ
c varies according to the position in embankment slope, and shear strength τ
f is the same as the σ
tc in Equation (28). In addition, cohesion C and friction angle ϕ vary with different soil types, moisture contents, and depths as noted in
Section 3 and
Section 4. Since the effect of compressive stress can be translated into the enhanced shear strength using the basic soil mechanics, Equation (28) can be simplified as
, and it will be used in the assessment of damage initiation in the railway embankment slope in the Kent region. In the second stage of crack propagation, the energy-based criteria are used to judge the mixed-mode crack propagation, as shown in Equation (30).
Here, G
n, G
t, and G
c are strain energy release rates for tensile, shear, and compressive cases. G
nc and G
tc are corresponding critical values, i.e., fracture toughness for tensile and shear cases. G
nc and G
tc are used to assess the tensile and shear dominated fracture propagation on top and both sides of slab, respectively. In these two individual cases, Equation (30) is simplified as G
n = G
nc and G
t = G
tc, respectively. G
cc is defined as a crushing toughness to assess compression damage propagation, and G
tc, together with G
cc, is used to judge mixed-mode damage propagation with coupling effects from shear crack and crushing damage. As mentioned in the previous section, compressive effects can be reflected by increased shear strength and shear fracture energy. Thus, Equation (30) can be simplified as G
t = G
tc for judging the dominated shear crack propagation in the slope. This paper focus on the first stage for damage initiation and progressive formation of the failure area. In this first failure stage, the slope self-weight and external action-related driving force causes the internal stress state to reach the stress-based damage criteria.
7. Modelling Prediction
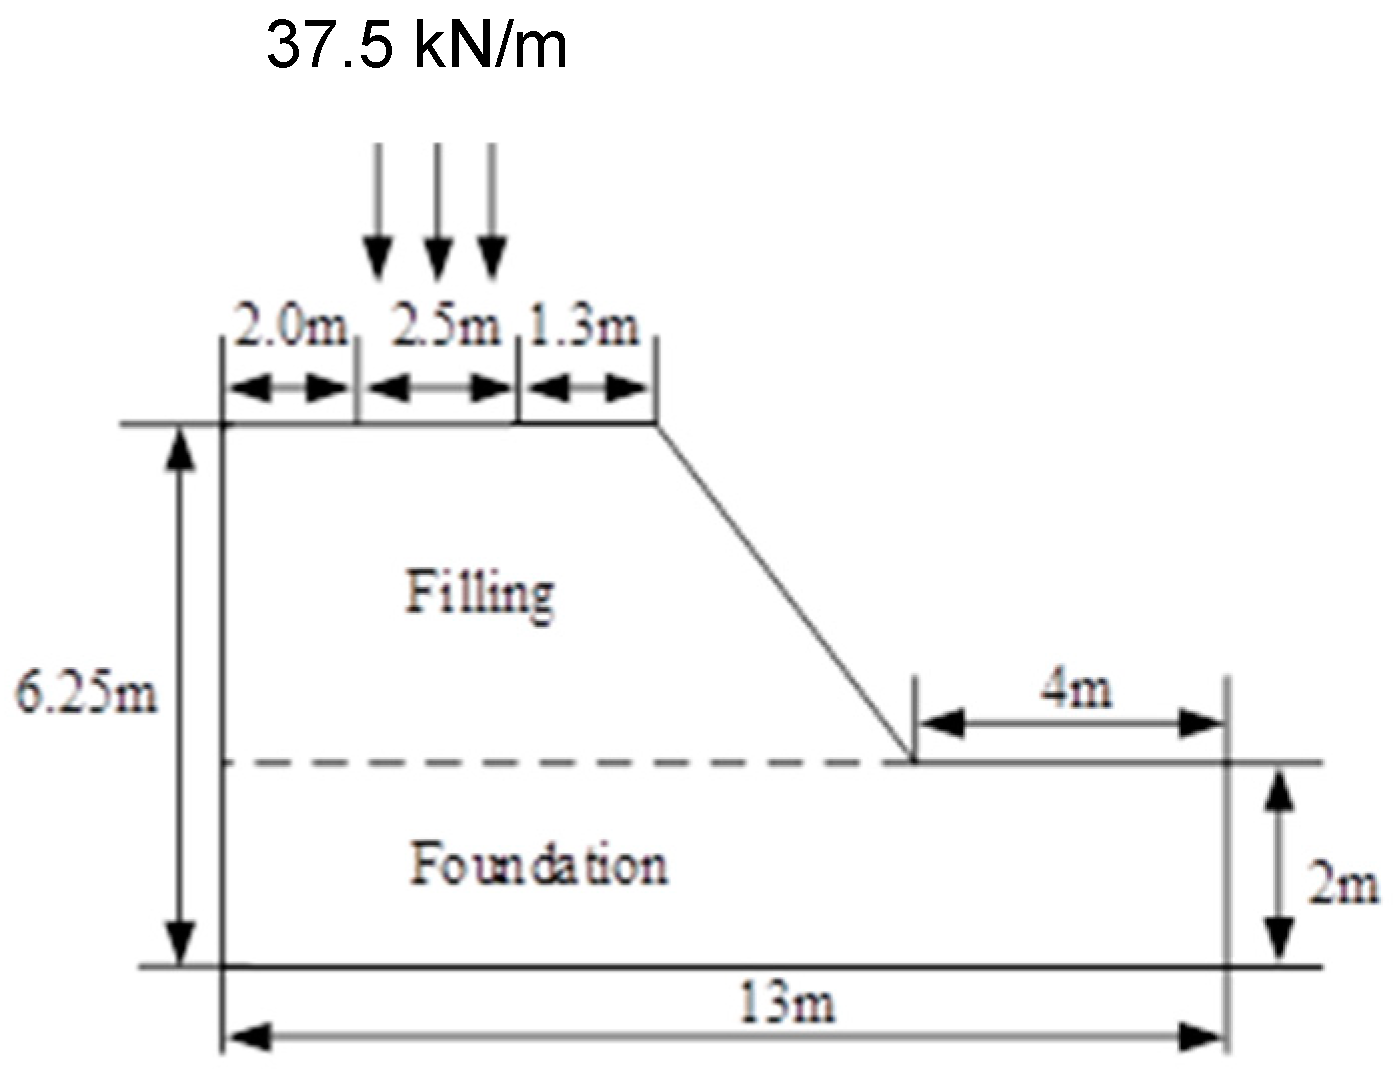
As an example, the railway embankment slope in the Kent region is selected for investigation in this paper.
Figure 10 shows a half-configuration of the railway embankment slope, including its geometrical size, shape, and external load, utilized for the investigation due to its symmetrical features [
18]. The material properties considered in this investigation include soil moisture, cohesion, Young’s modulus, friction angle, and Poisson’s ratio. These properties are treated as functions of soil moisture, following the equations and figures presented in
Section 3 and
Section 5. Their detailed values are provided in
Table 4.
Figure 11 depicts a basic SMECDE model of half of the railway embankment slope, with the following boundary conditions: symmetrical restraints applied at the left edge and fixed restraints applied at the bottom of the model. The mesh density, as shown in
Figure 11, varies with element sizes ranging from 0.1 to 0.25 m for good accuracy. The proposed SMECDE element, consisting of four nodes, is used in the numerical mesh for the simulation. This element has very good iteration accuracy for a relatively wide range of mess densities. Its detailed mess independence can be seen in [
31,
32,
33,
34,
35]. The modeling analysis includes both geostatic and large deformation analyses driven by gravity and train load. The railway train load is simplified as a linearly distributed pressure of 37.5 kN/m. Then, the disturbance from the train to the embankment will be overlooked.
There are six cases with varied soil moisture analyzed using the SMECDE approach. The ground surface soil moisture α varies: 25%, 27%, 29%, 31%, 33%, and 35%. The other corresponding material parameters are presented in
Table 4. It should be noted that soil cohesion and the Young’s modulus vary with soil depth at different moistures and can be calculated using the equations and figures presented in
Section 3 and
Section 5. As an example,
Table 5 shows their values at ground surface moisture of 35% varying with soil depths from 0 to 6 m (the railway embankment slope depth). In
Table 5, E
f varies from 0 to 4 m for embankment fillings, while E
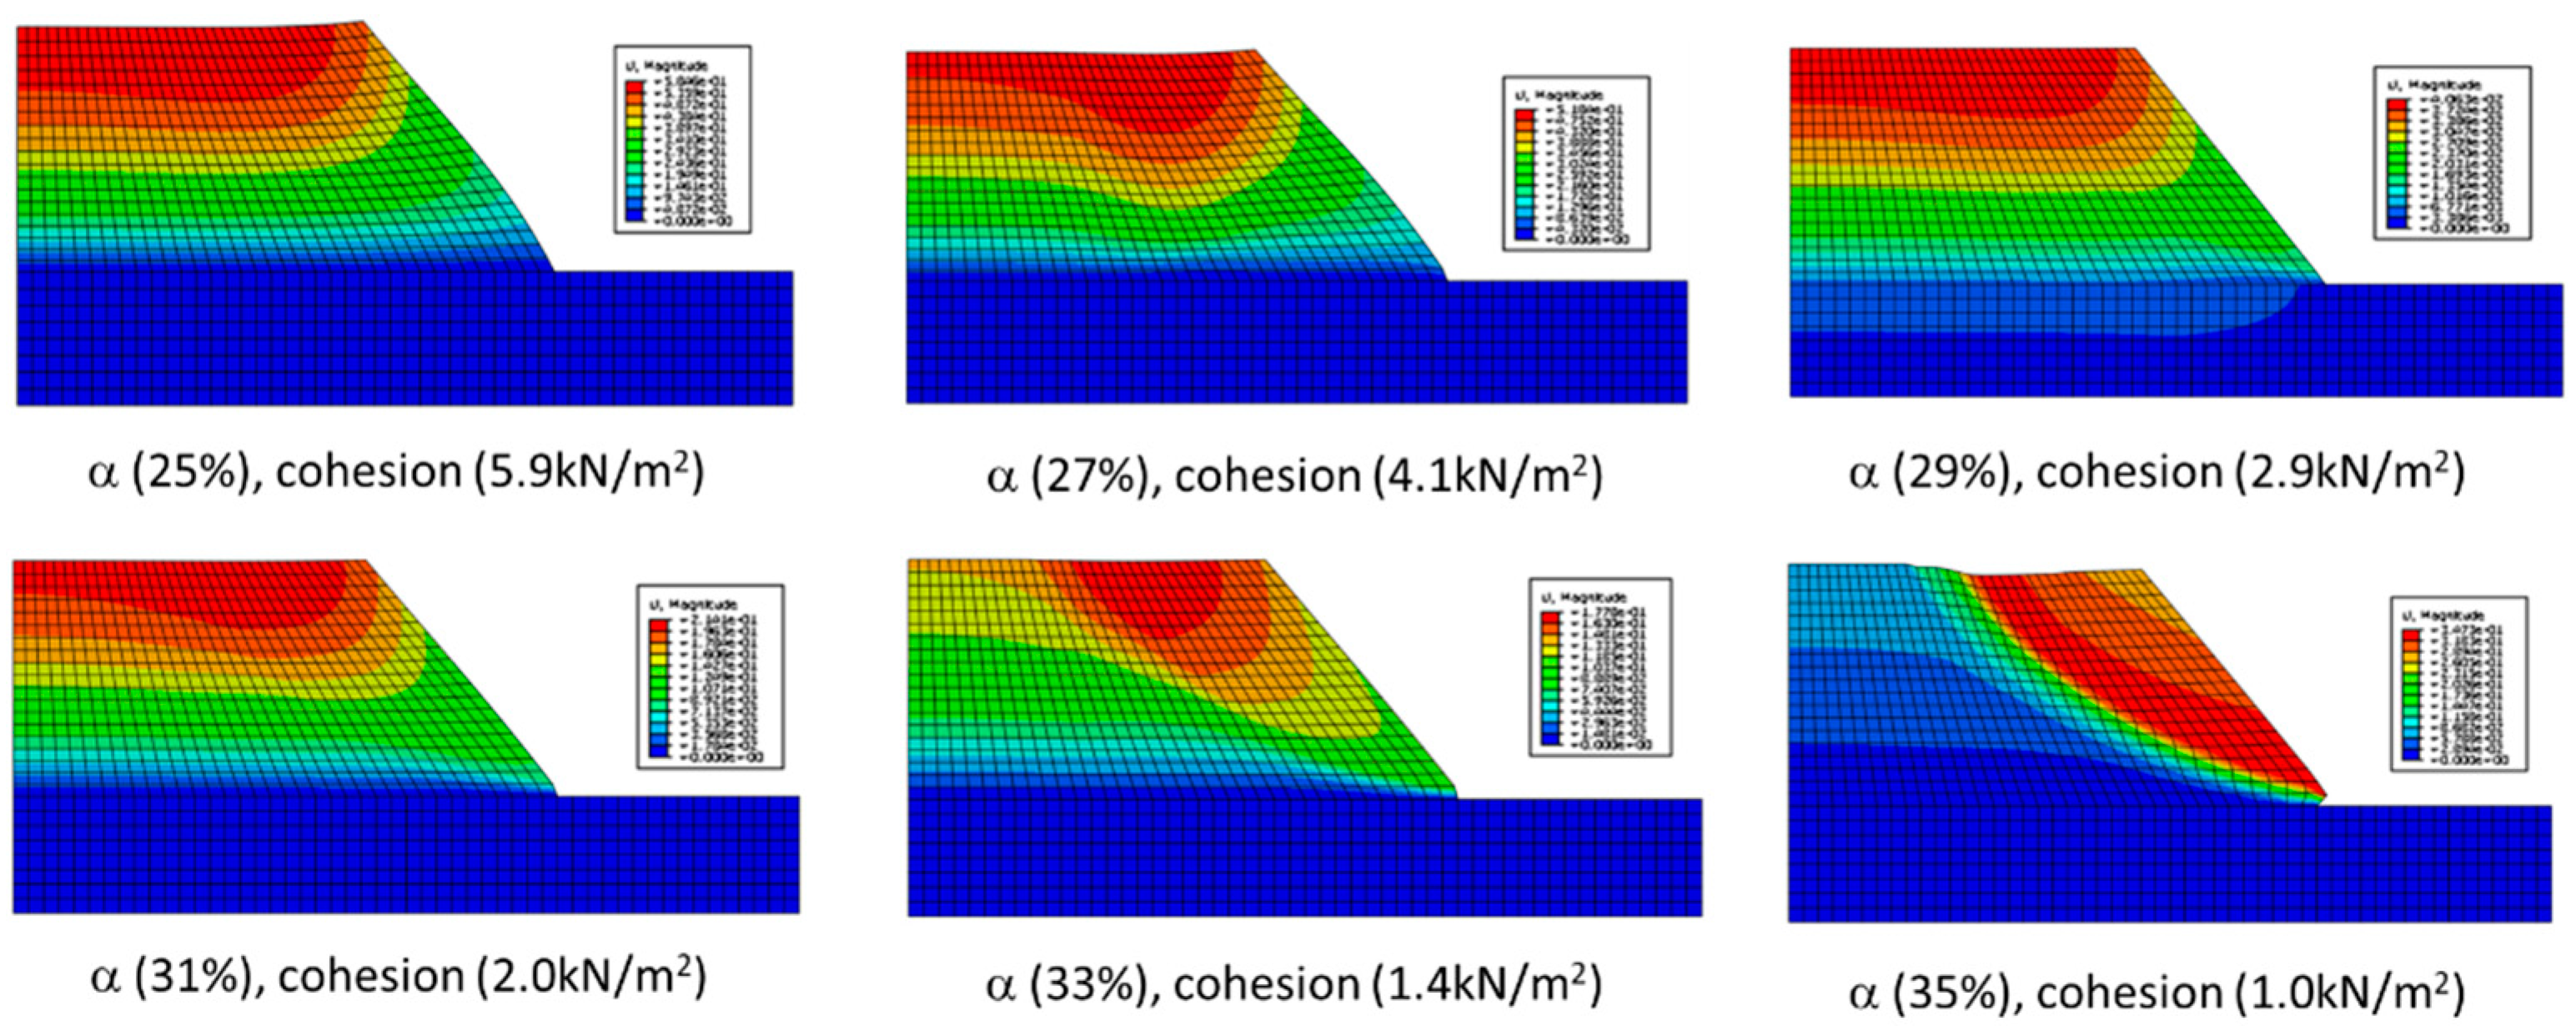
d varies from 5 to 6 m for the foundation. Predictions of damage initiation and the initial damage surface in the Kent railway embankment slope are presented using plastic shear strain contours.
Figure 12 shows predictions of variable damage initiation and the damage surface formed when increasing soil moisture α from 25% to 35%. At 25% moisture, there is only one point of damage at the corner between the embankment fillings and the basement. At 35% moisture, the initial damage finally reaches the point where the train pressure is applied on the top of the slope, thus a significant damaged narrow belt is formed that is the so called initial damage surface. The initial damage surface separates the part of slope to the right above the initial failed surface from the rest of embankment body, but this should be identified using shear crack propagation in the second stage. The material parameters given in
Table 5 at a soil moisture of 35% are used in the SMECDE modelling prediction.
8. Damage Scale of the Railway Embankment Slope and Validation of Modelling Prediction
Using the outcomes from the SMECDE modelling analysis in
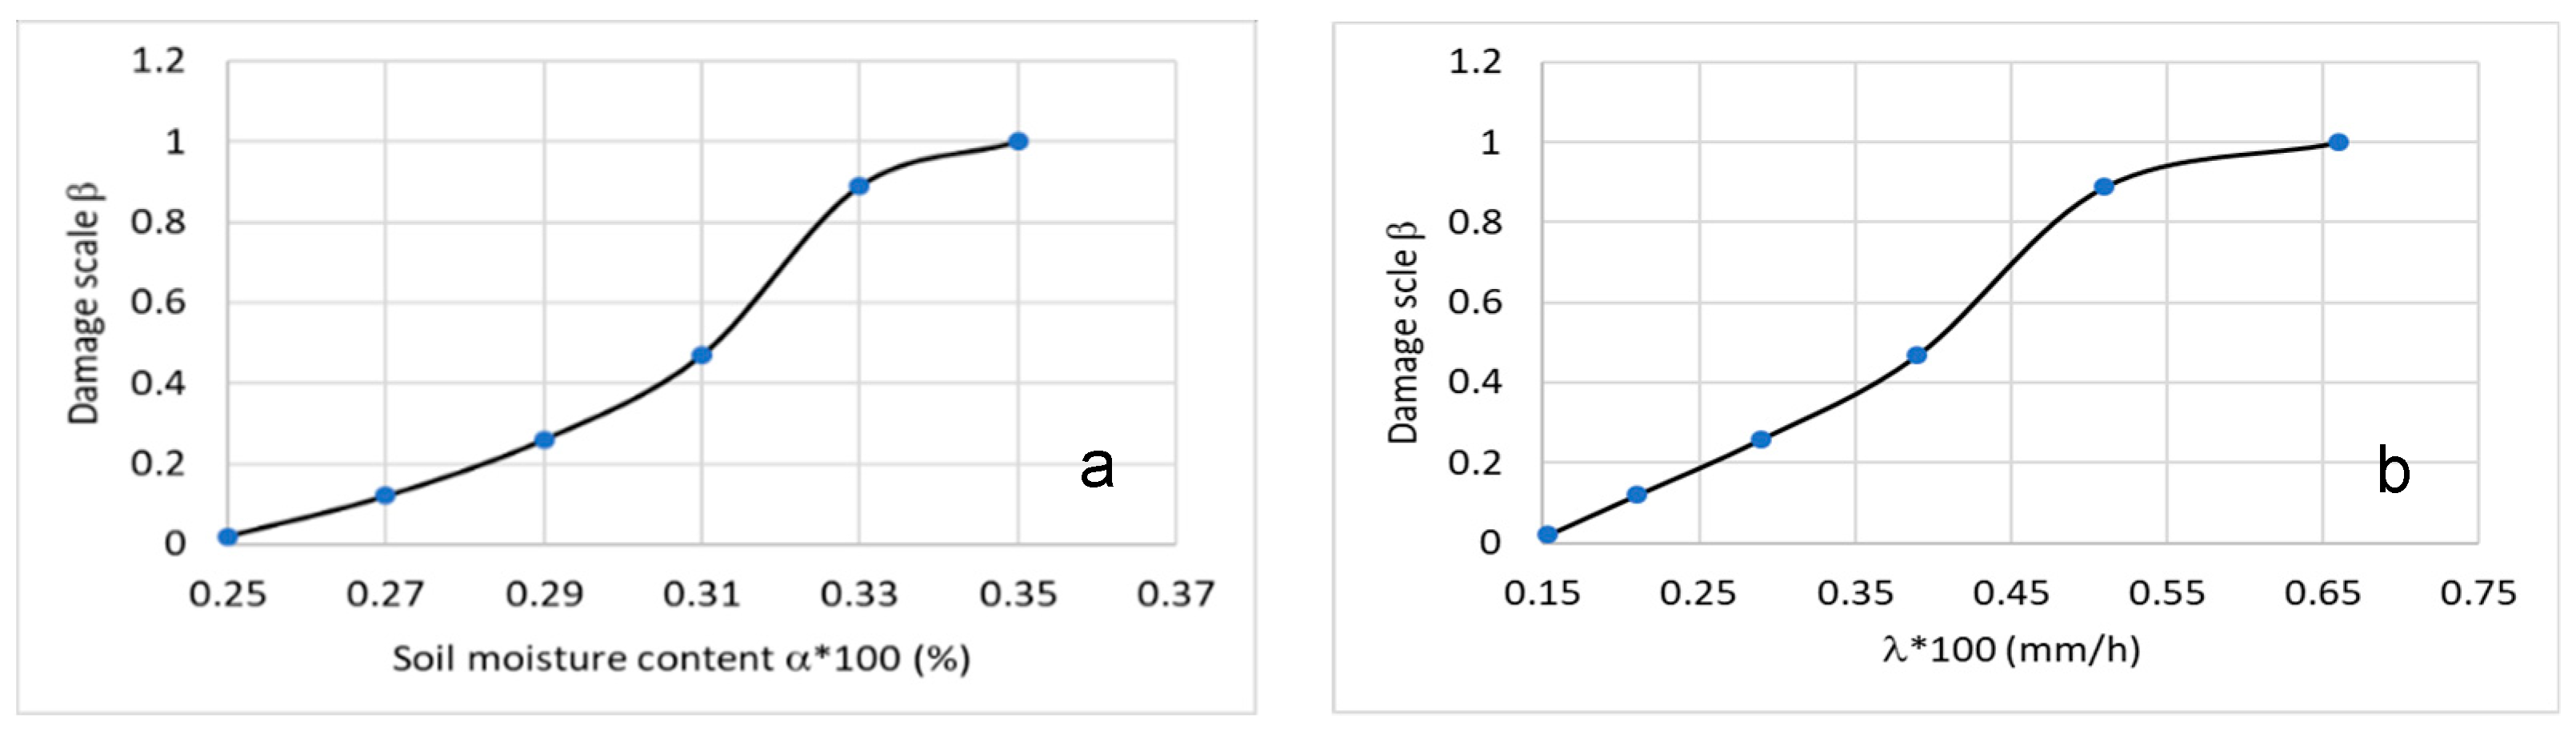
Section 7, the damage scale β can be estimated using the initial damaged belt area presented in
Figure 13 at varied soil moistures or rainfall intensities. The damage scale β shown in
Figure 13 increases from 0 up to 1, which means damage starts at 25% moisture, and total damages occur at 35% moisture, which is identified by the SMECDE failure prediction (
Figure 12).
Figure 13a shows the damage scale β of the Kent railway embankment slope varying with soil moisture α (%). It can be seen from
Figure 13a that the damage scale β stably increases from 25% to 31% moisture, then rapidly increases from 31% to 33% moisture, and finally reaches 1 at 35% moisture, which is identified as the failure state.
Figure 13b shows the damage scale β varying with rainfall intensity λ (mm/h). Obviously, the damage scale β almost linearly increases between rainfall intensities of 15 and 40 (mm/h) and significantly increases after 40 (mm/h) rainfall intensity. This is followed by stably increasing to 1 at a rainfall intensity of 66 (mm/h). This rainfall intensity was considered as a critical rainfall value in previous reports [
35]. Using Equation (1) with correlative parameters n = 0.23 and k = 0.385, a correlation between rainfall intensity and soil moisture, shown in
Figure 13a,b, can be established using Equation (31).
To validate the failure prediction model of the Kent railway embankment slope, there have been no detailed reports investigating the slope failure using either laboratory or field work to date. However, previous meteorological data collected by [
37,
38,
39] showed that the rainfall intensity varied from 60 to 70 mm/h when the railway embankment slope failed at Kent region, as shown in
Figure 9b. This would validate the damage scale prediction in this investigation with a critical rainfall intensity of 66 (mm/h).
Furthermore, the standard commercial FEM package ABAQUS is used to partly validate the SMECDE failure prediction of the Kent railway embankment slope presented in
Section 7. Based on the same numerical mesh (
Figure 10), a standard plain strain element of CPE4I in ABAQUS and the material parameters given in
Table 4 and
Table 5 are employed to model the large deformation under the same loading and restrained conditions that are used in the SMECDE modelling for initial damage analysis.
Figure 14 shows the outcomes of displacement contours of the studied slope at the varied soil moistures ranging from 25% to 35%. At 35% soil moisture, the displacement contour (the last one in
Figure 14) presents a large deformation at the right top body, which also forms a failure surface between the right top body and the rest of the slope. This identifies the SMECDE prediction of the initial damage surface where there is a potential shear crack propagation. However, the standard plain strain element in ABAQUS cannot simulate the shear crack propagation along the failed surface or explicitly predict the failure load to cause the shear crack propagation in slopes.
9. Conclusions and Future Work
The developed SMECDE method was successfully applied to predict damage initiation and the progressive formation of the failure surface at the selected Kent railway embankment slope using meteorological data related to soil moisture and rainfall. This investigation examined the embankment slope failure mechanisms in the Kent region under varying soil moisture levels and rainfall intensities.
For the first time, this study associated initial damage and the potential failure surface of a slope with forecasted rainfall intensity and soil moisture. It also explored the scale of slope damage as a function of soil moisture or rainfall intensity. The findings revealed that in the Kent region, when soil moisture reached 35%, the embankment slope was at a high risk of failure, with a corresponding critical rainfall intensity estimated at 66 mm/hour. The developed SMECDE method offers a promising tool for issuing railway slope failure warnings based on weather forecasts. The SMDM was developed using data from previous investigations that considered national soil moisture content. Future research will focus on investigating the effects of time-dependent changes in soil moisture or rainfall intensity on soil cohesion reduction. Furthermore, a temporal and spatial digital network could be developed using the SMECDE approach. This network could consider various factors, such as soil types, slope angles, and sizes, to predict railway slope failures based on weather forecasts, thereby aiding decision-making processes.


