Abstract
In spaced crop systems, understanding the interactions between different types of vegetation in the agroecosystem and solar radiation is essential for understanding surface radiation dynamics. This study aimed to both seasonally and spatially quantify and characterize the components of the solar radiation balance in the cultivation of green dwarf coconut. The experiment was conducted in Santa Izabel do Pará, Brazil, and monitored the following meteorological parameters: rainfall, incident global radiation (Rg), and net radiation (Rn). Landsat 8 satellite images were obtained between 2021 and 2023, and the estimates for global and net radiation were subsequently calculated. The resulting data were subjected to mean tests and performance index analysis. The dry season showed higher values of Rg and Rn due to reduced cloud cover. In contrast, the rainy season exhibited lower Rg and Rn totals, with reductions of 21% and 23%, respectively. In the irrigated area, a higher Rn/Rg fraction was observed compared to the non-irrigated area, with no significant differences between the row and inter-row zones. In the non-irrigated system, there were no seasonal differences, but a spatial difference between row and inter-row was noted, with the row having higher net radiation (9.95 MJ m−2 day−1) than the inter-row (8.36 MJ m−2 day−1), which could result in distinct energy balances at a micrometeorological scale. Spatially, the eastern portion of the study area showed higher global radiation totals, with the radiation balance predominantly ranging between 400 and 700 W m−2. Based on the performance indices obtained, satellite-based estimates proved to be a viable alternative for characterizing the components of the radiation balance in the region, provided that the images have low cloud cover.
1. Introduction
In the humid tropical conditions that prevail in the Amazon, understanding the microclimatic processes between climate and vegetation is essential for optimizing crop management. In agroecosystems, solar radiation across its entire spectrum is considered a key environmental factor that significantly affects crop growth, development, and productivity. Solar radiation plays a critical role in regulating the photosynthesis rate and controlling biophysical surface processes, such as air and soil heating, as well as evaporation and transpiration processes [1].
In crops with wider plant spacing, the radiation balance results from the radiative processes between the vegetation in the rows and the vegetation or absence of vegetation in the inter-rows [2]. Characteristics intrinsic to the cover type, such as emissivity and albedo, influence the radiation balance, directly affecting the amount of energy available to the surface and its absorption for photosynthesis and biomass production processes [3].
Among crops with wide spacing between plants and inter-rows, the green dwarf coconut palm (Cocos nucifera L.) stands out with a spacing of 7.5 × 7.5 m, commonly intercropped with tropical kudzu [Pueraria phaseoloides (Roxb.) Benth.] in cultivation systems in the Amazon region. This intercropping aims to cover the bare soil, which is characterized by the large spacing between rows in the region. Additionally, it promotes biological nitrogen fixation and reduces soil moisture loss through evaporation, among other benefits [4]. The presence of this leguminous plant increases the diversity of leaf architectures within the agroecosystem, enhancing interactions between solar radiation and plant types.
Economically, the coconut palm is a highly relevant species in tropical regions, as all its parts can be utilized, including fruits, leaves, pulp, husks, and fibers [5]. Brazil stands out as the fourth-largest global producer of this species, with an estimated production of approximately 2.9 million tons in 2023, cultivated over an area of 187,000 hectares [6]. Nationally, production in the Amazon region is particularly prominent in the state of Pará, which ranked third among the main producing states, reaching an average yield of ten thousand fruits per hectare in the same year, generating approximately 172.2 million harvested fruits [7].
Although studies have examined the interaction between solar radiation and agricultural crops [8,9,10,11], research on this topic remains surprisingly limited when it comes to intercropping systems, particularly under the specific climatic conditions of the Amazon. This gap highlights the need for more comprehensive studies that consider the diversity of vegetation in such environments. Thus, the innovation of the present study is associated with investigating the effect of coconut + tropical kudzu on the distribution of solar radiation at the surface. This is especially relevant given the lack of studies in Brazil specifically focusing on solar radiation in this context, as previous research has primarily considered isolated crops and more applied contexts, such as water productivity [12] and evapotranspiration [13].
The quantification or estimation of the radiation balance can be performed using various methodologies, such as field-installed radiometers mounted on micrometeorological towers for direct measurements, empirically calibrated equations tailored to different environmental conditions, and models utilizing satellite images for spatial characterization [14,15,16]. The use of sensors depends on crop characteristics. In homogeneous crops with a flat surface, radiation exchange can be assessed using a horizontally positioned net radiometer on the surface [17]. However, when measuring isolated plants, either to evaluate specific canopy sections or in widely spaced crops, these same authors suggest a different approach. In such cases, multiple radiation sensors are arranged around the plant to form a geometric sampling structure. Although this method improves the accuracy of radiative exchange measurements, it requires a greater number of sensors, thereby increasing costs.
The use of satellite images has become an alternative for estimating radiative exchange in agricultural crops [12]. This technique provides high spatial and temporal resolution, enabling the rapid and efficient analysis of large areas with consistent and freely available data [18]. However, certain limitations make its application challenging in regions with high cloud cover, which is common in rainy climates, potentially affecting data collection [19]. Understanding the relationship between each component (row and inter-row) and solar radiation is essential for identifying how each interface contributes to the biophysical processes of radiation and energy balance.
Despite the advantages of using satellite images, these data need to be validated for each study region to ensure the model correctly functions in estimating these variables in the area [16,20]. Satellite-based estimation provides spectral products that allow for the characterization of vegetation and soil reflectance and emissivity, while meteorological towers provide continuous measurements of incident and reflected radiation, enabling direct validation of satellite data [20]. This combined approach enhances the accuracy of models and facilitates the application of results in large-scale studies in the region, overcoming the limitations associated with exclusively point-based measurements.
In this context, the objective of this study was to both seasonally and spatially quantify and characterize the components of the solar radiation balance and validate their estimation via satellite in areas where green dwarf coconut palms are intercropped with P. phaseoloides under humid tropical conditions in Eastern Amazon.
2. Materials and Methods
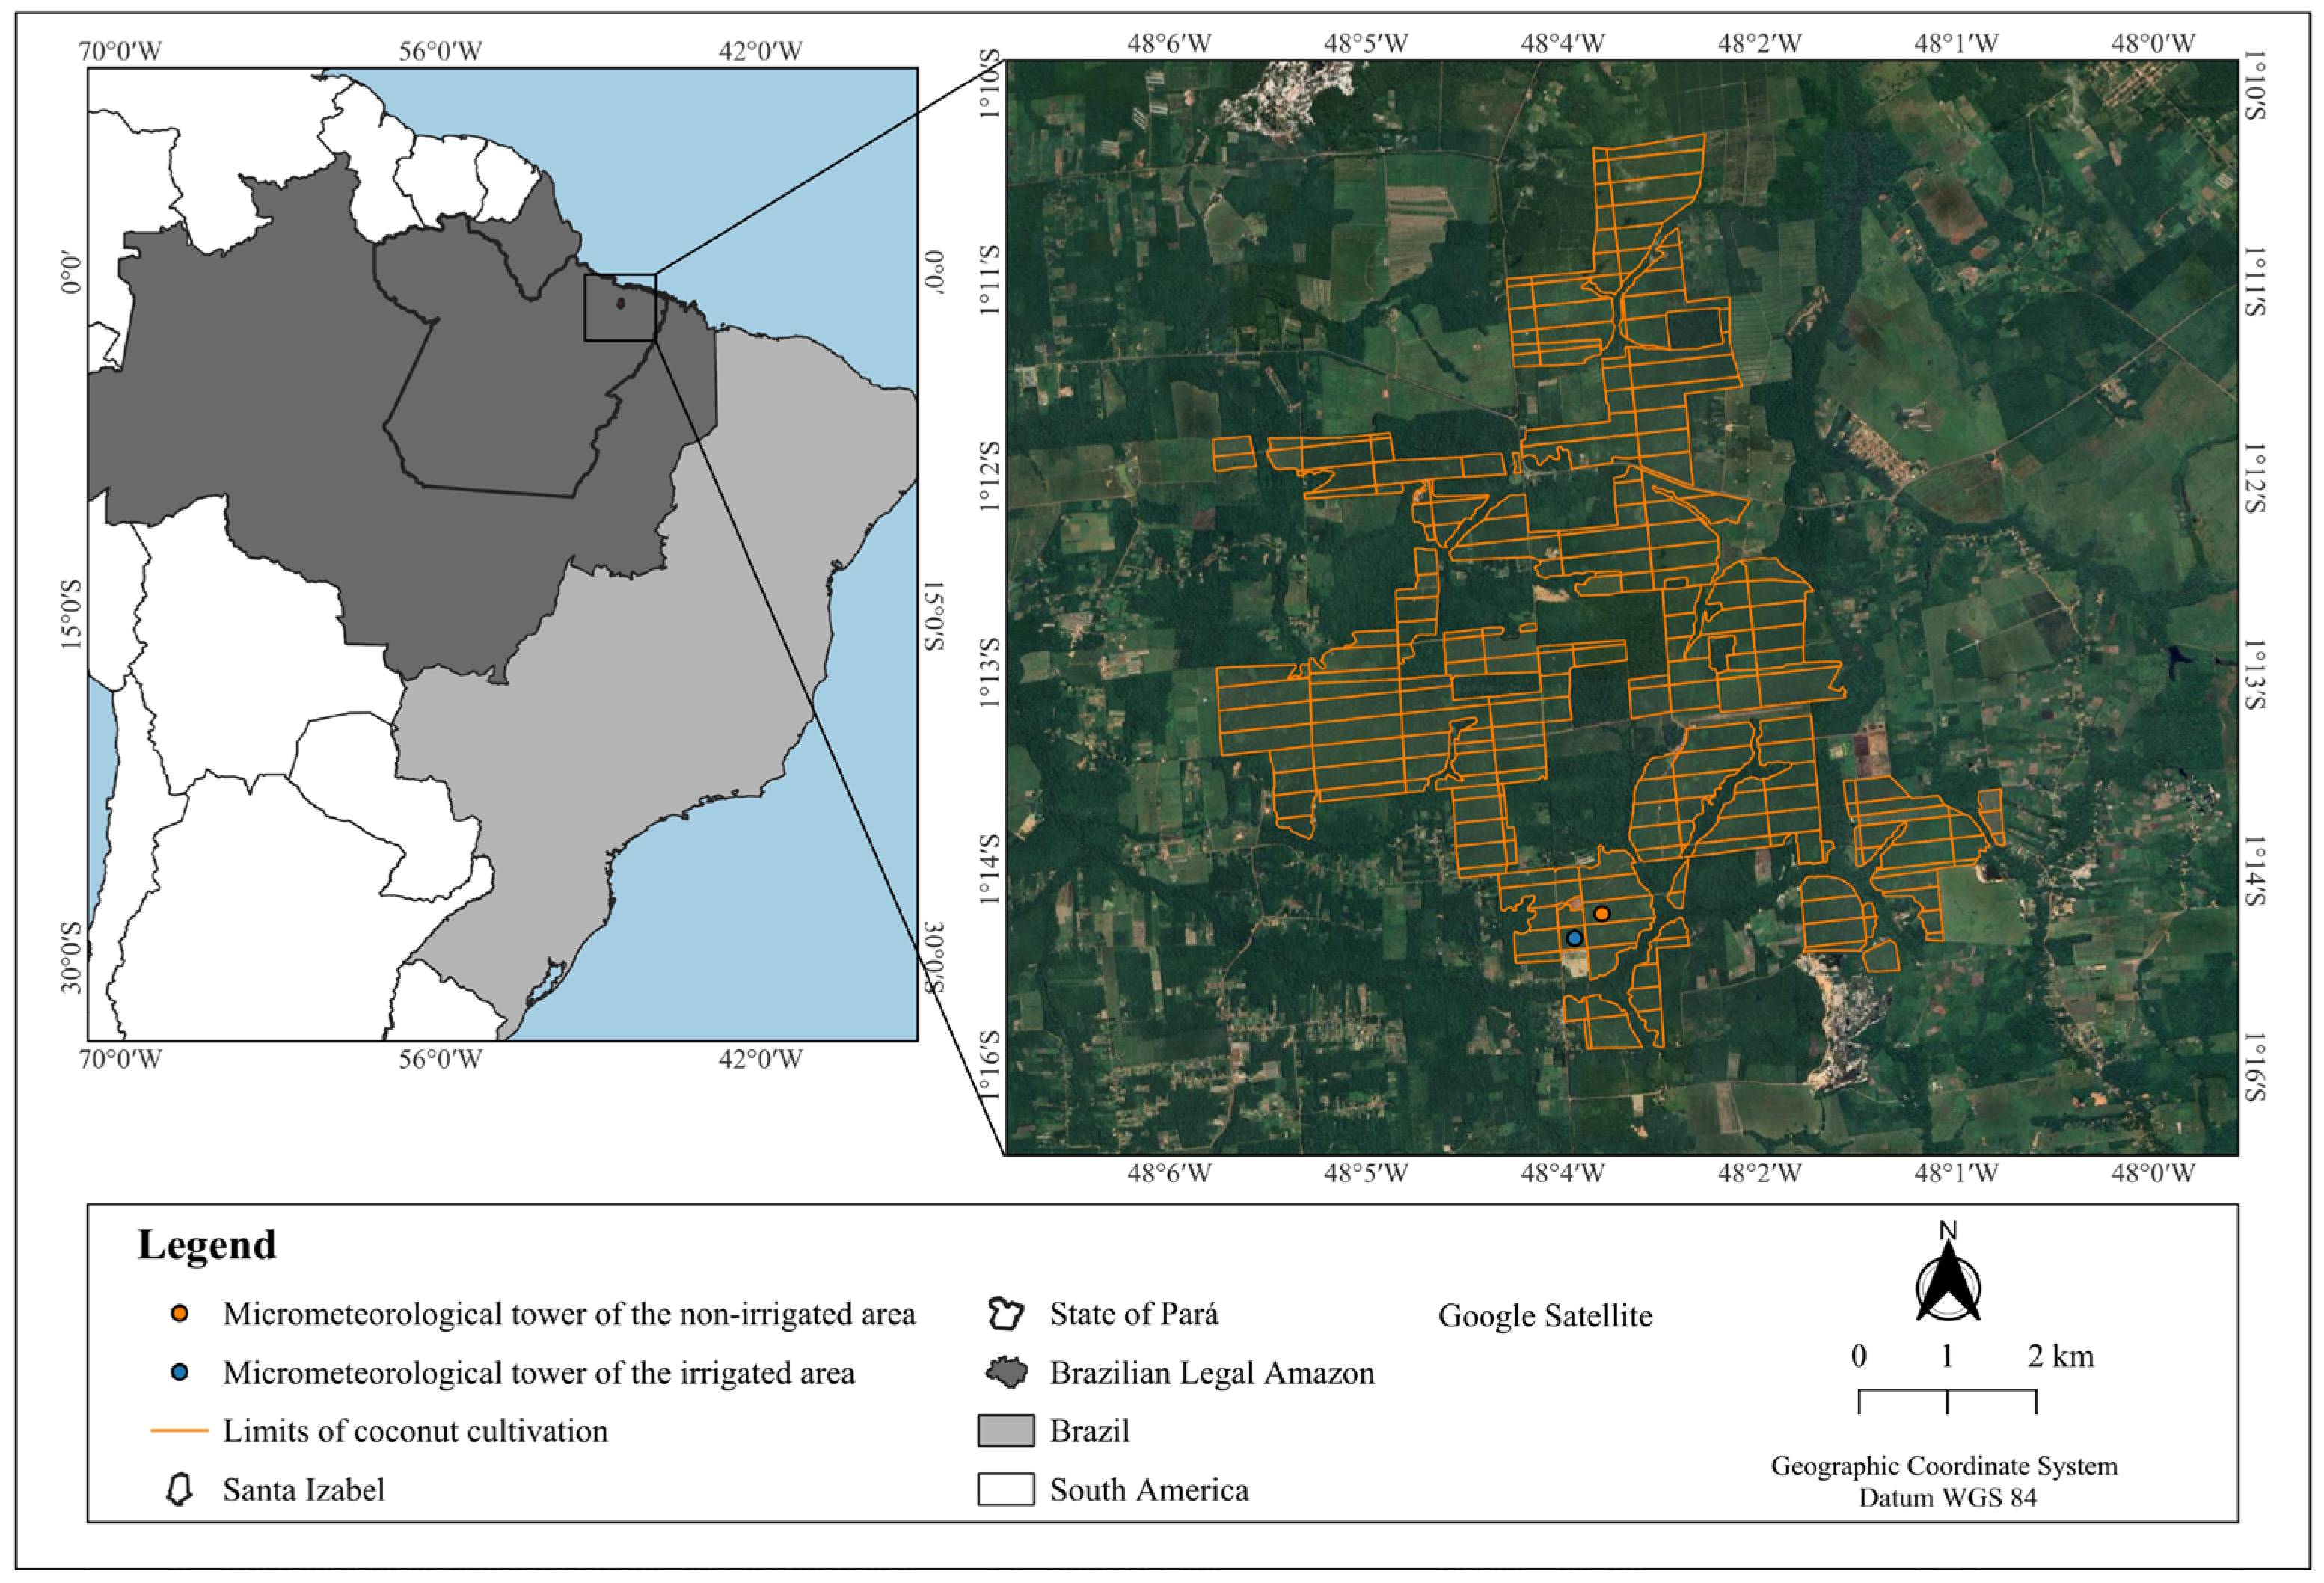
Located in the municipality of Santa Izabel do Pará, Pará, Brazil (Figure 1), Farm Reunidas Sococo (−01°12′36″ S; −48°04′48″ W) served as the site for the experiment. The region is classified as having an “Am” climate subtype according to the Köppen–Geiger system, with a yearly average temperature of 26 °C and annual precipitation surpassing 2000 mm. Rainfall is unevenly distributed throughout the year, with a rainy season lasting from December to July, followed by a dry season from August to November [21,22,23].
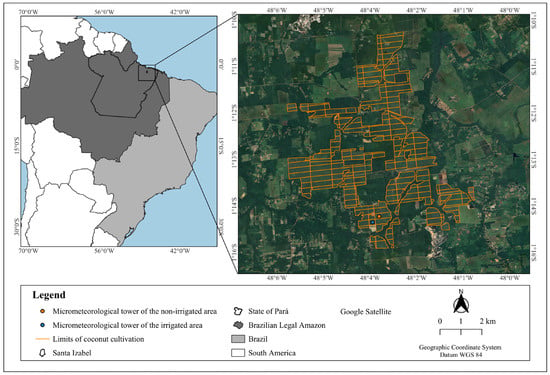
Figure 1.
The experimental area will be Farm Reunidas Sococo, Santa Izabel do Pará, Pará, Brazil. NI—non-irrigated area; I—irrigated area.
The soil in the study area is classified as Arenosol [24], corresponding to Quartzipsamment [25], with its properties detailed in Table 1, the results of which were obtained by Carvalho et al. [26]. Additional information about the characterization of the experimental area, including cultivation practices and management, can be found in Carvalho et al. [26] and Fernandes et al. [27].

Table 1.
Physicochemical and hydraulic properties of the soil in the experimental area.
This study was conducted on a commercial plantation of green dwarf coconut (Cocos nucifera L.), cv. Anão-Verde-do-Brasil-de-Jiqui (AVeBrJ), from August 2020 to February 2024. This research took place in two distinct areas: an irrigated plot established in 2014 and a rainfed plot planted in 2012. The coconut trees, covering approximately 7 ha in the irrigated area and 19.5 ha in the non-irrigated area, have an average height of 7.30 m. They are arranged in a triangular planting pattern with 7.5 × 7.5 × 7.5 m spacing, resulting in a final density of 205 plants per hectare. The ground beneath the canopy is covered with tropical kudzu, an herbaceous legume.
Incident and reflected global radiation, net radiation, and rainfall were monitored using a 12 m high micrometeorological tower installed in each area (irrigated and non-irrigated). Each tower was equipped with sensors to measure incident global radiation at 0.4 m above the canopy using a CMP3 pyranometer (Campbell Scientific Instrument, Logan, UT, USA), which is classified as a second-class sensor with an accuracy of ±5% for daily totals and a spectral range of 310–2800 nm. Reflected radiation was measured from coconut trees at 0.4 m above the canopy and from P. phaseoloides at 3.5 m above the surface. Net radiation was measured at 2.4 m above the canopy in the crop row and at 6.70 m above the surface in the crop inter-row using an NR-LITE2 sensor (Campbell Scientific Instrument, Logan, UT, USA), which has a sensitivity of 10 µV W−1 m−2, a measurement range of ±2000 W m−2, and a spectral range of 0.2–100 µm. Rainfall was recorded at 2.4 m above the canopy using a TB4 tipping-bucket rain gauge (Campbell Scientific Instrument, Logan, UT, USA), which has a resolution of 0.1 mm per tip and an accuracy of ±2% for rainfall rates up to 25 mm h−1 and ±3% for rates between 25 and 50 mm h−1.
The sensors of the micrometeorological tower in the irrigated area were connected to two data acquisition and storage systems (Datalogger CR1000 and CR10X, Campbell Scientific, Inc., Logan, UT, USA) and a multiplexer (AM416, Campbell Scientific, Inc., Logan, UT, USA). The system was configured to take instantaneous measurements every 10 s and to log averages and totals every 20 min. In the non-irrigated area, the same measurement protocol was followed; however, all sensors were connected to a single Datalogger CR10X (Campbell Scientific, Inc., Logan, UT, USA).
All the sensors were calibrated in the laboratory to verify their operational condition before being installed in the field. The calibration process involved comparing the readings of the radiation sensors to check for consistency between them, placing them at the same height and over the same surface. To verify the response of the rainfall sensors, specific amounts of water were applied to the sensor to assess its accuracy in quantifying precipitation, ensuring that they provided reliable measurements under field conditions. This process is crucial to minimize errors and ensure the reliability of the data collected during the experiment.
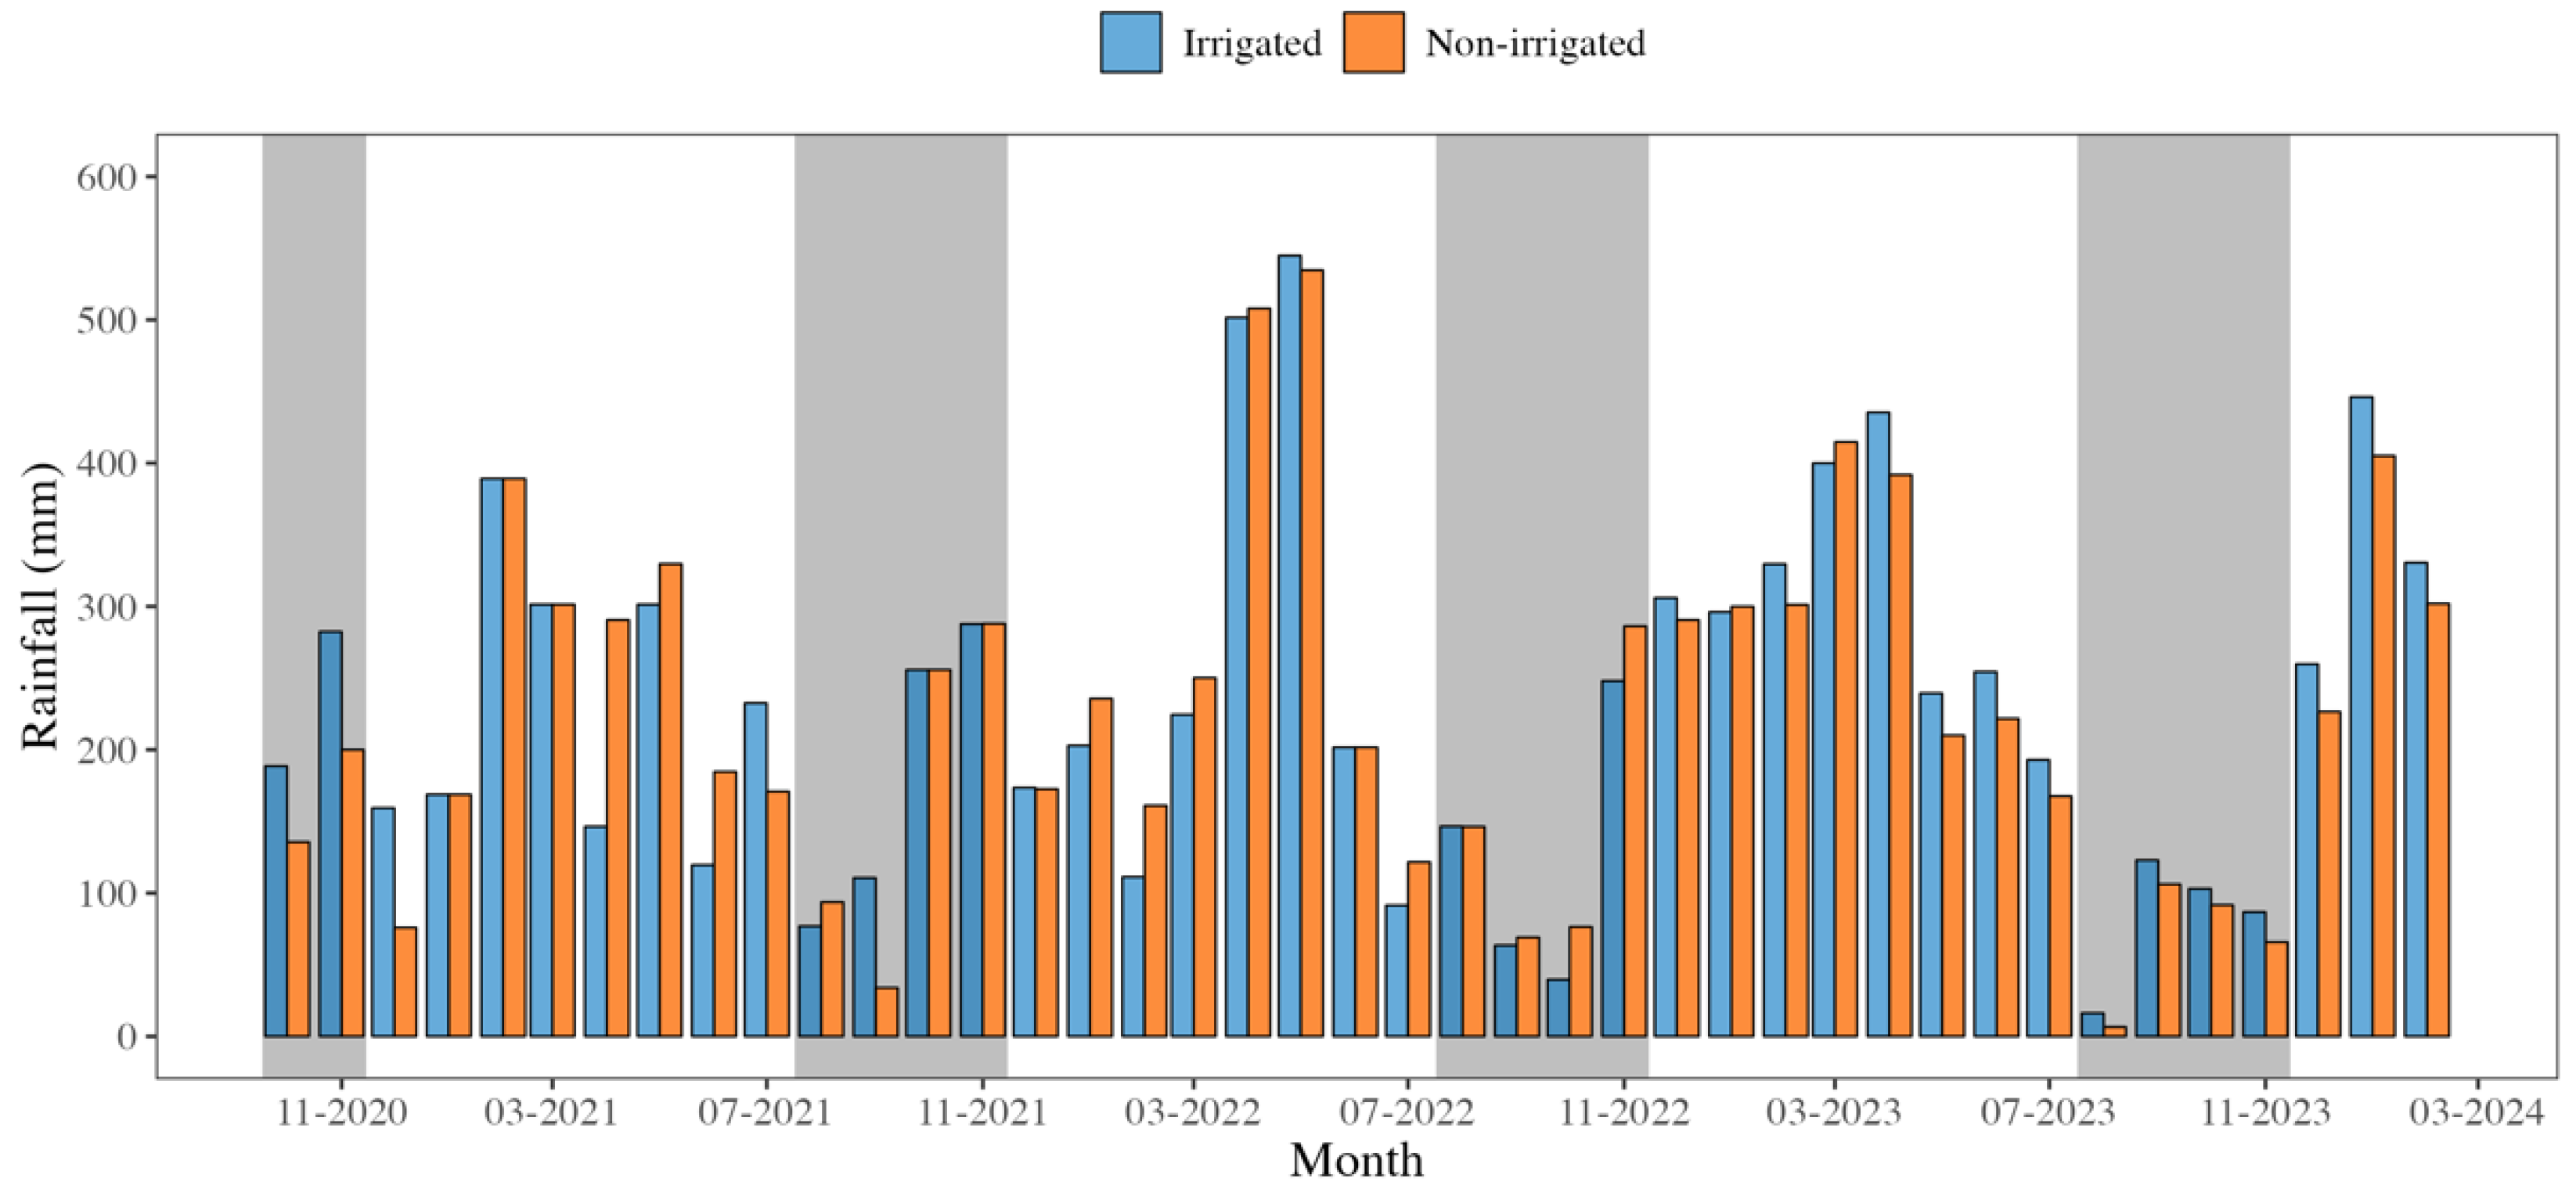
During this period, the average annual accumulated rainfall was 2660.9 mm in the irrigated area, with 2141.7 mm (80.5%) occurring during the rainy season and 519.3 mm (19.5%) during the dry season. In the non-irrigated area, the total average annual rainfall was 2688.4 mm, with 2181.8 mm (81.1%) recorded during the rainy season and 506.6 mm (18.9%) during the dry season. Rainfall was observed on 75.26% of the days throughout the study period (Figure 2).
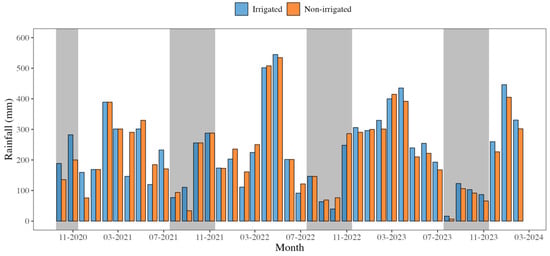
Figure 2.
Monthly rainfall in an irrigated and non-irrigated green dwarf coconut growing area under humid tropical climate conditions. Shaded areas refer to the region’s dry period.
Leaf temperature (°C) was measured for both the main crop (coconut palm) and the cover crop (tropical kudzu). For coconut palms, assessments were conducted on leaf 14, while for tropical kudzu, measurements were taken from a physiologically mature, fully expanded leaf. Readings were recorded between 08:00 and 17:00 using a portable infrared gas analyzer (IRGA, model LI-6400XT, LICOR®, Lincoln, Nebraska) under an external CO₂ concentration of 400 μmol mol⁻1 of air and ambient photosynthetically active radiation (PAR). Data collection included the characterization of a daily temperature curve for both the rainy and dry seasons.
For the acquisition of satellite images, the Google Earth Engine platform was used, which provides access to the Landsat satellite database. The database used was from Landsat 8, Level 2 (LANDSAT/LC08/C02/T1_L2), with images acquired by the OLI (Operational Land Imager) and TIRS (Thermal Infrared Sensor) sensors, which already include atmospheric correction [28]. These images have a spatial resolution of 30 m for reflective bands 1 to 7 and 100 m for thermal bands 10 and 11, while the panchromatic band 8 has a resolution of 15 m.
The images for the region were selected based on the absence of clouds or low cloud cover (less than 10%) or, in some cases, images in which the pixels corresponding to the micrometeorological towers were free of clouds. This criterion is essential to ensure the accuracy of solar radiation estimates, as the presence of clouds can alter surface reflectance and compromise the accuracy of satellite-based measurements [29].
Thus, eight orbital images were obtained, most of them acquired during the dry season of the region (August to November) due to the lower cloud cover. These images were partially processed using the Measuring Evapotranspiration at High Resolution with Internalized Calibration (METRIC) model, including all processing steps and calculations leading to the net radiation balance. All methodological details, including processing and associated calculations, can be found in Allen et al. [30]. Adaptations were made to the original methodology to allow calculations using images from these satellites, which were unavailable when the original model was developed, without altering its fundamental principles. These adaptations are detailed below.
The surface albedo was calculated according to the methodology proposed by Silva et al. [31], where the planetary albedo (αTOA) is computed as a weighted average of the reflectance of each satellite band using the following equation:
where ω2 = 0.300, ω3 = 0.277, ω4 = 0.233, ω5 = 0.143, ω6 = 0.036, and ω7 = 0.012.
The corrected surface albedo (α) is then computed as
where αAT is the atmospheric albedo, 0 ≤ τsw ≤ 1 is the atmospheric transmittance, which, like the other calculations, is carried out according to Allen et al. [30].
Net radiation (Rn) is then estimated using the following equation:
where is the incident global radiation, is the reflected shortwave radiation such that , is the longwave radiation directed downwards, is the longwave radiation directed upwards, and is the surface emissivity. These variables were estimated according to Allen et al. [30].
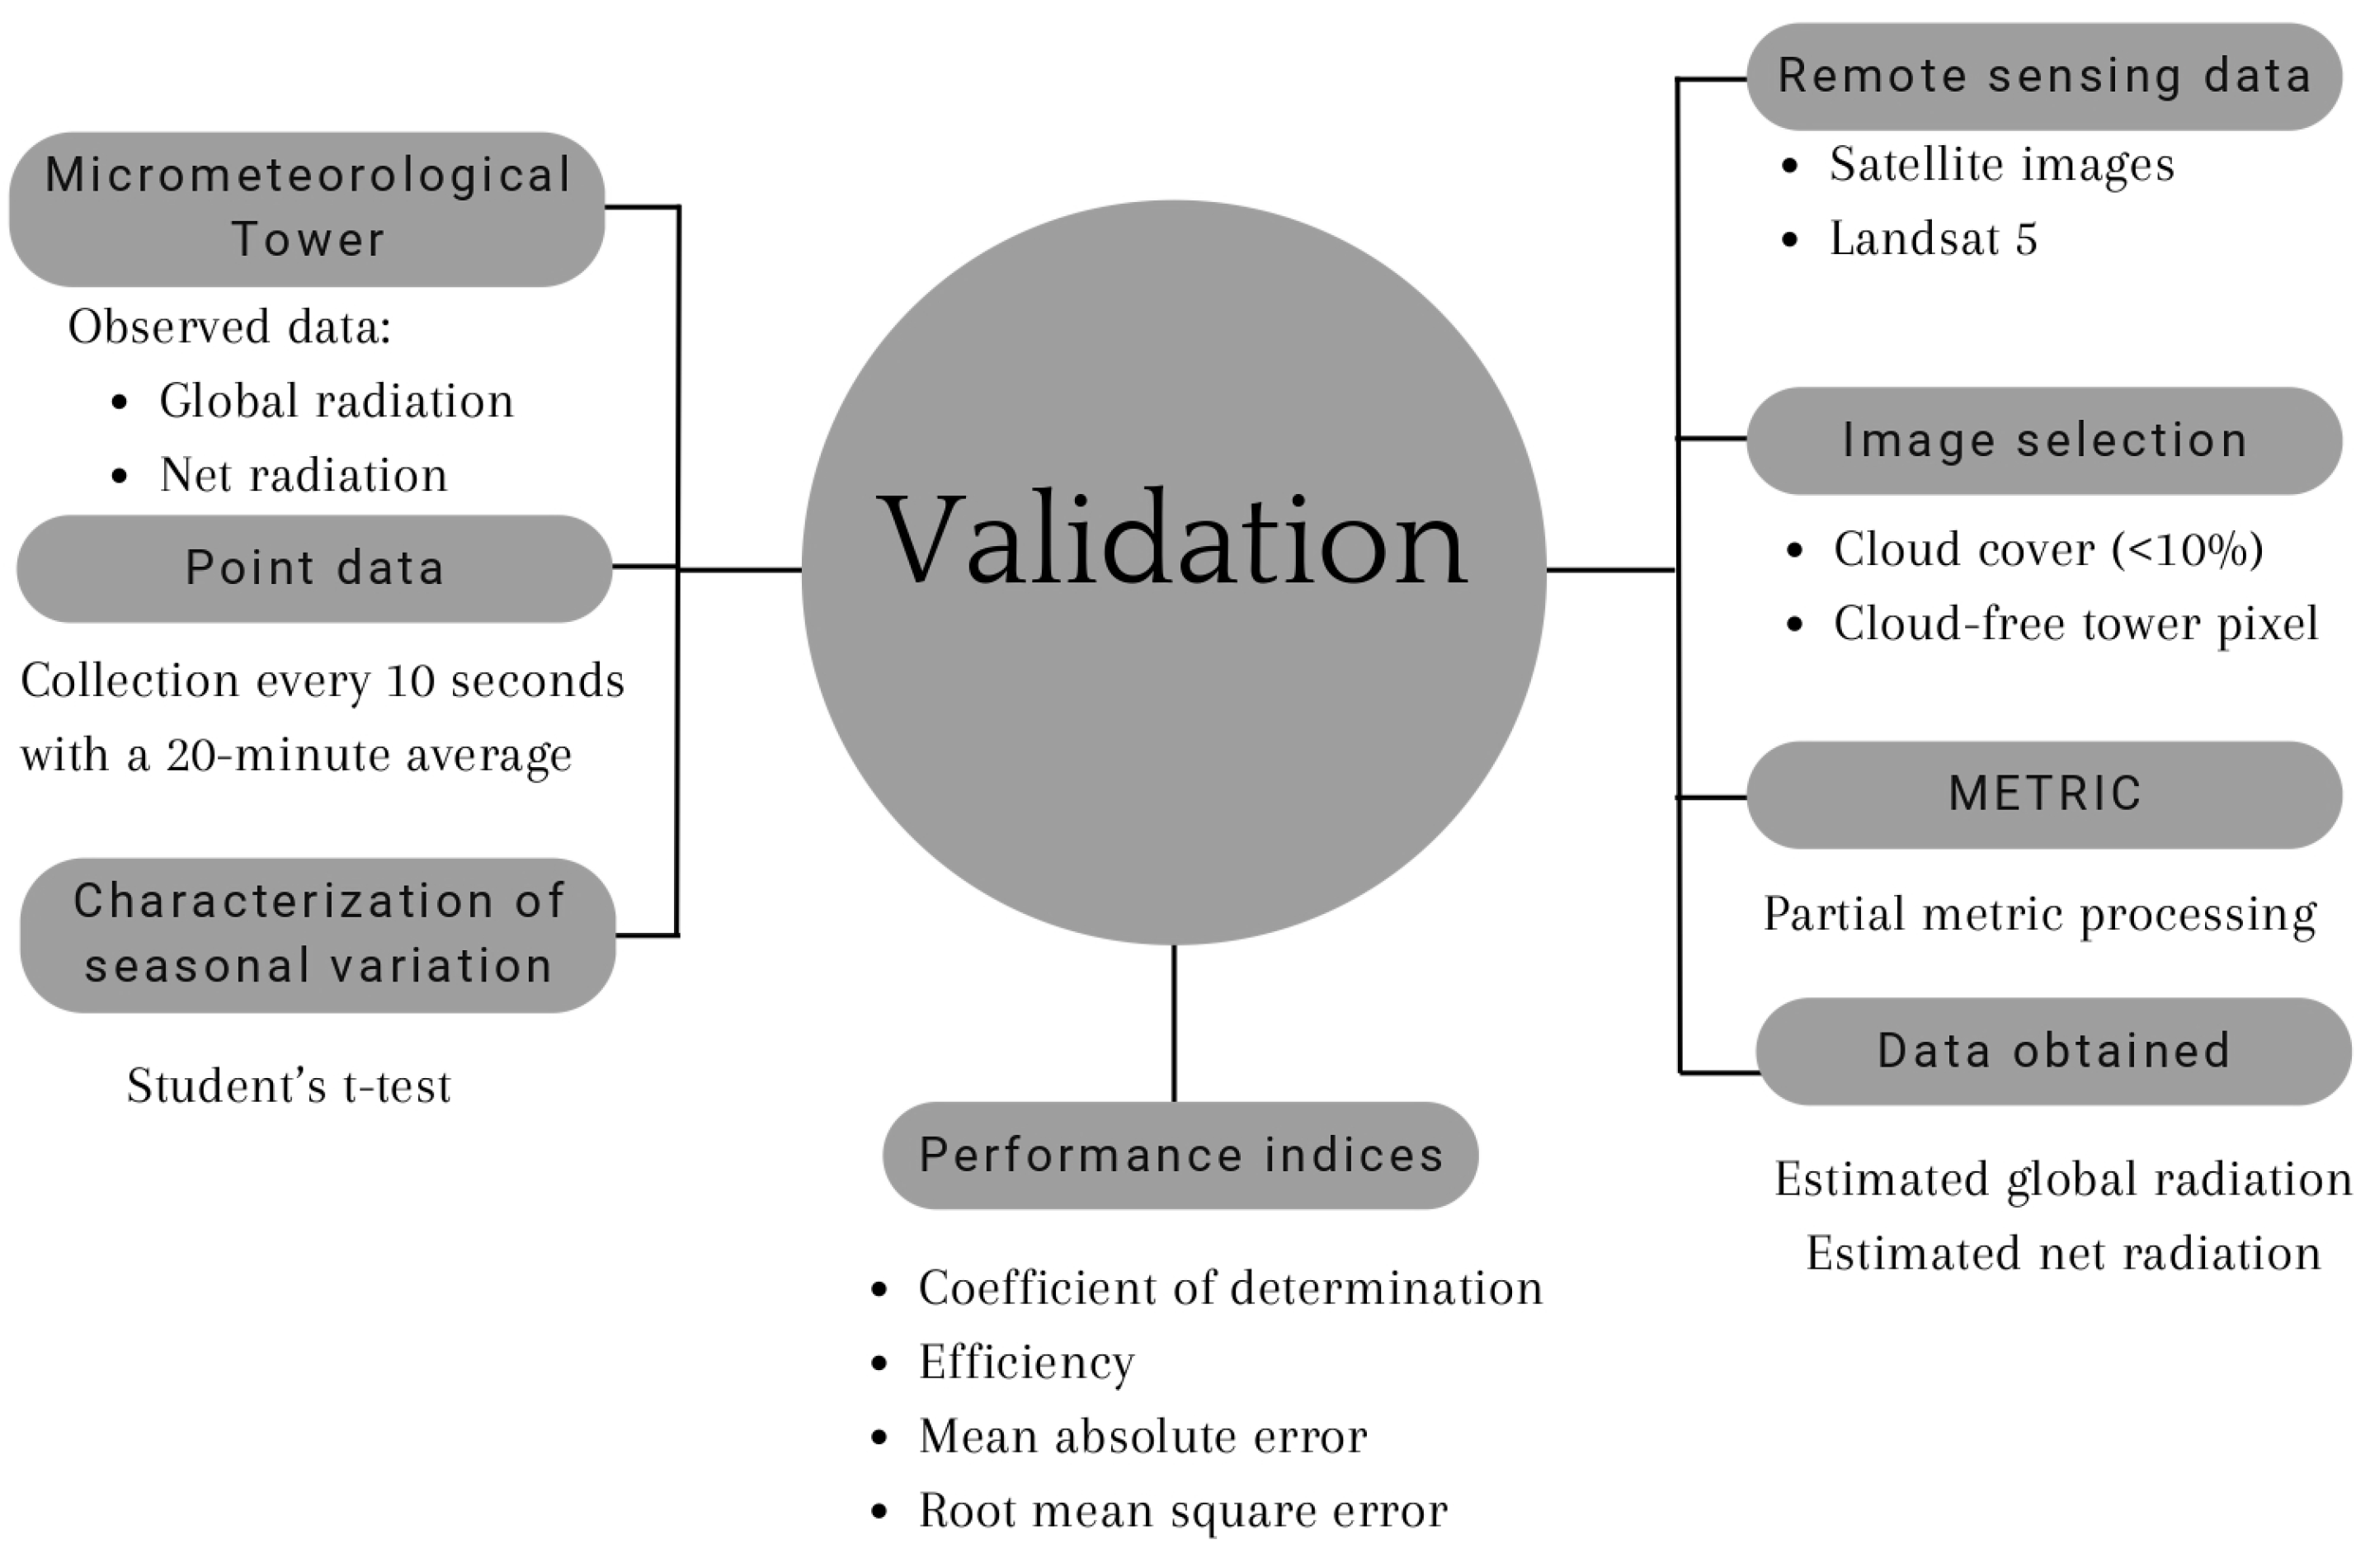
The Student’s t-test was applied using the R 4.2.2 software [32] to assess significant differences between the means of the ratio of net radiation to global radiation (Rn/Rg), identifying variations across areas, seasons, and spatially within and between rows. The same test was used for the albedo and leaf temperature variables, considering the two evaluated areas and the types of vegetation cover. The validation of the satellite image was carried out using the point data extracted from the pixels corresponding to the micrometeorological towers and the observed data from the pyranometer sensors for global radiation and the net radiometer for net radiation. The performance of the estimation model was quantified using the following performance indices: coefficient of determination (R2), efficiency (Ef) [33], mean absolute error (MAE%), and root mean square error (RMSE%) [34]. A schematic containing a methodological summary can be seen in Figure 3.
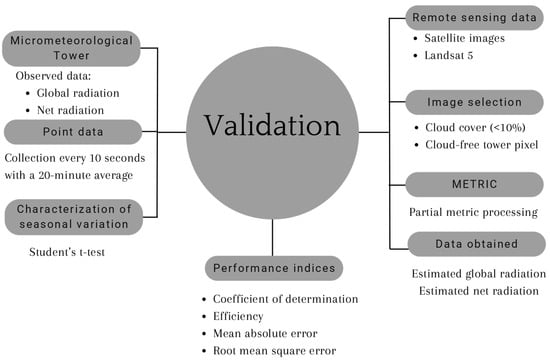
Figure 3.
Methodological summary.
3. Results and Discussion
3.1. Seasonal Characterization
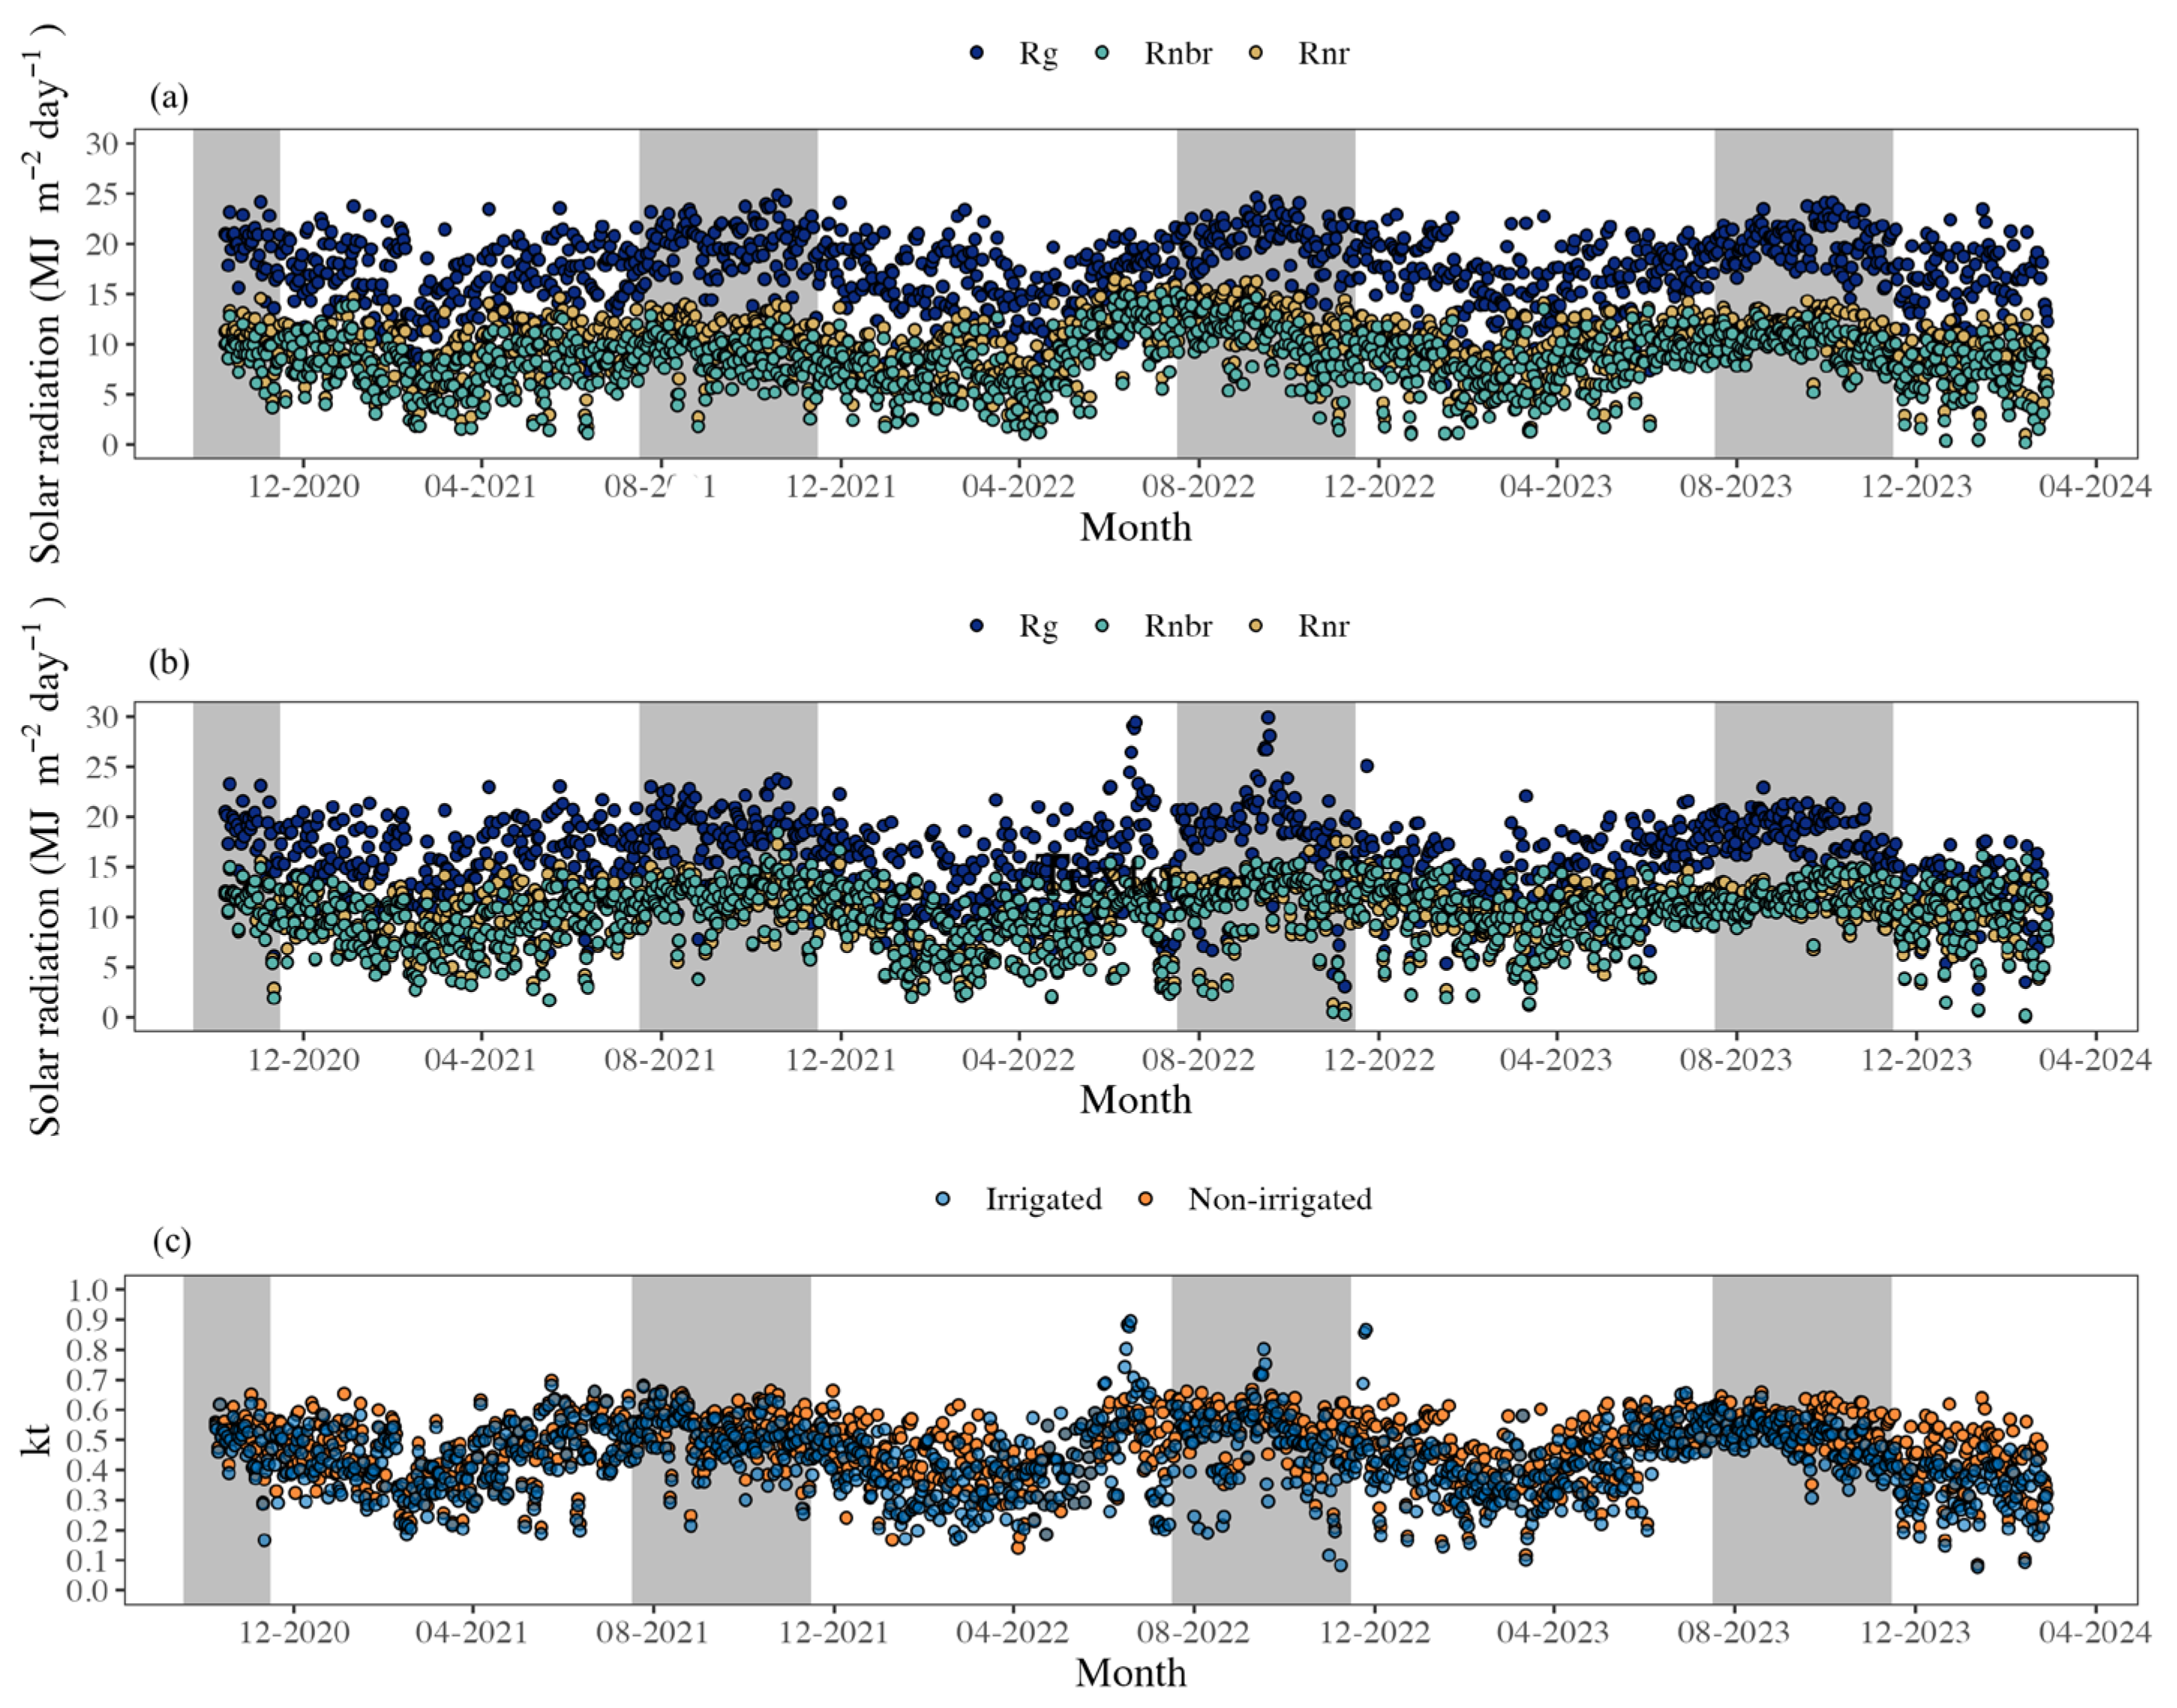
Global radiation averaged 16.04 ± 3.55 MJ m−2 day−1 during the rainy season and 19.43 ± 2.97 MJ m−2 day⁻1 during the dry season for the non-irrigated area. Under irrigation, the average values were 14.64 ± 3.85 MJ m−2 day−1 during the rainy season and 17.76 ± 3.99 MJ m−2 day−1 during the dry season (Figure 4).
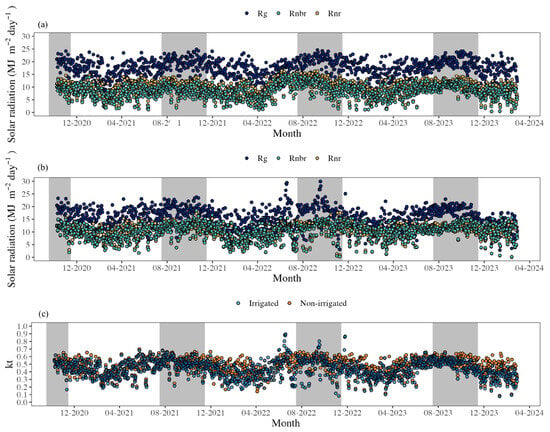
Figure 4.
Temporal variation in global radiation (Rg, MJ m−2 day−1), net radiation in the row (Rnr, MJ m−2 day−1) and in the inter-row (Rnbr, MJ m−2 day−1) in a non-irrigated (a) and irrigated (b) green dwarf coconut palm cultivation area, and atmospheric transmittance (kt) (c) in Northeastern Pará, Brazil. The shaded area corresponds to the dry season of the region.
The highest amount of incident global radiation occurred during the dry period in all years (Figure 4a). This seasonal pattern is due to the reduced cloud cover during this period, which increases atmospheric transmittance, allowing a greater amount of incident solar radiation to reach the surface [1,35]. As shown in Figure 4c, atmospheric transmittance values were higher during the dry period (0.50 ± 0.09) compared to the rainy period (0.43 ± 0.11). Also, in the region of Northeastern Pará, in the cultivation of lime, monitoring of global solar radiation indicated that during the dry period, Rg totals can reach from 60 to 70% of extraterrestrial radiation, compared to the 50 to 60% fraction during the rainy period [1]. The authors emphasize that cloud cover is the main modulator of incident radiation at the surface.
Corroborating the results found in the present study, in the coastal region of Northeastern Pará, Eastern Amazon, the dry period is also characterized by higher Rg totals, with a difference between the hourly average at the peak maximum of Rg (2:00 p.m.) between the two periods of 148.4 W m−2 [36]. According to the authors, this radiation dynamic is a result of the displacement of the Intertropical Convergence Zone (ITCZ) during the dry season, which significantly reduces cloud cover and allows the effective entry of Rg, favoring higher energy availability for physical processes in the lower troposphere. In the same region, lower kt values were observed in the months of February, March, and April, which are characterized by higher rainfall, ensuring greater reflection of radiation during this period [37].
The same variation patterns were observed in the city of Sinop–MT (−11.86° S; −55.48° W), in the Legal Amazon region, where the highest global radiation totals are obtained during the period of lower rainfall occurrence [35]. According to these authors, greater cloud cover causes an increase in diffuse radiation and a reduction in direct radiation, which consequently reduces the total Rg due to greater interception of direct radiation by the clouds.
Seasonal trends were also observed in the net radiation, as it is closely linked to global radiation (Figure 4). In the non-irrigated area, the planting row averaged 8.94 ± 3.00 MJ m−2 day−1 during the rainy period and 10.97 ± 2.48 MJ m−2 day−1 during the dry period, while the inter-row averaged 7.70 ± 2.98 MJ m⁻2 day⁻1 during the rainy season and 9.02 ± 2.34 MJ m−2 day−1 during the dry season. Under irrigation, the row averaged 9.37 ± 2.80 MJ m−2 day−1 during the rainy season and 11.55 ± 2.65 MJ m−2 day−1 during the dry season, while the inter-row recorded 9.13 ± 2.94 MJ m−2 day−1 and 11.71 ± 2.71 MJ m−2 day−1 during the rainy and dry periods, respectively.
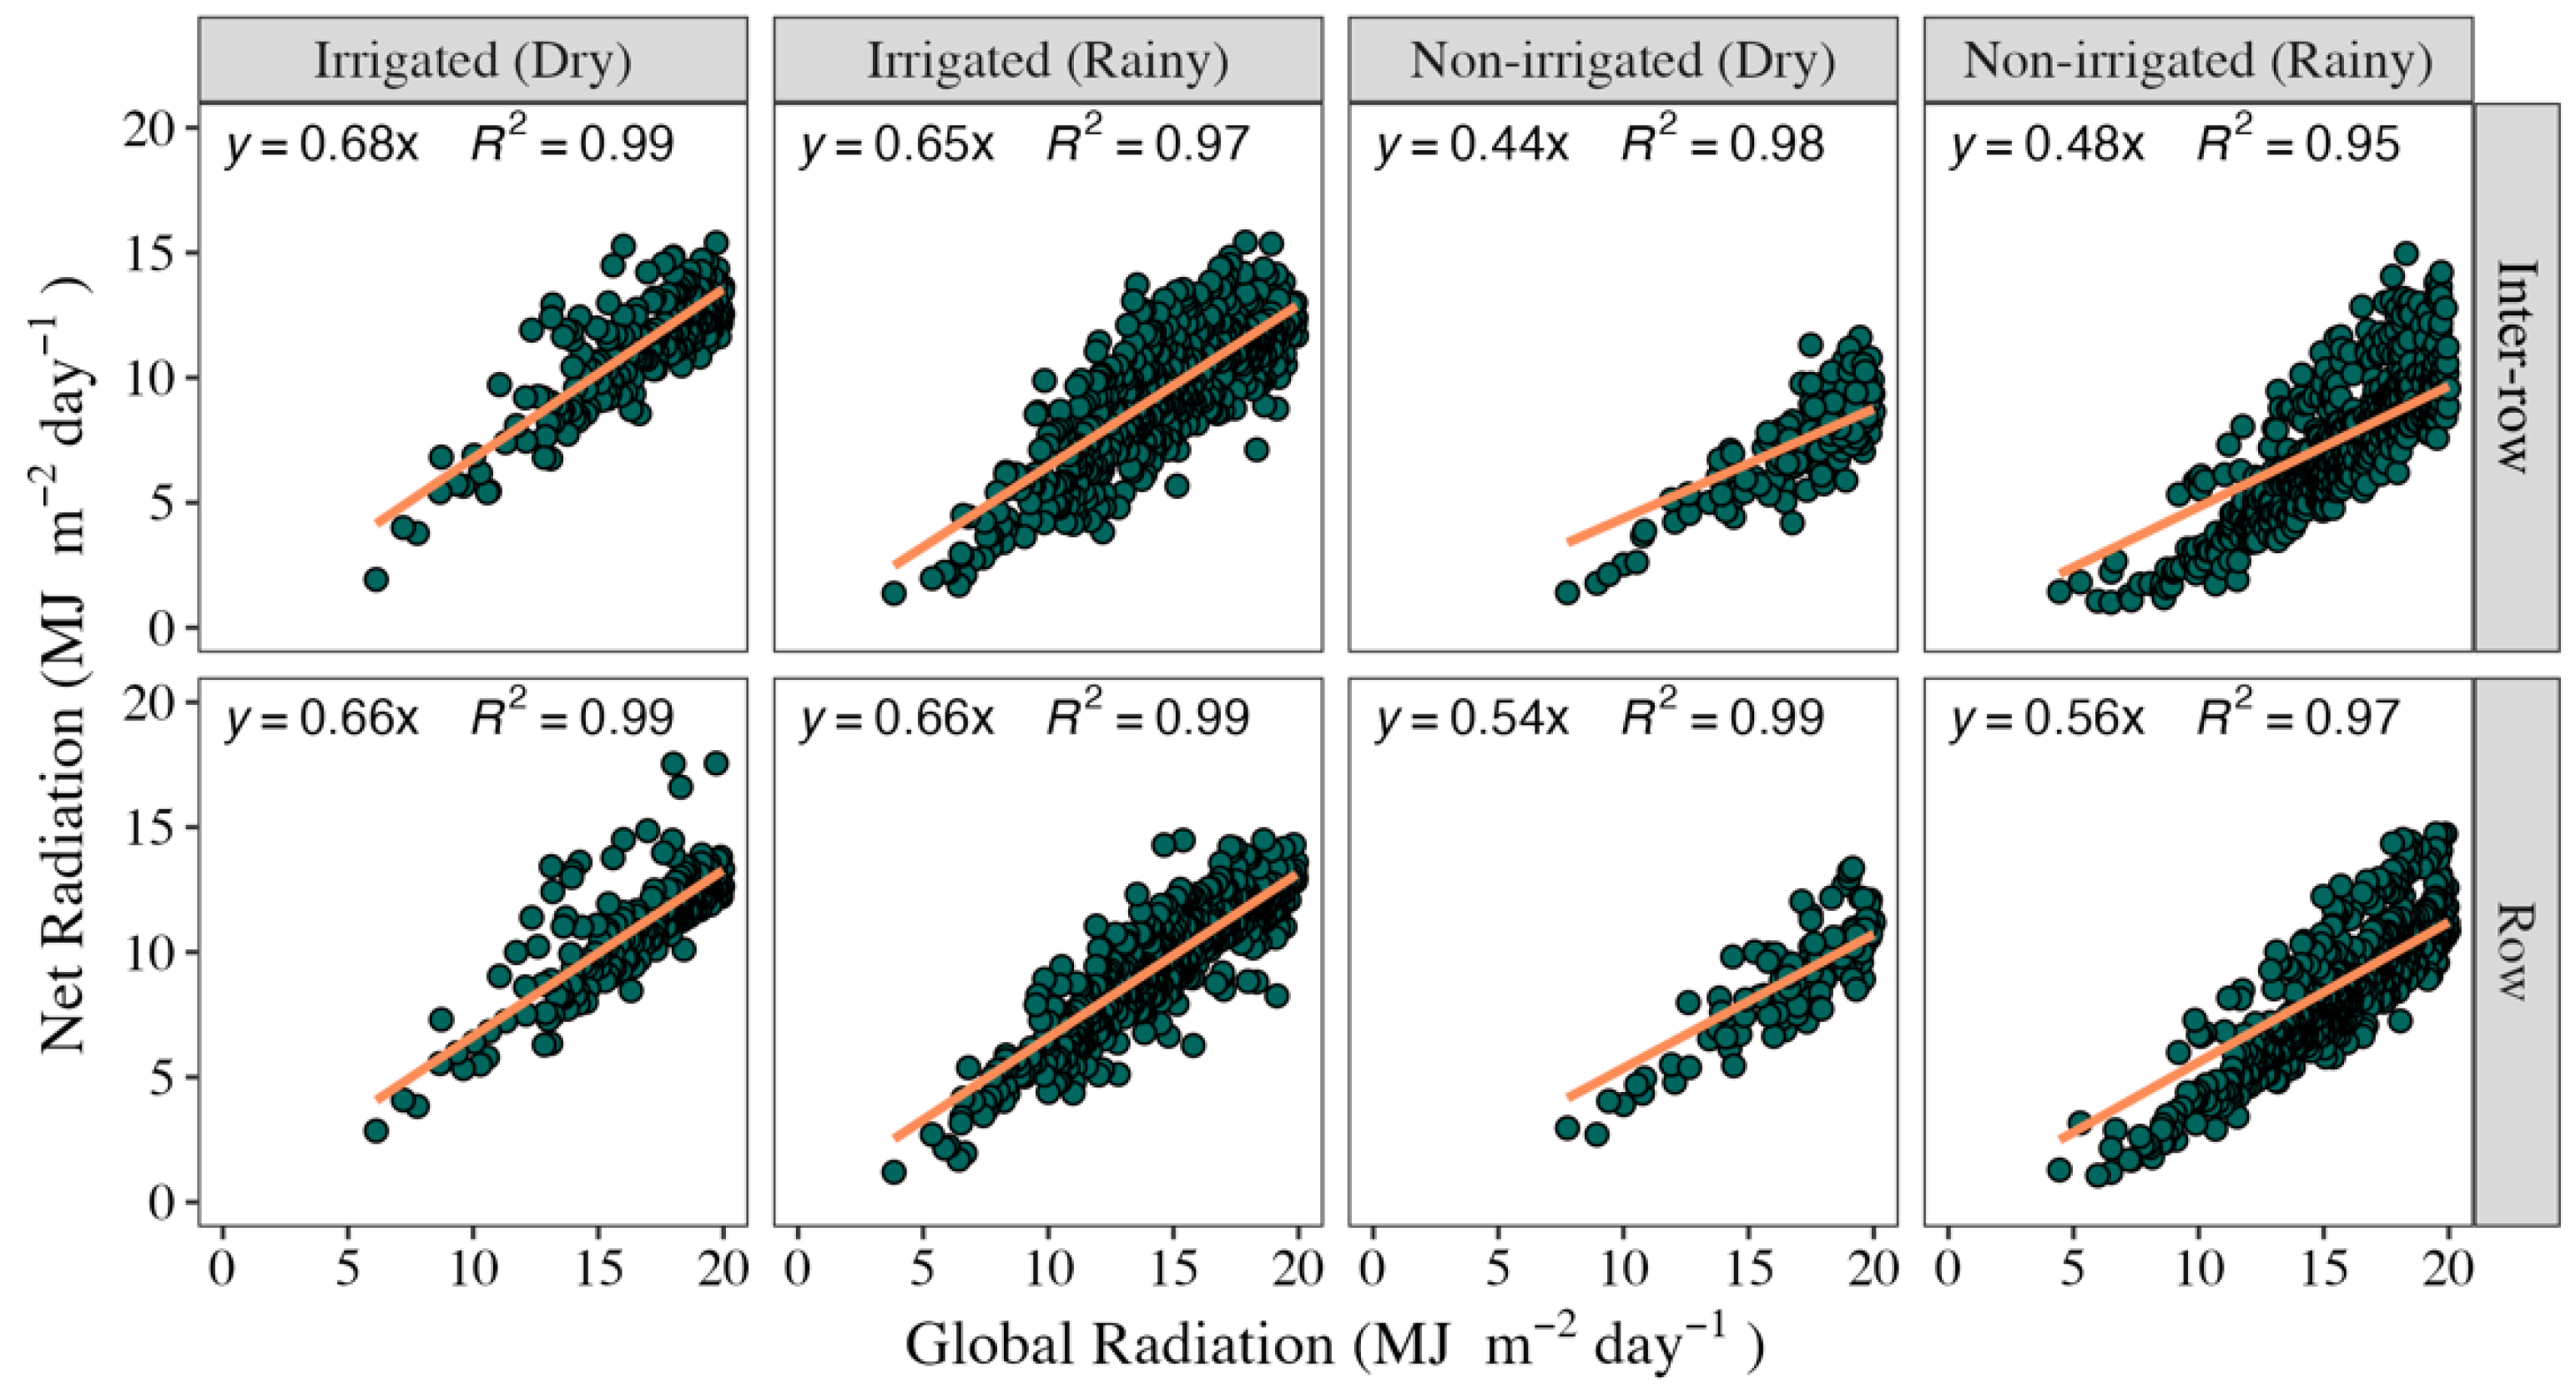
The relationship between global radiation and the net radiation in the cultivated area can be observed in Figure 5, where, regardless of the time of year, the higher amount of incident radiation ensures greater energy availability at the surface.
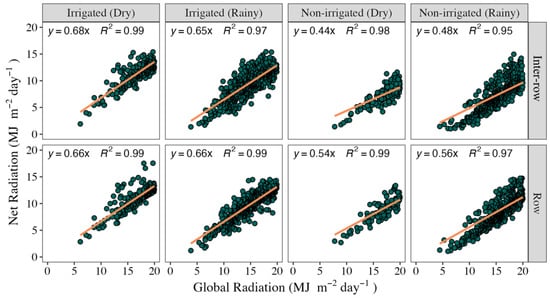
Figure 5.
Simple linear regression between incident global radiation and the radiation balance in the row and inter-row during the rainy and dry periods in irrigated and non-irrigated green dwarf coconut plantations in Northeastern Pará, Brazil. The solid orange line represents the regression line and green circles represent observation points.
Considering the direct relationship between Rg and Rn (Figure 5), the higher Rg totals associated with the dry period promote greater energy availability at the surface. As observed earlier, Rn is, on average, 23% higher during this time of the year compared to the rainy period. Similar results were also observed in another region of the Amazon, with seasonal differences of 103.9 W m−2 at 1:00 p.m. [36], attributing the dry period to the characteristic of higher energy availability, highlighting that the relationship between Rg and cloud cover shapes the Rn totals at the surface [1,35,36,37].
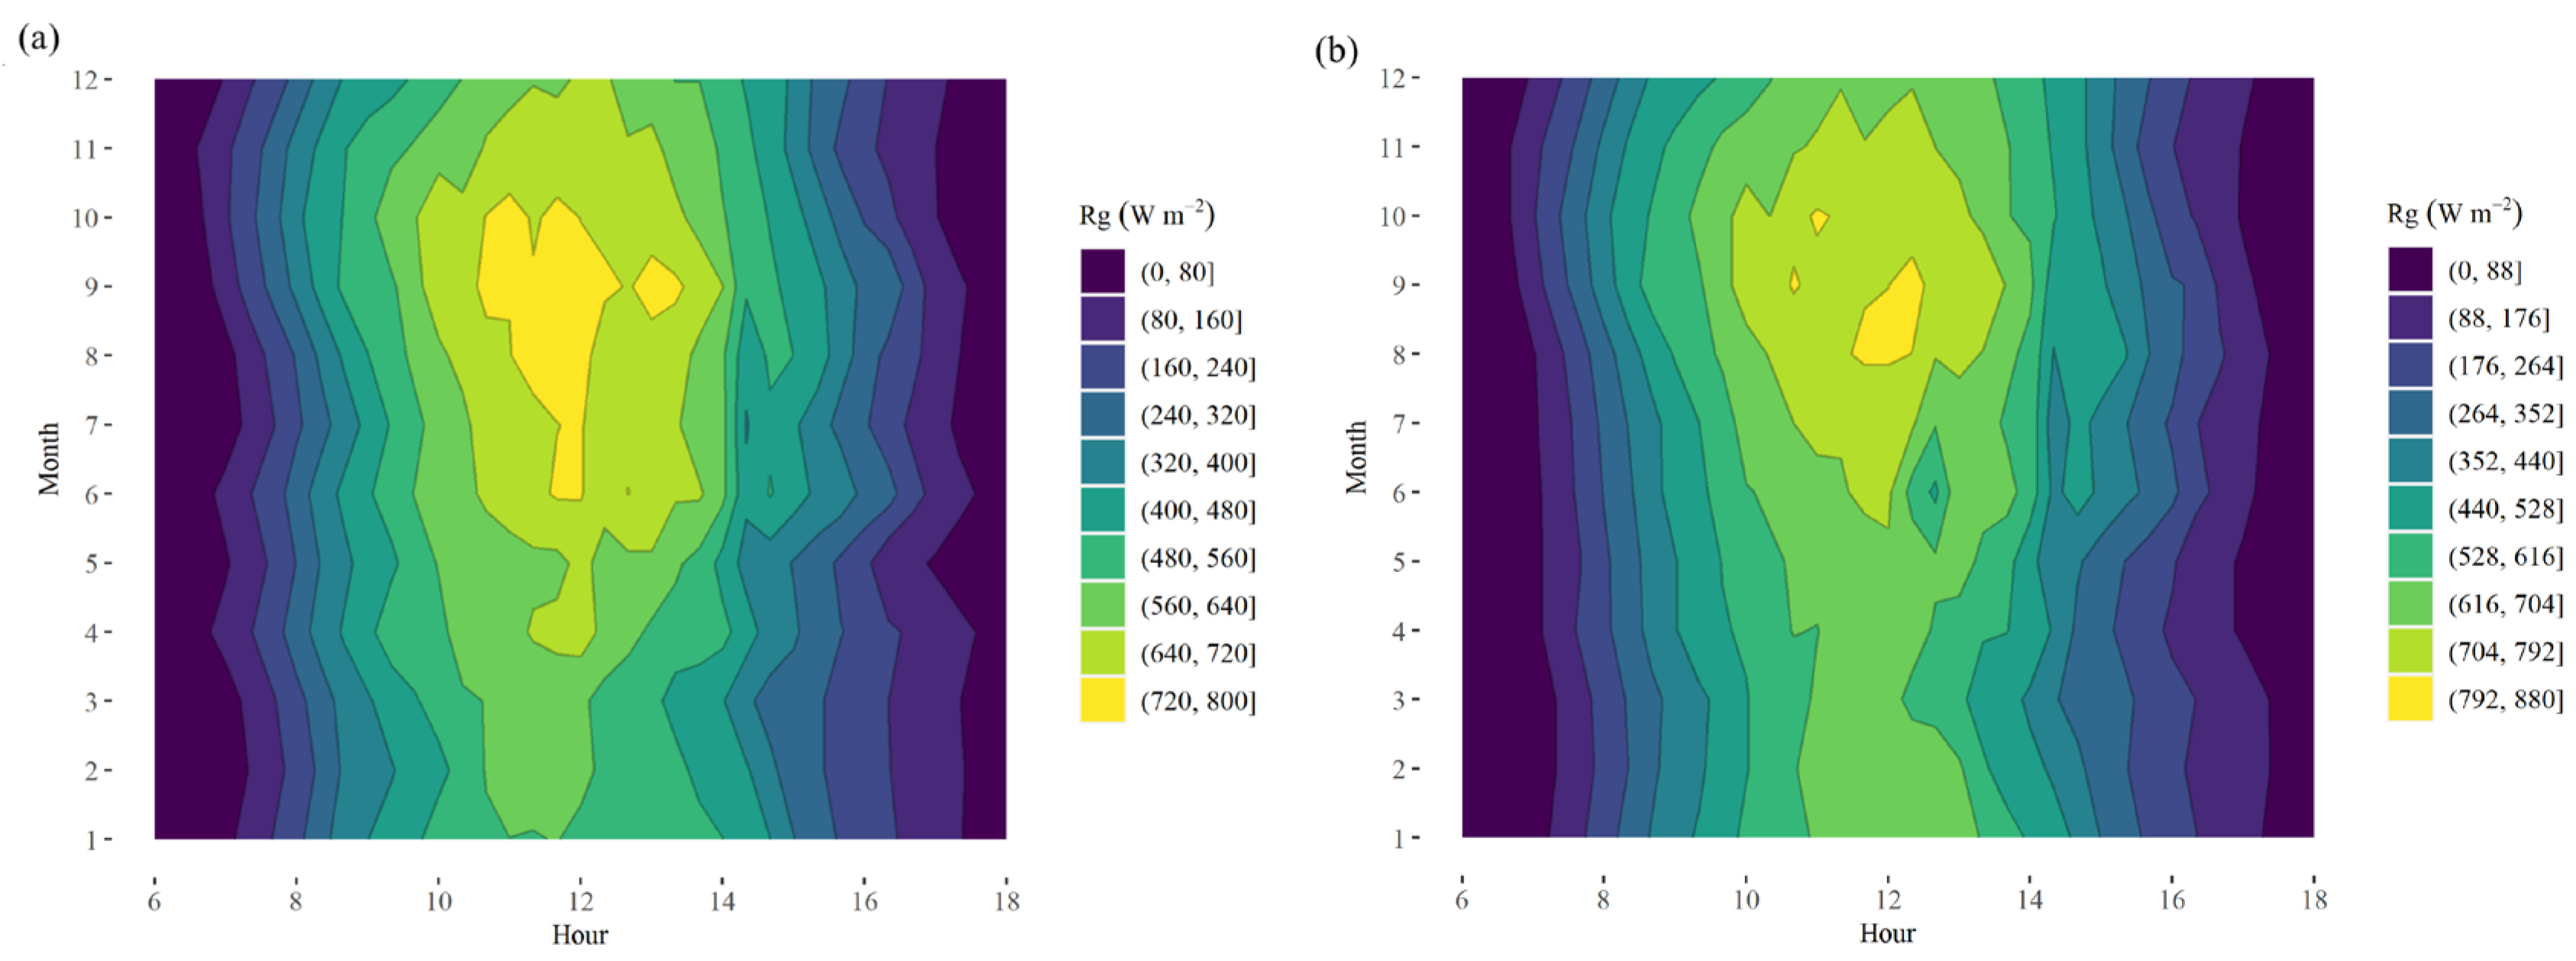
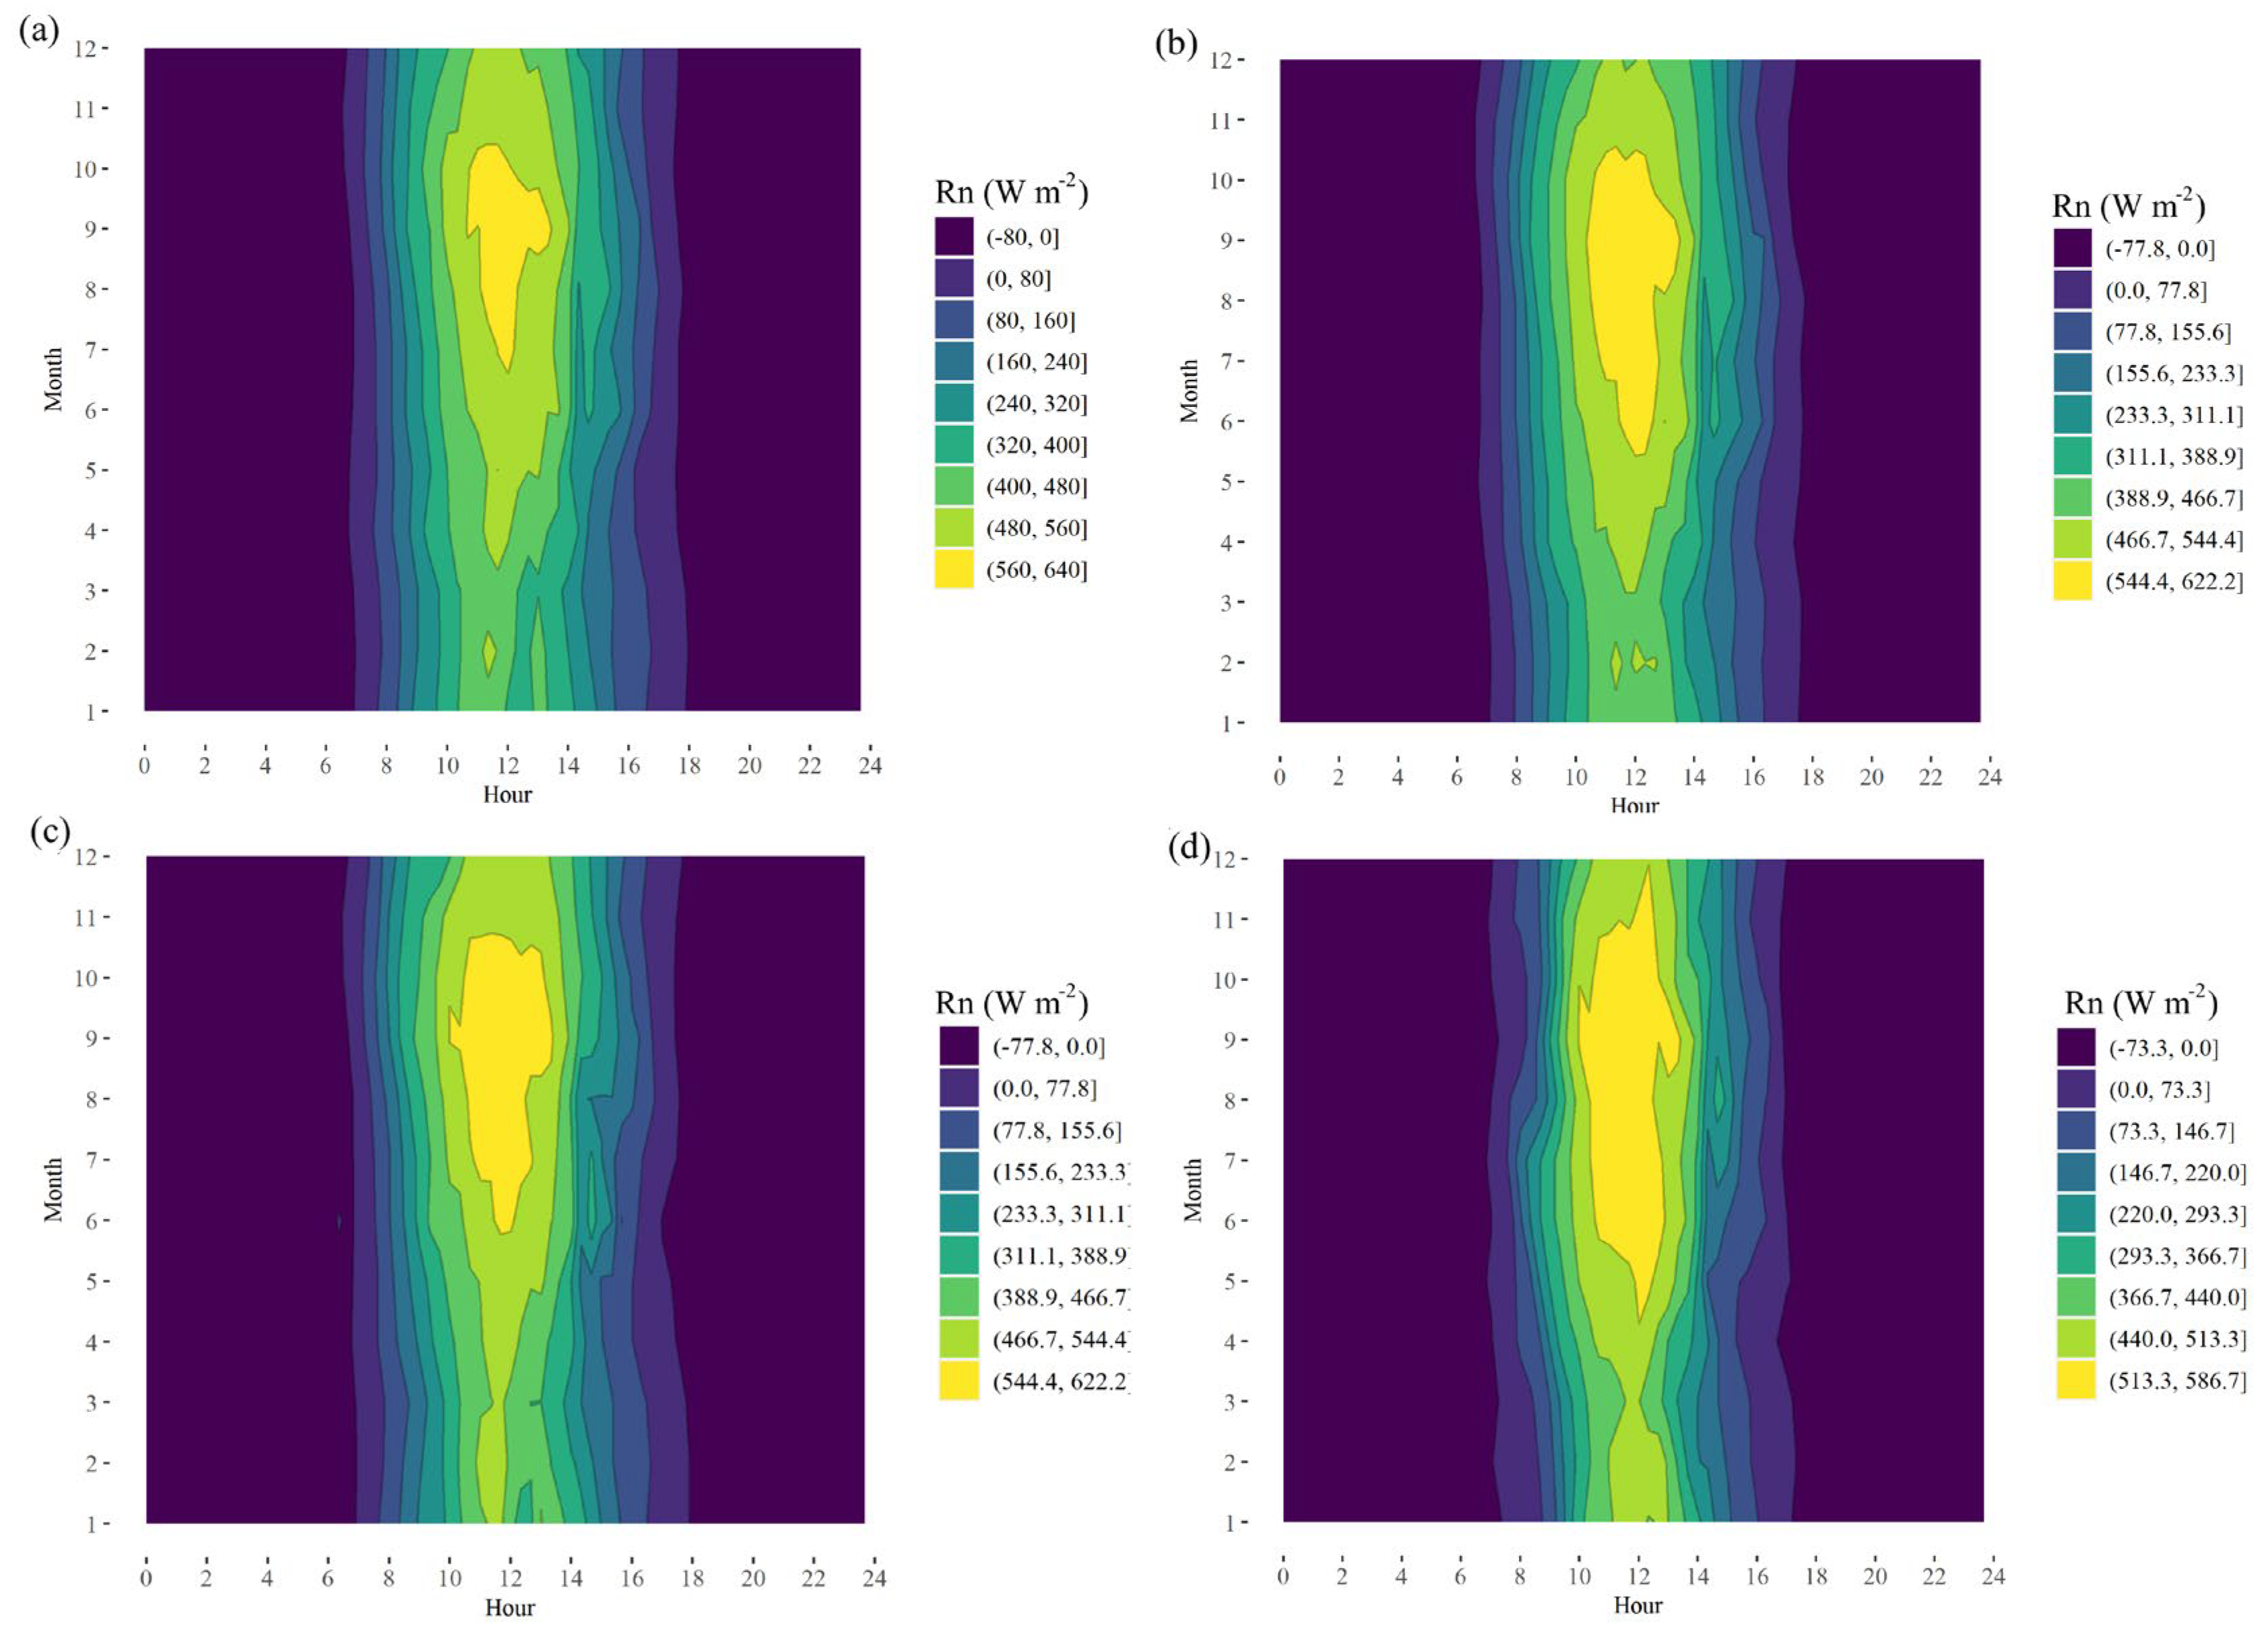
When analyzing the hourly pattern of incident and net radiation throughout the day (Figure 6 and Figure 7), considering both monthly and seasonal characteristics, it was observed that the highest Rg values occur between July and October. This period corresponds to the driest months of the year, with variations ranging from 720 to 800 W m−2 in the irrigated area and from 704 to 792 W m−2 in the non-irrigated area. In August and September, values reached between 792 and 880 W m−2 (Figure 6).
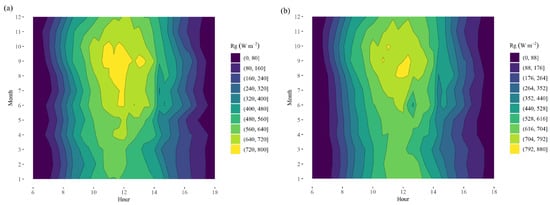
Figure 6.
Hourly seasonal distribution of incident global radiation (Rg, W m−2) in irrigated (a) and non-irrigated (b) green dwarf coconut plantations under the climatic conditions of Northeastern Pará, Brazil.
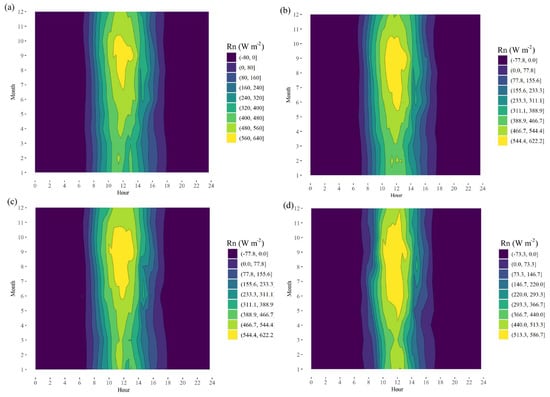
Figure 7.
Hourly seasonal distribution of the radiation balance (Rn, W m−2) in the cultivation of green dwarf coconut trees irrigated in row (a) and inter-row (c) and not irrigated in row (b) and inter-row (d), under the climatic conditions of Northeastern Pará, Brazil.
During the day, solar radiation is most intense between 10:00 a.m. and 2:00 p.m., with lower intensity observed during the rainy season in both areas. Additionally, a more pronounced and gradual decrease occurs in the afternoon, with this decline happening earlier during the rainy season, particularly between February and March. This pattern is attributed to the higher frequency of rainfall in the region during the afternoon, predominantly between 3:00 p.m. and 5:00 p.m. [38]. Similar patterns of higher daytime global radiation incidence between 10:00 a.m. and 2:00 p.m. have been reported in the Amazon region, with totals ranging from approximately 2.25 MJ m−2 h−1 to 2.75 MJ m−2 h−1 [35]. Higher totals during these hours were also observed on the Pará coast, with a variation of approximately 550 to 650 W m−2 [36].
Following the same distribution patterns as global radiation, as described above, net radiation exhibits higher intensities during the dry period. However, the rainfed area experiences a longer period of elevated intensity (May to November) compared to the irrigated area (June to October) (Figure 7). Higher net radiation values are observed in the crop row, ranging from 560 to 640 W m−2, compared to 544.4 to 622.2 W m−2 in the inter-row within the irrigated area. In the non-irrigated area, net radiation varies from 544.4 to 622.2 W m−2 in the row and from 513.3 to 586.7 W m−2 in the inter-row.
The times of day with the greatest energy availability coincide with the peak global radiation incidence. Thus, the period from 10:00 a.m. to 2:00 p.m. has the highest energy supply (Figure 7). Similar results have been reported in areas of the Amazon rainforest in the Tapajós National Forest region, where higher values of net radiation (400 to 500 W m−2) were observed between 2:00 p.m. and 4:00 p.m., coinciding with the maximum incidence of global radiation [38]. In Capitão Poço–PA (−1.74°; −47.06°), the highest Rn totals ranged from 450 to 650 W m−2 during the 10:00 a.m. to 2:00 p.m. period [1].
Regarding the variation between irrigated and non-irrigated areas, the Rn/Rg ratio was significantly higher (p < 0.05) in irrigated areas, regardless of the time of year (Table 2). However, within each location, the seasonal differences were not significant, indicating that the conversion of Rg into Rn is not influenced by seasonality. This suggests that what truly modulates the total Rn in this environment and under these climatic conditions are the surface characteristics, rather than the amount of incident Rg, as the Rn/Rg ratio statistically remained the same throughout the year. These results indicate that, while irrigation plays an important role in modulating the energy flux at the surface, seasonality does not impact the conversion of global radiation into net radiation.

Table 2.
Student’s test (p < 0.05) for a fraction of the net radiation and global radiation (Rn/Rg) in irrigated and non-irrigated green coconut cultivation areas in the climatic conditions of Northeastern Pará, Brazil.
In the Caatinga biome, which is characterized as a seasonally dry tropical forest, the seasonality of the Rn/Rg ratio is more pronounced, with the highest values observed during the rainy period. This occurs due to the reduction in albedo, caused by the higher Leaf Area Index (LAI) of the vegetation. During the dry period, the increase in albedo, associated with higher soil temperatures and lower water availability, results in a lower Rn/Rg ratio [39]. The stability of this variable, observed in this study, can be attributed to the evergreen nature of the coconut tree, which provides nearly constant vegetation cover throughout the year.
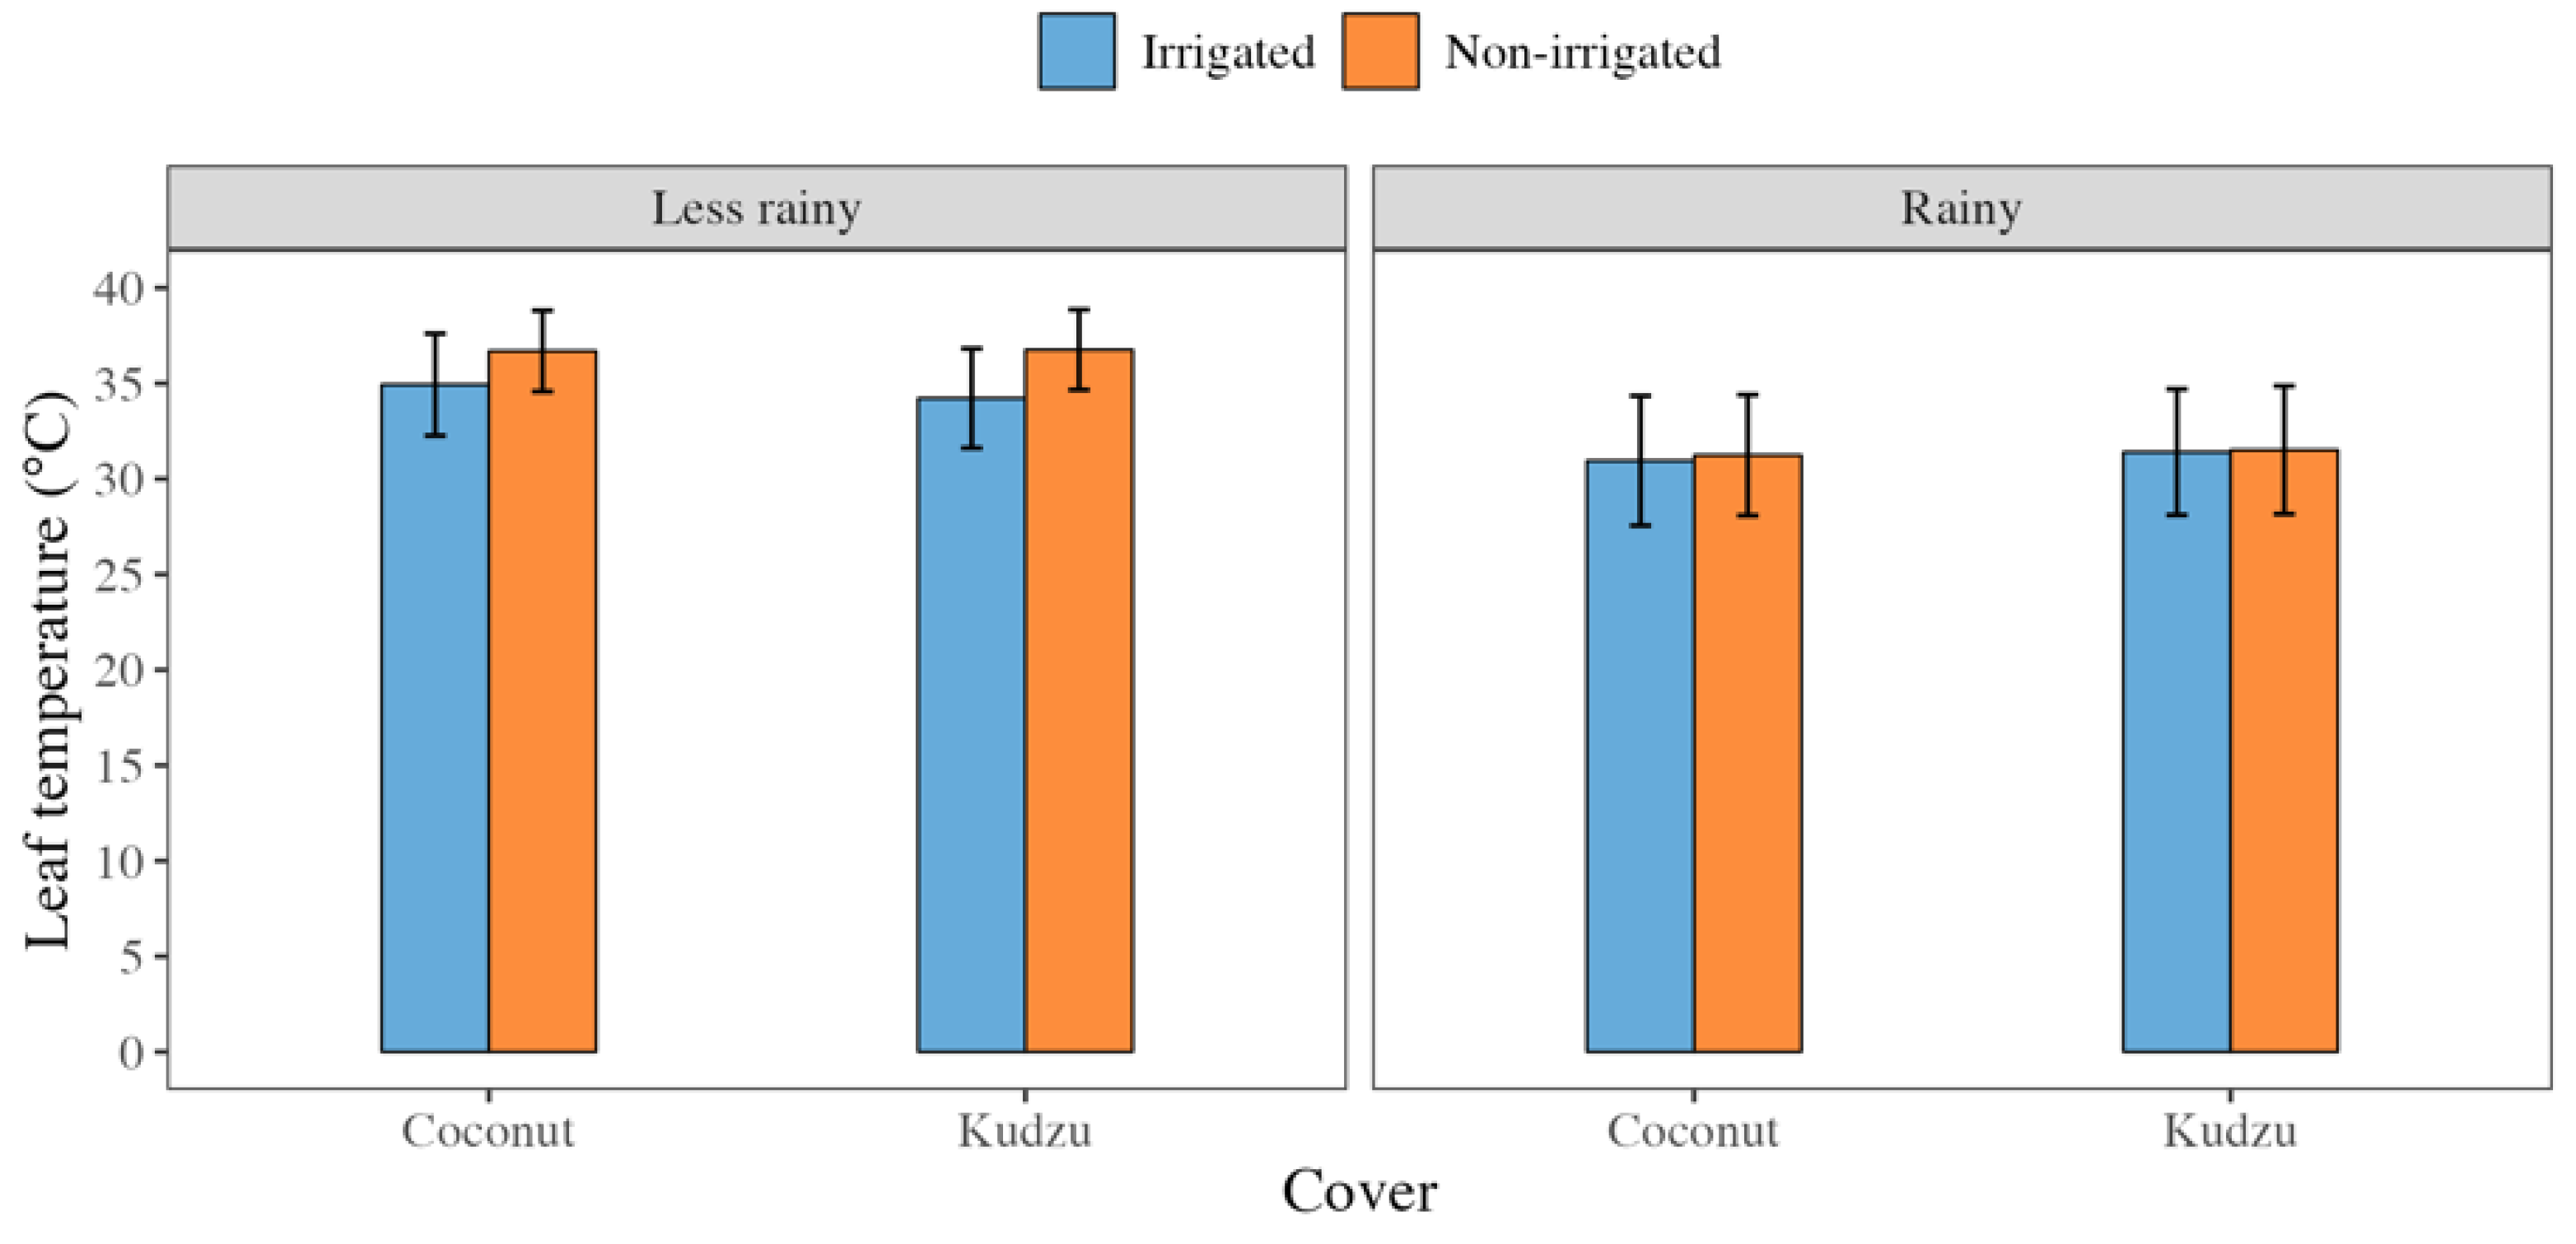
As shown in Table 2, the irrigated area exhibits a higher Rn/Rg fraction, with net radiation accounting for 64% to 67% of the incident radiation. This indicates a greater capacity to utilize solar radiation, as more Rg is converted into Rn. From this perspective, leaf temperature varies between areas and ground cover types, with the irrigated area showing significantly lower temperatures than the rainfed area, particularly during the dry season, as confirmed by Student’s t-test (p < 0.05) (Figure 8). Therefore, the higher net radiation values observed in the irrigated area can be attributed to lower surface temperatures and reduced long-wave radiation emissions due to irrigation, which enhances net radiation [40,41].
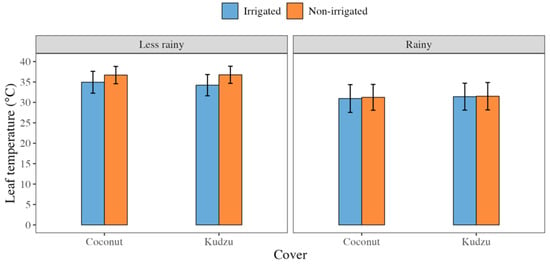
Figure 8.
Leaf temperature in green dwarf coconut and tropical kudzu during the rainy and dry seasons under the climatic conditions of the Eastern Amazon, Brazil.
Regarding the spatial characterization of the row and inter-row, no statistically significant differences were found in the irrigated crop (p > 0.05), indicating no spatial distinction in the Rn/Rg fraction. However, these differences were observed in the non-irrigated crop (Table 2), where net radiation was consistently lower in the inter-row than in the planting row, regardless of the season.
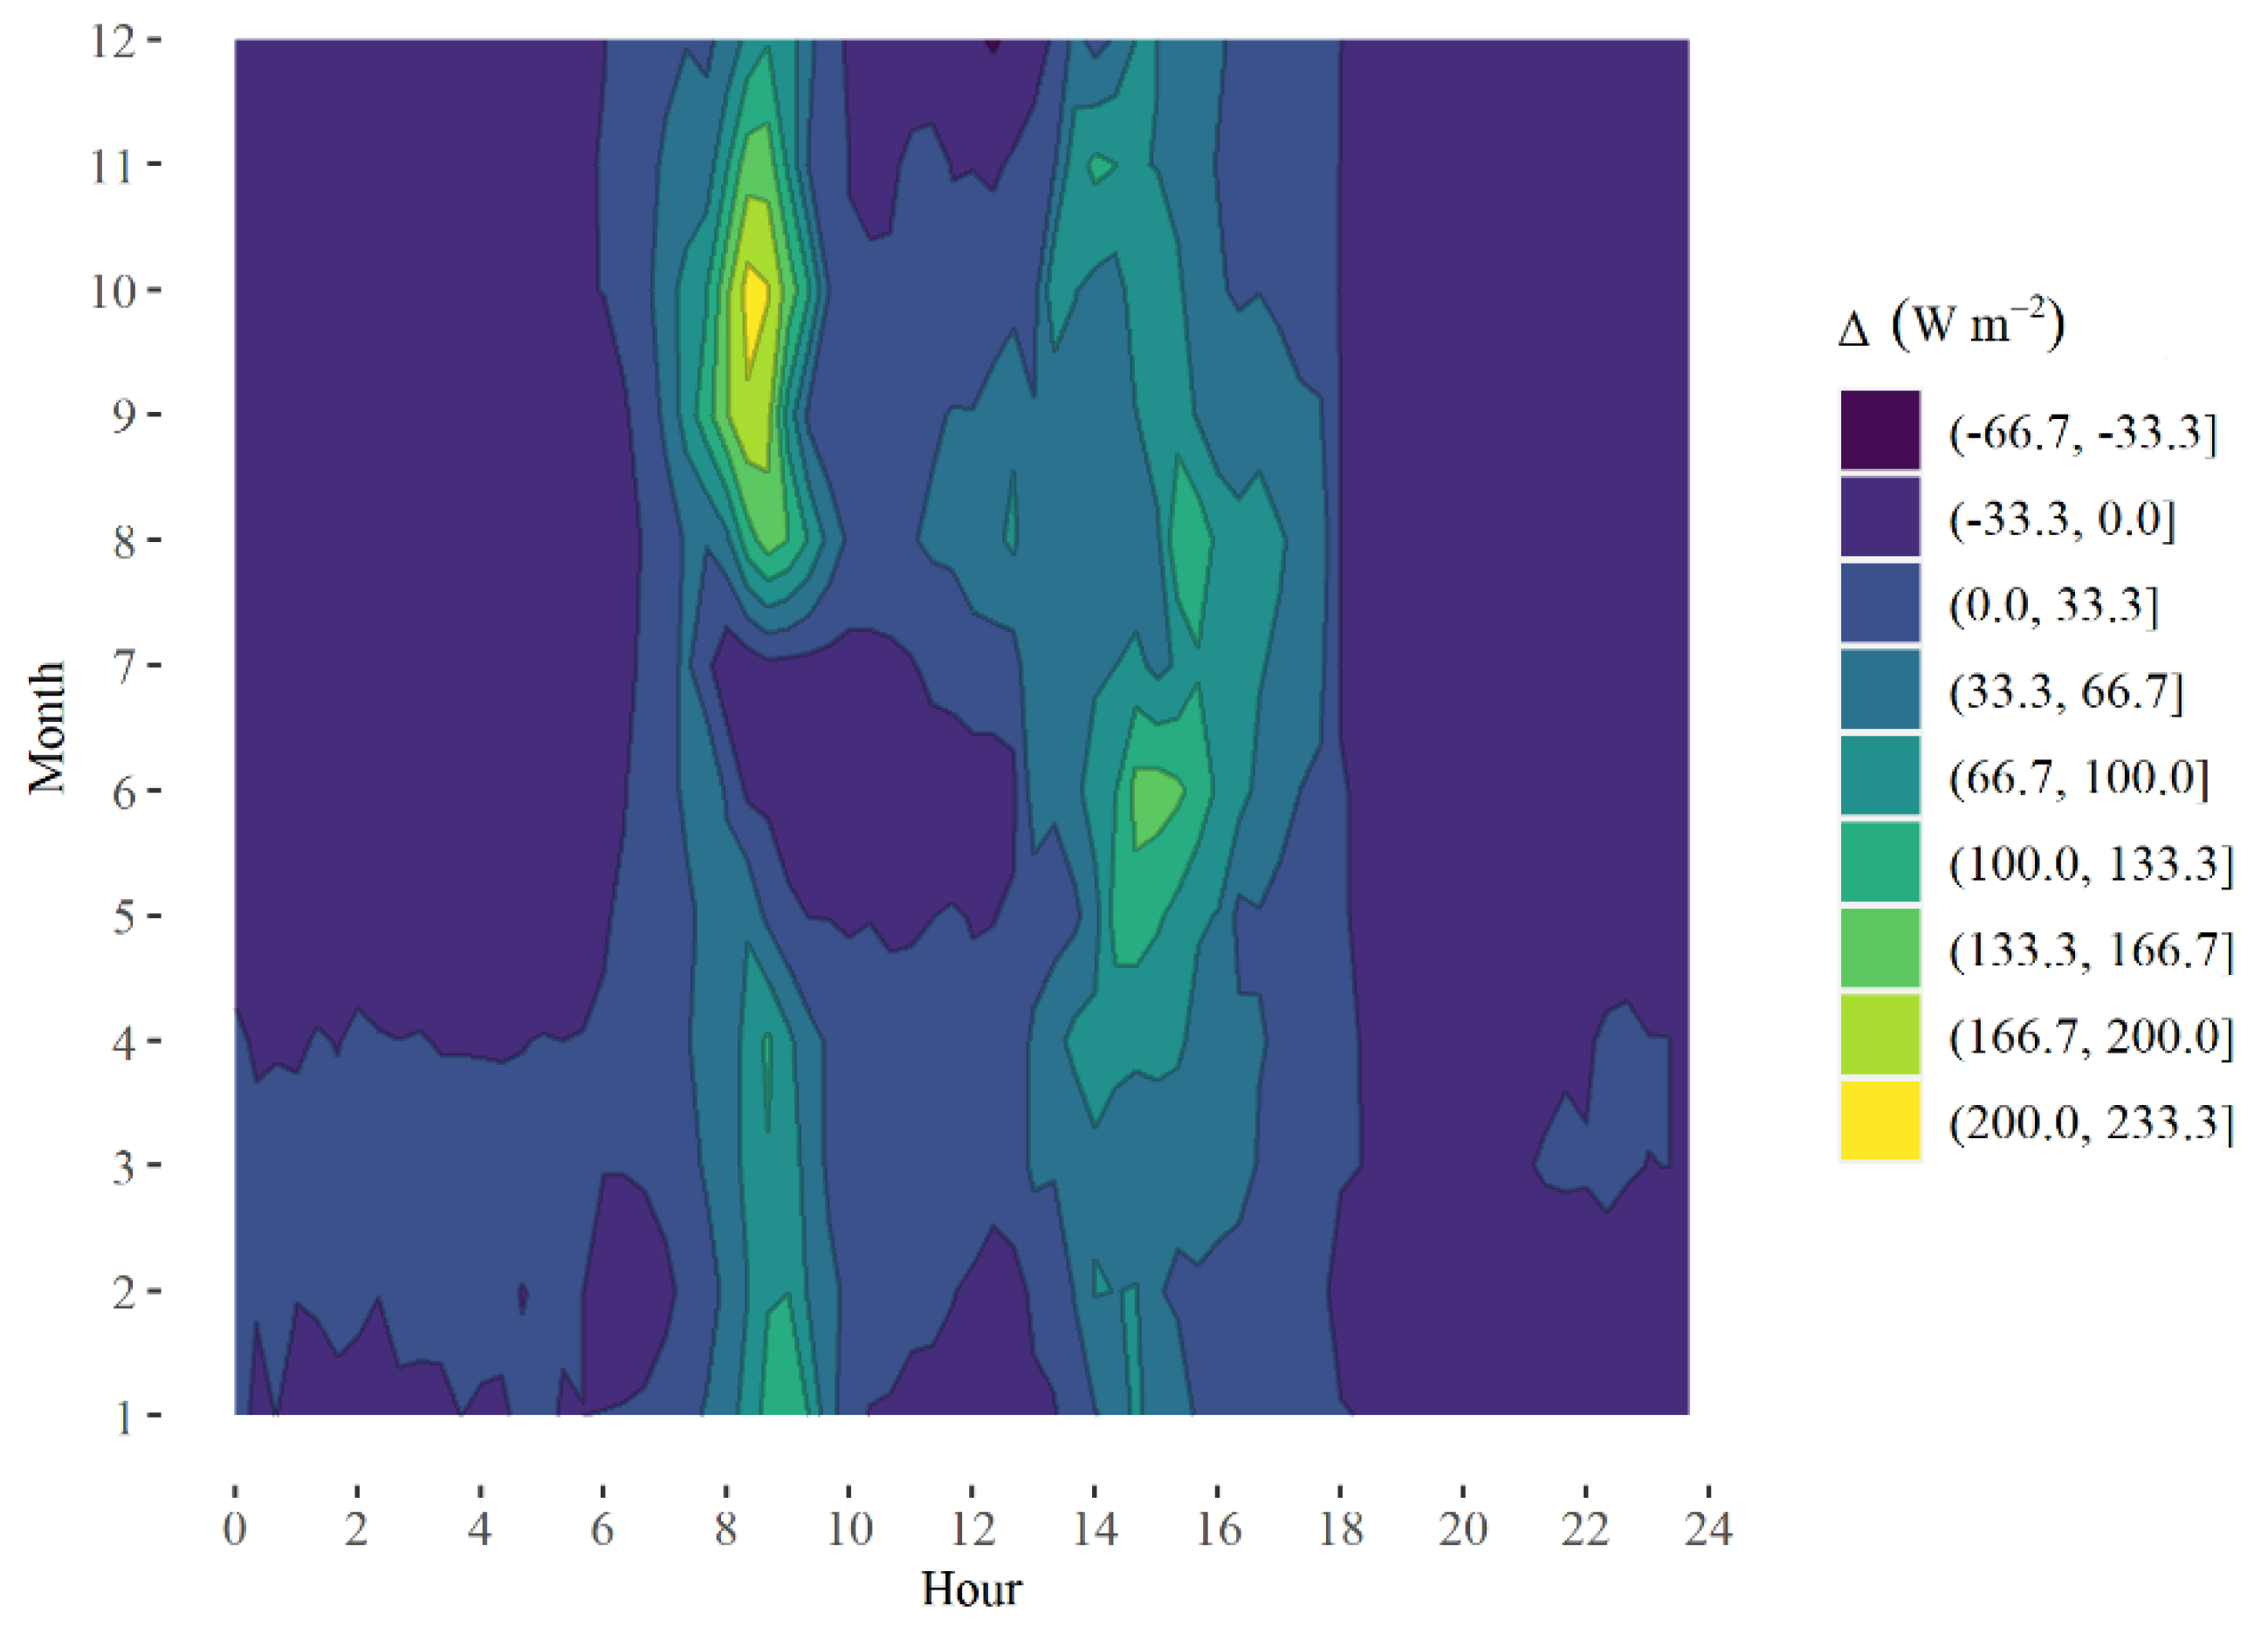
Seasonally, the most significant differences in net radiation between the two areas occurred between 07:00–10:00 and 14:00–16:00, with variations ranging from 100 to 233.3 W m−2. The greatest intensity was observed between August and November, particularly from 07:00 to 10:00 (Figure 9). This pattern suggests that the angle of solar radiation during these hours has a greater capacity to create spatial differences in net radiation between the row and inter-row.
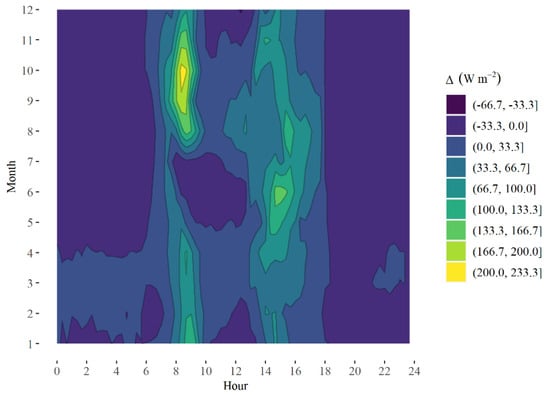
Figure 9.
Hourly seasonal characterization of the difference between the net radiation of the row and the inter-row of the non-irrigated green dwarf coconut plantation under the climatic conditions of Northeastern Pará, Brazil.
The variation in available energy in the inter-row area and the surface temperatures of this region are influenced by the shading effect of the surrounding vegetation [42]. In this type of cultivation, radiation dynamics are directly controlled by larger vegetation, whose canopy density and leaf architecture determine the amount of radiation intercepted and transmitted, impacting processes such as photosynthesis, evapotranspiration, and soil temperature. In this context, taller plants intercept most of the Rg, while the inter-row plants rely on transmitted radiation to carry out their biophysical processes [43,44]. Therefore, the greatest discrepancies between the row and inter-row observed in this study, particularly during the previously mentioned hours, are likely caused by the shading effect resulting from the angle of solar radiation incidence on the coconut palms. Additionally, other intrinsic characteristics of the vegetation in this region, such as leaf temperature and albedo, suggest that it does not significantly affect this radiative dynamic.
Regarding leaf temperature, the inter-row vegetation exhibited an average of 31.5 °C during the rainy season and 36.8 °C during the dry season. The coconut palm had leaf temperatures of 31.2 °C and 36.7 °C during the rainy and dry periods, respectively. These similar values, which were statistically equivalent according to Student’s t-test (p > 0.05), indicate that in this condition, long-wave emission is likely not a determining factor for spatial differences in net radiation.
With respect to albedo, tropical kudzu exhibited an albedo of 0.21, which was significantly lower than that of coconut palms (0.27), according to Student’s t-test (p < 0.05). This suggests that although coconut palms have a higher albedo, reflecting a greater percentage of global radiation, the vegetation in the row still retains a higher net radiation. In a study evaluating non-irrigated coconut cultivation in Brazil’s semi-arid region, Silva et al. [45] found albedo values ranging from 0.19 to 0.31, corroborating the results presented in this study.
In this context, the vegetation present in the inter-row (P. phaseoloides) exhibited lower net radiation (Table 2), possibly due to the shading effect exerted by the main vegetation in the planting rows. Despite the higher albedo of the coconut trees, net radiation in the planting row was higher. These spatial differences in non-irrigated crops may result in variations in the energy balance between rows and inter-rows, influencing how different species utilize radiation and contribute to biophysical and physiological processes related to the energy balance. This pattern suggests that differences in energy availability between the row and inter-row could lead to distinct water consumption, as the vegetation in the row, with a higher radiation balance, tends to allocate a more significant fraction of this flux to latent heat (LE), intensifying evapotranspiration [1], which already has a naturally high demand [26], when soil water conditions are adequate. On the other hand, this increase in net radiation could exacerbate the water deficit during the dry season, potentially impacting crop development and productivity [26].
3.2. Spatial Characterization
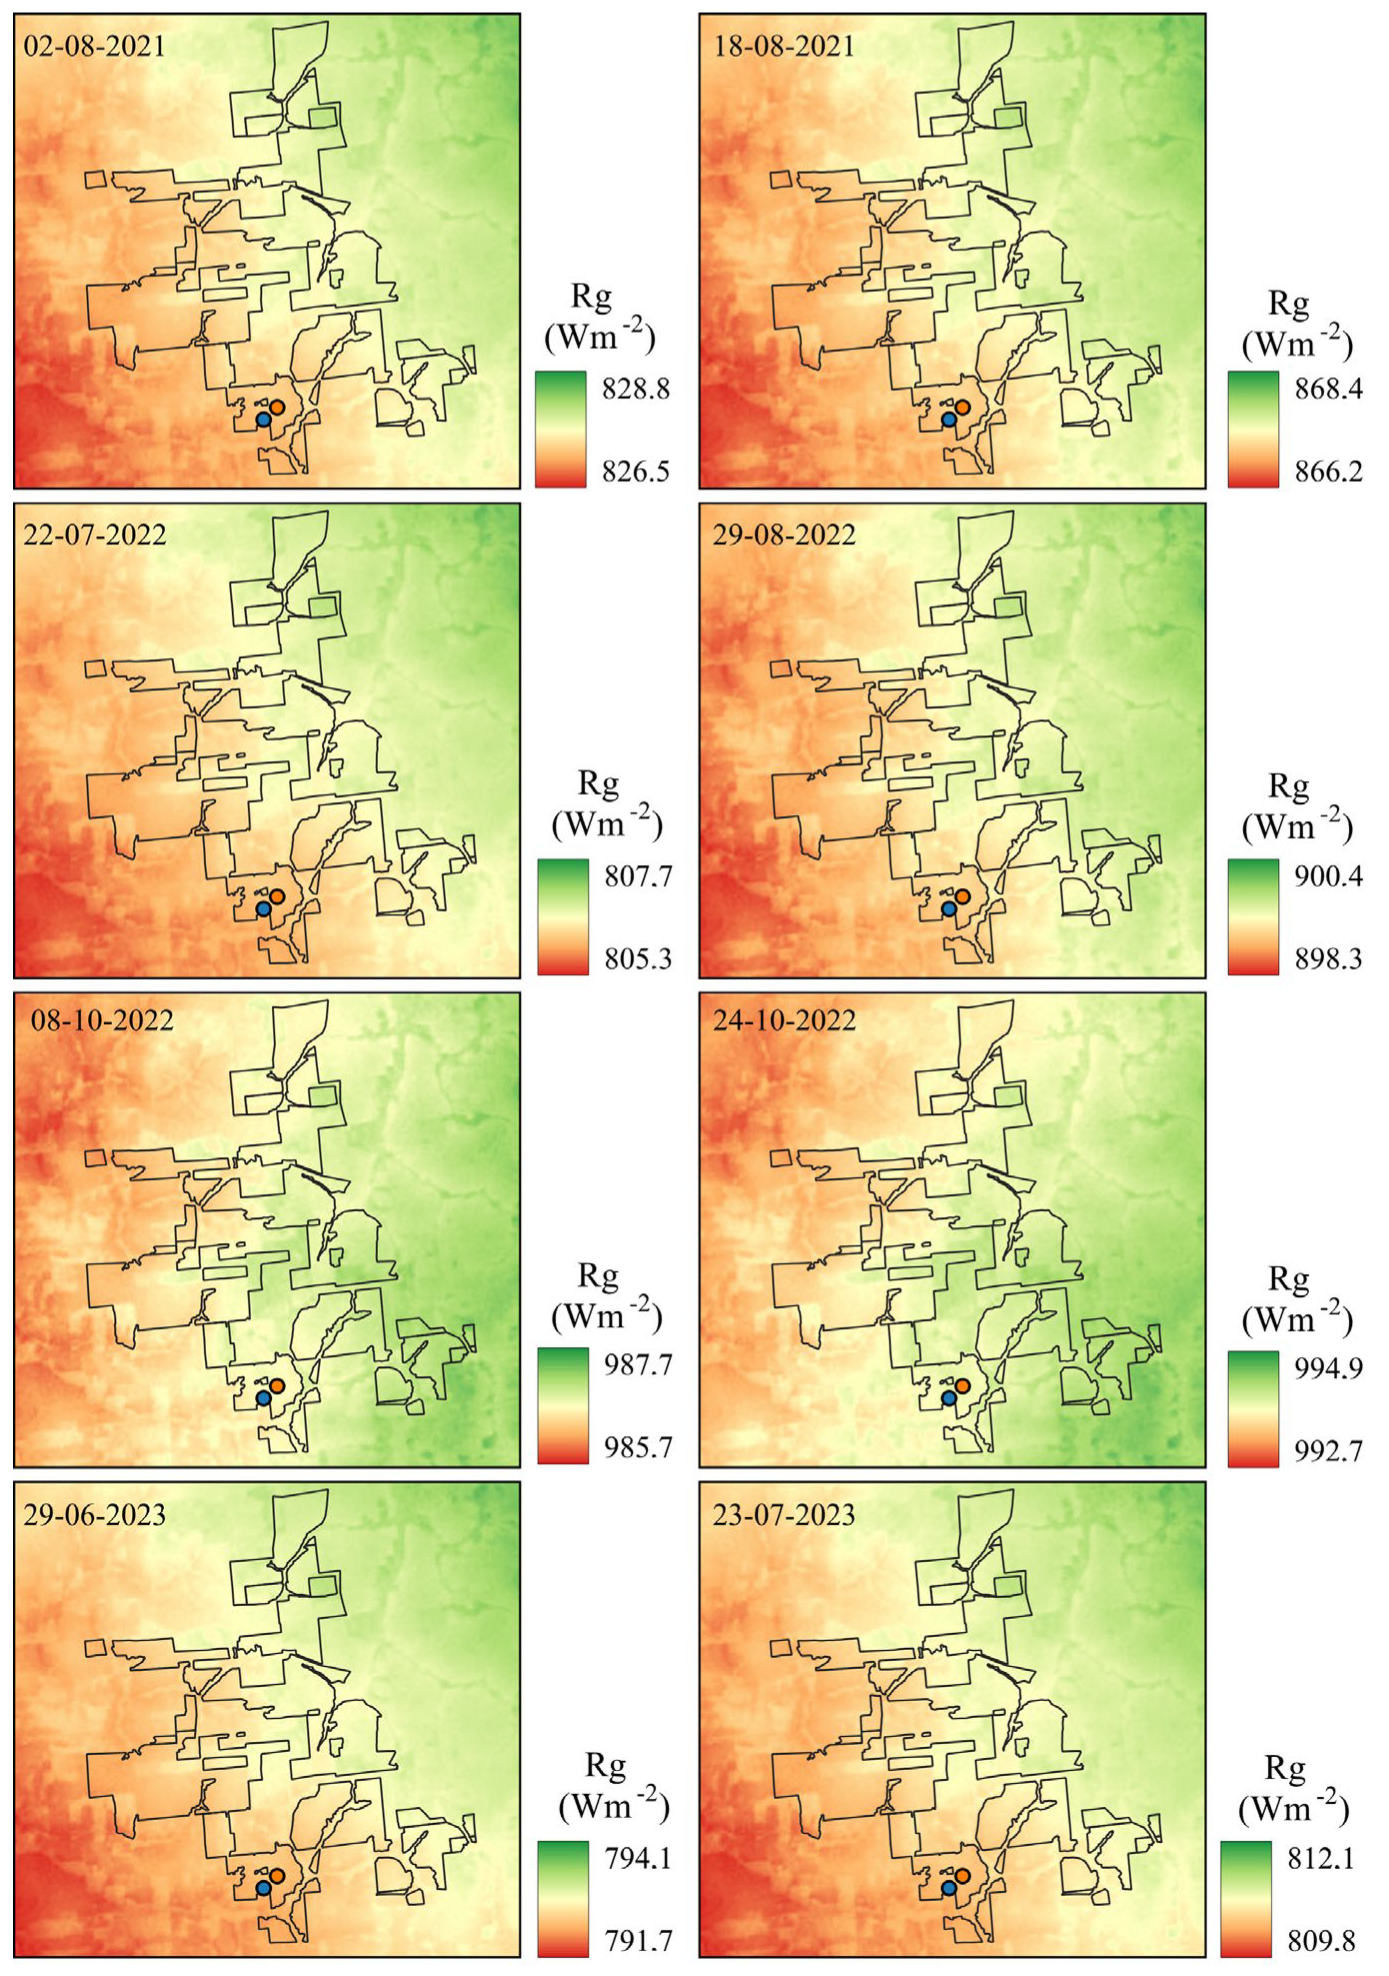
Considering the spatial analysis, eight images were obtained after applying the cloud cover filter. It is worth noting the limited number of images available during the experimental period (August 2020 to February 2024), which highlights the challenge of obtaining these variables in the region due to the high cloud cover characteristic of the Amazon. Thus, global radiation ranged from 791.7 W m−2 to 994.9 W m−2 in the analyzed images, with the highest incident radiation totals occurring in the easternmost part of the farm (Figure 10).
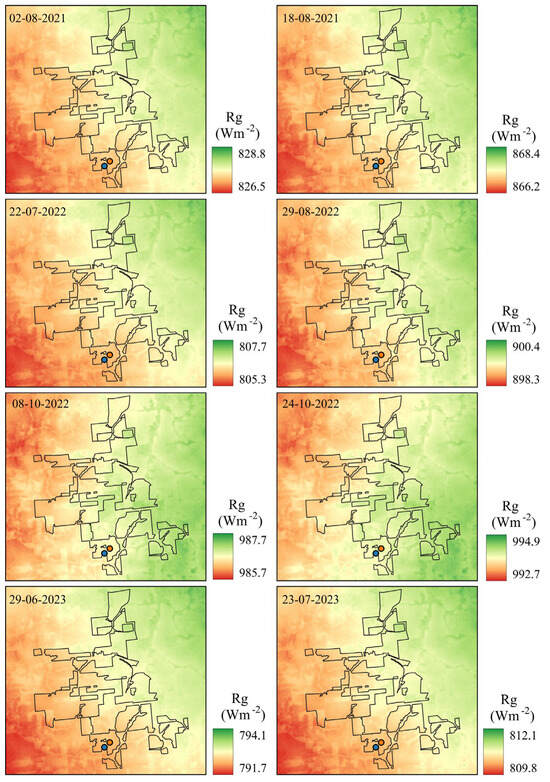
Figure 10.
Spatiotemporal variation in global radiation (Rg) in cultivating green dwarf coconut palms under the climatic conditions of Northeastern Pará, Brazil. The circles correspond to the locations of the micrometeorological towers in the irrigated area (blue circle) and the non-irrigated area (orange circle).
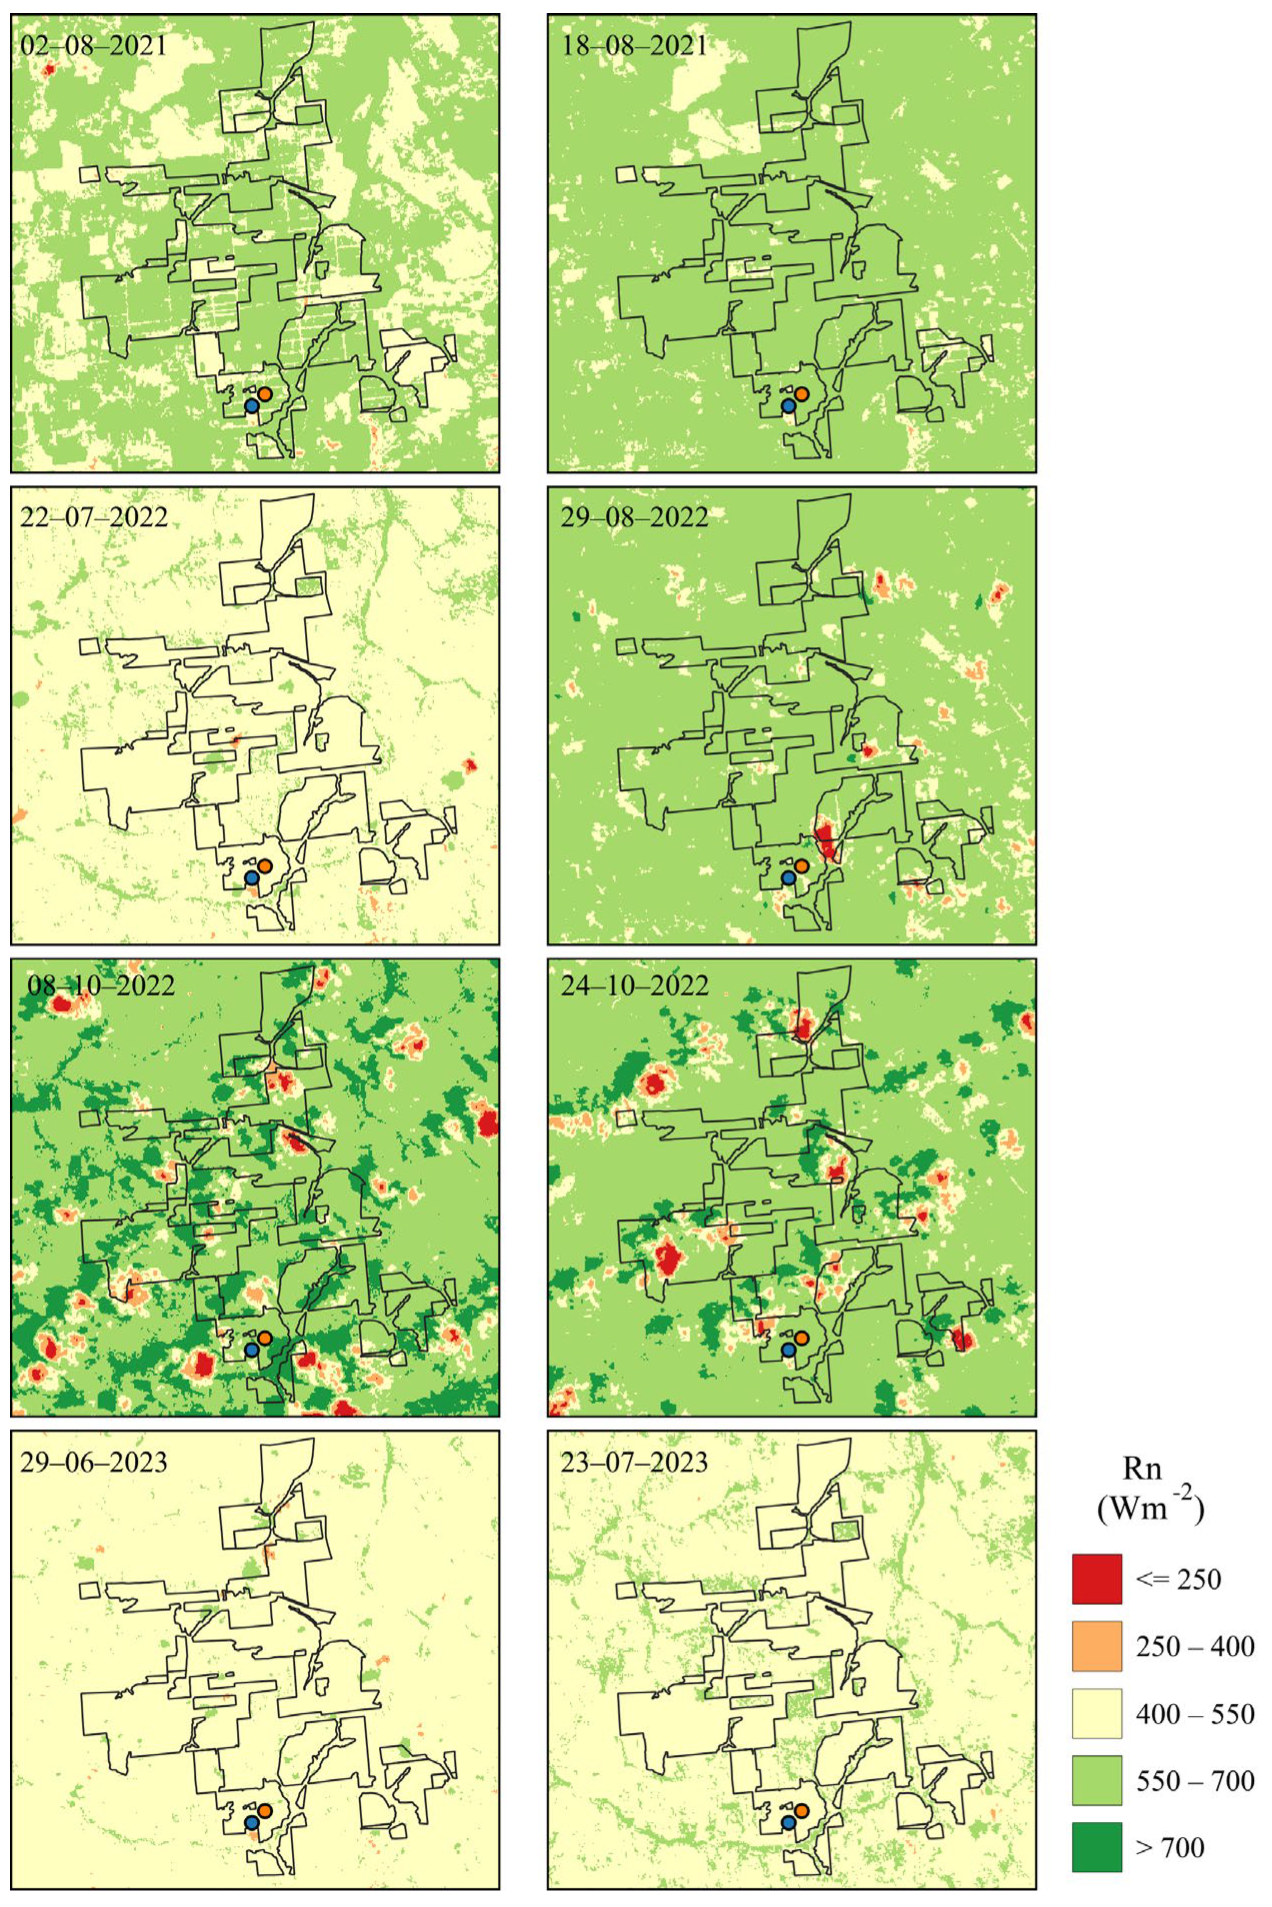
There are five classes of variation for net radiation in this variable, with the 400–550 W m−2 and 550–700 W m−2 classes being predominant in the area (Figure 11). The images obtained in August and October 2022 stand out due to the presence of regions with Rn values lower than 250 W m−2, which can be attributed to the high occurrence of cloud cover on those dates.
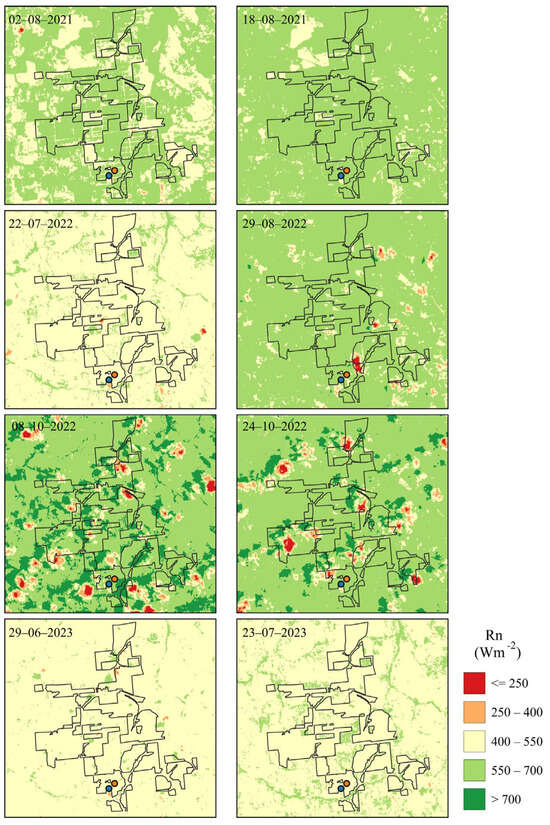
Figure 11.
Spatiotemporal variation in the radiation balance (Rn) in cultivating green dwarf coconut palms under the climatic conditions of Northeastern Pará, Brazil. The circles correspond to the locations of the micrometeorological towers in the irrigated area (blue circle) and the non-irrigated area (orange circle).
When comparing the values estimated from satellite images with those observed by the micrometeorological towers, the highest R2 values were obtained in the irrigated area (Table 3), indicating greater accuracy compared to the non-irrigated area. The MAE% and RMSE% ranged from 2.72% to 10.32%, reflecting lower errors in the estimation of net radiation in the irrigated area.

Table 3.
Performance indices for the global radiation (Rg) and net radiation (Rn) variables were estimated by satellite and observed in the cultivation of green dwarf coconut palms in the climatic conditions of Northeastern Pará, Brazil.
In the Brazilian Amazon region, an RMSE of 75.357 W m−2 and an R2 of 0.422 were found in the validation of net radiation data using a micrometeorological tower, supporting the recommendation of these estimates for engineering applications [18]. In Cerrado–Amazon transition areas, Rn variations between 400 and 650 W m−2 were observed, with an RMSE of 15.2 W m−2 [46], while Rn values ranging from 400 to 600 W m−2 presented RMSE values varying from 20 to 80 W m−2 [47], both obtained using the Landsat 5 satellite. Additionally, in the Amazon region, Rn estimates using the MODIS satellite resulted in relative errors ranging from 0.2% to 19.2% [48]. Considering these results and the available literature, the use of satellite images emerges as a viable alternative to meteorological sensors, reducing data acquisition costs without compromising the quality of the estimates.
In this context, based on the performance indices presented, estimating net radiation and global radiation from satellite data can be a viable alternative for data acquisition in the Northeastern Pará region. However, the high cloud cover characteristic of this area may pose a significant challenge, reducing the availability of high-quality images and compromising the accuracy of the estimates. Frequent cloud presence can lead to data gaps or result in underestimation or overestimation of incident surface radiation. Therefore, the use of satellite images should be complemented by additional strategies, such as incorporating local meteorological data and applying atmospheric correction models, to minimize errors associated with cloud cover and ensure greater reliability in the analyses.
4. Conclusions
Seasonally, the dry period exhibits higher incident radiation (approximately 21% higher) and net radiation (approximately 23% higher) due to the direct effect of less intense and fewer precipitation events, leading to reduced cloud cover. The irrigated area showed a higher Rn/Rg fraction (on average 15% higher), indicating a greater radiation balance compared to the non-irrigated area. This suggests better utilization of available energy, as more global radiation is converted into net radiation.
The lower net radiation observed in the inter-row of the crop (average of 8.36 MJ m−2 day−1) compared to the planting row (average of 9.95 MJ m−2 day−1) in the non-irrigated area is likely due to shading from the main crop. This behavior can lead to a different energy balance between the row and inter-row, with each species interacting differently with the radiation.
The use of satellite images to estimate radiation balance components in coconut cultivation areas in the Eastern Amazon region is feasible. It provides accurate estimates and effectively quantifies these variables, with RMSE ranging from 3.29% to 10.32%, although it is limited by the availability of images with low cloud cover, a characteristic of the region’s climate.
Author Contributions
Conceptualization, G.S.T.F., B.R.d.M. and L.R.d.T.R.; methodology, G.S.T.F., B.R.d.M., J.V.d.N.P., L.R.d.T.R. and P.J.d.O.P.d.S.; validation, G.S.T.F., J.V.d.N.P., M.L.R., M.K.M.N., L.M.N., J.B.d.C. and V.B.M.; formal analysis, G.S.T.F., B.R.d.M. and L.R.d.T.R.; investigation, G.S.T.F., B.R.d.M., L.R.d.T.R., M.L.R., M.K.M.N., L.M.N., J.B.d.C. and V.B.M.; resources, P.J.d.O.P.d.S., J.V.d.N.P., A.M.d.R.F.J. and S.O.-F.; data curation, G.S.T.F.; writing—original draft preparation, G.S.T.F.; writing—review and editing, P.J.d.O.P.d.S., A.M.d.R.F.J. and S.O.-F.; visualization, G.S.T.F., B.R.d.M. and L.R.d.T.R.; supervision, P.J.d.O.P.d.S. and S.O.-F.; project administration, P.J.d.O.P.d.S.; funding acquisition, P.J.d.O.P.d.S. All authors have read and agreed to the published version of the manuscript.
Funding
This research was funded by Conselho Nacional de Desenvolvimento Científico e Tecnológico (CNPq), Edital no. 12/2020, process 154794/2021-0, by a productivity scholarship to the last author (process 311681/2022-0) and research funding through the Universal project (Process 403902/2021-5); call project 008/2022—Fapespa/CNPq (Process 2023/158057).
Data Availability Statement
The data presented in this study are available upon request from the corresponding author.
Acknowledgments
We thank the Sococo Agroindústrias da Amazônia S/A for funding this research, granting the experimental area and logistics, and the Conselho Nacional de Desenvolvimento Científico e Tecnológico (CNPq) for granting a Ph.D. scholarship to the first author (Edital nº 12/2020, process 154794/2021-0) and a productivity scholarship to the last author (process 311681/2022-0). A.M.d.R.F.J. acknowledges support from the São Paulo Research Foundation—FAPESP (grant 2023/05323-4). We thank the ISPAAm research group and postgraduate program in agronomy of the Universidade Federal Rural da Amazônia for their support in carrying out this study. We also appreciate the constructive comments and suggestions provided by the two anonymous reviewers on an earlier version of the manuscript.
Conflicts of Interest
The authors declare no conflicts of interest.
References
- Pinto, J.V.D.N.; Costa, D.L.P.; Nunes, H.G.G.C.; Silva Junior, A.C.D.; Sousa, A.M.L.D.; Souza, P.J.D.O.P.D.; Ortega-Farias, S. Radiation Balance and Partitioning of Latent and Sensible Heat Fluxes over a Lime Orchard in Eastern Amazon. Rev. Bras. de Meteorol. 2022, 37, 491–502. [Google Scholar] [CrossRef]
- Fuentes-Penailillo, F.; Ortega-Farias, S.; Acevedo-Opazo, C.; Fonseca-Luengo, D. Implementation of a two-source model for estimating the spatial variability of olive evapotranspiration using satellite images and ground-based climate data. Water 2018, 10, 339. [Google Scholar] [CrossRef]
- Fernandes, G.S.T.; Lopes, P.M.O.; Moura, G.B.A.; Silva, M.V.; Galvíncio, J.D.; Santos, A. Balance of photosynthetically active radiation by remote sensing in a seasonally dry tropical forest in Northeastern Brazil. Rev. Bras. Geogr. Fís. 2021, 14, 2486–2509. [Google Scholar] [CrossRef]
- Viégas, I.J.M.; Costa, M.G.; Ferreira, E.V.O.; Peréz, N.L.P.; Barata, H.S.; Galvão, J.R.; Conceição, H.E.O.; Espirito Santo, S.D. Contribution of Pueraria phaseoloides L. in the Cycling of Macronutrients in oil Palm Plantations. J. Agric. Stud. 2021, 9, 1–13. [Google Scholar] [CrossRef]
- Benassi, A.C.; Santana, E.N.; Fanton, C. O Cultivo do Coqueiro-Anão-Verde: Tecnologias de Produção; Incaper: Vitória, Brazil, 2013; 120p. [Google Scholar]
- FAOSTAT. Food and Agriculture Organization of the United Nations (FAO). FAOSTAT Database. Available online: https://www.fao.org/faostat/en/#data/QCL (accessed on 12 July 2024).
- IBGE. Instituto Brasileiro de Geografia e Estatística. Produção Agrícola: Lavoura Permanente. 2022. Available online: https://sidra.ibge.gov.br/tabela/5457#resultado (accessed on 12 July 2024).
- Ferreira, T.R.; Da Silva, B.B.; De Moura, M.S.; Verhoef, A.; Nobrega, R.L. The use of remote sensing for reliable estimation of net radiation and its components: A case study for contrasting land covers in an agricultural hotspot of the Brazilian semiarid region. Agric. For. Meteorol. 2020, 291, 108052. [Google Scholar] [CrossRef]
- Walker, E.; Mora, D.C.; Fagioli, G.; Venturini, V. Effect of the net radiation substitutes on maize and soybean evapotranspiration estimation using machine learning methods. AgriScientia 2022, 39, 1–17. [Google Scholar] [CrossRef]
- Lu, L.; Zhang, D.; Zhang, J.; Zhang, J.; Zhang, S.; Bai, Y.; Yang, S. Ecosystem evapotranspiration partitioning and Its spatial–temporal variation based on eddy covariance observation and machine learning method. Remote Sens. 2023, 15, 4831. [Google Scholar] [CrossRef]
- Sadras, V.O.; Villalobos, F.J.; López-Bernal, Á.; Fereres, E. Radiation Interception, Radiation Use Efficiency, and Crop Productivity. In Principles of Agronomy for Sustainable Agriculture; Villalobos, F.J., Fereres, E., Eds.; Springer: Cham, Switzerland, 2024; pp. 177–197. [Google Scholar] [CrossRef]
- Teixeira, A.D.C.; de Miranda, F.R.; Leivas, J.F.; Pacheco, E.P.; Garçon, E.A.M. Water productivity assessments for dwarf coconut by using Landsat 8 images and agrometeorological data. ISPRS J. Photogramm. Remote Sens. 2019, 155, 150–158. [Google Scholar] [CrossRef]
- Senatilleke, U.; Abeysiriwardana, H.; Makubura, R.K.; Anwar, F.; Rathnayake, U. Estimation of potential evapotranspiration across Sri Lanka using a distributed dual-source evapotranspiration model under data scarcity. Adv. Meteorol. 2022, 2022, 6819539. [Google Scholar] [CrossRef]
- Kelley, J. Assessment and correction of solar radiation measurements with simple neural networks. Atmosphere 2020, 11, 1160. [Google Scholar] [CrossRef]
- Myeni, L.; Moeletsi, M.E.; Clulow, A.D. Assessment of three models for estimating daily net radiation in southern Africa. Agric. Water Manag. 2020, 229, 105951. [Google Scholar] [CrossRef]
- Rahman, M.M.; Zhang, W.; Arshad, A. Regional distribution of net radiation over different ecohydrological land surfaces. Atmosphere 2020, 11, 1229. [Google Scholar] [CrossRef]
- Angelocci, L.R.; Pilau, F.G.; Simon, J.; Marin, F.R. Performance and uncertainty of the all-wave net radiation space-time integrators by treetops. Agrometeoros 2023, 31, e027217. [Google Scholar] [CrossRef]
- Paca, V.H.D.M.; Espinoza-Dávalos, G.E.; Silva, R.; Tapajós, R.; Gaspar, A.B.G. Remote sensing products validated by flux tower data in Amazon rain forest. Remote Sens. 2022, 14, 1259. [Google Scholar] [CrossRef]
- Sales, V.G.; Strobl, E.; Elliott, R.J. Cloud cover and its impact on Brazil’s deforestation satellite monitoring program: Evidence from the cerrado biome of the Brazilian Legal Amazon. Appl. Geogr. 2022, 140, 102651. [Google Scholar] [CrossRef]
- Li, R.; Wang, D.; Liang, S. Comprehensive assessment of five global daily downward shortwave radiation satellite products. Sci. Remote Sens. 2021, 4, 100028. [Google Scholar] [CrossRef]
- Moraes, B.C.D.; Costa, J.M.N.D.; Costa, A.C.L.D.; Costa, M.H. Spatial and temporal variation of precipitation in the State of Pará. Acta Amaz. 2005, 35, 207–214. [Google Scholar] [CrossRef]
- Alvares, C.A.; Stape, J.L.; Sentelhas, P.C.; Gonçalves, J.D.M.; Sparovek, G. Köppen’s climate classification map for Brazil. Meteorol. Z. 2013, 22, 711–728. [Google Scholar] [CrossRef]
- Souza, E.B.; Silva Ferreira, D.B.; Guimarães, J.T.F.; dos Santos Franco, V.; Azevedo, F.T.M. Climatological rainfall patterns and trends in the rainy and dry regimes in Eastern Amazon. Rev. Bras. de Clim. 2017, 21, 81–93. [Google Scholar] [CrossRef]
- EMBRAPA—Empresa Brasileira de Pesquisa Agropecuária. Sistema Brasileiro de Classificação de Solos, 5th ed.; Embrapa: Rio de Janeiro, Brazil, 2018; 356p. [Google Scholar]
- United States. Soil Survey Staff. Keys to Soil Taxonomy, 12th ed.; USDA NRCS; 2014. Available online: https://www.nrcs.usda.gov/wps/portal/nrcs/main/soils/survey/ (accessed on 25 November 2023).
- Carvalho, E.D.O.T.D.; Fernandes, G.S.T.; Rua, M.L.; Monteiro, A.C.; Luz, D.B.D.; Lisboa, S.P.P.; Silva, J.V.F.; Pinto, J.V.N.; Miranda, F.R.; Lins, P.M.P.; et al. Net radiation partitioning, evapotranspiration, and crop coefficients of the green dwarf coconut in Santa Izabel do Pará, Brazilian Amazon. Bragantia 2024, 83, e20230160. [Google Scholar] [CrossRef]
- Fernandes, G.S.T.; Ribeiro, L.R.D.T.; Rua, M.L.; Vieira, W.G.M.; Pinto, J.V.D.N.; Souza, P.J.D.O.P.D. Meteorological conditions afect the seasonal development and yield of green dwarf coconut. Pesqui. Agropecu. Trop. 2024, 54, e77037. [Google Scholar] [CrossRef]
- Crawford, C.J.; Roy, D.P.; Arab, S.; Barnes, C.; Vermote, E.; Hulley, G.; Gerace, A.; Choate, M.; Engebretson, C.; Micijevic, E.; et al. The 50-year Landsat collection 2 archive. Sci. Remote Sens. 2023, 8, 100103. [Google Scholar] [CrossRef]
- Papachristopoulou, K.; Fountoulakis, I.; Bais, A.F.; Psiloglou, B.E.; Papadimitriou, N.; Raptis, I.-P.; Kazantzidis, A.; Kontoes, C.; Hatzaki, M.; Kazadzis, S. Effects of clouds and aerosols on downwelling surface solar irradiance nowcasting and sort-term forecasting. Atmospheric Meas. Tech. 2024, 17, 1851–1877. [Google Scholar] [CrossRef]
- Allen, R.G.; Tasumi, M.; Trezza, R. Satellite-based energy balance for mapping evapotranspiration with internalized calibration (METRIC)—Model. J. Irrig. Drain. Eng. 2007, 133, 380–394. [Google Scholar] [CrossRef]
- Silva, B.B.D.; Braga, A.C.; Braga, C.C.; Oliveira, L.M.; Montenegro, S.M.; Barbosa Junior, B. Procedures for calculation of the albedo with OLI-Landsat 8 images: Application to the Brazilian semi-arid. Rev. Bras. De Eng. Agricola E Ambient. 2016, 20, 3–8. [Google Scholar] [CrossRef]
- R Core Team. R: A Language and Environment for Statistical Computing. 2024. Available online: https://www.r-project.org/ (accessed on 10 January 2024).
- Pereira, L.S.; Paredes, P.; Rodrigues, G.C.; Neves, M. Modeling malt barley water use and evapotranspiration partitioning in two contrasting rainfall years. Assessing AquaCrop and SIMDualKc models. Agric. Water Manag. 2015, 159, 239–254. [Google Scholar] [CrossRef]
- Willmott, C.J.; Matsuura, K. Advantages of the mean absolute error (MAE) over the root mean square error (RMSE) in assessing average model performance. Clim. Res. 2005, 30, 79–82. [Google Scholar] [CrossRef]
- Souza, A.P.; Zamadei, T.; Borella, D.R.; Martim, C.C.; Almeida, F.T.; Escobedo, J.F. Diurnal Evolution and Estimates of Hourly Diffuse Radiation Based on Horizontal Global Radiation, in Cerrado-Amazon Transition, Brazil. Atmosphere 2023, 14, 1289. [Google Scholar] [CrossRef]
- Freire, A.S.C.; Vitorino, M.I.; de Souza, A.M.L.; Germano, M.F. Analysis of the energy balance and CO2 flow under the influence of the seasonality of climatic elements in a mangrove ecosystem in Eastern Amazon. Int. J. Biometeorol. 2022, 66, 647–659. [Google Scholar] [CrossRef]
- Fernandes, D.A.J.; Vitorino, M.I.; Jardim, M.A.G. Efeito da radiação solar sobre a regeneração natural de manguezal em Cuiarana, Salinópolis. Pará. Rev. Bras. Ciênc. Ambient. 2018, 49, 8–122. [Google Scholar]
- Tota, J.; Fisch, G.; Fuentes, J.; Oliveira, P.J.D.; Garstang, M.; Heitz, R.; Sigler, J. The analysis of the daily rainfall in a pasture site during the Wet Season of 1999—TRMM/ LBA project. Acta Amaz. 2000, 30, 629. [Google Scholar] [CrossRef]
- Querino, C.A.S.; Júnior, J.M.L.; Moura, M.A.L. Radiation Balance in the Caatinga Biome in the Semi-arid of Alagoas, Brazil. Rev. Bras. Geogr. Física 2022, 15, 2715–2729. [Google Scholar] [CrossRef]
- Li, H.; Lo, M.H.; Ryu, D.; Peel, M.; Zhang, Y. Possible increase of air temperature by irrigation. Geophys. Res. Lett. 2022, 49, e2022GL100427. [Google Scholar] [CrossRef]
- Li, X.; Li, X.; Hua, W.; Ma, H.; Zhou, J.; Pang, X. Modeling the effects of present-day irrigation on temperature extremes over China. Front. Earth Sci. 2023, 11, 1084892. [Google Scholar] [CrossRef]
- Pieri, P. Modelling radiative balance in a row-crop canopy: Cross-row distribution of net radiation at the soil surface and energy available to clusters in a vineyard. Ecol. Model. 2010, 221, 802–811. [Google Scholar] [CrossRef]
- Nur Arina, I.; Martini, M.Y.; Surdiana, S.; Mohd Fauzi, R.; Zulkefly, S. Radiation dynamics on crop productivity in different cropping systems. Int. J. Agron. 2021, 2021, 4570616. [Google Scholar] [CrossRef]
- Li, R.; Zhang, Z.; Tang, W.; Huang, Y.; Nan, Z. Effect of row configuration on yield and radiation use of common vetch-oat strip intercropping on the Qinghai-Tibetan plateau. Eur. J. Agron. 2021, 128, 126290. [Google Scholar] [CrossRef]
- Silva, B.B.D.; Braga, A.C.; Braga, C.C.; Oliveira, L.M.M.D.; Galvíncio, J.D.; Montenegro, S.M.G.L. Evapotranspiration and assessment of water consumed in irrigated area of the Brazilian Semiarid Region by remote sensing. Pesqui. Agropecu. Bras. 2012, 47, 1218–1226. [Google Scholar] [CrossRef]
- Fausto, M.A.; Machado, N.G.; de Souza Nogueira, J.; Biudes, M.S. Net radiation estimated by remote sensing in Cerrado areas in the Upper Paraguay River Basin. J. Appl. Remote Sens. 2014, 8, 083541. [Google Scholar] [CrossRef]
- Marques, H.O.; Biudes, M.S.; Pavão, V.M.; Machado, N.G.; Querino, C.A.S.; Danelichen, V.H.D.M. Estimated net radiation in an Amazon–Cerrado transition forest by Landsat 5 TM. J. Appl. Remote Sens. 2017, 11, 046020. [Google Scholar] [CrossRef]
- Oliveira, G.D.; Moraes, E.C. Validation of net radiation obtained from MODIS/TERRA data in Amazonia with LBA surface measurements. Acta Amaz. 2013, 43, 353. [Google Scholar] [CrossRef]
Disclaimer/Publisher’s Note: The statements, opinions and data contained in all publications are solely those of the individual author(s) and contributor(s) and not of MDPI and/or the editor(s). MDPI and/or the editor(s) disclaim responsibility for any injury to people or property resulting from any ideas, methods, instructions or products referred to in the content. |
© 2025 by the authors. Licensee MDPI, Basel, Switzerland. This article is an open access article distributed under the terms and conditions of the Creative Commons Attribution (CC BY) license (https://creativecommons.org/licenses/by/4.0/).

