Highlights
What are the main findings?
- Integration of real-time edge vehicle perception with a cloud-based digital twin enables accurate, live replication of dynamic urban traffic.
- Demonstration of a low-latency vehicle-to-cloud communication pipeline achieving minimum end-to-end delay for synchronized traffic monitoring.
What is the implication of the main finding?
- The proposed framework supports scalable, real-time intelligent transportation system (ITS) applications for smart city traffic visualization, predictive analytics, and cooperative mobility management.
- This end-to-end integration enhances traffic safety and efficiency by providing continuous, high-fidelity digital twin representations for proactive urban traffic management.
Abstract
This paper presents a framework that integrates real-time onboard (ego vehicle) perception module with edge processing capabilities and a cloud-based digital twin for intelligent transportation systems (ITSs) in smart city applications. The proposed system combines onboard 3D object detection and tracking with low latency edge-to-cloud communication, achieving an average end-to-end latency below 0.02 s at 10 Hz update frequency. Experiments conducted on a real autonomous vehicle platform demonstrate a mean Average Precision (mAP@40) of 83.5% for the 3D perception module. The proposed system enables real-time traffic visualization while enabling scalable data management by reducing communication overhead. Future work will extend the system to multi-vehicle deployments and incorporate additional environmental semantics such as traffic signal states, road conditions, and predictive Artificial Intelligence (AI) models to enhance decision support in dynamic urban environments.
1. Introduction
Intelligent transportation systems (ITSs) are a core component of the smart city vision, serving as the backbone for achieving efficient, sustainable, and connected urban mobility []. In a smart city context, ITS integrates advanced sensing, communication, and data analytics to enable real-time traffic management, optimized public transportation, and improved road safety. The push towards smarter cities has accelerated ITS development, leveraging advancements in Artificial Intelligence (AI), Internet of Things (IoT), and edge/cloud computing. However, despite these advances, continuous, high-fidelity monitoring of real-world traffic dynamics remains underexplored, even though it is critical for enabling proactive decision making by transportation authorities [].
Real-time traffic awareness is only achievable through advanced perception systems capable of continuously detecting and tracking road users, as well as simulating a dynamic environment. Such capabilities are vital not only for autonomous vehicles but also for large-scale ITS applications, where accurate and timely scene understanding allows safe navigation, coordinated traffic control, and informed decision making. However, achieving reliable, high-fidelity situational awareness in complex urban environments remains a formidable challenge due to noisy sensor data, occlusions, and the intricacies of dynamic interactions [,].
High-fidelity digital twins provide real-time digital replicas of the physical environment and offer a promising pathway to address the challenges of safe and resilient smart cities []. By integrating advanced perception models with the virtual environment, a digital twin enables realistic simulations that facilitate system testing, predictive analysis, and interactive scenario planning without the operational risks and costs associated with real-world deployment. When applied to an ITS, digital twins allow synchronized bidirectional coupling between the physical and virtual worlds, enabling both vehicle-level decision making and city-level traffic monitoring [,].
Within the smart city paradigm, efficient transportation systems are central to improving urban mobility, reducing congestion, lowering emissions, and enhancing safety []. The ability to construct a persistent, real-time digital twin of dynamic traffic conditions provides city planners, traffic management centers, and mobility service providers with actionable situational awareness. Such systems can forecast congestion, optimize traffic signal control, enable cooperative vehicle-to-infrastructure (V2I) and vehicle-to-everything (V2X) strategies, and facilitate rapid incident detection and response [,]. By bridging edge-based, vehicle-level perception with cloud-based, large-scale city-level digital twins, this work addresses a key gap between localized sensing and global traffic intelligence, thereby contributing to scalable smart city mobility solutions [].
The primary objective of this work is to equip an ego vehicle (EV) with a real-time perception system capable of detecting and tracking dynamic objects using synchronized, calibrated multi-sensor data and to stream this information via an efficient, low-latency wireless communication protocol to a cloud-based digital twin platform. This integration enables real-time projection of real-world dynamic traffic scenarios into a virtual urban replica, thereby supporting traffic monitoring, predictive modeling, and decision support functionalities in a smart city context.
This paper presents a comprehensive framework that combines real-world perception, optimized communication, and high-fidelity digital twin synchronization into an operational pipeline suitable for autonomous mobility applications and large-scale ITS deployments. Furthermore, the proposed framework serve as a proof-of-concept demonstration that validates the real-time integration of state-of-the-art technologies on a small scale. It addresses the key challenges related to the real-world implementation of the proposed technology, thereby establishing a foundation for future scalable ITS implementations.
Paper Contribution: The key contributions of this work are as follows:
- Design and deployment of a real-time multi-sensor perception and tracking system on an experimental EV, capable of detecting and tracking dynamic road users with high accuracy in complex urban environments.
- Development of a cloud-based, high-fidelity digital twin that replicates the real traffic environment in synchronization with physical real-world perception data, enabling city scale situational awareness and safe virtual testing.
- Integration of edge-based perception with cloud-based simulation through a low-latency communication layer, enabling live projection of real-time dynamic transportation information into the digital twin for use in smart city traffic monitoring, incident management, and predictive control.
Paper Organization: The remainder of this paper is organized as follows: Section 2 reviews the state-of-the-art (SOTA) methods in this field. Section 3 details the proposed framework, which consists of a perception layer, communication layer, and digital twin layer. Section 4 presents the experimental results, including the discussion of vehicle hardware, experimental area, and quantitative and qualitative evaluation for each layer of the framework. Finally, Section 5 summarizes the findings and outlines potential future research directions.
2. Related Work
The ITS constitutes a fundamental element of smart and connected cities, offering transformative solutions for urban mobility management. Despite rapid technological advances, testing and validation of ITS applications remain challenging due to the complexity and dynamic nature of urban traffic environments.
2.1. Traffic Simulator and Digital Twins
To address the aforementioned challenges, traffic simulators have been developed to provide controlled environments for evaluation and development. However, traditional simulators often rely on static datasets and are tailored for specific scenarios or applications, limiting their generalizability and adaptability [].
In contrast, the concept of digital twins emerged in 2018 within the transportation domain as a more flexible and adaptable framework compared to conventional traffic simulators []. Digital twins provide a real-time, high-fidelity virtual representation of physical traffic systems, enabling continuous synchronization between physical and virtual environments. This facilitates advanced modeling, monitoring, and management capabilities that more accurately capture the complexities and dynamics of urban traffic.
The current digital twins for traffic control are primarily constrained to 3D representations of real-world environments, which lack the ability to fully capture the complexities and dynamics of traffic systems. This hinders the effectiveness of traffic management solutions that rely on accurate and comprehensive environmental representation []. Moreover, synchronizing real and virtual world information presents a significant challenge, as discrepancies between the two can lead to inaccuracies in traffic modeling and management. This limits the reliability and effectiveness of digital twin applications in traffic control [].
2.2. Simulation Platforms for Transportation Digital Twins
Several simulation platforms have been utilized to build transportation digital twins, which include SUMO [], PTV Vissim [], Aimsun [], MATSim [], CORSIM [], TransModeler [], and CARLA []. A comprehensive comparison among these simulation platforms is provided in Table 1, which highlights CARLA’s strengths, such as high-quality 3D visualization enabled by Unreal Engine and support for detailed, microscopic-level traffic scenario design. CARLA offers flexibility through seamless integration with other platforms such as SUMO, customizability, and the ability to replicate real-world maps in diverse weather and lighting conditions [].
Table 1.
Comparison of traffic simulation software for digital twin applications.
Furthermore, CARLA supports the customization of urban elements, road signs, and specific traffic features, making it highly suitable for research that requires a high degree of environmental variability in real-world smart city ITS applications [].
2.3. Digital Twin Applications Using CARLA
Recent works have leveraged CARLA for various digital twin applications, particularly in the context of autonomous vehicle (AV) research and traffic data collection. For example, ref. [] proposed a traffic digital twin using CARLA for real-time information sharing among road users (RUs) but did not incorporate detailed road information or movement characteristics of RUs when creating the road network, which limits its accuracy. Similarly, ref. [] proposed a twin-in-the-loop framework for monitoring, highlighting the limitation of traditional simulators, which often fail to accommodate varying levels of abstraction, essential for creating scalable digital twins that can adapt to diverse operational requirements.
However, most CARLA-based contributions focus on recreating real-world traffic scenarios to facilitate AV training or reinforcement learning [], rather than supporting live, interactive, city-scale ITS applications. To address this, our work utilizes CARLA along with Blender and OpenStreetMap (OSM) to import detailed traffic networks, including lane markings, sidewalks, diverse road types, and country-specific signs and signals.
2.4. Real-Time ITS Digital Twin Framework
A critical but underexplored element in current ITS research is the integration of edge processing, V2X communication, and real-time synchronization with digital twins. Edge processing executed onboard vehicles enables real-time object detection and tracking, reducing the burden on communication networks while minimizing both data volume and transmission latency []. Low-latency communication protocols such as 5G, UDP, or other wireless standards are essential for efficient transmission of live perception data to cloud-based digital twins, supporting dynamic urban mobility management.
Prior research often addresses only fragments of this pipeline. For example, Xu et al. [] presented a digital twin framework that visualizes IoT data in real time yet did not provide details on end-to-end pipeline latency or synchronization complexity. In [], authors implemented a real-time traffic monitoring system with live camera feeds; however, transmission relied on web APIs and lacked analysis of networking delay, raising concerns for deployment reliability. Many studies similarly omit comprehensive discussion of real-time data streaming, synchronization between physical and virtual environments, and their impact on digital twin accuracy [,].
Other recent work such as [] proposed a Graph Neural Network (GNN)-based approach for analyzing ITS data streams to detect traffic anomalies within the digital twin. However, much of the literature focuses on leveraging digital twins to generate synthetic data or to train/test models in a virtual environment, rather than utilizing digital twins to broader ITS contexts [,].
In contrast, this work employs a real vehicle equipped with multiple sensors and onboard perception algorithms (edge processing) to detect and track dynamic RUs in complex environments, and it transmits this information via a robust vehicle-to-cloud communication layer to a digital twin platform hosted in the cloud. Using ROS bridge technology, our system effectively projects dynamic RU states from the physical surroundings into the virtual environment, enabling a synchronized and persistent representation for real-time traffic monitoring. This approach supports advanced applications in traffic prediction, incident detection, and safety enhancement, allowing the system to address significant gaps in ITS research. Table 2 highlights the motivation of the presented work as compared to SOTA methods.
Table 2.
Overview of the key technological components and features employed in the proposed framework for smart city applications.
3. Methodology
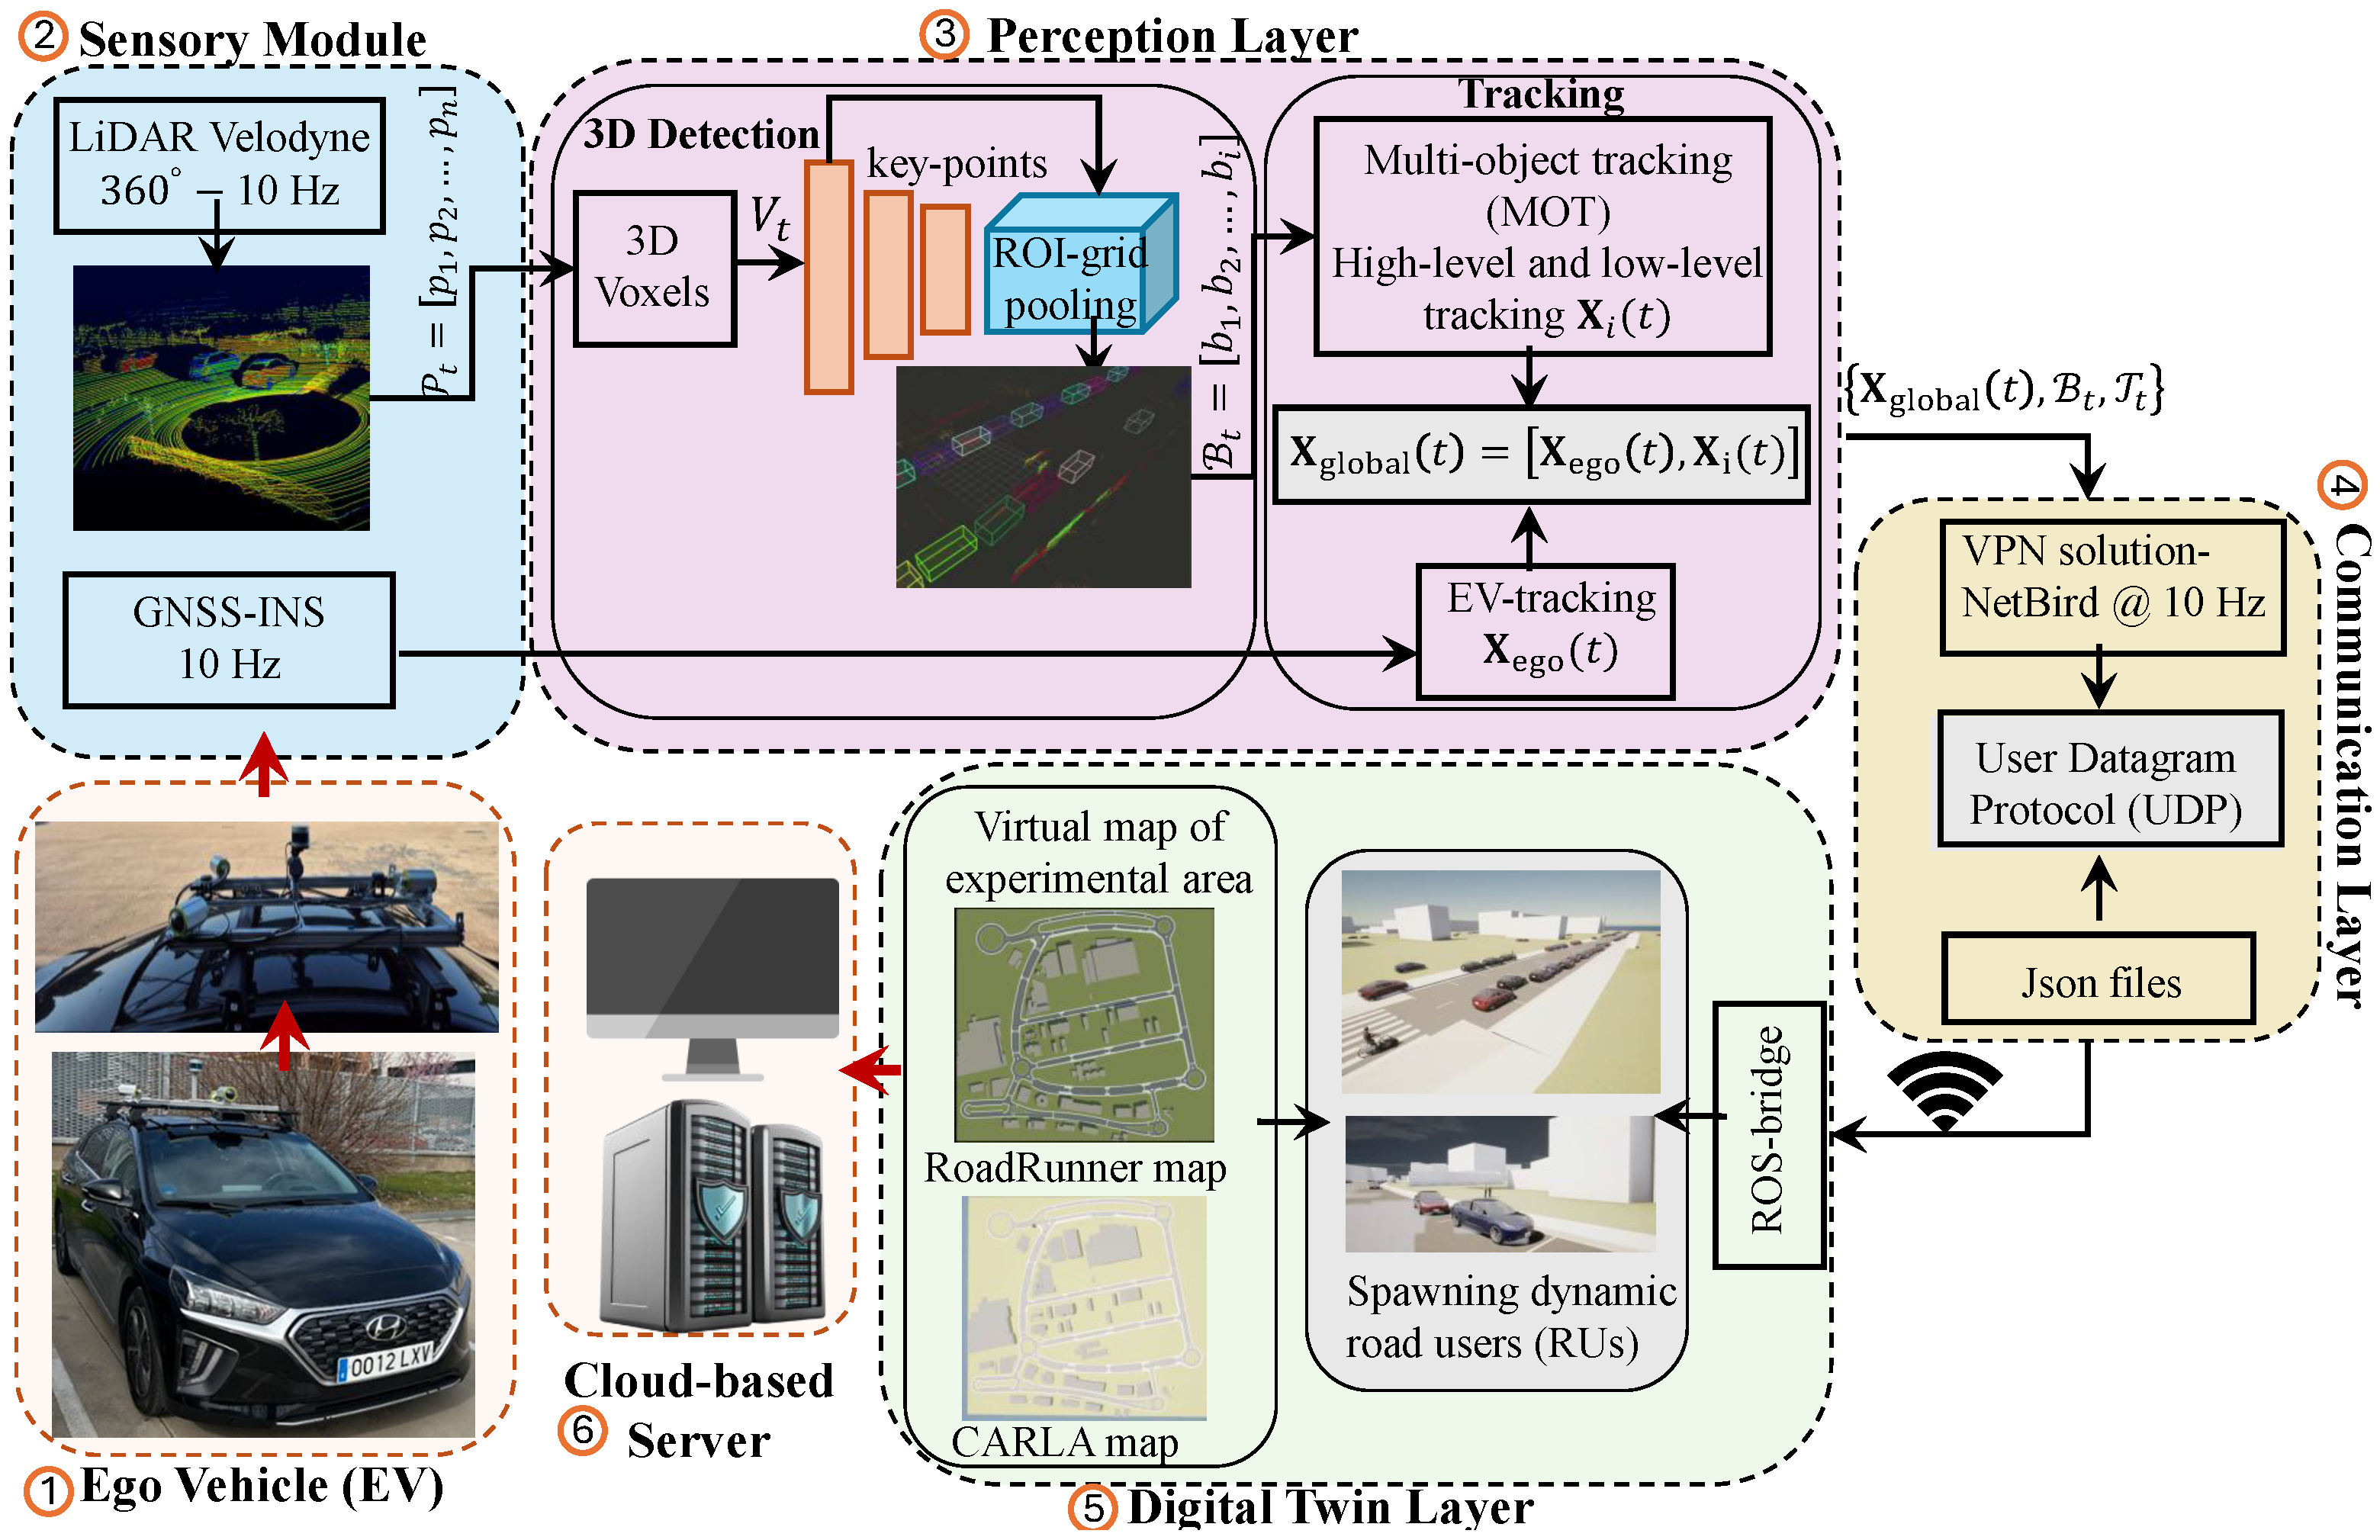
The methodology is divided into three layers, namely, the real-time perception layer, communication layer, and the digital twin layer, as shown in Figure 1.
Figure 1.
Experimental framework: An ego vehicle (EV), equipped with sensors including LiDAR () and GNSS, provides input data to the perception layer. This layer process the data stream to detect () and track () surrounding objects, and computes the global position of the EV (), and the detected objects (). The processed information is then transmitted to the cloud-based digital twin, where virtual representations of the dynamic RUs are spawned.
3.1. Real-Time Perception Layer
The perception pipeline consists of the following three stages, where each stage provides its output to the next stage.
3.1.1. Stage 1: Velodyne LiDAR Sensor
The first stage acquires raw point cloud data from the Velodyne LiDAR sensor and generates a complete representation of the vehicle’s surroundings. Each point in the point cloud is represented as in 3-dimension space , such that
where encodes the reflective intensity information. This raw point cloud represents the 3D geometry of the environment but lacks semantic interpretation.
3.1.2. Stage 2: 3D Detection Model
The raw point cloud collected at each time-instant t consists of a set of points:
where n is the number of points in the point cloud obtained at t-th time-instant, i.e., . The size of point clouds is not fixed, and the points are unstructured, which makes it challenging to process them directly as input to a neural network. To address this, the space was voxelized into a 3D grid with resolution , converting the raw data into a structured form as follows:
This voxelized representation of the point cloud was processed by a state-of-the-art deep neural network called PV-RCNN []. This model was leveraged for real-time 3D object detection in the vehicle’s surroundings. PV-RCNN combines voxel-based and point-based feature learning to enable accurate and efficient 3D object detection from raw point clouds. Initially, the voxelized point clouds were passed through a 3D sparse convolutional backbone to extract voxel-wise multi-scale features :
To reduce the computational cost while preserving representative scene information, PV-RCNN summarizes these voxel features into a small set of keypoints using a voxel set abstraction module. Given a set of keypoints , voxel-to-keypoint feature encoding aggregates voxel features within a local spatial region around each keypoint:
where denotes the neighborhood voxels around keypoints and are learned weights capturing contextual importance. Next, given a set of 3D object proposals, proposal-specific features were extracted through ROI-grid pooling by aggregating keypoint features into a fixed-size grid:
The pooled proposal features were then used for classification and box refinement, enhancing localization accuracy by combining coarse voxel features with fine-grained point features. This two-stage architecture of PV-RCNN thus integrates the efficiency of sparse voxel convolution with the flexibility of point-based feature abstraction, enabling real-time, high-precision 3D object detection suitable for autonomous driving applications, providing a real-time virtual representation of traffic scenarios.
The model outputs a set of 3D bounding boxes, i.e., , where each bounding box contains the following:
where denotes the center of the object; represents the width, height, and length; indicates the orientation angle; v and c are the estimated velocity and object class, e.g., car, pedestrian, cyclists, etc. The resulting list of 3D detections is then processed through multi-object tracking (MOT).
3.1.3. Stage 3: Multi-Stage Tracking
To maintain temporal consistency and robust object identities across sequences, a two-part tracking module was employed:
- Ego Vehicle Tracking (Localization): Ego vehicle localization was performed by employing the data from the GNSS-INS system, which was installed on the UC3M vehicle, and an Unscented Kalman filter (UKF) [] was used to incorporate vehicle motion equations and kinematics constraints for localization in global coordinates. This approach allows us to estimate the ego vehicle’s position precisely and smoothly, mitigating noise or transient errors from raw satellite measurements. Accurate ego localization is critical for aligning new 3D detections with historical data.The ego vehicle’s state vector at time-instant was estimated by the UKF and is defined as follows:where are the global positions in meters (east, north, height); is the vehicle’s global yaw (orientation) measured from the East axis (in radians); and are velocities along the horizontal east-north plane of the GPS frame, respectively. In most driving conditions remains close to zero because of constant elevation. However, retaining it in the state vector allows the tracking system to remain robust and generalizable.The process model assumes constant velocity and heading in the horizontal plane to predict future states at time-instant as follows:where is the time interval between updates, and are independent Gaussian noise terms modeling system uncertainty, i.e.,Please note that the sensitivity analysis of the UKF was performed following []. The process noise covariance matrix Q and the measurement noise covariance matrix R were configured using empirical noise characteristics derived from GPS and sensor data, which effectively capture the true uncertainty in the measurements and process dynamics. This data-driven approach involves analyzing the statistical distribution of sensor errors and noise during operation, which allows us to tailor the covariance matrices to reflect realistic conditions rather than rely on arbitrary or theoretical values. For example, the measurement noise covariance R was set by examining the variance in GPS position and heading measurements, while the process noise Q was designed to account for model uncertainties and expected dynamics variation. Such calibration ensures that the UKF maintains robust and consistent state estimation by appropriately balancing trust between predicted states and measured observations. This method provides practical parameterization of UKF.
- Multi-Object Tracking (MOT): This core component fuses real-time 3D object detections with ego pose filtering, for consistent tracking of each object. The MOT framework is structured into two hierarchical stages: (i) a high-level association and management stage and (ii) a low-level state estimation stage for each dynamic object in the environment.High-Level MOT: The high-level MOT architecture maintains a tracker list where denotes the set of visible trackers, and is the set of occluded trackers. Associations between detections and the tracker list were performed by leveraging the Hungarian algorithm [], which uses the L2 distance in position space as the association cost metric. Tracker for the i-th detected object is defined as a tuple:where is the state vector of the detected object, is the hit count indicating the number of successful associations, is the miss count tracking consecutive frames without associations, and is a unique identifier.At each frame update, the tracker’s status update and removal decisions were computed according to the and the predefined thresholds as follows:A tracker is considered visible, i.e., belonging to , if its hit count consistently exceeds the threshold and it has been matched with detections in recent frames. Conversely, (occluded) if the tracker has not been matched in recent frames, but its miss count remains below the removal threshold. The association process was carried out in two steps: first, 3D detections were matched to visible trackers , and then remaining unmatched detections were compared with occluded trackers . Any remaining unmatched detections were used to initialize new trackers, which were initially placed in (occluded) until their hit count surpassed the visible threshold. This multi-stage approach helps mitigate false positives and improves robustness against short-term occlusions.Low-Level MOT: The state vector for the i-th tracked object is defined as follows:where comprises 3D position (), orientation , bounding box dimensions () and velocity components () of the detected object, expressed in the local coordinate frame of the onboard LiDAR sensor.The state vector corresponding to each tracker (regardless of its list) was provided as an input to the UKF. The UKF recursively estimates and updates using the nonlinear process model:where denotes the system dynamics, represents process noise, and is the control input that encodes the change in EV’s positions. The UKF prediction step assumes that detected objects are static in the global frame, meaning that their positions do not change between frames. Instead, the relative positions of the detections are updated by incorporating the EV’s motion as a control input represented by (as shown in Equation (13)). Since the EV state is derived from GPS parameters, integrating ego motion into the UKF ensures accurate temporal alignment of the tracked object states while mitigating drift caused by the movement of the EV itself. Additionally, the UKF smooths the estimates of object sizes over time, helping reduce noise introduced by raw sensor measurements.Since both detections and tracked states are referenced in the local LiDAR frame, the UKF state variables represent relative positions and motions, not absolute global coordinates. Details of the local-to-global coordinate transformation are provided in subsequent paragraph.Local-to-Global Coordinate Transformation: Once the detections have been filtered and tracked using the MOT framework, homogeneous transformations are applied to convert the local detections into the global coordinate frame. This process involves transforming the detections from the LiDAR frame to the GPS frame and subsequently to the global frame provided by the ego vehicle’s localization system. This sequence follows the chain rule for coordinate transformations as follows:
The output of the tracking pipeline is a continuous and filtered list of 3D object detections , tracker list and the global position of EV as well as each detected object, i.e., . This list is made available to the entire embedded real-time software architecture mounted on the experimental vehicle for control or navigation purposes, which allows the model to generate safe trajectories with no collision risk. The entire perception layer is based on the Robot Operating System (ROS), a middleware specialized in robotic and multi-process automation applications like this one, for more advanced and safer autonomous driving functionalities.
3.2. Communication Layer
Communication between the ego vehicle’s main onboard computer, responsible for transmitting dynamic obstacles, and the server that runs the simulation and renders these obstacles was performed over an Internet connection.
The system requires a stable connection with minimal latency. However, since both machines are not on the same local network, this condition is not always guaranteed. To address this, an overlay VPN solution, NetBird, was employed []. NetBird establishes a peer-to-peer connection between the two machines using WireGuard as the underlying communication protocol. This enables direct, low-latency communication between the endpoints. Once the peer-to-peer connection is established, the ego vehicle’s main computer transmits, at 10 Hz, tracker list , the list of detected objects , and . These messages were transmitted to the simulation server using the User Datagram Protocol (UDP), formatted as JSON. To generate this, a lightweight node was used to construct the communication payload based on the object detections , tracker list and the global states , which originally reside within the ROS framework. Upon receiving the message at the server side, a lightweight ROS node was used to reconstruct the original ROS message from the JSON-formatted data. The reconstructed message was then published within the digital twin layer of the simulator via the CARLA-ROS bridge.
Our system includes time synchronization between the Car, which acts as a time server for sensors, and the server, which hosts the digital twin. Both systems use Timebeat for precise clock synchronization, integrating GPS and NTP. The car runs Timebeat directly connected to the vehicle’s GPS receiver. The GPS provides a raw time signal (Stratum-0 reference), and Timebeat synchronizes the system clock via NTP corrections to maintain precise, traceable timing. The corrected time is shared with all onboard sensors, making the car act as a Stratum-1 time server for sensor fusion and message time stamping.
On the server side, the Raspberry Pi was configured as a local time server. It also runs Timebeat and synchronizes its clock with its own GPS module, thereby functioning as a Stratum-1 server. The digital twin simulation host synchronizes with this Raspberry Pi as a Stratum-2 client, ensuring that both vehicle and server maintain sub-millisecond temporal alignment for accurate synchronization of detections and virtual entities.
Security and Privacy Considerations
While data privacy and cybersecurity are critical components of V2X and ITS, the current system transmits only the global object positions and object class information. No personal information, such as vehicle license plates, facial features, or other sensitive attributes are collected or shared, which significantly minimizes the privacy risks in the context of continuous streaming to cloud. However, continuous Vehicle-to-Cloud (V2C) communication still encounter security challenges, including data interception, unauthorized access, and risks of data manipulation, and service disruption in real-time. Addressing these challenges requires robust encryption, strong authentication protocols, secure key management, intrusion detection system, and audit logging to ensure data integrity and confidentiality during continuous data transmissions.
At the current stage, our system requires relatively modest security measures due to the absence personal data information. Nevertheless, for future scalability and alignment with the best practices, additional cybersecurity and privacy-preserving features will be essential. These include implementing end-to-end data encryption, advanced authentication protocols, ethical data handling policies, and continuous security monitoring specifically tailored to persistent V2C streaming environments.
3.3. Digital Twin Layer
This layer is responsible for creating a realistic virtual representation of the real-world environment and providing real-time simulation by spawning the dynamic object’s information received from the perception layer via the communication layer. The process is divided into three stages: (i) map creation, (ii) map integration with CARLA, and (iii) real-time object spawning and management. Algorithm 1 presents the pseudo-code highlighting the spawning of real-time detected objects within the digital twin platform.
| Algorithm 1 Spawning real-time detected objects into the digital twin of CARLA. |
|
3.3.1. Map Creation from OpenStreetMap
The initial map was generated using Blender combined with the “BlenderOSM” tool, which allows selecting a ROI and importing building geometries based on OpenStreetMap (OSM) data. This step produces a rough 3D structure of buildings and terrain. However, OSM’s limitations often result in incomplete or low-detail information for road, traffic signs, and lanes, yielding only an approximate environmental layout.
3.3.2. Road and Traffic Infrastructure Modeling
The preliminary map was imported into RoadRunner, where realistic roads, sidewalks, and traffic infrastructure are created with precise spatial and semantic details. This step defines the road network and waypoints used by vehicles for navigation and path planning. The output was then imported into the CARLA simulator, which generates drivable routes based on the RoadRunner waypoints.
Additional post-processing was applied in CARLA to enhance environmental realism and fidelity. For accurate placement of traffic signals and lights, the perception layer was run offline on recorded sensor sequences to identify their real-world positions, which were then replicated in the digital twin.
3.3.3. Real-Time Object Spawning and Management
With the digital map established, the simulation proceeds to spawn and manage dynamic real-time objects based on input received from the perception layer. At each time instant, the perception module provides the list of detected objects including vehicles, pedestrians, and cyclists, along with their global positions , orientations, class types, and tracking IDs. All global coordinates were transformed into CARLA’s coordinate system by a transformation function :
Objects belonging to the classes pedestrians and cyclists were spawned directly at their transformed positions:
For vehicles, the spawning criteria differentiated moving vehicles from parked ones. To simulate traffic correctly, only moving vehicles were spawned. A detected vehicle is spawned if its CARLA position lies sufficiently close to the road network, defined by the set of waypoints W:
where is the minimum Euclidean distance to the closest waypoint. This threshold compensates for sensor noise and mapping inaccuracies by snapping vehicles to the nearest drivable waypoint. If a new object is detected, it is spawned in the simulation and its reference is stored. For already spawned objects, their transformations were updated each time-instant with CARLA actor transformation APIs. Vehicles were re-aligned to the closest waypoint, but no strict distance threshold was enforced during updates. Vehicle velocity was not used as a spawning filter, which allows stationary vehicles (e.g., those stopped at traffic lights) to correctly appear in the digital twin, maintaining realistic traffic conditions. To optimize computational load, objects undetected for 5 consecutive time instants were deleted from the simulation:
where is an indicator function. This update routine executes every time-instant, balancing simulation fidelity with computational efficiency.
4. Experimental Results and Discussion
This section presents the experimental setup, including the test environment, vehicle hardware, the obtained results corresponding to the perception, communication and digital twin layers, followed by detailed discussion of both quantitative and qualitative results. While the perception and communication layers leverage SOTA models for object detection, tracking and transmitting ROS-based UDP messages, the real contribution of this work lies in the system integration and the validation of these SOTA models on a real-world platform by including necessary amendments. The proposed framework presents a unified, edge-to-cloud pipeline that seamlessly bridges onboard vehicle perception, low-latency communication, and a cloud-based digital twin. Therefore, the originality of our work lies in the design, implementation, and validation of a cross-domain integration strategy that transforms existing perception and networking modules into a cohesive real-time digital twin applications for smart city transportation systems. The experiments were conducted using the autonomous research platform at the Universidad Carlos III de Madrid (UC3M), Spain.
4.1. Experimental Area
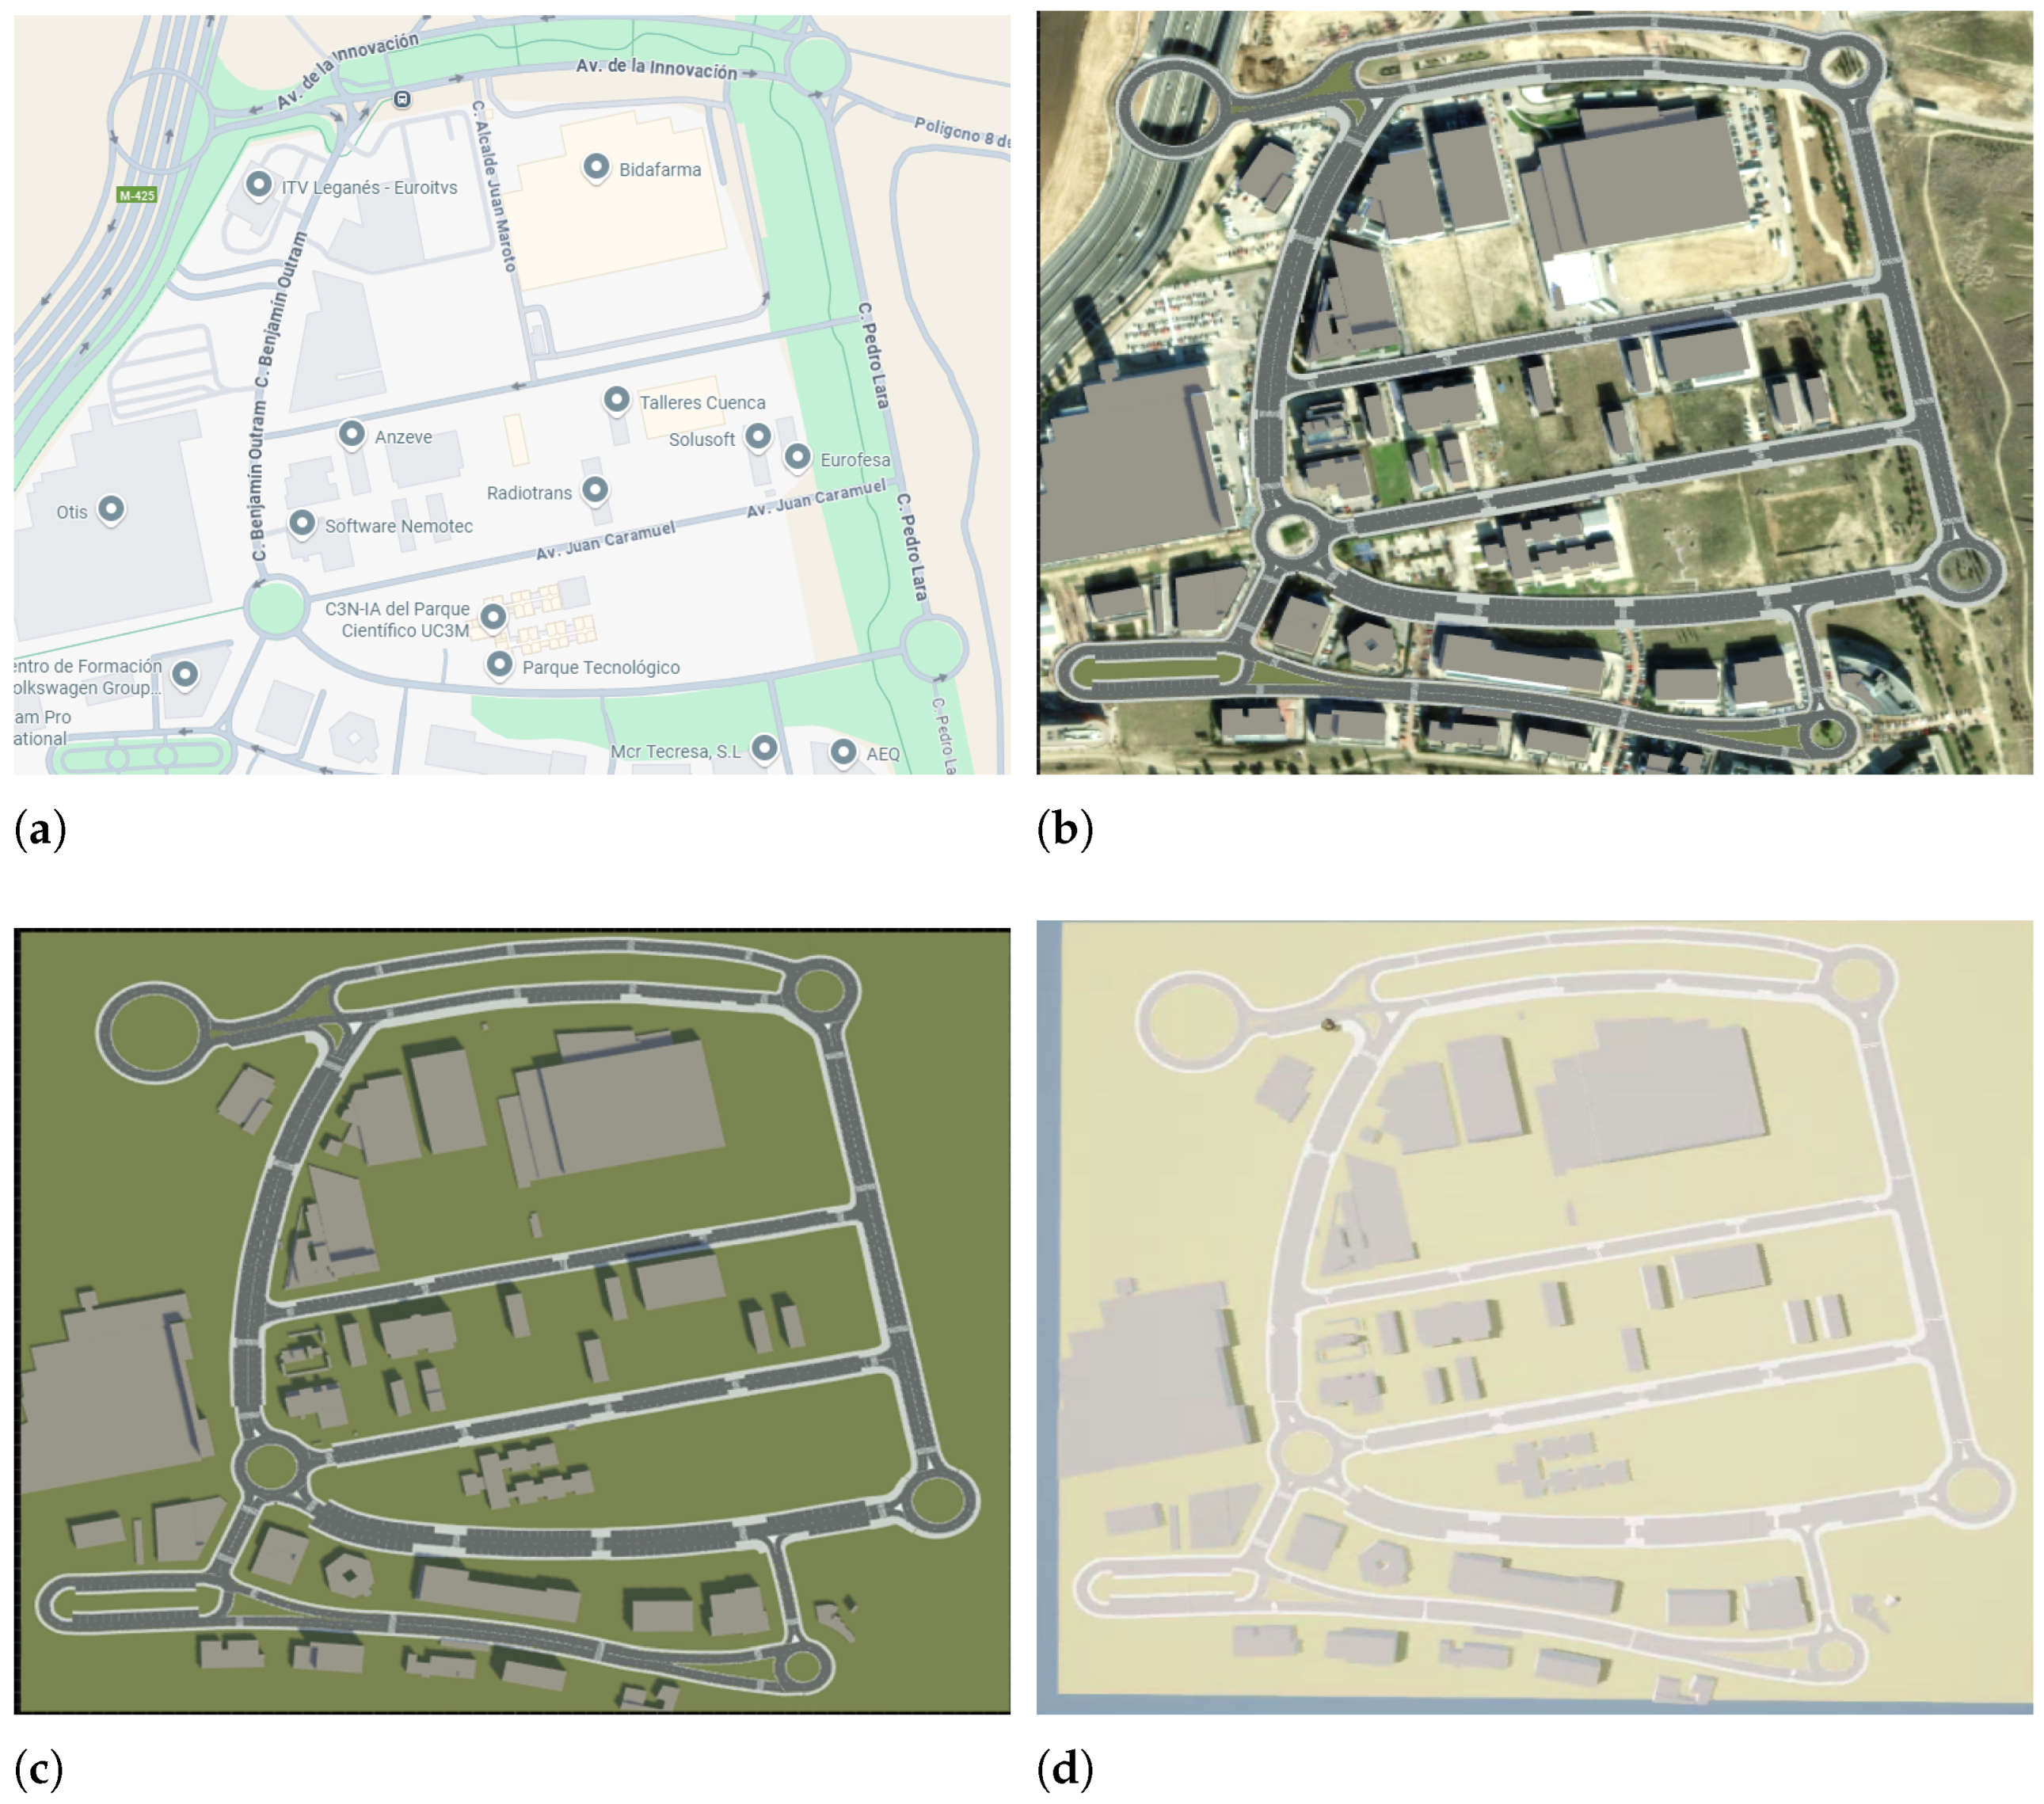
The experiments are conducted in the vicinity of the Technological Park of the UC3M. The experimental environment is reconstructed as a high-fidelity virtual map, as described in the Section 3.3. Figure 2 illustrates the different stages of the creation of the virtual map, beginning with the georeferenced imagery from the Google map and ArcGIS satellite, shown in Figure 2a and Figure 2b, respectively. This is followed by the corresponding virtual representation in RoadRunner and CARLA (digital twin platform), shown in Figure 2c and Figure 2d, respectively.
Figure 2.
Experimental area: Real-world representation from maps (a,b) and its virtual representation (c,d) used in simulations. (a) Google Maps. (b) ArcGIS satellite map. (c) RoadRunner map. (d) Virtual map in CARLA.
To visualize the spatial accuracy of the virtual representation of the map, Figure 3 compares zoomed-in views of street segments from ArcGIS satellite maps with those in CARLA, showing strong geometric alignment and textural similarity. This fidelity ensures that the autonomous perception and planning algorithms are tested under realistic virtual conditions.
Figure 3.
Comparison of selected streets in the experimental area between ArcGIS satellite imagery and CARLA virtual maps. (a) ArcGIS satellite imagery. (b) Virtual map in CARLA. (c) ArcGIS satellite imagery. (d) Virtual map in CARLA.
4.2. Experimental Vehicle Hardware
The UC3M experimental vehicle (shown in Figure 4) is equipped with a Velodyne LiDAR, pinhole and fisheye RGB cameras, and GNSS for global localization. The onboard computing system consists of a custom-built workstation with an NVIDIA RTX 4070 GPU with 12 GB VRAM, dedicated to deep learning-based models to make inference, and an Intel Core i9-14900K CPU at 6.0 GHz with 32 GB RAM for ROS-based inter-process communication.This hardware enables high-throughput, real-time object detection and tracking in urban environments.
Figure 4.
UC3M experimental vehicle equipped with multimodal sensor suite. (a) Experimental vehicle. (b) vehicle trunk. (c) sensor suite.
4.2.1. Perception Layer
The 3D detection model from the perception layer was trained on the PandaSet dataset [], a comprehensive commercial dataset specifically designed for 3D perception tasks in autonomous driving. PandaSet comprises 103 driving sequences, each lasting 8 s, recorded at a frequency of 10 Hz and ∼82,000 frames. It offers extensive annotations, including 3D bounding boxes for 28 object classes and semantic segmentation labels for 37 distinct classes. The data modalities include LiDAR point clouds acquired from both a 360° mechanical spinning LiDAR and a forward-facing long-range LiDAR are synchronized with data from six RGB cameras mounted on the vehicle. For evaluation and benchmarking purposes, the KITTI dataset was employed, which provides a standardized set of train/validation splits widely used in 3D detection research.
Preprocessing involved transforming all PandaSet point clouds and 3D box annotations from global coordinates to the vehicle-centric “ego” coordinate frame using calibration parameters provided in the PandaSet development kit. The LiDAR point cloud data contain 3D spatial coordinates, intensity values, timestamps, and sensor identifiers. The ground truth labels include object classes along with size parameters (), position (), and yaw angle for orientation (), corresponding to each annotated object. Point clouds are voxelized at resolution m, m, m).
The 3D object detection model (described in Section 3.1.2) was trained for 80 epochs on an NVIDIA RTX 4090 GPU with 24 GB VRAM, with a batch size of 4, using the AdamW optimizer and at a learning rate of 0.001. The overall loss combined regression objectives (for box localization and size) with classification cross-entropy losses (for object type category and confidence scores). All hyperparameters were empirically selected to balance accuracy with convergence stability and resource efficiency. Performance was evaluated using the mean Average Precision at 40 discrete recall levels (mAP@40) calculated using the following metric:
where is the interpolated precision values from class at recall level r. Intersection over Union (IoU) thresholds of were chosen for {car, pedestrian, cyclists}, respectively. Difficulty stratification (easy, moderate, hard) allowed for detailed benchmarking across diverse operational scenarios.
For transferability analysis, the model weights were validated on the KITTI dataset. This ensures the generalization performance of the perception module beyond the source training distribution, which is an important aspect for real-world robotic deployment. The final trained weights are subsequently deployed for real-time inference on the experimental vehicle, enabling end-to-end online perception in typical urban scenarios.
A quantitative comparison of the 3D detection model for cars, pedestrians, and cyclists is summarized in Table 3. The results demonstrates that our perception model achieves high accuracy relative to recent state-of-the-art (SOTA) methods across all categories. Additionally, Table 4 presents a comparison of our model with recent SOTA methods independent of object class. Our model consistently achieves better performance across all difficulty levels, which demonstrates its effectiveness in various traffic scenarios. This validates the advancement of our perception approach relative to current leading techniques.
Table 3.
Quantitative comparison with SOTA methods using mAP@40(%) performance metric with respect to the various classes.
Table 4.
Quantitative comparison with recent SOTA methods showing accuracy measurement, independent of object classes, and is evaluated at easy, moderate, and hard difficulty levels.
Qualitative results in Figure 5 show frames corresponding to the real-time multi-object detection and tracking module of the perception layer. Camera images are provided only to enhance the visibility of the results along with LiDAR point clouds. The 3D bounding boxes for each detected and tracked object (in LiDAR point clouds) are represented with different colors, indicating the successful assignment of real-time tracking IDs and highlighting robust perception and tracking under operational conditions.
Figure 5.
Example of the real-time multi-object detection and tracking results from the perception layer with unique IDs () for each tracked object.
Additional Results: The Canadian Adverse Driving Conditions Dataset (CADC) [] is employed to evaluate the performance of the perception model under harsh weather conditions. This publicly available dataset was collected during active snowfall in a Canadian urban environment. As the perception model relies primarily on LiDAR data, which can be affected by limited visibility and adverse illumination; therefore, evaluating under such conditions provides insight into performance degradation in challenging environments. The inference was performed across the entire dataset, considering detections with confidence scores . Object-level matches between predictions and ground truth were determined using an IoU threshold of .
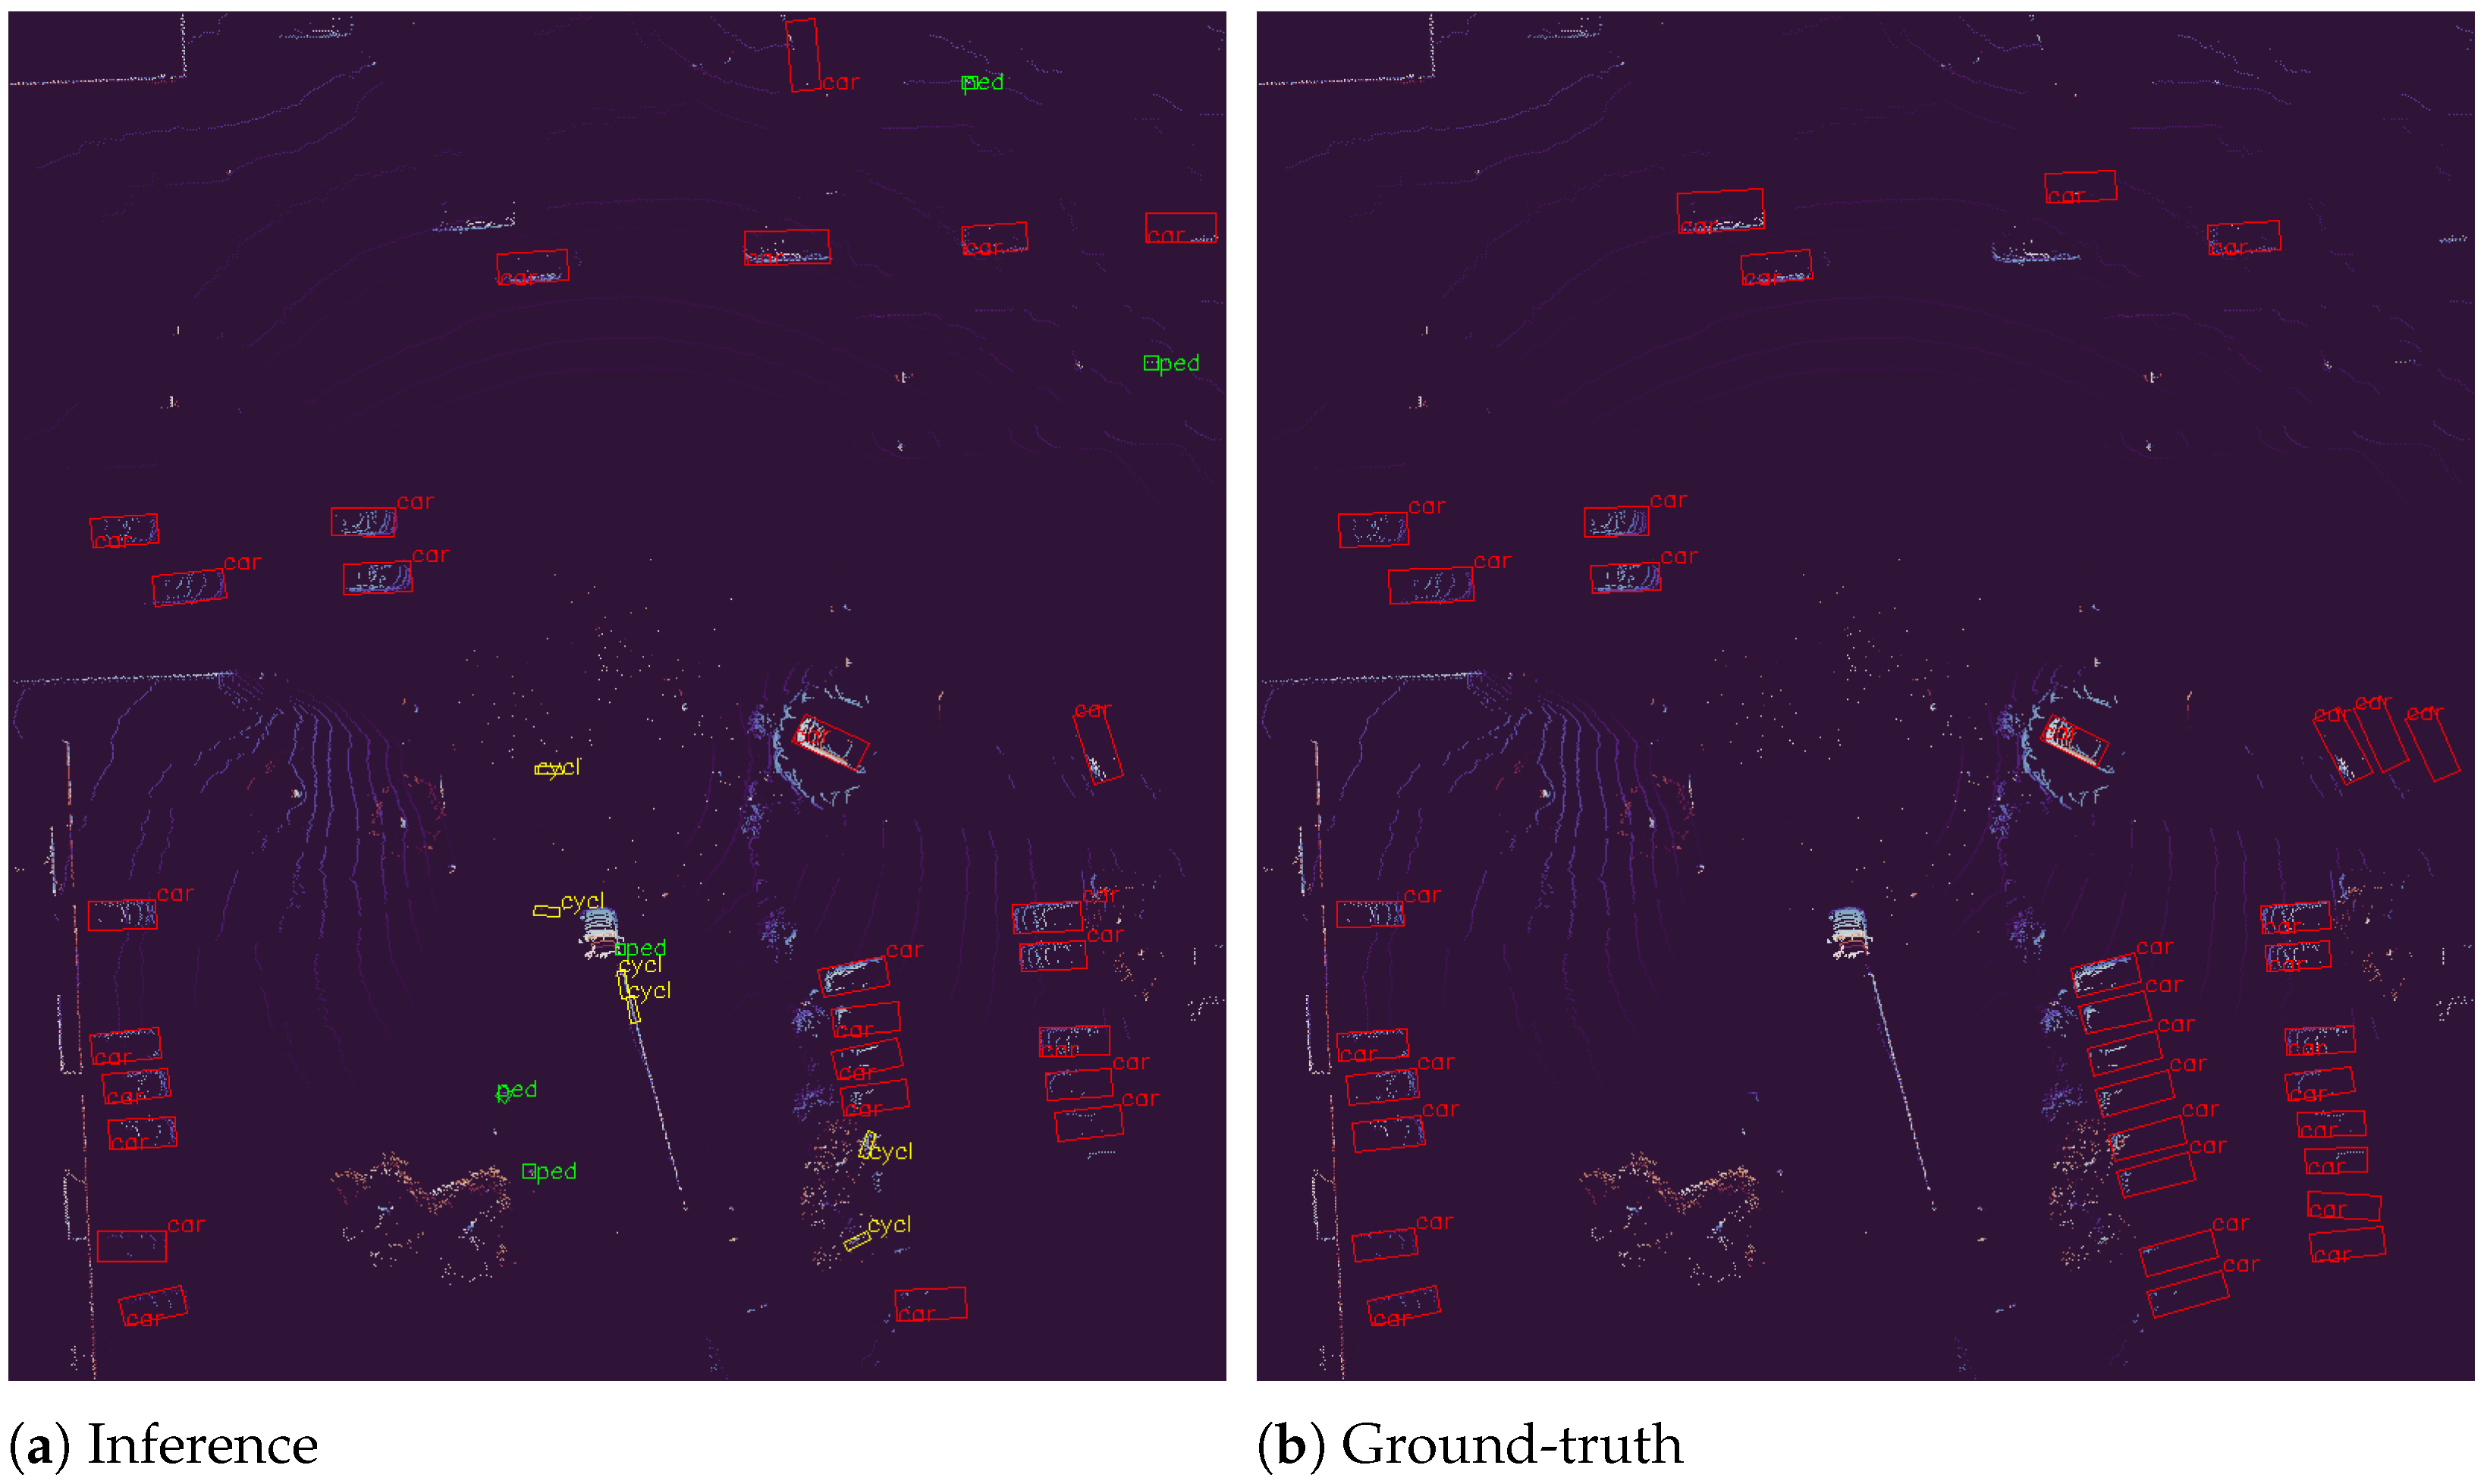
Quantitative results in Table 5 show that, while snow accumulation reduces overall detection accuracy compared to ideal weather tests, the model retains reliable performance for car detection with only marginal degradation. Pedestrian detection, however, is more sensitive to sparse point clouds and partial occlusions due to snowfall. The qualitative results in Figure 6 illustrate the model’s inference and the corresponding ground-truth annotations under these conditions, confirming that the perception system remains functional despite reduced LiDAR density. It is important to note that the LiDAR used for evaluation is not the same as the one used during training. In training, a Pandar64 LiDAR with 64 layers was employed, whereas the evaluation uses a Velodyne VLP-32C, which provides only half the point-cloud density, demonstrating the model’s generalization to different sensor configurations.
Table 5.
Quantitative results for the perception model evaluated on the Canadian Adverse Driving Conditions Dataset []. Results show precision, recall, and F1-score measurements in low-visibility conditions.
Figure 6.
Qualitative results of the 3D object detection on the Canadian Adverse Driving Conditions Dataset []: (a) inference results of the perception model, (b) corresponding ground-truth annotations for comparison.
4.2.2. Communication Layer
The communication layer was evaluated using the dataset of 1508 sequential frames recorded by driving the vehicle in the experimental area. These frames represent realistic driving scenarios and were used to analyze the bandwidth requirements, latency, and statistical behavior of data exchange between the real vehicle (client) and the digital twin (server).
Message Size Vs. Number of Detections: Since the perception layer continuously detects and tracks multi-objects in real time, the number of detected objects and consequently the size of the transmitted messages varies from frame-to-frame. Figure 7 presents the normalized frequency distribution of the messages in terms of the number of detections they comprised. The plots indicate that the majority of messages encapsulated information about at least three detected objects. However, high-complexity scenes result in messages that contain upto 46 objects. The y-axis percentage represents the average normalized frequency of messages that contain a given number of detections.
Figure 7.
Normalized frequency distribution of the number of detections per transmitted message.
Figure 8 illustrates the relationship between the size of the transmitted message and the number of detections contained within it. As expected, a near-perfect linear correlation is observed, which can be expressed mathematically as follows:
where is the message size in bytes, and is the number of detections in that message. This equation allows for an accurate estimation of message size corresponding to transmitting a specific number of detections , which is critical for bandwidth planning and allocation of network resources. To ensure a fair statistical representation, the plotted trend is derived from the mean message size calculated from all messages containing the same number of detections.
Figure 8.
Relationship between the transmitted message size and number of detections contained within them.
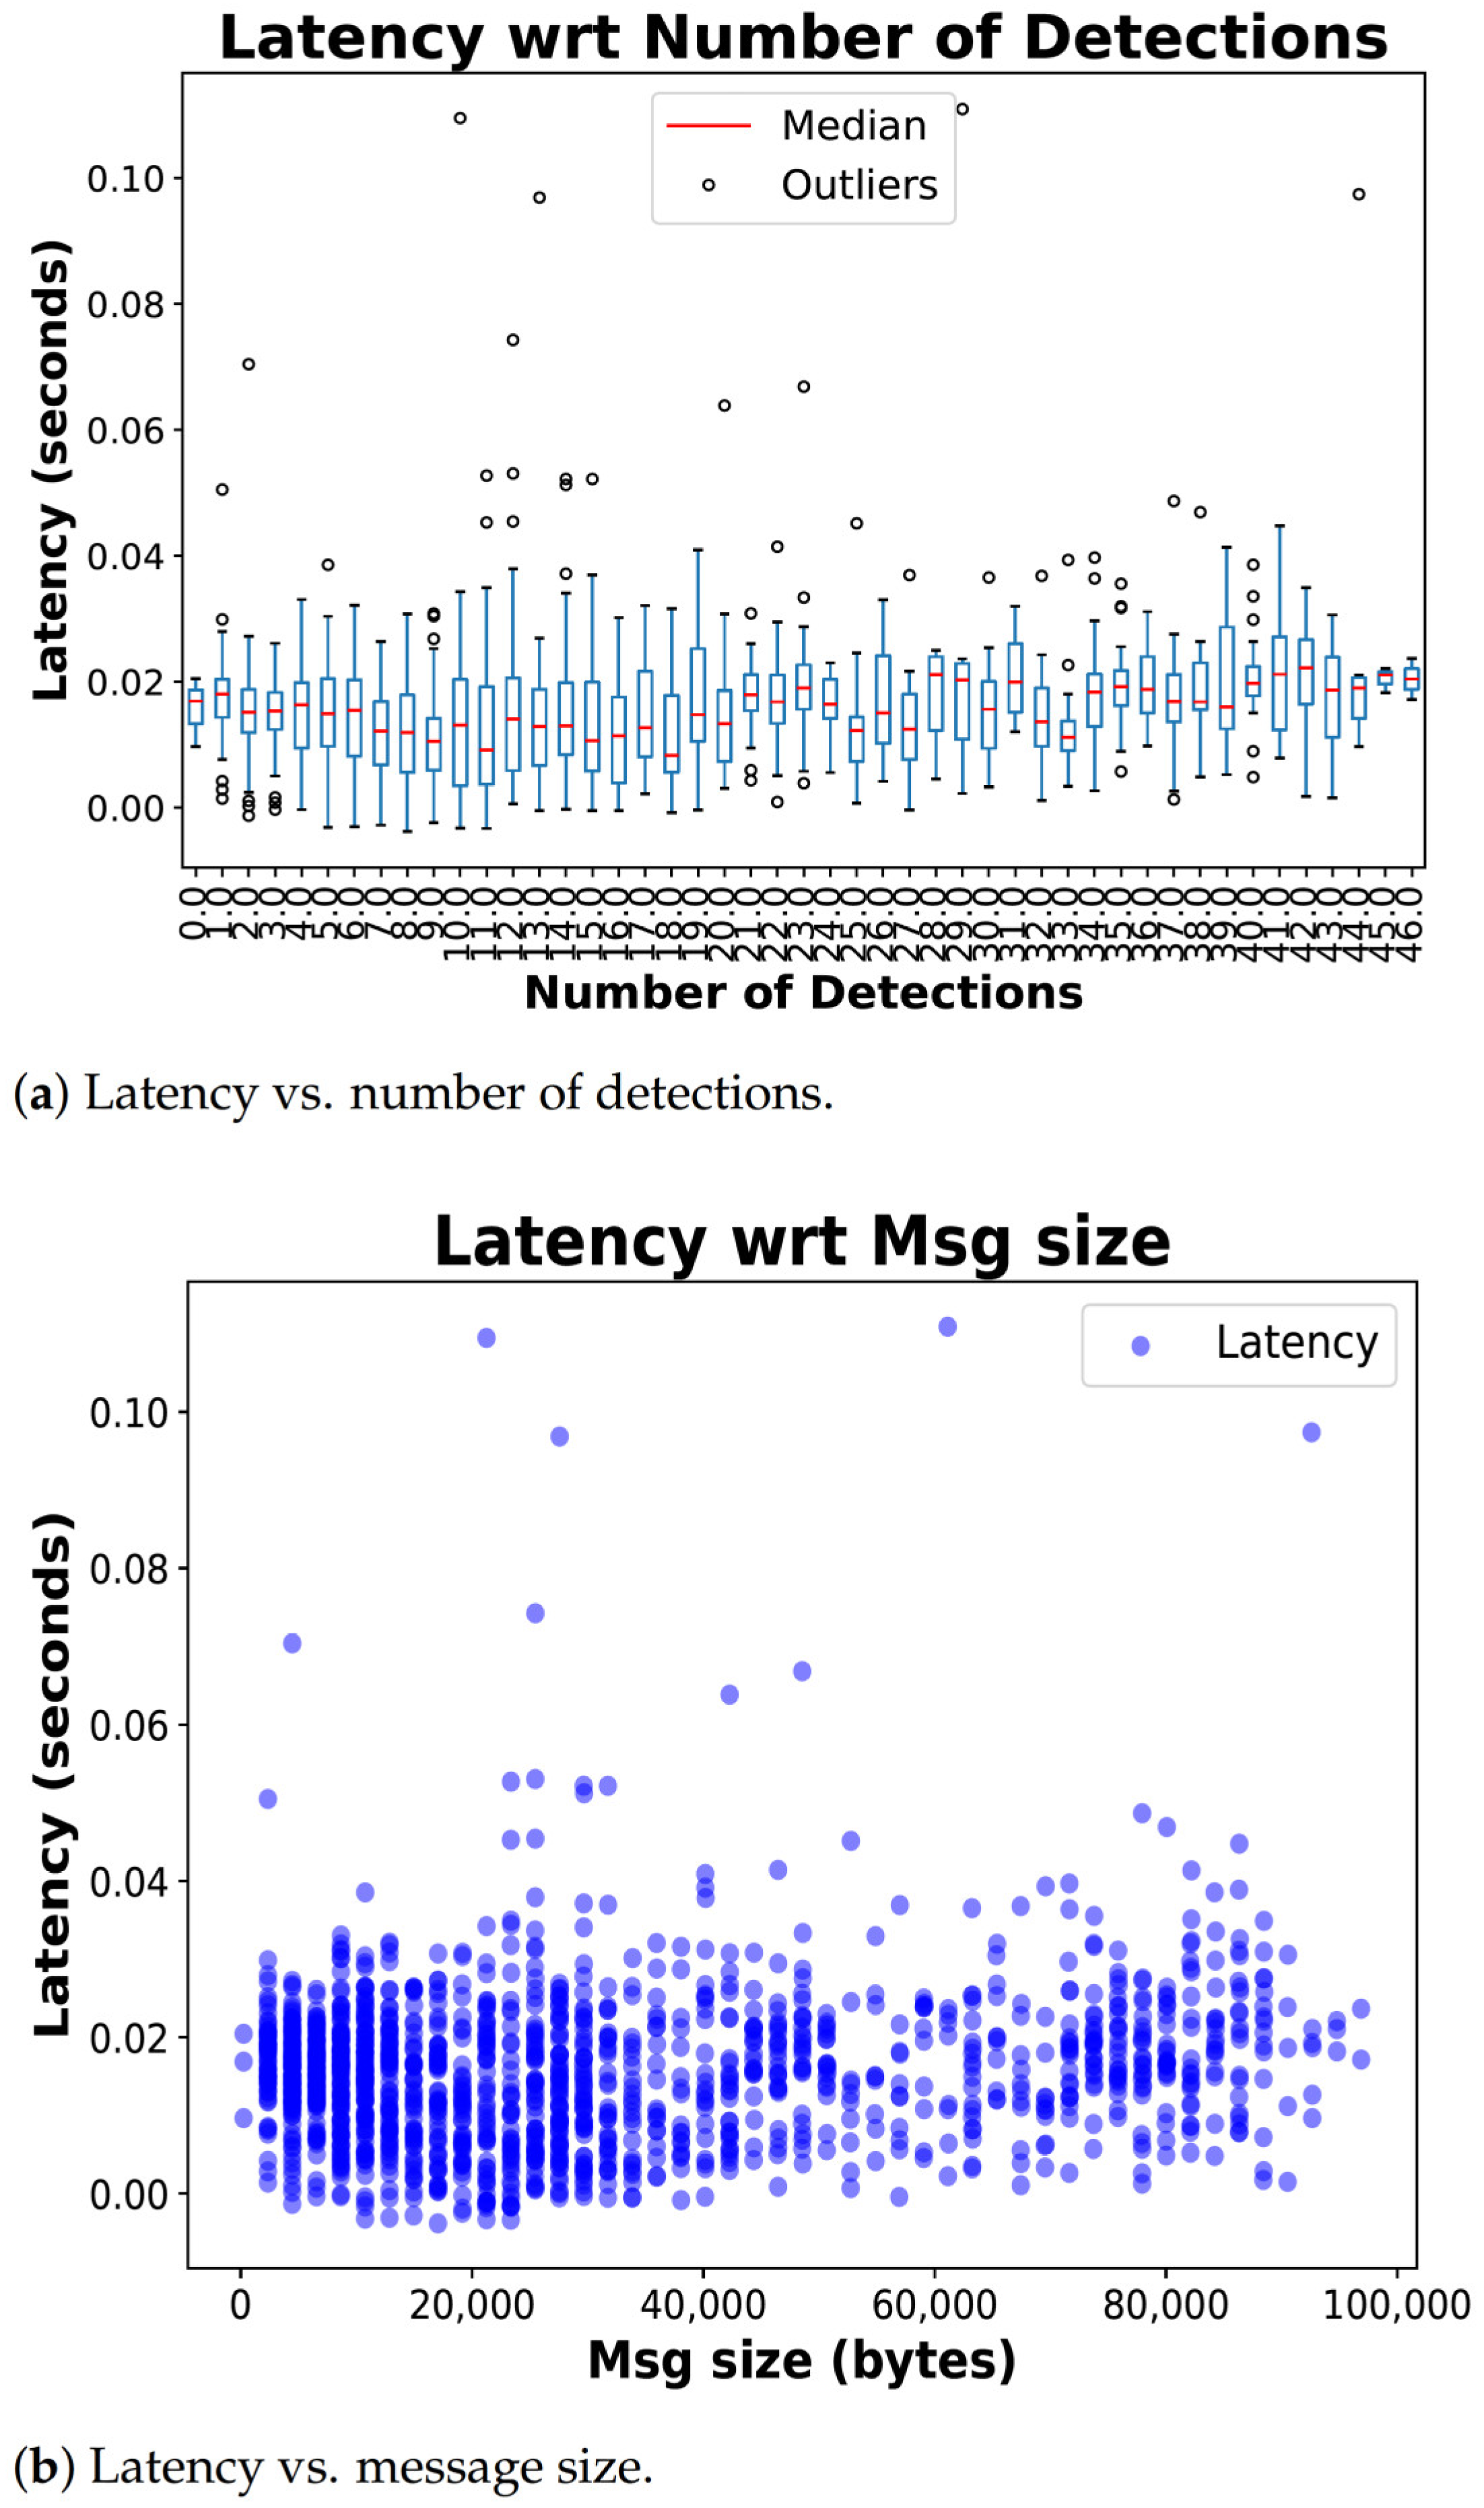
Latency Analysis: Latency performance was evaluated with respect to both the number of detections and the total size of the transmitted message. Figure 9a presents the average end-to-end latency for varying numbers of detections transmitted from the vehicle to the server (DT). Even with large variations in the number of encoded detections, the system consistently maintained low latency, with a maximum observed value of 0.02 s.
Figure 9.
Latency behavior as a function of (a) number of detections and (b) message size.
Figure 9b shows the latency as a function of message size, considering the time taken for message encoding, network transmission, and decoding at the receiving end. The trend closely mirrors that observed in Figure 9a, confirming the stability of the communication system under varying load conditions. Such consistently low latency is essential for maintaining synchronized real-time behavior between the physical vehicle and digital twin.
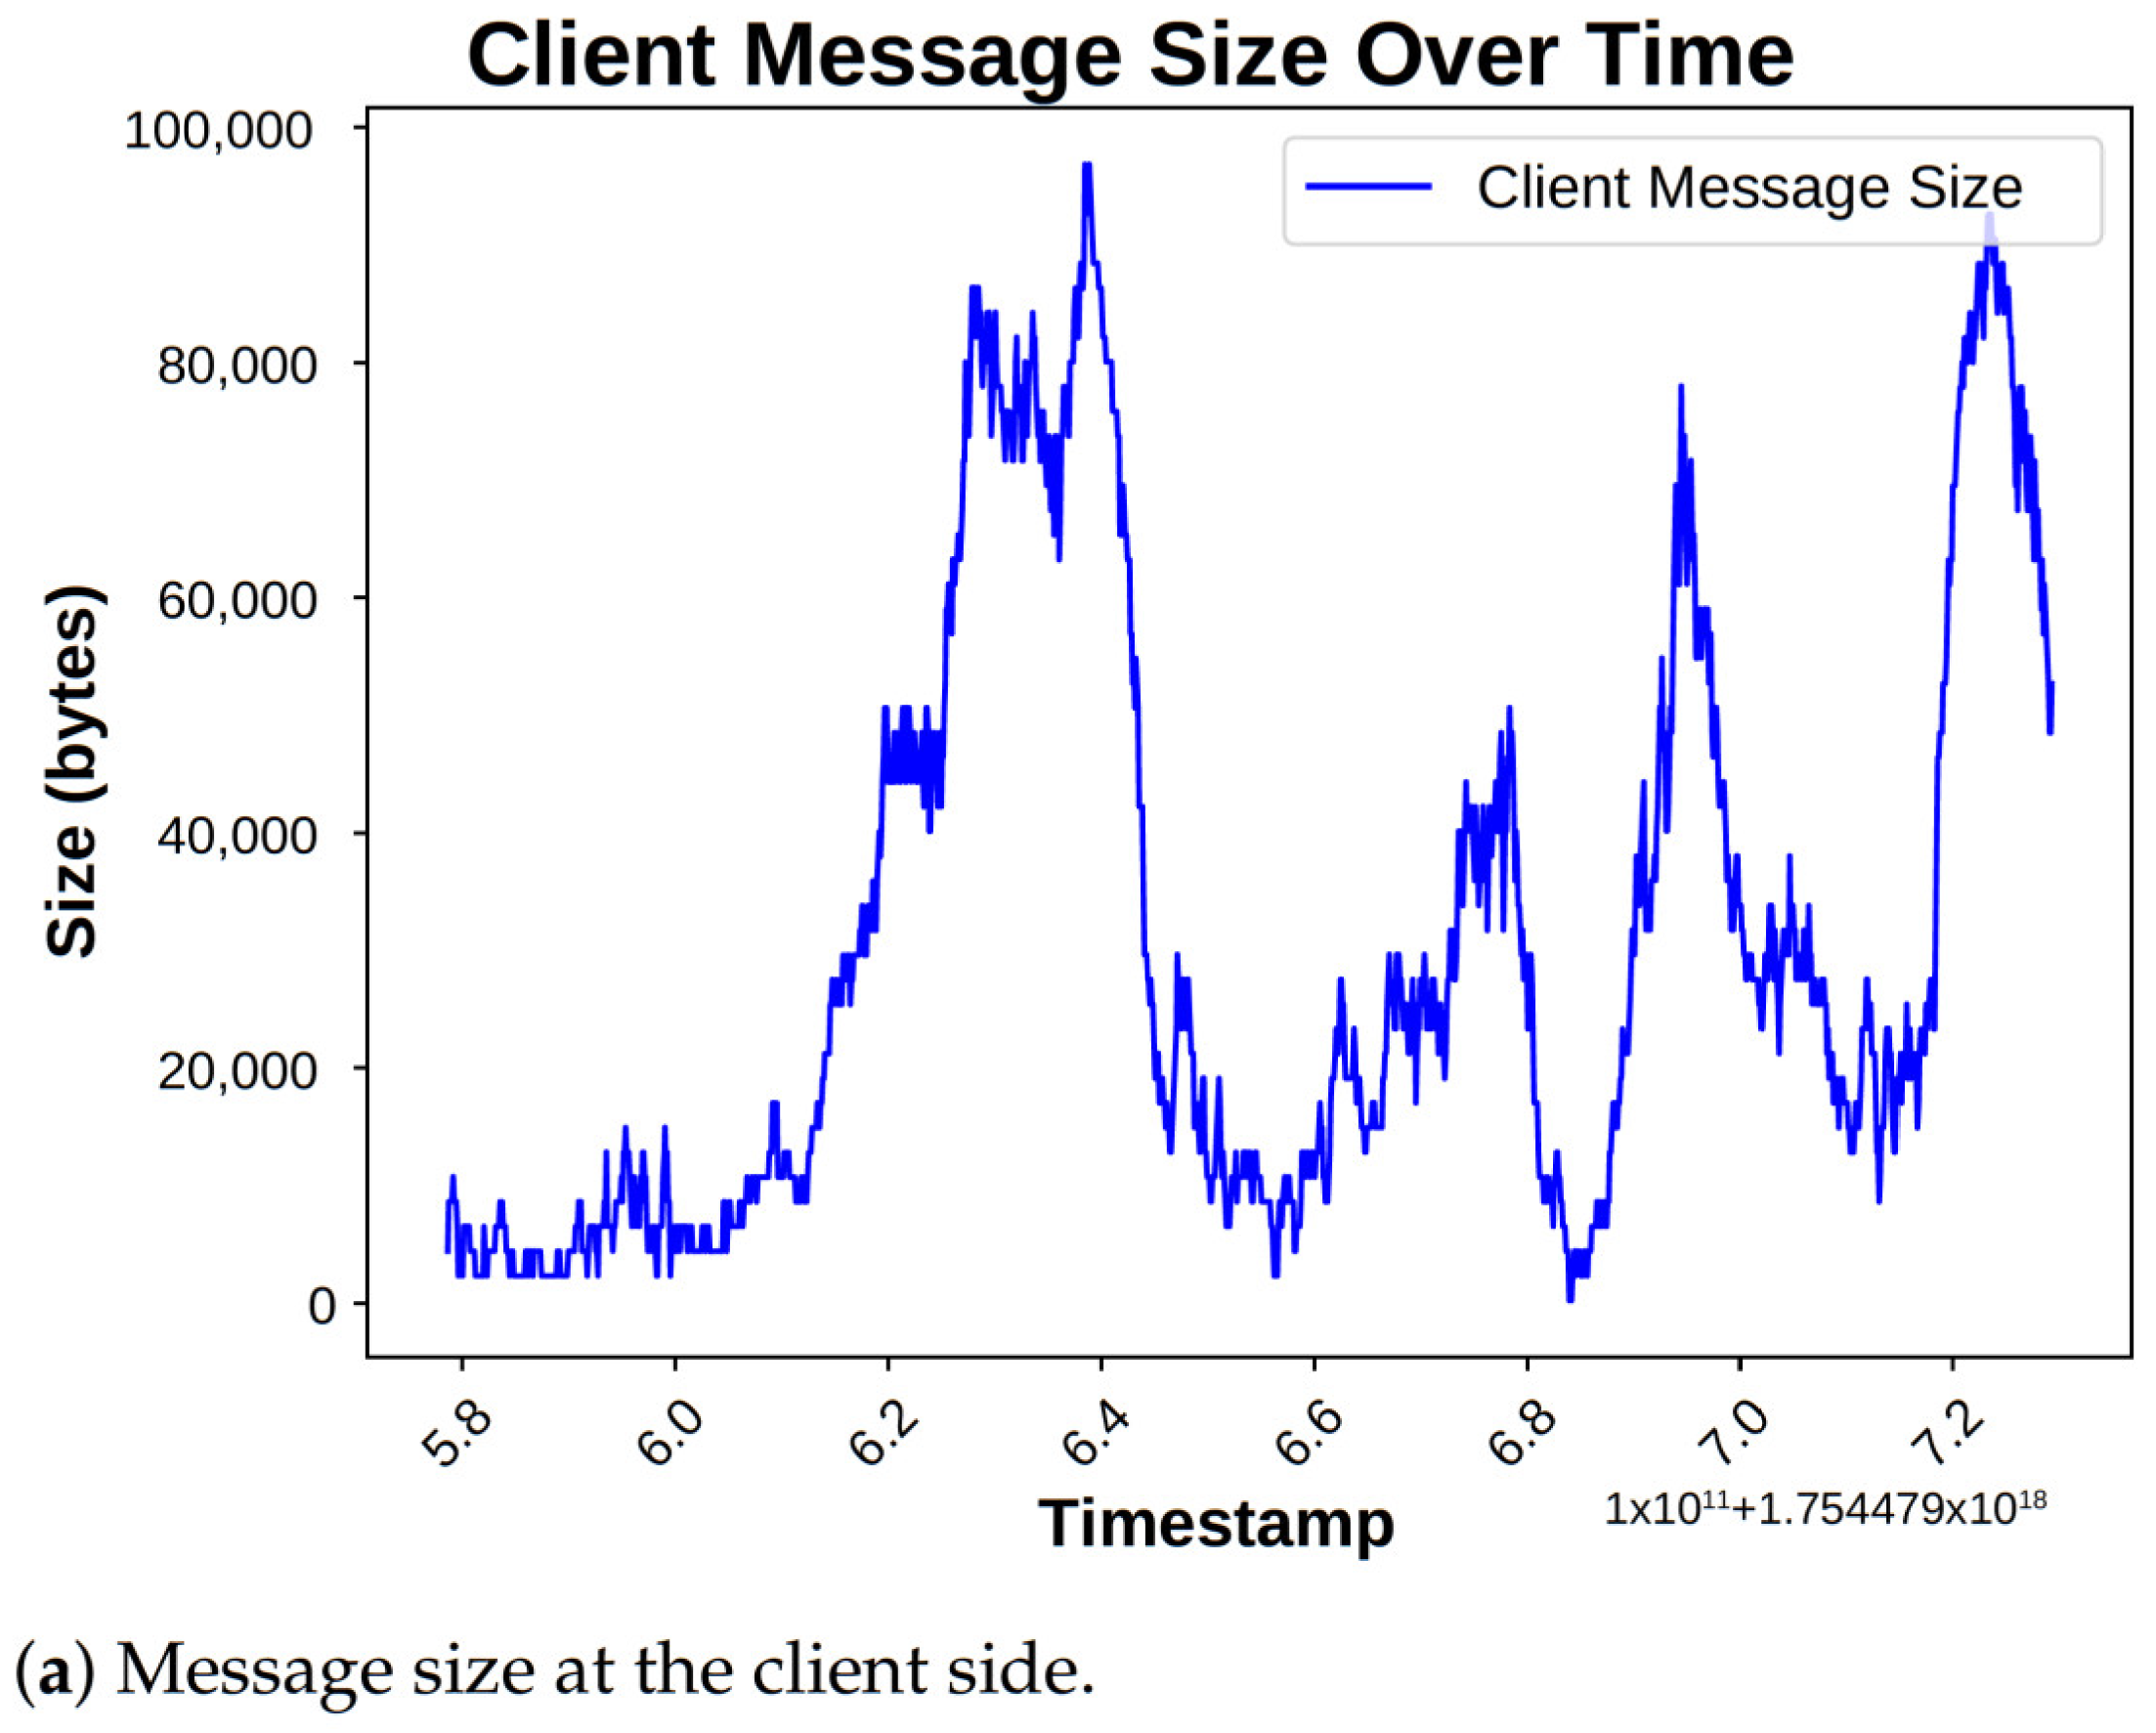
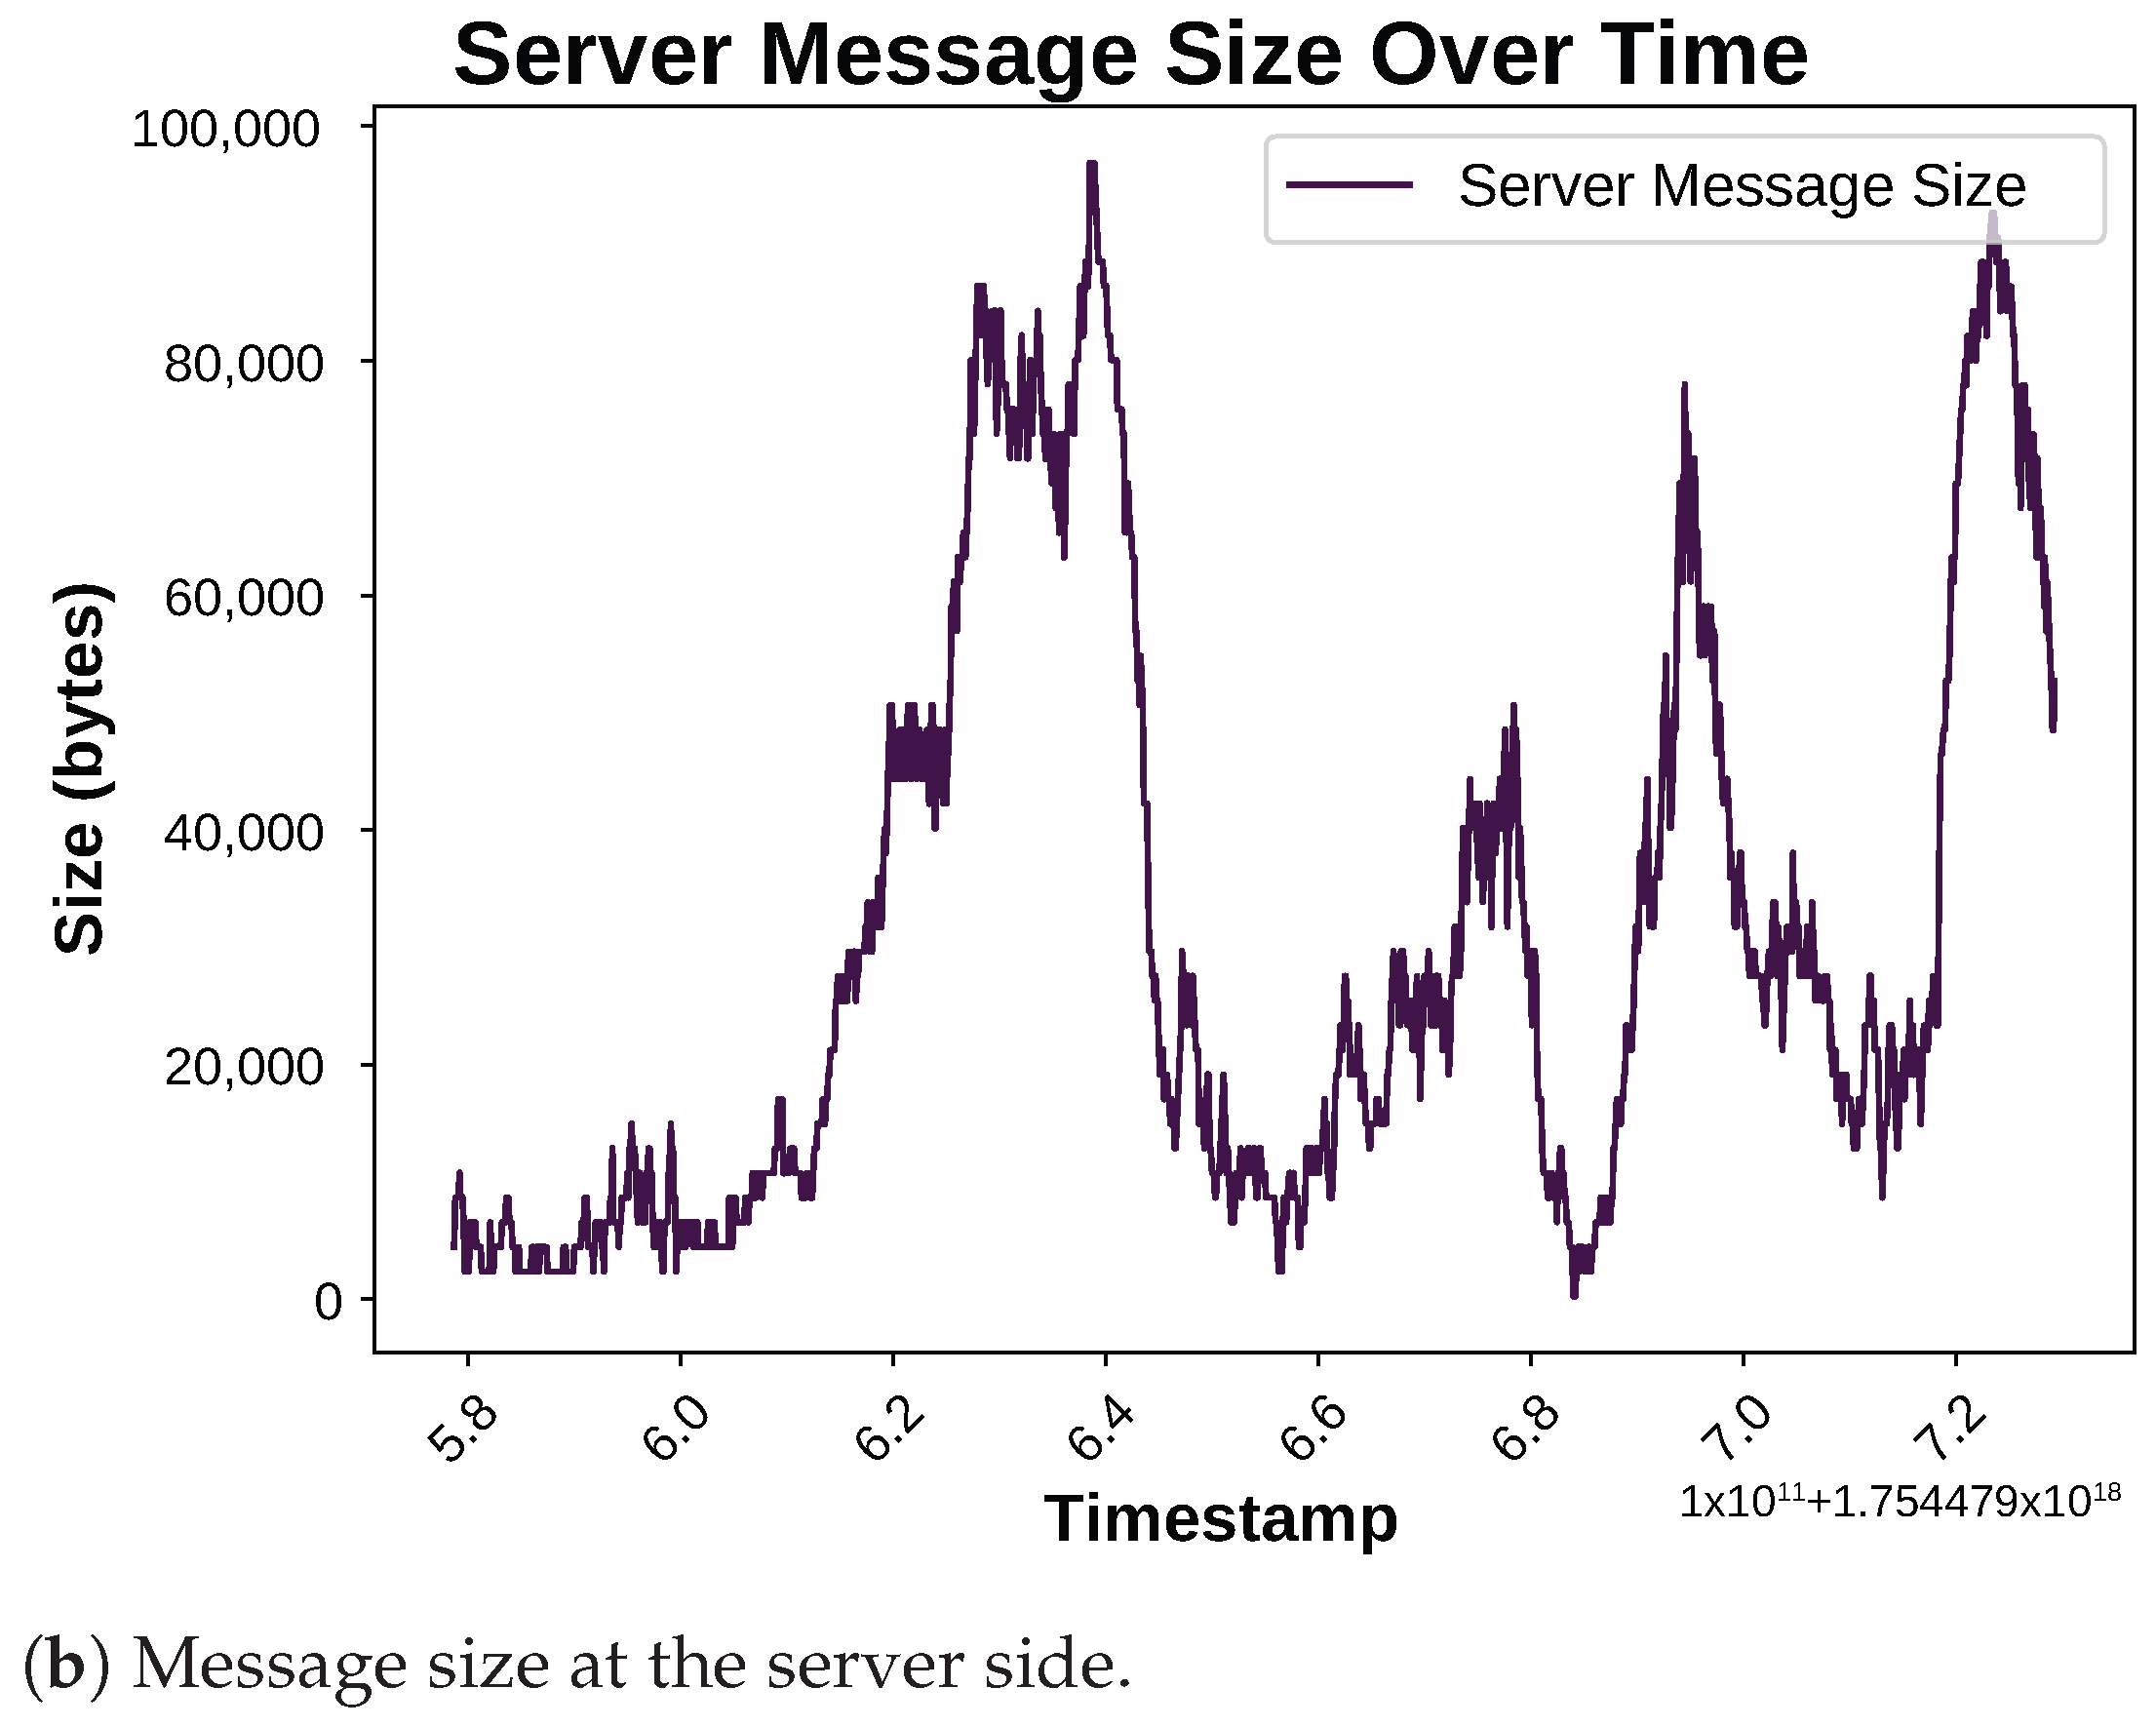
Message Size Distribution at Client and Server: To further assess the reliability of the communication layer, message size trends over time were analyzed for both the client (vehicle) and the server (digital twin). Figure 10a,b show that the difference between the transmitted and received message sizes is negligible, which indicates that the adopted communication protocol ensures efficient and lossless data transfer.

Figure 10.
Variation of message size over time at (a) the client side, i.e., vehicle, and (b) at the server side, i.e., digital twin.
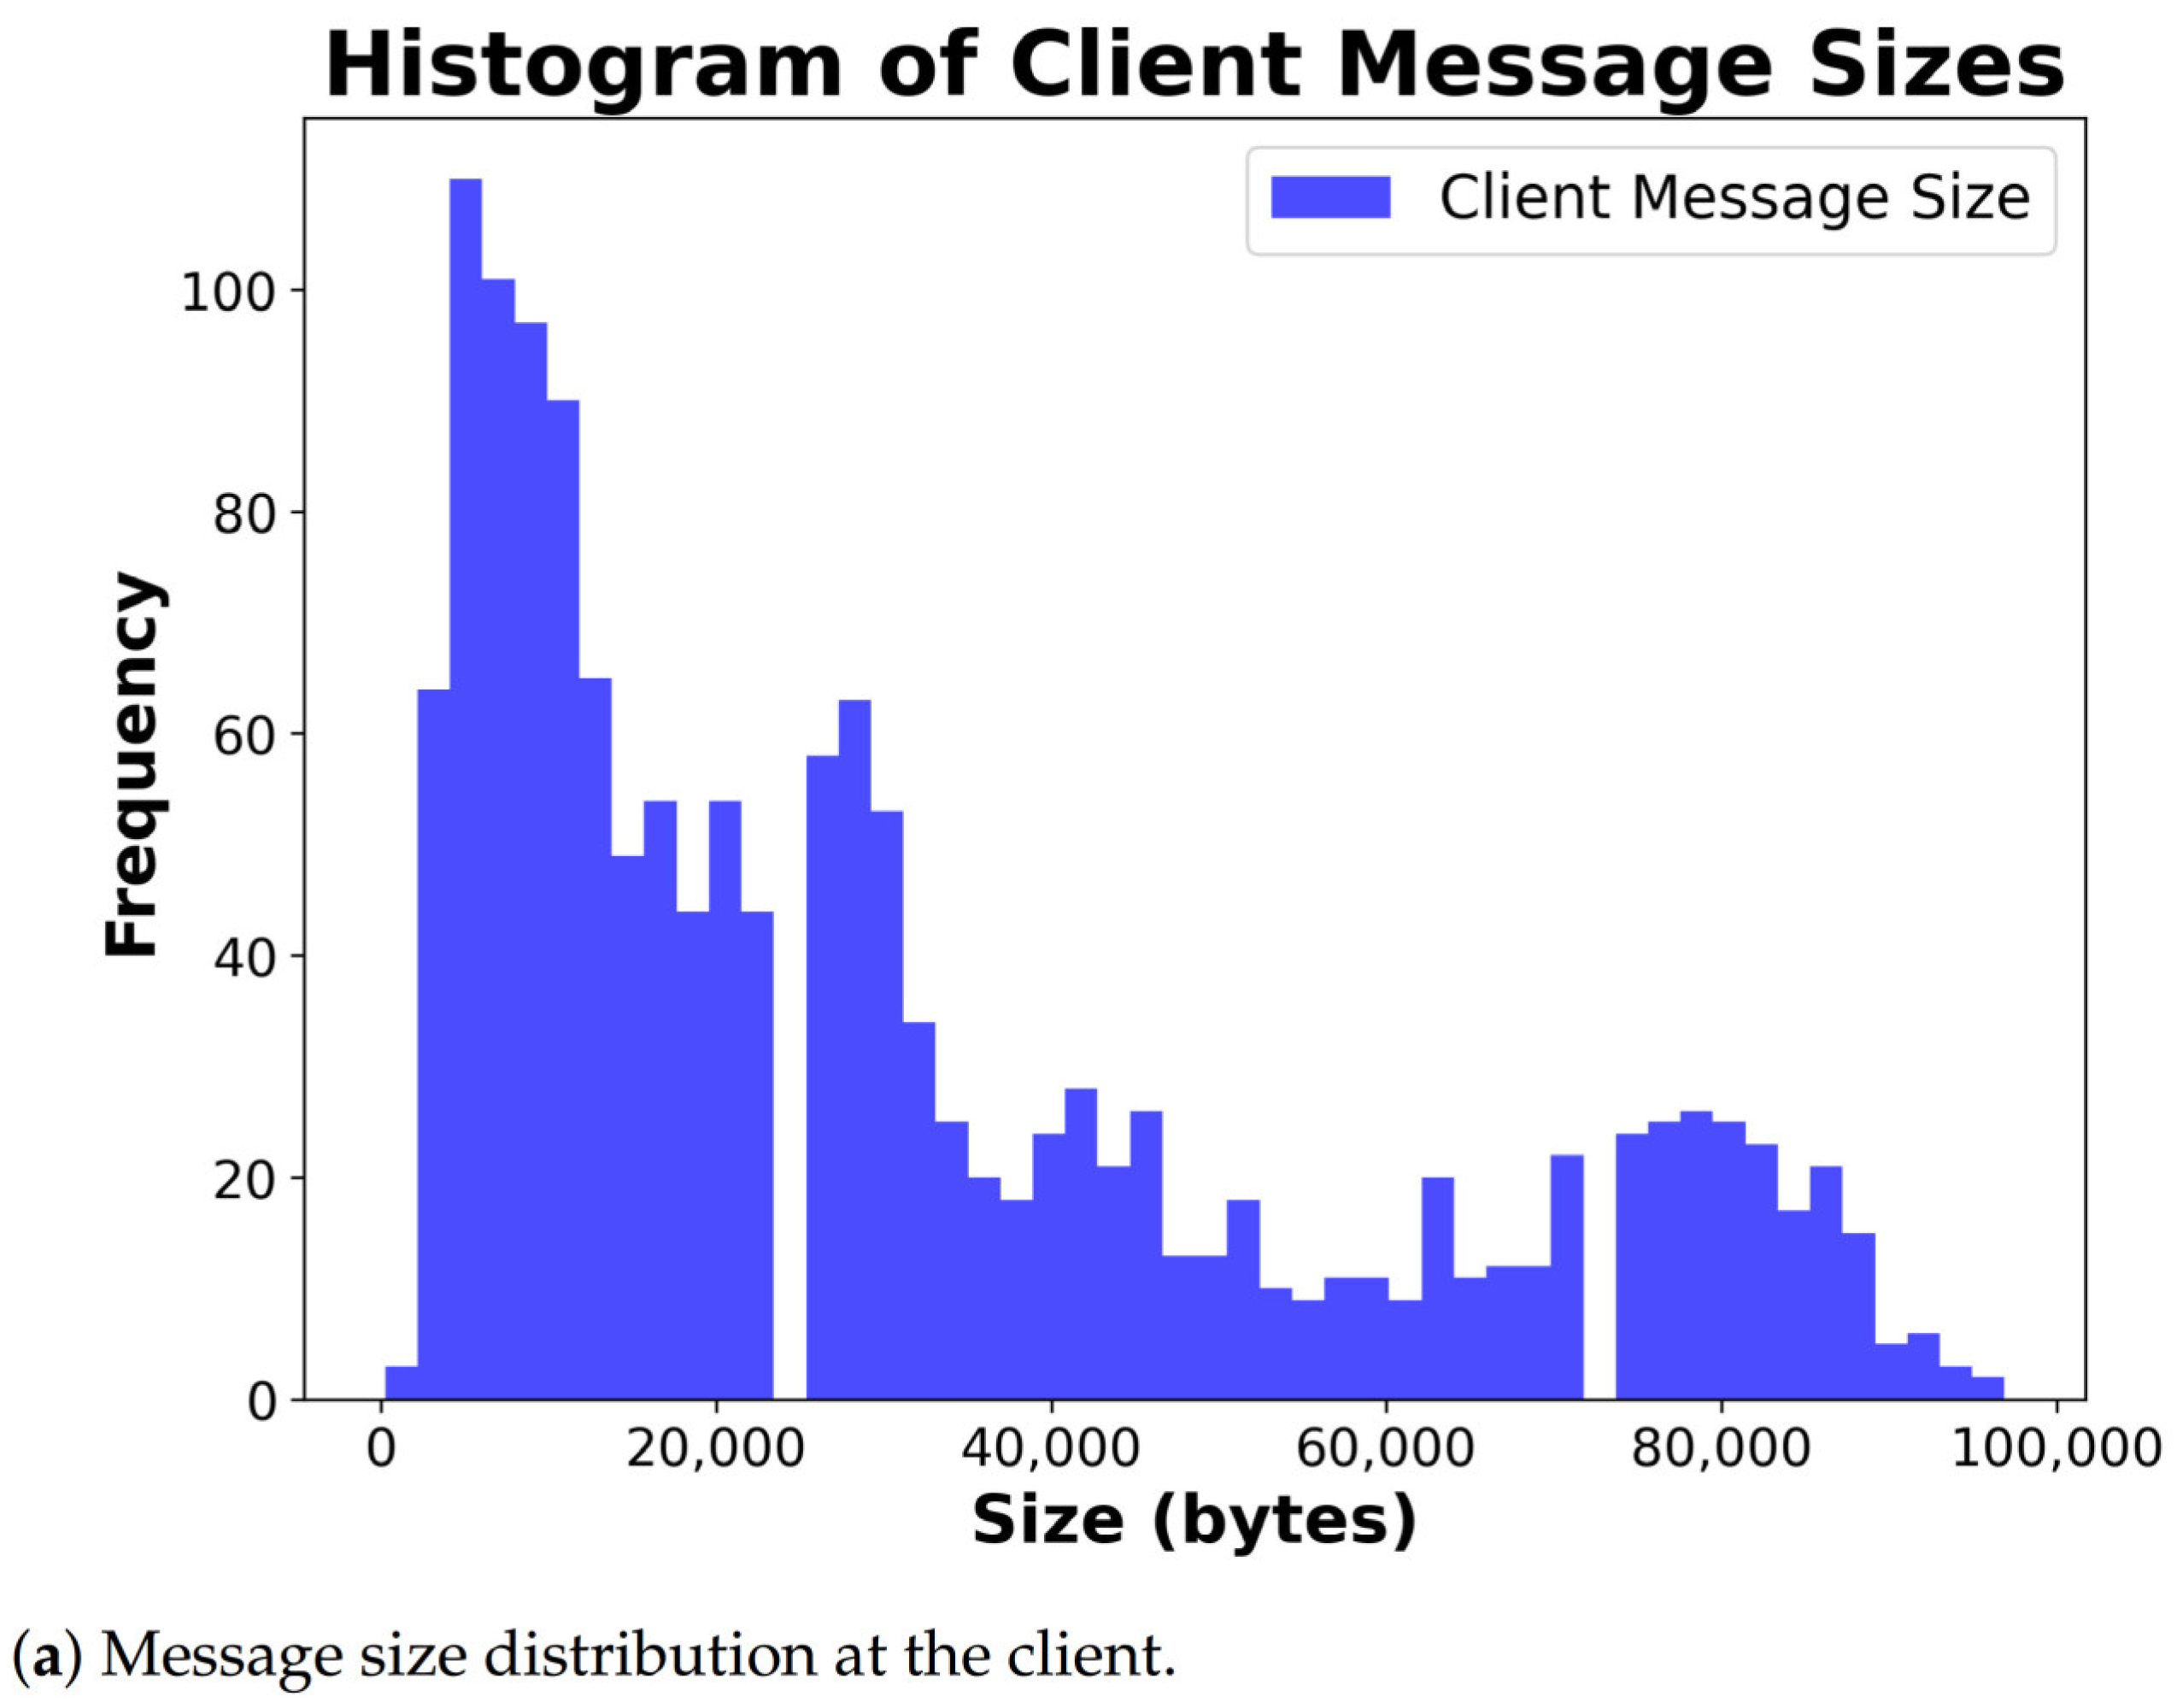
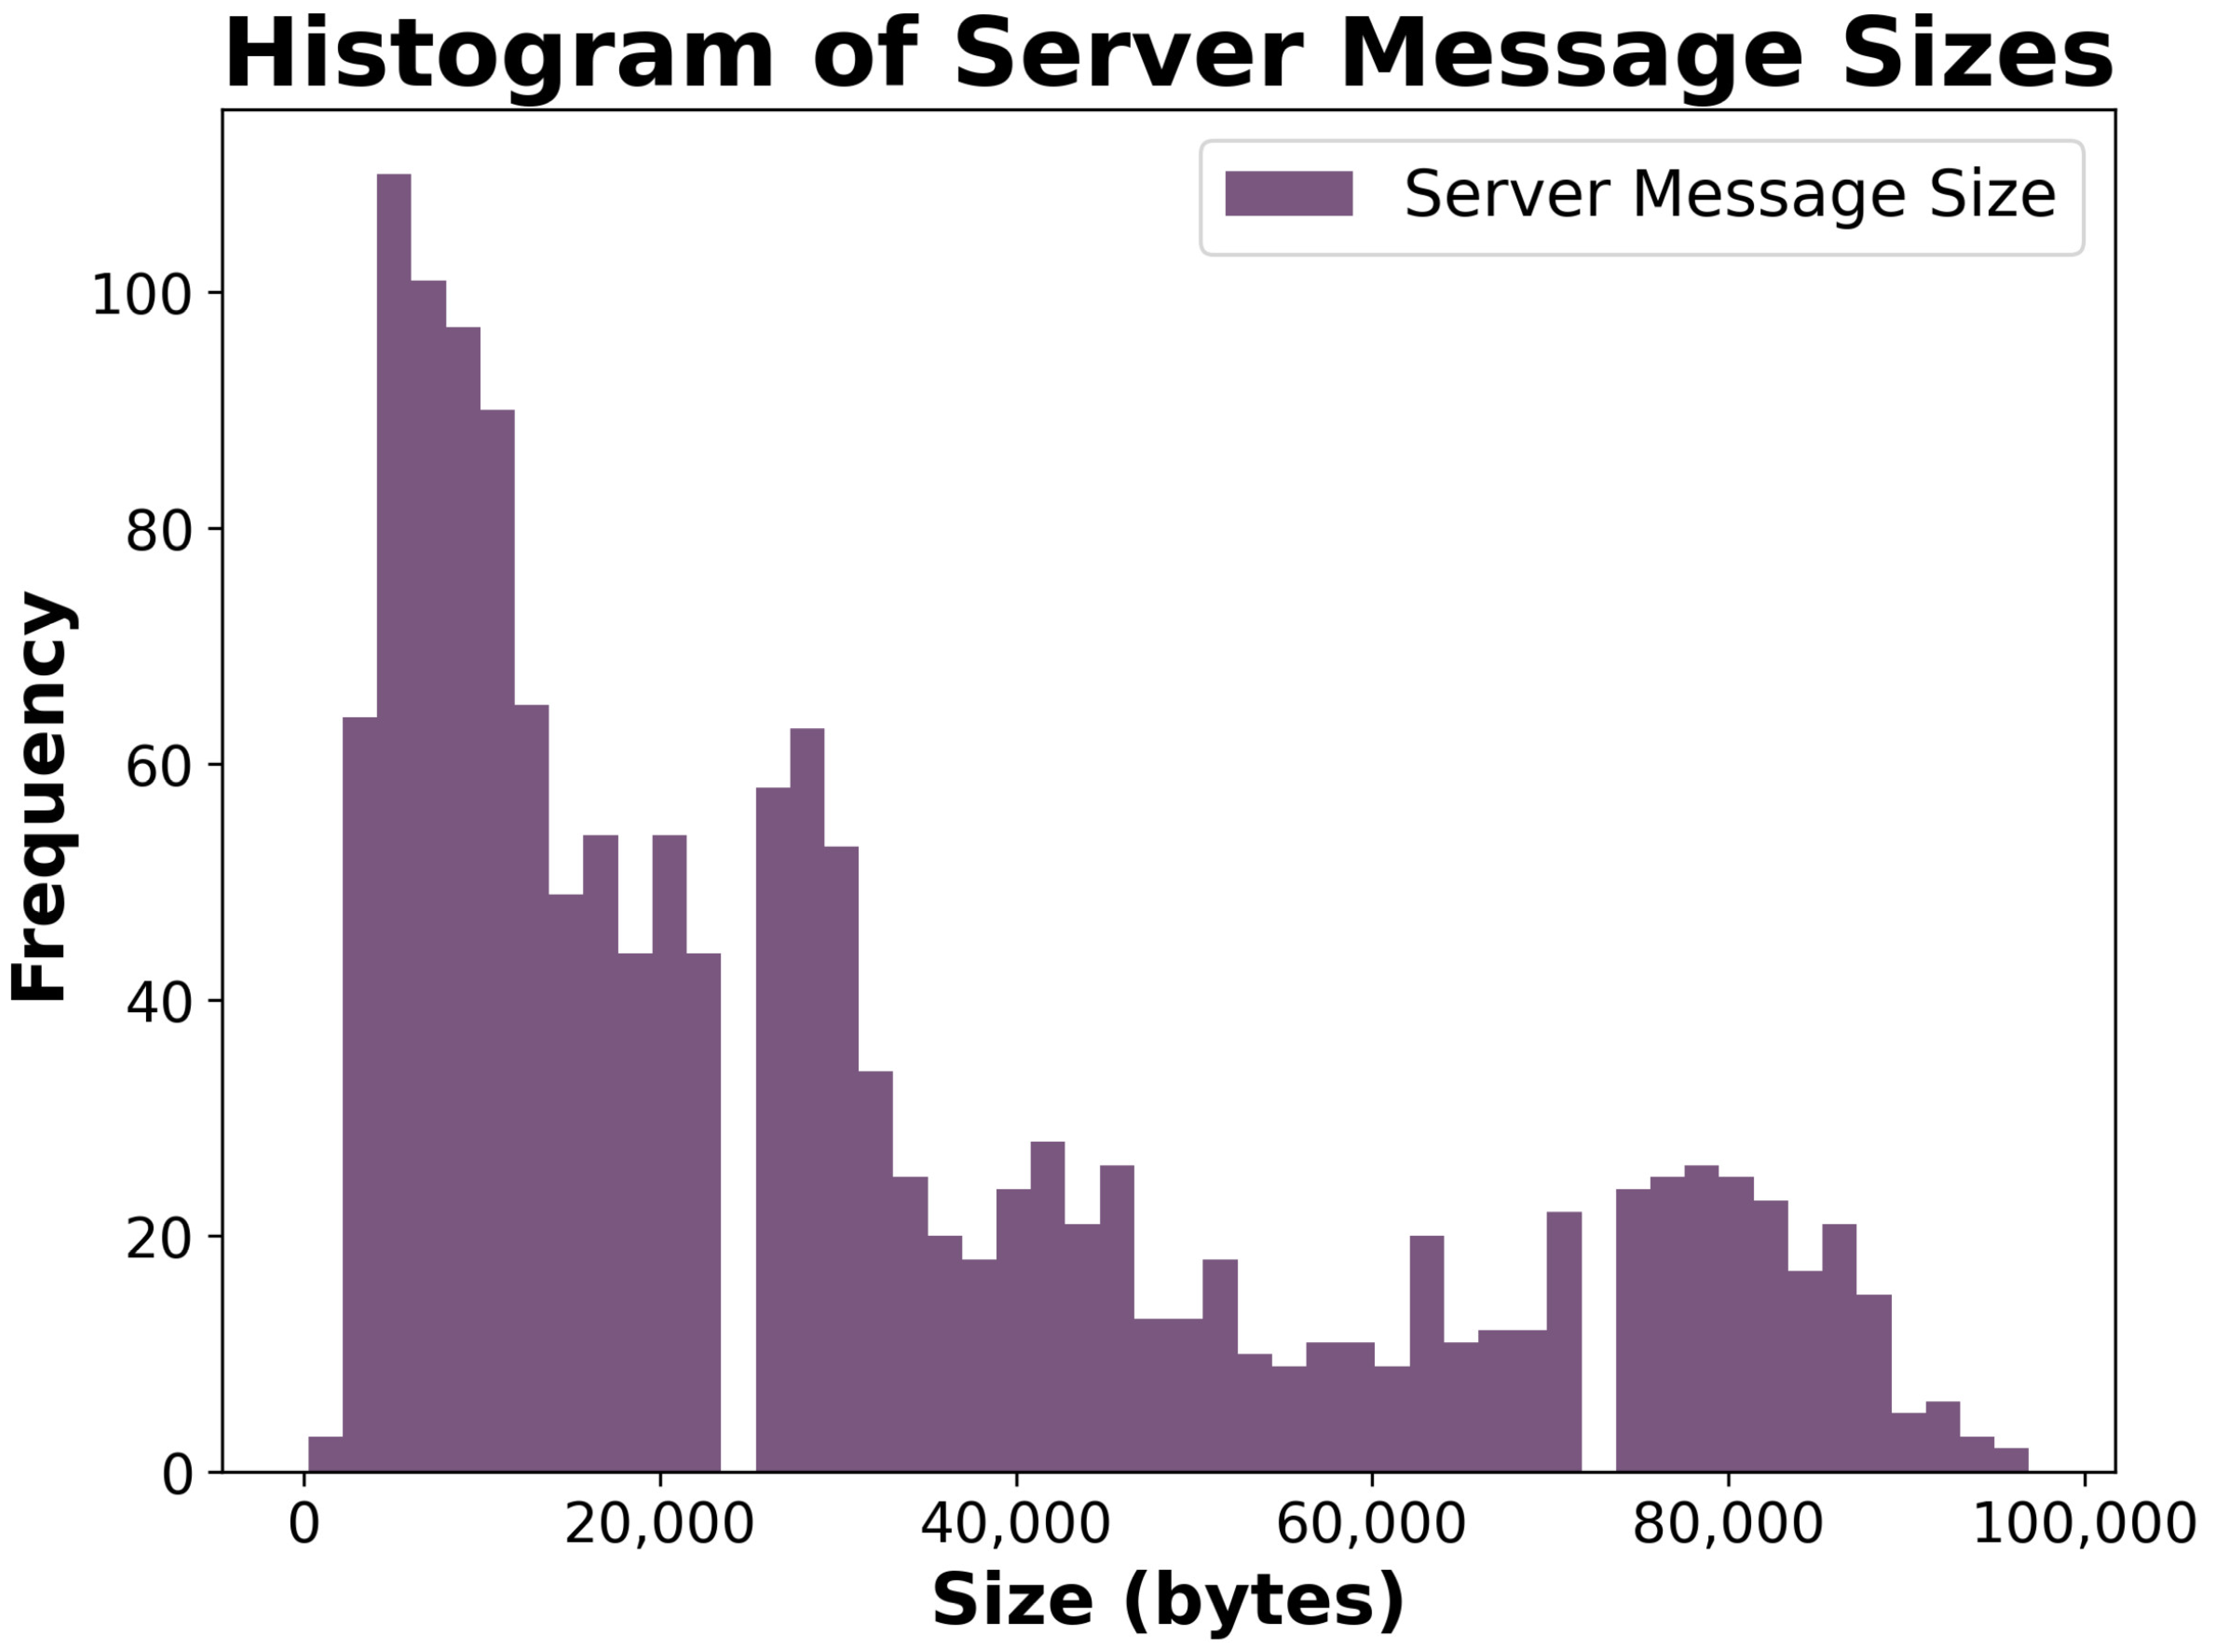
Additionally, the histograms in Figure 11 present the frequency distribution of message sizes, which further confirms that the client and server distributions remain closely matched. This behavior indicates robust system performance, with minimal packet loss or corruption.

Figure 11.
Frequency distribution of message sizes observed at (a) the client and (b) the server endpoints.
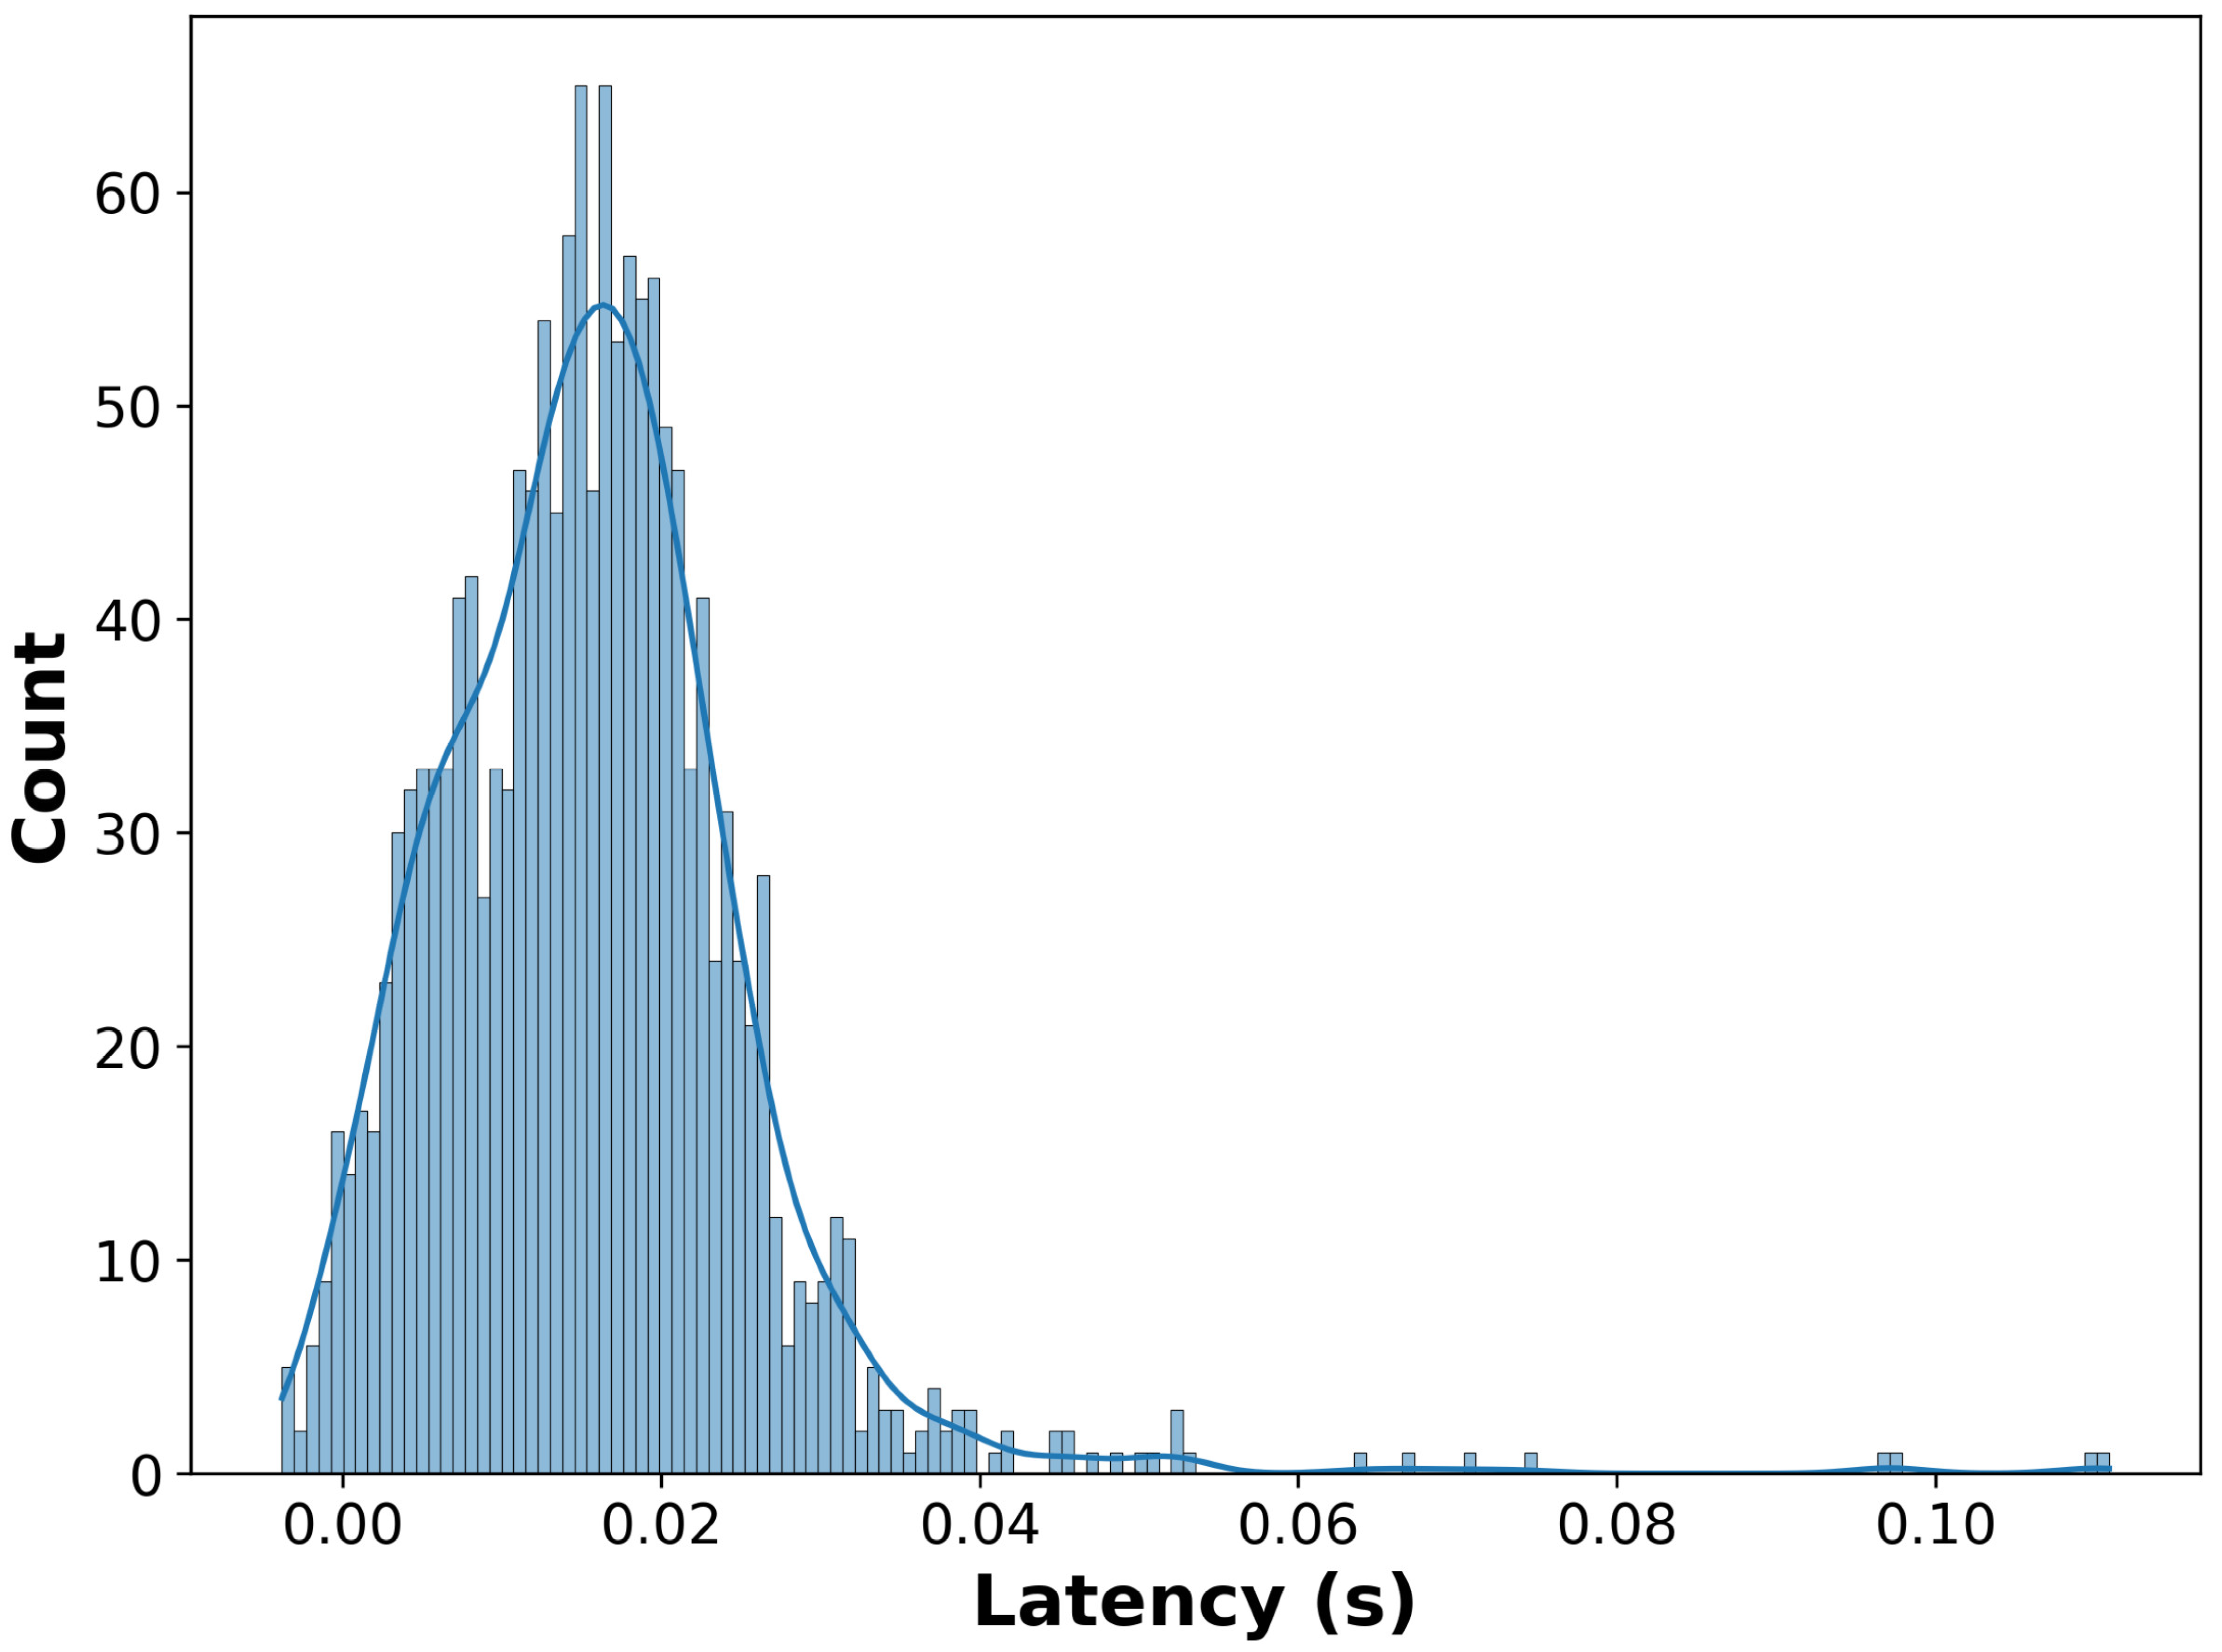
Moreover, with the ability to maintain reliable communication under adverse network conditions, our architecture leverages precise GPS-disciplined timing and packet-level recovery mechanisms to minimize the impact of loss and jitter on cloud-based digital twin performance. Figure 12 illustrates the latency distribution observed when the network experienced 5–10% packet loss combined with random jitter injection. The results show that the mean latency remained within 0.048 s with >95% of samples below 0.02 s. These results corroborate the resilience of the proposed communication layer, confirming stable end-to-end synchronization performance despite induced network degradation.
Figure 12.
Distribution of time delay under 5–10% network jitter to analyze the packet loss.
These results confirm that the proposed communication layer, based on real-time ROS messaging and optimized serialization, can guarantee low latency, predictable bandwidth scaling, and reliable transmission performance, all of which are critical for synchronized operation between the vehicle and digital twin.
4.3. Digital Twin Layer
The digital twin layer provides a synchronized, real-time virtual representation of the physical vehicle environment within the CARLA simulation platform. To conduct these tests, we utilized a workstation equipped with two NVIDIA RTX 4090 graphic cards and a 32-core Intel Core I9 processor. The server runs Ubuntu 20.04 with the Linux subsystem installed. Our simulations were performed using CARLA version 0.9.15, which is based on Unreal Engine 4.
To ensure smooth and efficient simulation, various object instances such as vehicles, pedestrians, and cyclists are pre-spawned below the virtual map before runtime, which allows us to avoid computational overhead and latency caused by on-the-fly instance creation during simulation.
Upon receiving perception messages from the real vehicle, the system processes each detected object by its class label, global position , and unique tracking ID () assigned by the perception module. If an object carries a new tracking ID, it is treated as a newly detected entity, and coordinate transformation is applied (from Equation (17)). This transformation aligns the real-world position of object with the virtual map coordinate frame, and a corresponding CARLA entity ID is assigned. For previously observed tracking IDs, their virtual instances are updated accordingly to reflect their most recent positions and states.
At every simulation frame, objects that are no longer detected (their tracking IDs are missing) are reset by relocating them below the virtual map, effectively hiding them from the current simulation view until they reappear in perception data. This dynamic management ensures that the digital twin accurately mirrors the evolving traffic scene from the physical world without wasting time in deleting and initializing the entities.
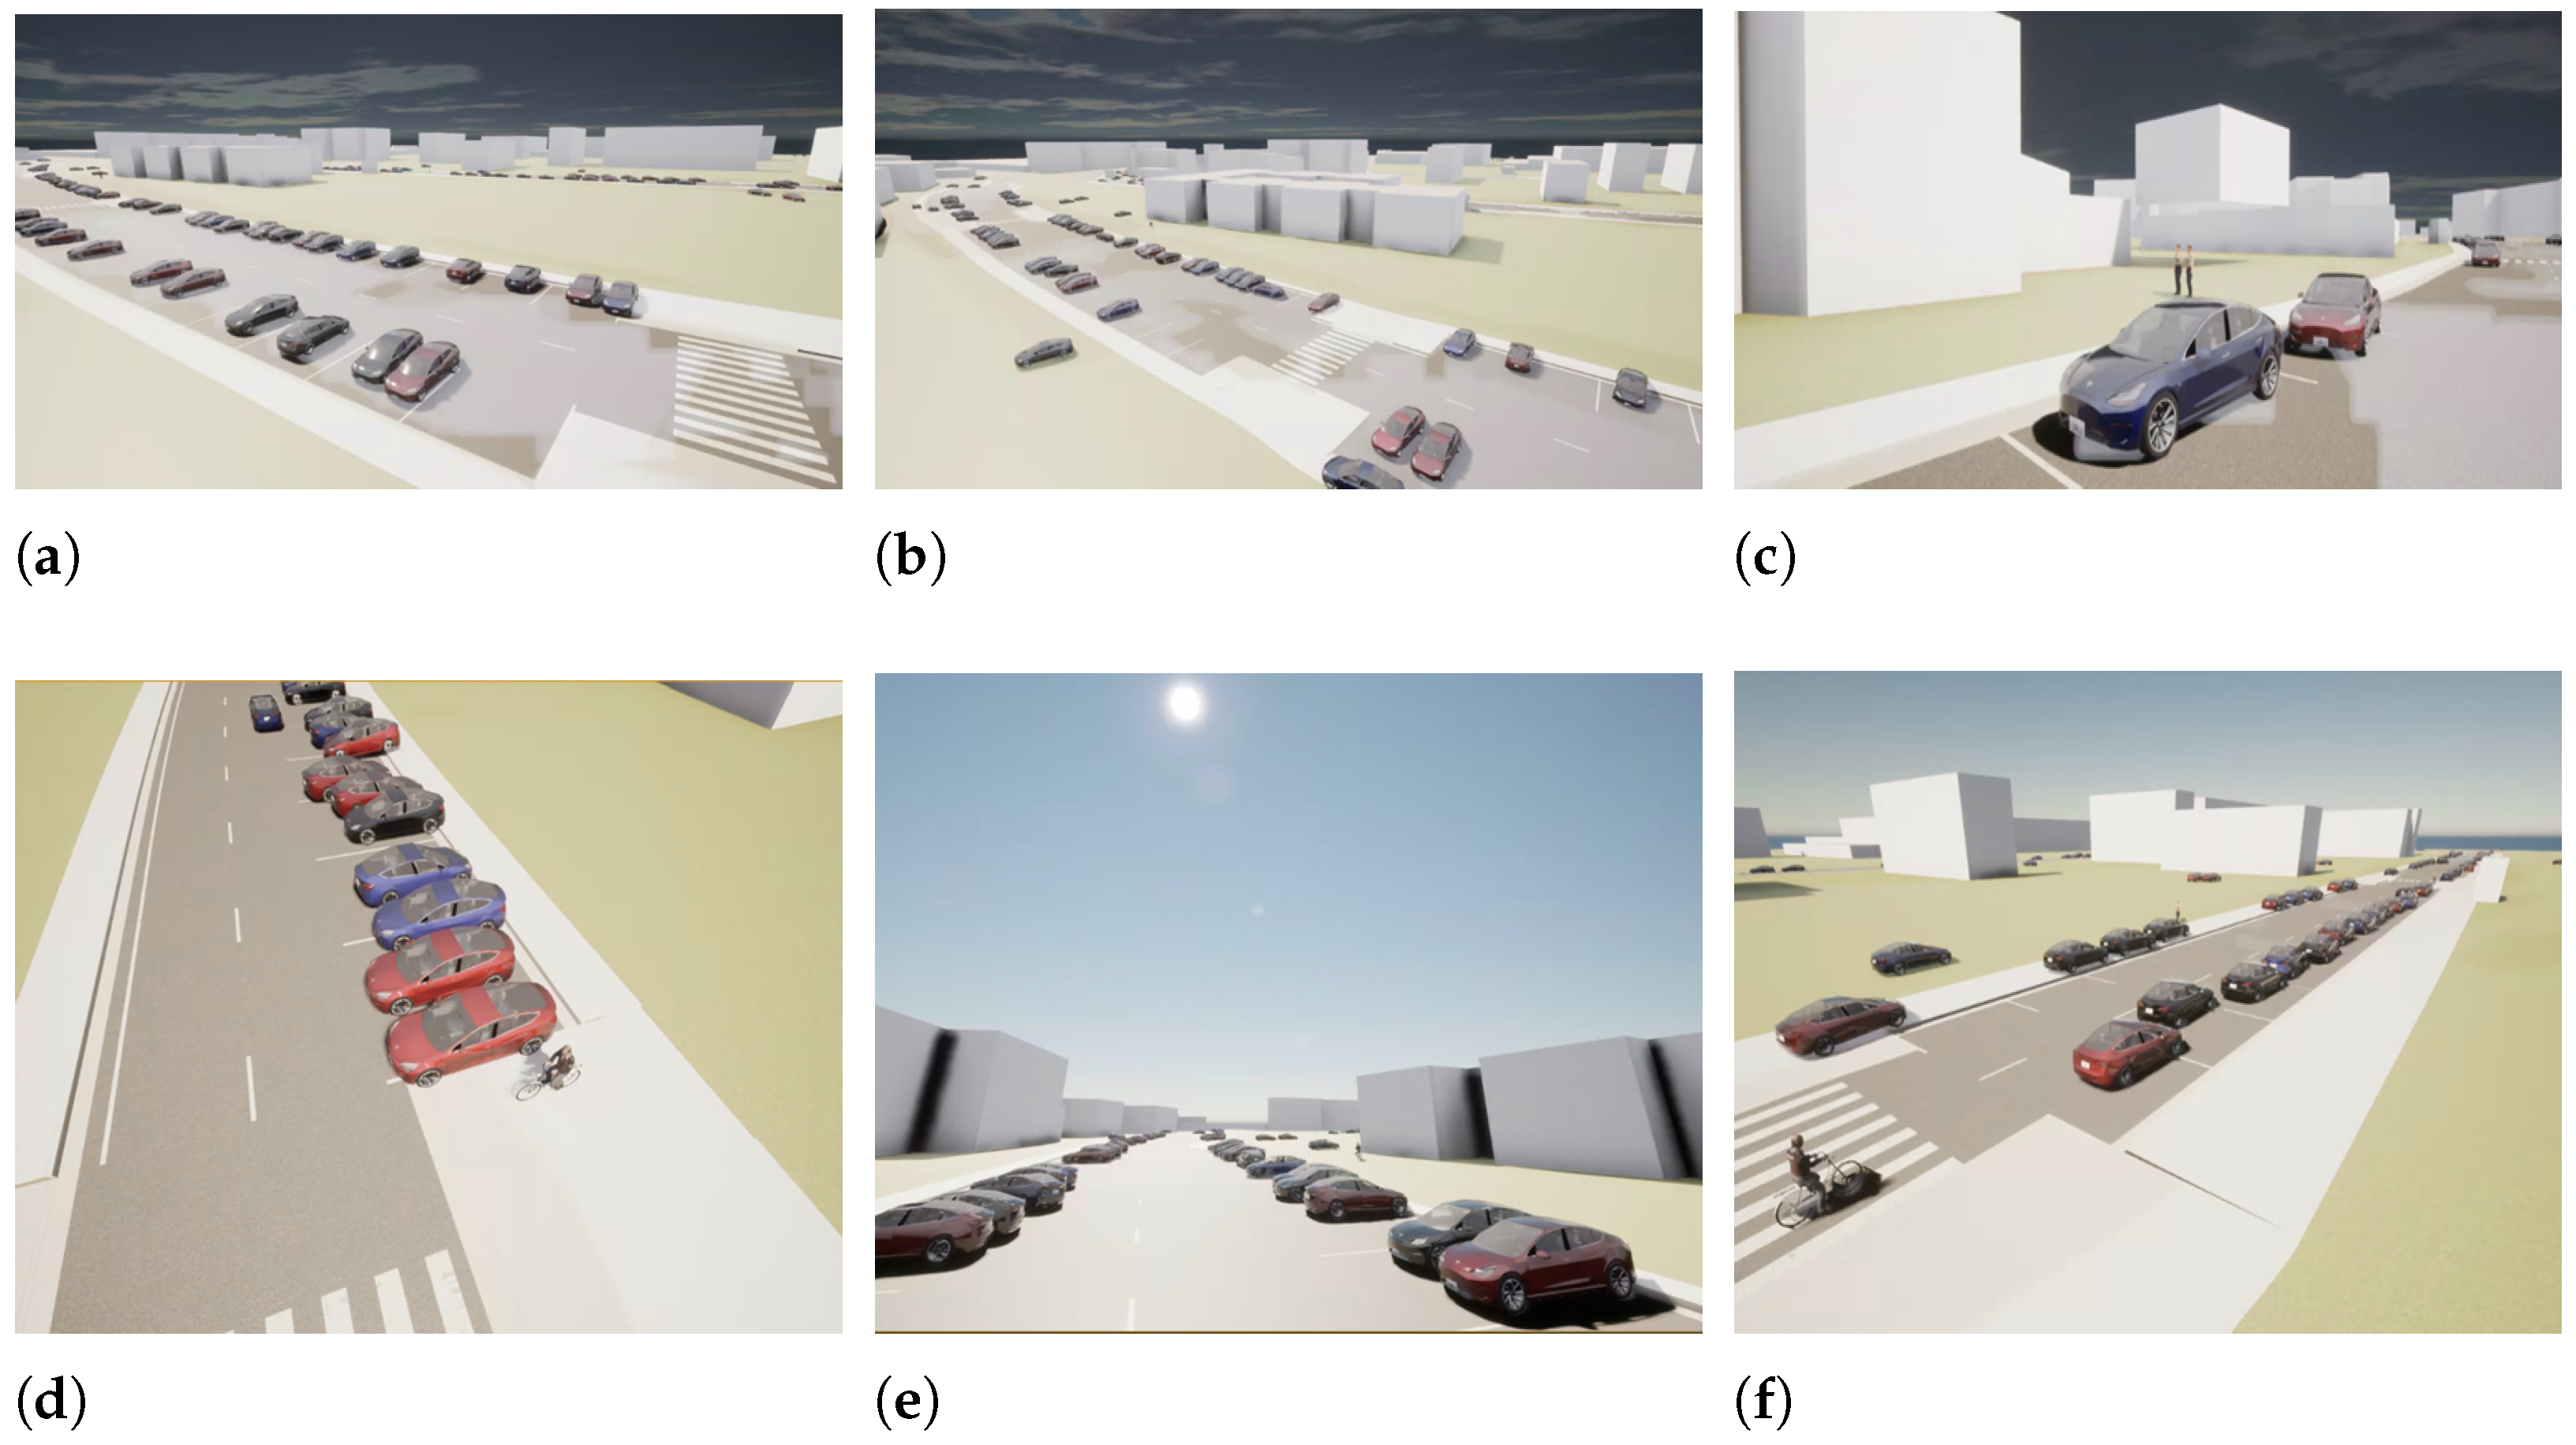
Figure 13 illustrates some of the examples of the digital twin platform in operation, showing static parked vehicles and dynamic pedestrians, cyclists, and vehicles, accurately spawned and updated in the virtual map of the experimental area. The close correspondence between the physical environment and its virtual counterpart validates the efficacy of the synchronization. This confirms the digital twin’s capability to support real-time, closed loop autonomous vehicle testing.
Figure 13.
Virtual representation of real-time detected static and dynamic road users: detection is performed with onboard perception module, which then communicates and spawns into the digital twin at the server. (a) Parked vehicles. (b) Parked vehicles. (c) Parked vehicles + pedestrian. (d) Parked vehicles + dynamic vehicle and cyclist. (e) Parked vehicles. (f) Parked vehicles + dynamic cyclist.
5. Conclusions
This work demonstrates that integrating real-time onboard perception with a cloud-based digital twin offers a powerful tool to enhance situational awareness within smart city transportation systems. Beyond enabling accurate 3D detection and tracking of dynamic road users, the framework effectively maintains live synchronization between physical traffic conditions and their virtual representation with minimal latency. These results highlight the system’s potential not only for visualizing ongoing traffic flow but also for supporting data-driven planning, simulation-based testing, and cooperative mobility management at urban scale. From a smart city perspective, such an architecture bridges the gap between localized vehicle sensing, and integrated city-wide traffic intelligence, offering tangible benefits for congestion reduction, safety improvement, and predictive control.
Future work aims to expand the experimental scope by including multi-vehicle deployments and larger-scale simulations to better replicate complex urban traffic scenarios. However, several practical factors should be considered before expanding the scope which includes network bandwidth limitations that affect timely data transmission, computational requirements for real-time processing at the edge that may pose scalability challenges, and safety concerns relating to system robustness under adverse weather conditions and resilience against cyber threats. Additionally, evaluations under variable network conditions, as well as robustness testing under diverse weather, are planned to further validate and improve system performance. Addressing these limitations will be critical for enabling practical, scalable, and safe smart city transportation solutions.
Author Contributions
Conceptualization, All; Methodology, J.G. and F.G.; Software, J.G., H.I. and B.M.; Validation, J.G., H.I. and B.M.; Formal Analysis, J.G., H.I. and B.M.; Investigation, F.G. and A.A.-k.; Resources, F.G.; Data Curation, J.G., H.I. and B.M.; Writing—Original Draft Preparation, H.I.; Writing—Review & Editing, H.I.; Visualization, H.I. and J.G.; Supervision, F.G.; Project Administration, F.G.; Funding Acquisition, F.G. and A.A.-k. All authors have read and agreed to the published version of the manuscript.
Funding
This work is part of the EcoMobility project (https://www.ecomobility-project.eu/ accessed
on 18 November 2025), which is supported by the CHIPS Joint Undertaking and its members, including top-up funding from the national authorities of Türkiye, Spain, the Netherlands, Latvia, Italy, Greece, Germany, Belgium, and Austria under grant agreement number 101112306. This work
was co-funded by the European Union.
Data Availability Statement
The data presented in this study are available on request from the corresponding author.
Conflicts of Interest
The authors declare no conflicts of interest.
References
- Elassy, M.; Al-Hattab, M.; Takruri, M.; Badawi, S. Intelligent transportation systems for sustainable smart cities. Transp. Eng. 2024, 16, 100252. [Google Scholar] [CrossRef]
- Jog, Y.; Singhal, T.K.; Barot, F.; Cardoza, M.; Dave, D. Need & gap analysis of converting a city into smart city. Int. J. Smart Home 2017, 11, 9–26. [Google Scholar] [CrossRef]
- Gupta, M.; Miglani, H.; Deo, P.; Barhatte, A. Real-time traffic control and monitoring. E-Prime Electr. Eng. Electron. Energy 2023, 5, 100211. [Google Scholar] [CrossRef]
- Bashir, A.; Mohsin, M.A.; Jazib, M.; Iqbal, H. Mindtwin AI: Multiphysics informed digital-twin for fault localization in induction motor using AI. In Proceedings of the 2023 International Conference on Big Data, Knowledge and Control Systems Engineering (BdKCSE), Sofia, Bulgaria, 2–3 November 2023; pp. 1–8. [Google Scholar]
- Guo, Y.; Zou, K.; Chen, S.; Yuan, F.; Yu, F. 3D digital twin of intelligent transportation system based on road-side sensing. In Proceedings of the Journal of Physics: Conference Series; IOP Publishing: Bristol, UK, 2021; Volume 2083, p. 032022. [Google Scholar]
- Alemaw, A.S.; Slavic, G.; Iqbal, H.; Marcenaro, L.; Gomez, D.M.; Regazzoni, C. A data-driven approach for the localization of interacting agents via a multi-modal dynamic bayesian network framework. In Proceedings of the 2022 18th IEEE International Conference on Advanced Video and Signal Based Surveillance (AVSS), Madrid, Spain, 29 November–2 December 2022; pp. 1–8. [Google Scholar]
- Iqbal, H.; Sadia, H.; Al-Kaff, A.; Garcia, F. Novelty Detection in Autonomous Driving: A Generative Multi-Modal Sensor Fusion Approach. IEEE Open J. Intell. Transp. Syst. 2025, 6, 799–812. [Google Scholar] [CrossRef]
- Wolniak, R.; Turoń, K. Between Smart Cities Infrastructure and Intention: Mapping the Relationship Between Urban Barriers and Bike-Sharing Usage. Smart Cities 2025, 8, 124. [Google Scholar] [CrossRef]
- Fong, B.; Situ, L.; Fong, A.C. Smart technologies and vehicle-to-X (V2X) infrastructures for smart mobility cities. In Smart Cities: Foundations, Principles, and Applications; Wiley: Hoboken, NJ, USA, 2017; pp. 181–208. [Google Scholar]
- Sadia, H.; Iqbal, H.; Hussain, S.F.; Saeed, N. Signal detection in intelligent reflecting surface-assisted NOMA network using LSTM model: A ML approach. IEEE Open J. Commun. Soc. 2024, 6, 29–38. [Google Scholar] [CrossRef]
- Sadia, H.; Iqbal, H.; Ahmed, R.A. MIMO-NOMA with OSTBC for B5G cellular networks with enhanced quality of service. In Proceedings of the 2023 10th International Conference on Wireless Networks and Mobile Communications (WINCOM), Istanbul, Turkiye, 26–28 October 2023; pp. 1–6. [Google Scholar]
- Kotusevski, G.; Hawick, K.A. A review of traffic simulation software. Res. Lett. Inf. Math. Sci. 2009, 13, 35–54. [Google Scholar]
- Wang, Z.; Gupta, R.; Han, K.; Wang, H.; Ganlath, A.; Ammar, N.; Tiwari, P. Mobility digital twin: Concept, architecture, case study, and future challenges. IEEE Internet Things J. 2022, 9, 17452–17467. [Google Scholar] [CrossRef]
- Rezaei, Z.; Vahidnia, M.H.; Aghamohammadi, H.; Azizi, Z.; Behzadi, S. Digital twins and 3D information modeling in a smart city for traffic controlling: A review. J. Geogr. Cart. 2023, 6, 1865. [Google Scholar] [CrossRef]
- Shibuya, K. Synchronizing Everything to the Digitized World. In The Rise of Artificial Intelligence and Big Data in Pandemic Society: Crises, Risk and Sacrifice in a New World Order; Springer: Singapore, 2022; pp. 159–174. [Google Scholar]
- Kusari, A.; Li, P.; Yang, H.; Punshi, N.; Rasulis, M.; Bogard, S.; LeBlanc, D.J. Enhancing SUMO simulator for simulation based testing and validation of autonomous vehicles. In Proceedings of the 2022 IEEE Intelligent Vehicles Symposium (IV), Aachen, Germany, 4–9 June 2022; pp. 829–835. [Google Scholar]
- Samuel, L.; Shibil, M.; Nasser, M.; Shabir, N.; Davis, N. Sustainable planning of urban transportation using PTV VISSIM. In Proceedings of the SECON’21: Structural Engineering and Construction Management; Springer: Cham, Switzerland, 2022; pp. 889–904. [Google Scholar]
- Casas, J.; Ferrer, J.L.; Garcia, D.; Perarnau, J.; Torday, A. Traffic simulation with aimsun. In Fundamentals of Traffic Simulation; Springer: New York, NY, USA, 2010; pp. 173–232. [Google Scholar]
- W Axhausen, K.; Horni, A.; Nagel, K. The Multi-Agent Transport Simulation MATSim; Ubiquity Press: London, UK, 2016. [Google Scholar]
- Kim, S.; Suh, W.; Kim, J. Traffic simulation software: Traffic flow characteristics in CORSIM. In Proceedings of the 2014 International Conference on Information Science & Applications (ICISA), Seoul, Republic of Korea, 6–9 May 2014; pp. 1–3. [Google Scholar]
- Jiménez, D.; Muñoz, F.; Arias, S.; Hincapie, J. Software for calibration of transmodeler traffic microsimulation models. In Proceedings of the 2016 IEEE 19th International Conference on Intelligent Transportation Systems (ITSC), Rio de Janeiro, Brazil, 1–4 November 2016; pp. 1317–1323. [Google Scholar]
- Grimm, D.; Schindewolf, M.; Kraus, D.; Sax, E. Co-simulate no more: The CARLA V2X Sensor. In Proceedings of the 2024 IEEE Intelligent Vehicles Symposium (IV), Jeju Island, Republic of Korea, 2–5 June 2024; pp. 2429–2436. [Google Scholar]
- Stubenvoll, C.; Tepsa, T.; Kokko, T.; Hannula, P.; Väätäjä, H. CARLA-based digital twin via ROS for hybrid mobile robot testing. Scand. Simul. Soc. 2025, 378–384. [Google Scholar] [CrossRef]
- Zhou, Z.; Lai, C.C.; Han, B.; Hsu, C.H.; Chen, S.; Li, B. CARLA-Twin: A Large-Scale Digital Twin Platform for Advanced Networking Research. In Proceedings of the IEEE INFOCOM 2025—IEEE Conference on Computer Communications Workshops (INFOCOM WKSHPS), Rio de Janeiro, Brazil, 1–4 November 2016. [Google Scholar]
- Isoda, T.; Miyoshi, T.; Yamazaki, T. Digital twin platform for road traffic using carla simulator. In Proceedings of the 2023 IEEE 13th International Conference on Consumer Electronics-Berlin (ICCE-Berlin), Berlin, Germany, 3–5 September 2023; pp. 47–50. [Google Scholar]
- Park, H.; Easwaran, A.; Andalam, S. TiLA: Twin-in-the-loop architecture for cyber-physical production systems. In Proceedings of the 2019 IEEE 37th International Conference on Computer Design (ICCD), Abu Dhabi, United Arab Emirates, 17–20 November 2019; pp. 82–90. [Google Scholar]
- Ding, Y.; Zou, J.; Fan, Y.; Wang, S.; Liao, Q. A Digital Twin-based Testing and Data Collection System for Autonomous Driving in Extreme Traffic Scenarios. In Proceedings of the 2022 6th International Conference on Video and Image Processing, Shanghai, China, 23–26 December 2022; pp. 101–109. [Google Scholar]
- Zhang, H.; Yue, X.; Tian, K.; Li, S.; Wu, K.; Li, Z.; Lord, D.; Zhou, Y. Virtual roads, smarter safety: A digital twin framework for mixed autonomous traffic safety analysis. arXiv 2025, arXiv:2504.17968. [Google Scholar] [CrossRef]
- Xu, H.; Berres, A.; Yoginath, S.B.; Sorensen, H.; Nugent, P.J.; Severino, J.; Tennille, S.A.; Moore, A.; Jones, W.; Sanyal, J. Smart mobility in the cloud: Enabling real-time situational awareness and cyber-physical control through a digital twin for traffic. IEEE Trans. Intell. Transp. Syst. 2023, 24, 3145–3156. [Google Scholar] [CrossRef]
- Rose, A.; Nisce, I.; Gonzalez, A.; Davis, M.; Uribe, B.; Carranza, J.; Flores, J.; Jia, X.; Li, B.; Jiang, X. A cloud-based real-time traffic monitoring system with lidar-based vehicle detection. In Proceedings of the 2023 IEEE Green Energy and Smart Systems Conference (IGESSC), Long Beach, CA, USA, 13–14 November 2023; pp. 1–6. [Google Scholar]
- Hu, C.; Fan, W.; Zeng, E.; Hang, Z.; Wang, F.; Qi, L.; Bhuiyan, M.Z.A. Digital twin-assisted real-time traffic data prediction method for 5G-enabled internet of vehicles. IEEE Trans. Ind. Inform. 2021, 18, 2811–2819. [Google Scholar] [CrossRef]
- Kušić, K.; Schumann, R.; Ivanjko, E. A digital twin in transportation: Real-time synergy of traffic data streams and simulation for virtualizing motorway dynamics. Adv. Eng. Inform. 2023, 55, 101858. [Google Scholar] [CrossRef]
- Kaytaz, U.; Ahmadian, S.; Sivrikaya, F.; Albayrak, S. Graph neural network for digital twin-enabled intelligent transportation system reliability. In Proceedings of the 2023 IEEE International Conference on Omni-layer Intelligent Systems (COINS), Berlin, Germany, 23–25 July 2023; pp. 1–7. [Google Scholar]
- Teofilo, A.; Sun, Q.C.; Amati, M. SDT4Solar: A Spatial Digital Twin Framework for Scalable Rooftop PV Planning in Urban Environments. Smart Cities 2025, 8, 128. [Google Scholar] [CrossRef]
- Kourtidou, K.; Frangopoulos, Y.; Salepaki, A.; Kourkouridis, D. Digital Inequality and Smart Inclusion: A Socio-Spatial Perspective from the Region of Xanthi, Greece. Smart Cities 2025, 8, 123. [Google Scholar] [CrossRef]
- Shi, S.; Guo, C.; Jiang, L.; Wang, Z.; Shi, J.; Wang, X.; Li, H. Pv-rcnn: Point-voxel feature set abstraction for 3d object detection. In Proceedings of the IEEE/CVF Conference on Computer Vision and Pattern Recognition, Seattle, WA, USA, 14–19 June 2020; pp. 10529–10538. [Google Scholar]
- Rhudy, M.; Gu, Y.; Gross, J.; Napolitano, M. Sensitivity analysis of EKF and UKF in GPS/INS sensor fusion. In Proceedings of the AIAA Guidance, Navigation, and Control Conference, Portland, OR, USA, 8–11 August 2011; p. 6491. [Google Scholar]
- Kumar, H.; Saxena, V. Optimization and Prioritization of Test Cases through the Hungarian Algorithm. J. Adv. Math. Comput. Sci. 2025, 40, 61–72. [Google Scholar] [CrossRef]
- Kjorveziroski, V.; Bernad, C.; Gilly, K.; Filiposka, S. Full-mesh VPN performance evaluation for a secure edge-cloud continuum. Softw. Pract. Exp. 2024, 54, 1543–1564. [Google Scholar] [CrossRef]
- Xiao, P.; Shao, Z.; Hao, S.; Zhang, Z.; Chai, X.; Jiao, J.; Li, Z.; Wu, J.; Sun, K.; Jiang, K.; et al. Pandaset: Advanced sensor suite dataset for autonomous driving. In Proceedings of the 2021 IEEE International Intelligent Transportation Systems Conference (ITSC), Indianapolis, IN, USA, 19–22 September 2021; pp. 3095–3101. [Google Scholar]
- Shi, S.; Wang, Z.; Shi, J.; Wang, X.; Li, H. From points to parts: 3d object detection from point cloud with part-aware and part-aggregation network. IEEE Trans. Pattern Anal. Mach. Intell. 2020, 43, 2647–2664. [Google Scholar] [CrossRef]
- Yan, Y.; Mao, Y.; Li, B. Second: Sparsely embedded convolutional detection. Sensors 2018, 18, 3337. [Google Scholar] [CrossRef]
- Shi, S.; Wang, X.; Li, H. Pointrcnn: 3d object proposal generation and detection from point cloud. In Proceedings of the IEEE/CVF Conference on Computer Vision and Pattern Recognition, Long Beach, CA, USA, 16–20 June 2019; pp. 770–779. [Google Scholar]
- Lang, A.H.; Vora, S.; Caesar, H.; Zhou, L.; Yang, J.; Beijbom, O. Pointpillars: Fast encoders for object detection from point clouds. In Proceedings of the IEEE/CVF Conference on Computer Vision and Pattern Recognition, Long Beach, CA, USA, 16–20 June 2019; pp. 12697–12705. [Google Scholar]
- Liu, Z.; Mao, H.; Wu, C.Y.; Feichtenhofer, C.; Darrell, T.; Xie, S. A convnet for the 2020s. In Proceedings of the IEEE/CVF Conference on Computer Vision and Pattern Recognition, New Orleans, LA, USA, 18–24 June 2022; pp. 11976–11986. [Google Scholar]
- Liu, X.; Xue, N.; Wu, T. Learning auxiliary monocular contexts helps monocular 3d object detection. In Proceedings of the AAAI Conference on Artificial Intelligence, Online, 22 February–1 March; 2022; Volume 36, pp. 1810–1818. Available online: https://ojs.aaai.org/index.php/AAAI/article/view/20074 (accessed on 18 November 2025).
- Chen, W.; Zhao, J.; Zhao, W.L.; Wu, S.Y. Shape-aware monocular 3D object detection. IEEE Trans. Intell. Transp. Syst. 2023, 24, 6416–6424. [Google Scholar] [CrossRef]
- Lu, Y.; Ma, X.; Yang, L.; Zhang, T.; Liu, Y.; Chu, Q.; Yan, J.; Ouyang, W. Geometry uncertainty projection network for monocular 3d object detection. In Proceedings of the IEEE/CVF International Conference on Computer Vision, Nashville, TN, USA, 19–25 June 2021; pp. 3111–3121. [Google Scholar]
- Chen, H.; Huang, Y.; Tian, W.; Gao, Z.; Xiong, L. Monorun: Monocular 3d object detection by reconstruction and uncertainty propagation. In Proceedings of the IEEE/CVF Conference on Computer Vision and Pattern Recognition, Nashville, TN, USA, 19–25 June 2021; pp. 10379–10388. [Google Scholar]
- Liu, C.; Gu, S.; Van Gool, L.; Timofte, R. Deep line encoding for monocular 3d object detection and depth prediction. In Proceedings of the 32nd British Machine Vision Conference (BMVC 2021); BMVA Press: Glasgow, UK, 2021; p. 354. [Google Scholar]
- Reading, C.; Harakeh, A.; Chae, J.; Waslander, S.L. Categorical depth distribution network for monocular 3d object detection. In Proceedings of the IEEE/CVF Conference on Computer Vision and Pattern Recognition, Nashville, TN, USA, 19–25 June 2021; pp. 8555–8564. [Google Scholar]
- Liu, Y.; Yixuan, Y.; Liu, M. Ground-aware monocular 3d object detection for autonomous driving. IEEE Robot. Autom. Lett. 2021, 6, 919–926. [Google Scholar] [CrossRef]
- Zhang, Y.; Lu, J.; Zhou, J. Objects are different: Flexible monocular 3d object detection. In Proceedings of the IEEE/CVF Conference on Computer Vision and Pattern Recognition, Nashville, TN, USA, 19–25 June 2021; pp. 3289–3298. [Google Scholar]
- Ma, X.; Zhang, Y.; Xu, D.; Zhou, D.; Yi, S.; Li, H.; Ouyang, W. Delving into localization errors for monocular 3d object detection. In Proceedings of the IEEE/CVF Conference on Computer Vision and Pattern Recognition, Nashville, TN, USA, 19–25 June 2021; pp. 4721–4730. [Google Scholar]
- Wang, T.; Xinge, Z.; Pang, J.; Lin, D. Probabilistic and geometric depth: Detecting objects in perspective. In Proceedings of the Conference on Robot Learning, PMLR. 2022, pp. 1475–1485. Available online: https://proceedings.mlr.press/v164/wang22i.html (accessed on 18 November 2025).
- Pitropov, M.; Garcia, D.E.; Rebello, J.; Smart, M.; Wang, C.; Czarnecki, K.; Waslander, S. Canadian adverse driving conditions dataset. Int. J. Robot. Res. 2021, 40, 681–690. [Google Scholar] [CrossRef]
Disclaimer/Publisher’s Note: The statements, opinions and data contained in all publications are solely those of the individual author(s) and contributor(s) and not of MDPI and/or the editor(s). MDPI and/or the editor(s) disclaim responsibility for any injury to people or property resulting from any ideas, methods, instructions or products referred to in the content. |
© 2025 by the authors. Licensee MDPI, Basel, Switzerland. This article is an open access article distributed under the terms and conditions of the Creative Commons Attribution (CC BY) license (https://creativecommons.org/licenses/by/4.0/).