Abstract
Monitoring physiological activity and sleep states in real time is challenging, particularly for continuous assessment in daily life settings using wearable IoMT devices. We developed a 24 h wearable system that integrates electrocardiogram (ECG) electrodes for heart rate measurement and a glove-mounted flex sensor for motor responses, connected through an Internet of Medical Things (IoMT) platform. Flex signals were combined using principal component analysis (PCA) to generate a single kinematic channel, then standardized with heart rate. Time-series windows were embedded using TS2Vec and clustered with DBSCAN, while t-SNE was applied only for visualization. The framework identified four physiologically coherent states: (i) nocturnal sleep with the lowest heart rate and minimal motion, (ii) evening pre-sleep with low movement and moderately higher heart rate, (iii) daytime activity with variable motion and mid-range heart rate, and (iv) late-day high-intensity activity with the highest heart rate and increased motor responses. A few outliers were observed during transient body movements or sensor readjustments, which were identified and excluded during preprocessing to ensure stable clustering results. Across 24 h, heart rate ranged from 52 to 96 bpm (mean 77.4), while flexion spanned 0 to 165° (mean 52.5°), showing alignment between movement intensity and cardiac response. This integrated sensing and analytics pipeline provides an interpretable, subject-specific state map that enables continuous remote monitoring of physiological activity and sleep patterns.
1. Introduction
Hospitals are widely recognized as integral components of healthcare systems, serving not only as providers of curative care but also as fundamental institutions that contribute to preventive and population health strategies []. A critical unit within hospitals is the Intensive Care Unit (ICU), which is staffed with specialized personnel and equipped with advanced medical technology. Patients admitted to the ICU are typically those requiring urgent medical interventions or continuous monitoring []. A key parameter in patient monitoring is the assessment of consciousness. Consciousness reflects the patient’s level of responsiveness to external stimuli and the environment []. The evaluation of a patient’s level of consciousness is pivotal in medical practice, particularly for individuals facing severe health conditions that necessitate intensive observation and care [,]. Patients experiencing prolonged impairments of consciousness often face difficulties in expressing their state of awareness []. The patient’s consciousness level not only serves as an indicator of their neurological status but also provides critical insight into treatment efficacy and disease progression [].
The Glasgow Coma Scale (GCS) is commonly used to evaluate a patient’s level of consciousness by assessing eye, verbal, and motor responses. In addition to GCS, monitoring consciousness levels can also involve heart rate analysis [,]. Traditionally, heart rate monitoring is performed using a stethoscope and auscultation. However, these conventional methods have limitations, particularly in accuracy due to subjective human interpretation, and they lack real-time monitoring capability []. In the biomedical field, the measurement of bioelectric signals is a critical aspect of patient monitoring. Bioelectric measurements applied to monitor heart conditions are referred to as ECG (electrocardiography), while EMG (electromyography) is used for muscles and ENG (electroneurography) for nerves. Brain activity, on the other hand, is currently assessed through EEG (electroencephalography), which records electrical signals from the brain [].
The proposed patient awareness monitoring system employs ECG sensors to measure heart rate and flex sensors to detect motor responses. The rapid advancement of technology has driven the creation of systems based on the Internet of Medical Things (IoMT), enabling real-time and remote monitoring. In this system, IoMT technology utilizes the Blynk application as an interface to provide real-time data via Wi-Fi, thereby enhancing accessibility and efficiency in health monitoring. Additionally, the data collected can be stored in the cloud, enabling further analysis to support faster and more informed decision-making.
In addition to real-time data acquisition, the data-driven analysis stage is employed to extract latent patterns from ECG time-series data and motor responses. This process begins by dividing the data into segments using a sliding window method. Each segment is then represented as a feature vector (embedding) using TS2Vec, a self-supervised framework capable of learning contextual representations without requiring labeled data. This approach is particularly advantageous in clinical environments, where annotated data is often limited []. The resulting embedding vectors are clustered using DBSCAN, a density-based clustering algorithm. DBSCAN was selected for its ability to identify clusters of arbitrary shapes while effectively labeling outliers, making it suitable for handling physiological signals that are often prone to noise []. Thus, this method enables unsupervised mapping of patients’ physiological states while simultaneously identifying outlier data. This approach is consistent with recent studies in medical time-series analysis. Literature shows that self-supervised representation learning has proven effective for ECG, EEG, and wearable sensor data, as it reduces the labeling burden while preserving clinically meaningful patterns, whereas unsupervised clustering has been shown to be reliable in profiling large-scale cardiac dynamics [,,]. When integrated into an IoMT pipeline, the combination of TS2Vec and DBSCAN effectively transforms raw sensor signals into interpretable summaries to support continuous patient condition monitoring.
Research has been conducted on the use of IoMT to monitor patient alertness by measuring heart rate and motor response. In their research, Azriyenni et al. measured the patient’s heart rate using a MAX30102 sensor, body temperature using a DS18B20 sensor, and a flex sensor to detect the patient’s finger curvature. Using the Arduino Nano microcontroller and an ESP8266 Wi-Fi module, the data is then sent to the Blynk application via Wi-Fi communication. When the patient moves their finger, a notification appears on the Blynk app [].
Using the AD8232 electrocardiogram sensor to detect heart rate, Sangeethalakshmi et al. monitor patient health using the Internet of Things (IoT) concept. In addition to heart rate, patient health monitoring is also designed using LM35 sensors for body temperature and blood pressure sensors. Using the ESP32 microcontroller, the data is sent to the ThingSpeak application via Wi-Fi communication, and a message is sent to a cell phone number via a GSM device when any of the parameters exceed the threshold []. Shagun et al. developed a portable health monitoring device using photoplethysmography (PPG) and electrocardiogram (ECG) technology. The limitation of this study is the lack of notification features to alert healthcare workers for timely responses [].
This system enables continuous and real-time monitoring of a subject’s physiological activity and sleep states, providing detailed insight into heart rate and motor responses. Given the significance of accurately capturing these physiological signals, delays or gaps in monitoring can limit understanding of activity and rest patterns. Therefore, this study proposes a monitoring system capable of providing precise measurements, such as heart rate or pulse rate, by detecting the number of arterial pulses within a one-minute interval while simultaneously tracking motor responses to map activity and sleep states.
2. Materials and Methods
This research was conducted in several stages, focusing on the development of a system for monitoring physiological activity and sleep states in a subject. The research stages included a literature review on heart rate and motor response monitoring, identification of key challenges, and the design and construction of hardware and software. Each sensor was calibrated using standard reference instruments before system testing. The research stages included conducting a literature search on heart rate monitoring and finger movements for patient awareness, identifying the key problems, and designing and constructing hardware and software. Each sensor was calibrated using standard reference instruments before system testing. The ECG sensor (AD8232) was calibrated and validated using a digital fingertip pulse oximeter (OLED type; accuracy ±2 bpm for heart rate and ±2% for SpO2) based on the photoplethysmography (PPG) principle. This reference device complies with International Electrotechnical Commission (IEC) 80601-2-61, the international standard for pulse oximeters, and has been widely used as a clinical-grade reference in biomedical validation studies [,]. The flex sensor was calibrated using a mechanical protractor with an angular resolution of 1°, ensuring precise measurement of finger flexion angles. Calibration results were analyzed in terms of average error (%) and accuracy (%), confirming high linearity and consistency across repeated measurements. Web- and Blynk-based interfaces were designed, and the complete system was tested.
The design of the physiological activity and sleep state monitoring system consists of both hardware and software components. The hardware design includes an AD8232 ECG sensor, flex sensors, a 22 kΩ resistor, an Arduino Uno microcontroller, and an ESP32 module. The hardware design is shown in Figure 1.
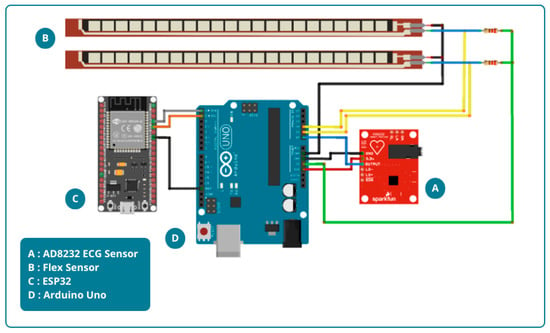
Figure 1.
Hardware design.
Figure 1 illustrates the hardware design, which consists of an AD8232 ECG sensor and two flex sensors. For heart rate measurement, the AD8232 ECG sensor is attached to both wrists and the right ankle. The placement of this sensor aims to accurately capture the heart’s electrical signals and thus provide comprehensive data. Meanwhile, Flex sensors will be installed on the middle finger of the right and left hands to detect motor response. These sensors are designed to detect finger movements. The measurement results are then displayed on the Blynk application for remote monitoring. The block diagram of the system is shown in Figure 2.
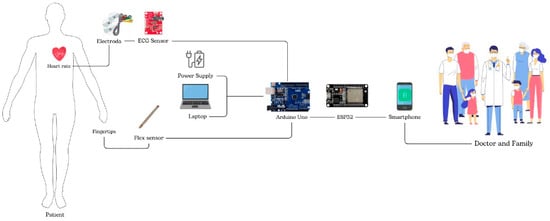
Figure 2.
System block diagram.
In addition to hardware, software design also plays an important role in integrating and processing the data obtained for monitoring physiological activity and sleep state. Two software platforms were used in this study: the Arduino Integrated Development Environment (IDE) version 1.8.19 and the Blynk application. The Arduino IDE allows developers to program the Arduino Uno microcontroller to accurately retrieve data from ECG sensors and flex sensors. The Blynk application, with its real-time monitoring and instant notification capabilities, is highly effective for healthcare and automation applications. Cloud support allows data access from anywhere, making remote monitoring easy. Blynk is also compatible with a wide variety of sensors, allowing for the development of more complex devices. The software design is shown in Figure 3.
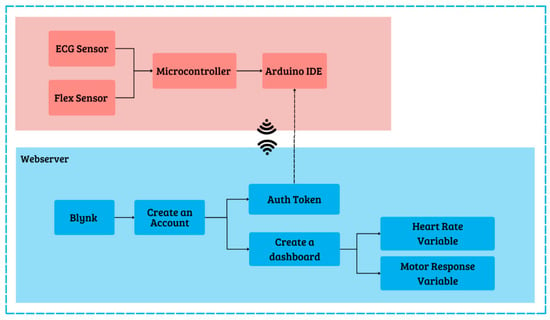
Figure 3.
Software design.
The process involved creating a Blynk-based web server to display heart rate and motor response results. First, create a Blynk account with an email. Next, create a template named “Heart Rate and Motor Response Measurement System,” select ESP32 hardware with Wi-Fi connection, then click Done. Create a dashboard view using labeled value widgets and charts. Next, create data streams for each sensor by specifying virtual pins as the link between Blynk and ESP32. Once the template, dashboard, and data streams are complete, you will receive the Blynk ID template and auth token, which you then enter into the Arduino IDE program. Using the auth token code, ESP32 can communicate with the Blynk web server and send data. After successfully connecting to Blynk, the web server interface can monitor the subject’s physiological activity and sleep states in real time, as sent from the ESP32 microcontroller.
Before system testing and data collection, both sensors were calibrated following the procedure described in Section 2 using IEC-compliant reference instruments. The AD8232 ECG sensor was validated against a fingertip pulse oximeter, while the flex sensor was calibrated using a mechanical protractor. These calibration steps ensured reliable and repeatable sensor performance prior to system testing. After calibrating each sensor, the next step was to test the Quality of Service (QoS) parameters; the parameter measured was the delay, or time required, to send data from the ESP32 microcontroller to the Blynk server. In this test, every time the data was sent, the time of sending was recorded, as was the time the Blynk server received the data. Delay was calculated as the difference between the time of sending and receiving data, which was then analyzed to determine the speed of data transmission using Wi-Fi communication. The test was conducted under two conditions: an enclosed space and an open space. The final stage consists of comprehensive system testing to evaluate the success of the created system.
After configuring the sensor system and IoMT, machine learning analysis was performed using the DBSCAN algorithm. Prior to this stage, data preprocessing was performed to ensure clean data, comparable feature scales, and well-represented temporal dynamics. The preprocessing process included scaling the flex sensor signals, reducing the dimensionality of flex channels using PCA, rescaling all features (heart rate and PCA components), generating time-series embeddings with TS2Vec, and subsequently using these embeddings for clustering with DBSCAN and exploring the resulting structure with t-SNE. The time-series data format consisted of heart rate and flex sensor signals from the right and left hands. To facilitate analysis, the flex sensor data were reduced to one dimension using Principal Component Analysis (PCA). PCA is an unsupervised multivariate analysis method designed to explore data without requiring prior information about object classes. This technique reduces dimensionality by linearly transforming the original variables into orthogonal principal components (PCs), with the first PC capturing the largest variance, followed by subsequent PCs with smaller contributions. Essentially, this process decomposes the original data matrix (X) into the product of a score matrix (S) and a loading matrix (LT), allowing most of the statistical information to be compressed into just two or three principal components []. The equation can be expressed as follows:
In this study, PCA was applied to reduce the two flex sensor variables (left and right) into a single principal component. The objective was to simplify the data while preserving the largest variation in information from both signals, thereby producing a stable and unified representation that can be more easily analyzed alongside heart rate. In this way, the data dimensionality was reduced without losing essential information while also facilitating the processes of representation learning and clustering of physiological activity and sleep states.
The reduced and normalized time-series data were converted into vector representations prior to the training stage. This process was carried out using TS2Vec, a universal framework for learning time-series representations through a hierarchical contrastive learning approach. The core principle of TS2Vec is to maintain contextual consistency, in which two augmented “views” of the data are compared to ensure that the resulting representation remains robust. The objective of applying this method was to capture temporal patterns and variations in the subject’s motor conditions over time. The TS2Vec learning objective is applied hierarchically using a dual contrastive loss, which combines temporal loss (l_temp) to capture trends and dynamics with instance-wise loss (l_inst) to learn the unique characteristics of each instance. Mathematically, the overall loss function is defined as follows []:
where N denotes the number of instances or time-series segments, and T represents the number of timestamps within each segment. Through this approach, heart rate and flex sensor signals can be transformed into more informative vector representations, which then serve as the input for the clustering process.
After the data underwent reduction and vectorization, the next stage was clustering using DBSCAN. DBSCAN is a density-based algorithm capable of identifying clusters of arbitrary shapes and sizes without requiring the number of clusters to be specified in advance while also being able to identify outliers as noise. The fundamental principle is that a cluster is a region with high point density, separated by regions of lower density. The operation of the algorithm is governed by two parameters: epsilon (ε), the maximum distance for considering a point to be within the neighborhood of another point, and minimum points (minPts), the minimum number of points within an ε-radius for a point to be classified as a core []. With a general distance metric d(p,q) (e.g., Euclidean or cosine), the ε-neighborhood of a point p is defined as:
Based on this definition, each point in the dataset is classified into three types: (i) core point, if |Nε(p)| ≥ minPts; (ii) border point, a non-core point that lies within Nε of at least one core point; and (iii) noise/outlier, a point that is neither core nor border. Furthermore, a point q is said to be directly density-reachable from a core point p if q ∈ Nε(p), and two points are considered density-connected if there exists a chain of density-reachability linking them. In DBSCAN, a cluster is defined as the maximal set of points that are mutually density-connected [].
Algorithmically, DBSCAN iterates over unvisited points: if a point is a core, the algorithm initiates a new cluster and expands it by recursively adding all density-reachable points; if it is not a core, the point is temporarily labeled as noise, but it may later be reclassified as a border point if found to lie within Nε of a core. This approach makes DBSCAN robust to noise and eliminates the need to specify the number of clusters in advance.
3. Results
3.1. System Design Result
The system design is presented in Figure 4. The components include an Arduino Uno connected to an AD8232 ECG sensor, which is attached to the subject’s body for heart rate measurement. Two flex sensors mounted on gloves are placed on the middle fingers of both hands to detect the patient’s motor response. The Arduino Uno microcontroller is used to measure and process the readings from the sensors. After the sensor data is collected by the Arduino Uno, it is sent to the ESP32 via serial communication. The ESP32, which has Wi-Fi connectivity capabilities, then sends the data received from the Arduino Uno to the Blynk platform. Through Blynk, these data can be monitored in real time via the web and smartphone applications, enabling effective remote monitoring.
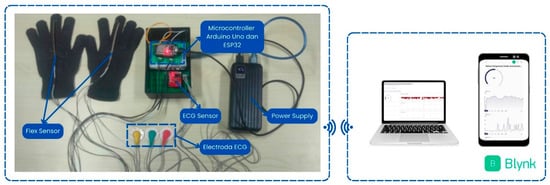
Figure 4.
System design result.
3.2. Sensor Calibration Results
3.2.1. AD8232 Electrocardiogram Sensor Calibration
The sensor was tested by placing the red electrode (right) on the right wrist, the yellow electrode (left) on the left wrist, and the green electrode (ground) on the right ankle. For ECG calibration, simultaneous recordings from the ECG sensor (AD8232) and the fingertip pulse oximeter were collected for one minute per calibration point, comprising 10 samples from each sensor. The mean value of these readings was used as the representative measurement for that interval. The measurement period spanned 15 min, with data collection occurring at 1 min intervals. The sensor measurement data are shown in Table 1.

Table 1.
ECG sensor calibration data.
Comparative heart rate measurements were conducted on a 22-year-old female participant over a 15 min period, with data collected at one-minute intervals. The AD8232 sensor readings yielded an average heart rate of 82 bpm, compared to 81 bpm measured by fingertip pulse, resulting in a correction value of 1 bpm, a relative error of 0.4%, and an accuracy rate of 99.6%. These results are consistent with previous studies on single-lead ECG sensors. Sugunakar et al. reported a strong positive correlation between heart rate measurements obtained from the AD8232 sensor and those from clinically validated ECG monitors (r = 0.9, p < 0.001), demonstrating the sensor’s reliability for basic monitoring []. Similarly, Novitasari et al. reported high accuracy in smartphone-based ECG systems, with an error rate of 0.042%, sensitivity of 99.84%, and a positive predictive value of 97.06% []. Collectively, these findings corroborate the high accuracy and reliability of the AD8232 sensor observed in the present study. For a more robust validation, we evaluated the sensor’s error in beats per minute (bpm). The Mean Absolute Error (MAE) was 1.4 bpm, representing the average absolute difference between the sensor and the fingertip reference. We also calculated the Root Mean Square Error (RMSE), which penalizes larger deviations more heavily, and obtained a value of 1.91 bpm. The close proximity of the RMSE to the MAE indicates that the sensor’s measurement errors are consistent and not significantly affected by large outliers [,].
3.2.2. Flex Sensor Calibration
The calibration of the flex sensor was conducted by comparing the sensor’s angle measurement with the corresponding angle degree on an arc ruler. The microcontroller reads the analog-to-digital converter (ADC) value of the flex sensor, which corresponds to the output voltage (Vout). During calibration, the flex sensor is pressed against the ruler and adjusted to align with the desired angle degree. Calibration measurements were taken within a range of 0° to 170°, with a step size of 5°. In this study, two flex sensors were utilized, each calibrated under identical conditions. For the flex sensor, each angular position was measured three times (n = 3) using a mechanical protractor, and the average value was used to construct the calibration curve. These repetitions minimize random variations and ensure that the calibration curves in Figure 5 and Figure 6 represent stable and reproducible sensor responses.
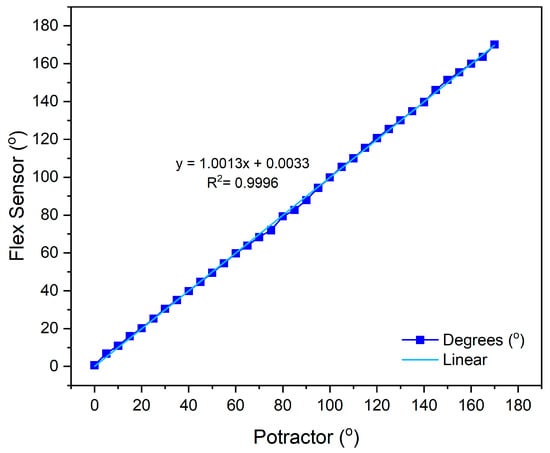
Figure 5.
Calibration results of flex sensor 1.
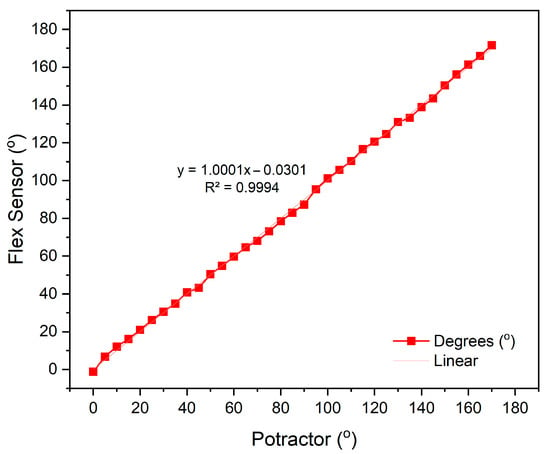
Figure 6.
Calibration results of flex sensor 2.
The calibration results of flex sensor 1, with a linear equation , obtained an accuracy rate of 98.8% with an average error value of 1.2%, as shown in Figure 5. For flex sensor 2, the linear equation y = 1.0001x − 0.0301 yielded an accuracy of 98.2% with an average error of 1.8%, as shown in Figure 6. These results indicate that both sensors exhibit very high linearity and minimal measurement error, confirming their reliability for precise kinematic assessment in healthcare monitoring applications. This performance is consistent with Chen et al., who reported that flexible sensors integrated into smart garments provided accurate joint angle estimation and low EMG prediction errors, validating their utility for continuous muscle activity monitoring []. Collectively, these findings confirm that the calibrated flex sensors employed in this study possess high precision, consistency, and practical relevance for real-time motor activity monitoring.
3.3. Parameters Quality of Service (QoS)
In this system testing, the Quality of Service (QoS) parameters measured include delay, jitter, and packet loss. These three parameters are used to evaluate the performance and stability of data communication between the ESP32 microcontroller and the Blynk server over a Wi-Fi network []. The testing was carried out under two environmental conditions: an indoor environment with a measurement range of 0 m to 8 m and an outdoor environment with a range of 0 m to 30 m. The delay was calculated as the difference between the data transmission and reception times, which was then analyzed to determine the transmission speed of the data. The measurement results are presented in Figure 7a,b.
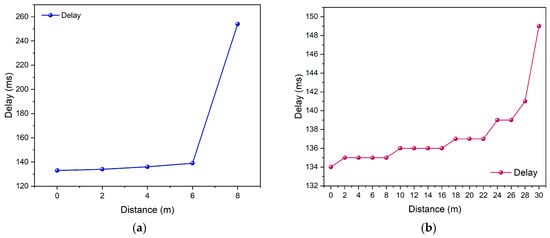
Figure 7.
Delay testing (a) enclosed space and (b) open space.
Figure 7a illustrates the delay test results in an indoor environment, where the highest delay was recorded at a distance of 8 m, reaching 254 ms, with an average delay of 159.2 ms. Meanwhile, Figure 7b presents the outdoor test results, where the maximum latency was 303.149 ms at a distance of 30 m, with an average latency of 137.3 ms. These latency values fall within the acceptable range for real-time health monitoring applications. Similar performance was reported by Younas et al., who emphasized that IoT-based healthcare systems supported by edge computing typically achieve sufficiently low latency to ensure reliable continuous monitoring []. After conducting both tests, critical distances were identified at approximately 6 m in the enclosed environment and 28 m in the open environment, primarily due to differences in signal propagation characteristics. In enclosed environments, Wi-Fi signals undergo significant reflection, diffraction, and multipath interference from surrounding walls and metallic structures, leading to rapid signal attenuation. In contrast, the open environment provides a clear line-of-sight (LoS) path between the transmitter and receiver, allowing the signal to propagate farther with minimal loss before falling below the reception threshold.
Furthermore, the jitter parameter was also measured to assess the stability of packet arrival times during data transmission. A high jitter value indicates significant variations in packet arrival intervals, which may lead to delays in data updates within the monitoring system [].
Based on the test results shown in Figure 8a, the jitter value in the indoor environment was 21.2 ms, while Figure 8b shows that the jitter value in the outdoor environment was 23.1 ms. The slight increase in jitter observed in the outdoor environment indicates signal fluctuations and a higher likelihood of environmental interference. Nevertheless, these values remain within the acceptable limits for wireless communication systems. Another evaluated parameter was packet loss, which measures the percentage of data packets that failed to reach the server due to signal disturbances or network quality degradation []. A comparison of packet loss values is presented in Figure 9a,b.
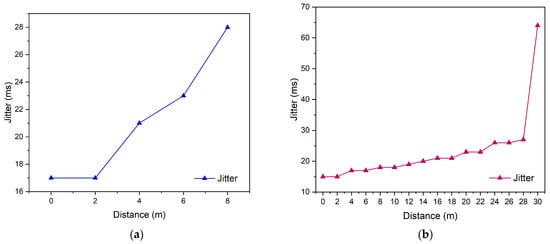
Figure 8.
Jitter testing (a) enclosed space and (b) open space.
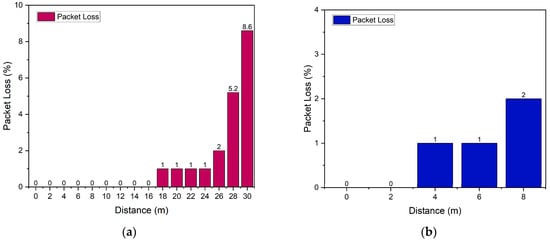
Figure 9.
Packet loss testing (a) enclosed space and (b) open space.
Based on the test results, the packet loss value in the indoor environment was 0.8%, while in the outdoor environment, it was 1.3%. Although a slight increase was observed under outdoor conditions, both values are considered excellent, as they remain below the 2% threshold recommended by ITU-T Y.1541 []. This indicates that the system is capable of maintaining reliable data transmission with a very low packet loss rate. Overall, the analysis of the three QoS parameters demonstrates that the communication system based on the ESP32 and Blynk platform exhibits stable and efficient performance for real-time Internet of Things (IoT) monitoring applications, both in indoor and outdoor environments. Therefore, the system is considered feasible for continuous data transmission across various testing conditions.
3.4. Sensor Test Result
Data for monitoring physiological activity and sleep states were collected by measuring heart rate and motor responses over a 24 h period. Measurements were conducted on individuals during both active and sleep periods, providing insights into heart rate during consciousness and reduced levels of consciousness during sleep.
Figure 10 illustrates the heart rate measurements recorded every minute. The lowest recorded heart rate was 52 bpm, while the highest was 96 bpm, resulting in an average heart rate of 77.4 bpm. The participant was asleep for 8 h, from 02:00 to 10:00 GMT+8. According to previous research conducted by Cathy, heart rates during sleep in adults range from 32 bpm to 89 bpm []. During active periods, the heart rate was observed to range from 60 bpm to 96 bpm. Additionally, research by Ahammed et al. indicates that a normal heart rate ranges from 60 bpm to 100 bpm [,]. Motor response measurements ranged from 0° to 165°, with an average of 52.5°. These measurements reflect fluctuations in the subject’s heart rate, providing insights into their level of consciousness. The data indicates that the lack of motor response observed from 02:00 GMT+8 to 10:00 GMT+8 is attributable to the subject being in a state of sleep, which corresponds to a decrease in consciousness levels.
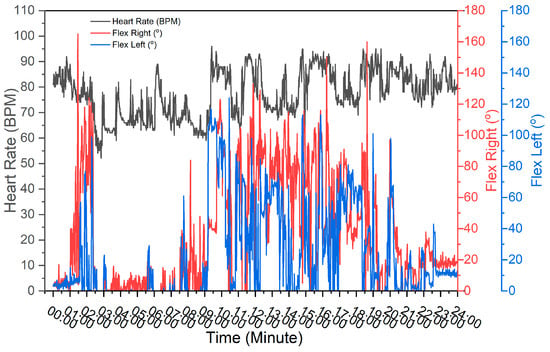
Figure 10.
Measurement data results of the physiological activity and sleep state monitoring system.
3.5. Machine Learning Analysis with DBSCAN
3.5.1. Data Preprocessing
Before clustering, preprocessing was performed to improve the quality and comparability of the signals. The measured dataset comprised three synchronized signals: heart rate, left flex, and right flex. The two flex channels were scaled and then combined using principal component analysis (PCA). Consequently, the attributes were reduced to two: heart rate and the flex PCA component. Both channels were subsequently standardized to eliminate scale effects and stabilize the representation-learning process.
Figure 11 illustrates the heart-rate series and the scaled flex PCA component, showing structural consistency with the raw data (Figure 10). Both heart rate and flex values reached their lowest levels between 02:00 and 10:00 GMT+8, consistent with the sleep interval visualized in Figure 10. The visual alignment between the reduced/standardized signals and the raw data indicates that dimensionality reduction preserved the relevant temporal patterns. This provides validity for employing Flex PCA in subsequent analyses.
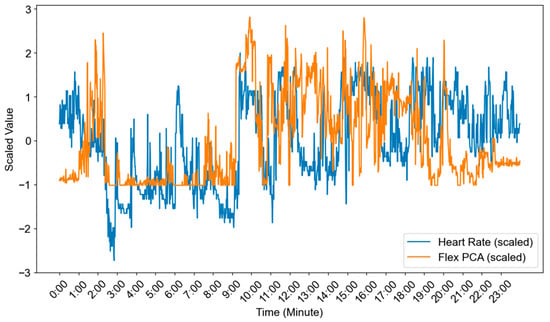
Figure 11.
Time-series data after dimensionality reduction and normalization.
The standardized series was segmented into sliding windows of 30 samples with a step of 5 samples (≈83.3% overlap). From 1440 samples (one day), this produced 283 windows, calculated as (1440 − 30)/5 + 1. Each window was transformed into a fixed-dimensional vector using TS2Vec, a self-supervised representation-learning method for time series. The resulting embeddings were then used for DBSCAN clustering and t-SNE visualization.
3.5.2. Clustering Results
Before applying DBSCAN, the neighborhood radius (ε) was determined using a k-distance plot with k = 5. For each window embedding, the Euclidean distance to its 5th nearest neighbor was calculated, and the results were then sorted to reveal the characteristic “elbow” pattern. Following standard practice, the elbow point provided a data-driven estimate of ε in the TS2Vec embedding space. Figure 12 presents the k-distance plot used to obtain the optimal ε.
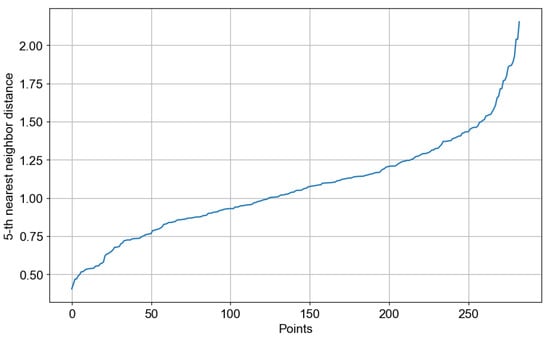
Figure 12.
k-distance plot.
The training process employed the official TS2Vec library for embedding and scikit-learn for clustering. The model was trained from scratch using our 283-window dataset, without relying on any pretrained weights. Specifically, TS2Vec was trained for 20 epochs with an output dimension of 32, while DBSCAN was configured with an epsilon value of 1.5 and a minimum point threshold (minPts) of 16.
Inspection of the k-distance plot revealed an elbow around ε ≈ 1.5. DBSCAN was then trained with ε = 1.5 and min_samples = 16 using Euclidean distance on the standardized embeddings, yielding four reproducible activity states (Clusters 0–3) and one set of outliers (−1). These outliers were primarily associated with transient body movements or brief sensor readjustments during data collection. They were identified and excluded during preprocessing to ensure that the clustering results reflected only stable and representative physiological patterns. The temporal distribution of these states was consistent with the subject’s daily cycle, mapping nighttime rest periods, transitional phases in the evening, and daytime activity blocks. Table 2 presents descriptive statistics for each cluster, including mean/variance of heart rate, mean/variance of left and right flex, and the number of windows, which serve as a quantitative basis for subsequent interpretation.

Table 2.
Cluster-wise summary of heart rate and motor responses (DBSCAN on TS2Vec embeddings).
Cluster 2 (n = 71; ≈02:00–10:00 GMT+8) exhibited the calmest physiological and behavioral state. Heart rate was at its lowest level (66.8 bpm; variance 17.0), while limb movement was minimal and stable (right flex mean 6.6°, variance 95.9; left flex mean 2.8°, variance 59.9). These statistics, together with the nighttime interval, are consistent with sleep conditions. The combination of low average movement and low variability indicates little postural change and the absence of major bursts of movement, which are characteristic of sustained sleep.
Cluster 0 (n = 60; ≈19:30–01:00 GMT+8) represented a calm wakeful state, likely corresponding to the transition period towards sleep. Heart rate was higher than during sleep (82.3 bpm; variance 20.1), but movement amplitude remained small with narrow dispersion (right flex 14.1°, variance 74.0; left flex 7.6°, variance 49.1). This pattern indicates wakefulness with limited movement—e.g., lying down, reading or scrolling on a smartphone, or conversing—consistent with reduced motor output but slightly higher activity than during sleep.
Cluster 1 (n = 51; ≈12:00–18:00 GMT+8) represented routine daytime activity. Cardiovascular load was in the medium range (75.5 bpm; variance 23.0), while both motor sensors exhibited larger and more variable amplitudes (right flex 67.2°, variance 514.6; left flex 45.8°, variance 384.7). These windows likely encompassed typical daily activities such as eating, self-care, smartphone use, or walking. The systematic dominance of right-hand flex over the left suggests right-hand-dominant behavior (e.g., using utensils or a smartphone), which may serve as a simple functional marker for long-term monitoring.
Cluster 3 (n = 60; ≈15:00–19:00 GMT+8) represented the period of highest intensity. Heart rate reached the highest average (86.4 bpm; variance 27.0), and movement variability increased sharply (right flex variance 864.9; left flex variance 769.9) with large mean angles (right 62.3°, left 33.9°). This kinematic pattern was likely caused by the subject engaging in high-intensity activities such as exercise or brisk walking. The partial temporal overlap between Clusters 1 and 3 in the afternoon supports interpreting Cluster 3 as a high-intensity segment embedded within a broader activity block.
The cluster labeled −1 by DBSCAN (n = 41) can be interpreted as transitional or artifactual (noise) segments rather than a coherent behavioral state. Although heart rate was at a moderate level (77.4 bpm; variance 44.8), movement variability was extremely high (right flex variance 793.1; left flex variance 585.6), a pattern often arising from rapid postural changes, sensor adjustments, or brief transitions between states. These outliers accounted for approximately one-seventh of all windows. It is important to note that the identification of 41 noise windows (14.5% of the data) is a valuable feature of the unsupervised DBSCAN approach, not a limitation. These segments, characterized by high kinematic variability, represent transitional states that do not belong to the four stable, identified physiological states. Isolating them is methodologically crucial, as it prevents contamination of the primary clusters and enhances the fidelity of the resulting subject-specific behavioral map.
Overall, k-distance-based parameterization (ε = 1.5; min_samples = 16) produced a compact and physiologically meaningful state space: nighttime sleep (Cluster 2), a calm pre-sleep period with low movement (Cluster 0), routine daytime activity extending into the afternoon (Cluster 1), and a high-intensity period in the late day (Cluster 3). The relationship between motor variability and heart rate levels across clusters indicates coherent shifts in activity load. Practically, this data-driven clustering can serve as a participant-specific “behavioral map” to monitor recovery, quantify sleep–wake organization, and flag unusual deviations for clinical review.
3.5.3. Visualization of Clusters
To visualize the clusters, TS2Vec embeddings were projected into two dimensions using t-SNE. t-SNE models pairwise neighborhood probabilities in the high-dimensional space and the low-dimensional embedding, and it optimizes the mapping by minimizing the Kullback–Leibler divergence. This approach preserves the proximity of similar points and reveals clustering patterns for easier observation. The use of t-SNE for exploring data separability is well established and supported by recent methodological evaluations of dimensionality reduction [].
Figure 13 presents the 2-D t-SNE distribution labeled according to the DBSCAN results, consisting of Clusters 0–3 and one outlier set (−1). In DBSCAN, the ‘outlier’ or ‘noise’ set (labeled as −1) formally represents data points that do not belong to any dense cluster. This arrangement demonstrates that TS2Vec features separated coherent physiological states, while noise windows were mostly located at cluster boundaries, consistent with transitional or artifactual segments. t-SNE serves only as a qualitative visualization and should not be over-interpreted in terms of global distances. Cluster analysis and quantitative statistics are best conducted in the original embedding space.
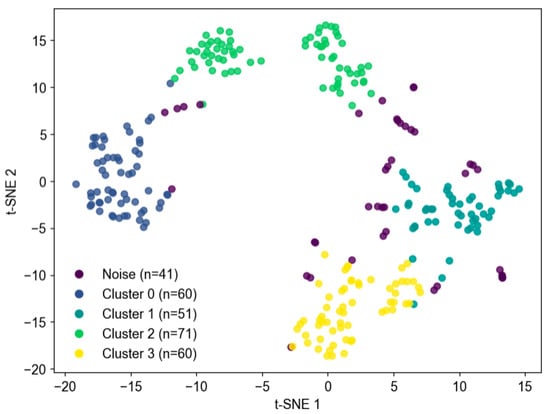
Figure 13.
Cluster visualization using t-SNE.
4. Discussion
Human heart rate is influenced by several internal and external factors that interact through physiological and environmental mechanisms []. Physiologically, age affects heart rate, with infants having higher heart rates than adults [,], while athletes tend to have lower resting heart rates due to increased pumping efficiency of the heart. Physical activity also plays an important role [,], with exercise increasing the heart rate to meet the body’s oxygen needs, while resting or sleeping slows the heart rate due to the dominance of parasympathetic activity. Psychological conditions such as stress or anxiety can increase the heart rate through the release of stress hormones such as adrenaline [], while relaxation and meditation can decrease the heart rate through parasympathetic nerve stimulation []. In addition, health conditions such as fever, thyroid disease, or heart disease can significantly affect heart rhythm.
Environmental factors, such as hot temperatures, cause the heart rate to increase as the body works to cool itself through vasodilation, while at high altitudes, the low oxygen pressure forces the heart to beat faster to support the body’s needs []. The body’s circadian rhythm also plays a role, as the heart rate tends to be slower at night when the body is resting []. Understanding these factors is critical to maintaining cardiovascular health, as significant deviations from normal patterns can be an indicator of the body’s health.
Heart rate and motor response are closely interconnected; variations in heart rate are often associated with different physical activities (motor responses), serving as indicators of the single subject’s physiological activity and sleep states []. When the subject is conscious and engaged in activity, the heart rate tends to rise, peaking between 90 bpm and 96 bpm. This elevation in heart rate signifies that the subject is moving, conversing, or participating in various activities. In the context of consciousness monitoring, this pattern of increased heart rate can be interpreted as an indication that the subject is alert and interacting with their environment. Conversely, a decrease in heart rate to the range of 50 bpm to 60 bpm typically occurs when the subject is at rest or sleeping, indicating reduced motor activity. From a consciousness monitoring perspective, a consistent decline in heart rate, accompanied by minimal motor activity, may signify a sleep phase or a state of decreased consciousness, such as when the subject loses awareness [].
Beyond descriptive analysis, machine learning–based clustering provided additional insights into subject state dynamics. Using TS2Vec embeddings of the synchronized heart rate and flex sensor data, DBSCAN revealed four physiologically interpretable clusters along with one set of outliers. Cluster 2, occurring primarily during nighttime hours, corresponded to sleep, characterized by low and stable heart rate and minimal movement. Cluster 0 reflected quiet wakefulness in the pre-sleep period, with moderate heart rate and limited motor activity. Cluster 1 represented routine daytime activity with moderate cardiovascular load and increased, asymmetric limb movement, while Cluster 3 captured high-intensity activity with the highest heart rate and movement variability. Outliers (−1) were largely transitional or artifactual segments, marked by sudden posture changes or sensor adjustments. This stratification shows that unsupervised learning can generate a subject-specific behavioral map that aligns with physiological expectations. Such clustering supports long-term monitoring, sleep–wake profiling, and detection of unusual deviations that may warrant clinical attention.
One of the key challenges in this study was the limited dataset—283 segments of time-series data—used in combination with the TS2Vec model. Deep learning models typically require large datasets to prevent overfitting; however, this limitation was mitigated through a self-supervised learning approach that enables the model to extract meaningful patterns without labeled data and with less information overall. Evidence that the model generalized well comes from the results themselves: DBSCAN applied to the TS2Vec embeddings produced four distinct clusters that aligned with the participants’ daily physiological rhythms. This result indicates that the model successfully captured the underlying patterns.
While this study did not include a detailed sensitivity analysis of model parameters (e.g., window length, embedding dimension) or an ablation comparison between TS2Vec and traditional statistical features, the chosen 30-sample window effectively captured distinct behavioral segments. Nevertheless, formal optimization of these parameters remains an important direction for future research to further enhance and validate the proposed monitoring pipeline. In addition, although our DBSCAN model was validated against a ground-truth sleep log, future studies should also evaluate its performance against other clustering algorithms—such as HDBSCAN and K-means—to further assess the robustness of the identified physiological states.
5. Conclusions
This study investigated the relationship between heart rate and motor responses as indicators for monitoring physiological activity and sleep states in a single subject. The 24 h heart rate correlated with the level of physical activity. Specifically, increased heart rate corresponded with greater movement and increased activity, while periods of rest or sleep were associated with lower heart rate and reduced movement. DBSCAN successfully grouped the data into four meaningful clusters. Each cluster consistently represented a distinct physiological state, ranging from nighttime sleep (lowest heart rate and movement) to high-intensity daily activity (highest heart rate and movement). These results demonstrate that the unsupervised learning approach can effectively transform raw sensor data into an interpretable, subject-specific state map for continuous monitoring of physiological activity and sleep patterns in a non-clinical setting.
Author Contributions
Conceptualization, A.A. and B.A.; methodology, A.A., H.H. and A.S.I.; software, H.H. and J.A.P.; validation, A.A., I.I. and B.A.; formal analysis, H.H., I.L. and A.S.I.; investigation, A.A., I.I., I.L. and J.A.P.; resources, A.A., J.A.P., I.L. and I.I.; data curation, A.A., I.L., I.I., J.A.P., B.A. and A.; writing—original draft preparation, H.H.; writing—original draft preparation, H.H.; writing—review and editing, A.A. and B.A.; visualization, A.S.I., J.A.P. and A.; supervision, A.A. and I.I. All authors have read and agreed to the published version of the manuscript.
Funding
This research was funded by Hasanuddin University under the PFK UNHAS 2024 project, “Real-Time Physiological Activity and Sleep State Monitoring System Using TS2Vec Embeddings and DBSCAN Clustering for Heart Rate and Motor Response Analysis in IoMT” (contract no. 00309/UN4.22/PT.01.03/2024).
Institutional Review Board Statement
The study was conducted in accordance with the Declaration of Helsinki, and the protocol was approved by the Health Research Ethics Committee of the Faculty of Dentistry, Hasanuddin University (Protocol No. UH17121011; Approval No. 0272/PL.09/KEPK FKG-RSGM UNHAS/2023; Approval Date: 28 December 2023).
Informed Consent Statement
All participants were informed about the objectives and procedures of the study, and written informed consent was obtained from each participant prior to their involvement in the research.
Data Availability Statement
The original contributions presented in this study are included in the article. Further inquiries can be directed to the corresponding author.
Acknowledgments
The authors would like to thank PFK UNHAS 2024 for their support of this research.
Conflicts of Interest
The authors declare no conflicts of interest.
References
- Freijser, L.; Annear, P.; Tenneti, N.; Gilbert, K.; Chukwujekwu, O.; Hazarika, I.; Mahal, A. The Role of Hospitals in Strengthening Primary Health Care in the Western Pacific. Lancet Reg. Health West. Pac. 2023, 33, 100698. [Google Scholar] [CrossRef]
- Angelucci, A.; Greco, M.; Cecconi, M.; Aliverti, A. Wearable Devices for Patient Monitoring in the Intensive Care Unit. Intensive Care Med. Exp. 2025, 13, 26. [Google Scholar] [CrossRef]
- Edlow, B.L.; Fecchio, M.; Bodien, Y.G.; Comanducci, A.; Rosanova, M.; Casarotto, S.; Young, M.J.; Li, J.; Dougherty, D.D.; Koch, C.; et al. Measuring Consciousness in the Intensive Care Unit. Neurocrit. Care 2023, 38, 584–590. [Google Scholar] [CrossRef]
- Amiri, M.; Raimondo, F.; Fisher, P.M.; Cacic Hribljan, M.; Sidaros, A.; Othman, M.H.; Zibrandtsen, I.; Bergdal, O.; Fabritius, M.L.; Hansen, A.E.; et al. Multimodal Prediction of 3- and 12-Month Outcomes in ICU Patients with Acute Disorders of Consciousness. Neurocrit. Care 2024, 40, 718–733. [Google Scholar] [CrossRef]
- Górska, U.; Rupp, A.; Celikel, T.; Englitz, B. Assessing the State of Consciousness for Individual Patients Using Complex, Statistical Stimuli. Neuroimage Clin. 2021, 29, 102471. [Google Scholar] [CrossRef]
- Lee, S.-J.; Chen, Y.-L.; Wu, T.-H.; Liu, C.-Y.; Wang, C.-H.; Tsai, C.-H.; Chung, J.-Y.; Yiang, G.-T.; Wu, M.-Y. Comparison of Glasgow Coma Scale, Motor Component, Eye Component, and Simplified Motor Scale for Predicting Trauma Outcomes: A 13-Year Multicenter Retrospective Cohort Study. BMC Emerg. Med. 2025, 25, 86. [Google Scholar] [CrossRef]
- Bodenes, L.; N’Guyen, Q.-T.; Le Mao, R.; Ferrière, N.; Pateau, V.; Lellouche, F.; L’Her, E. Early Heart Rate Variability Evaluation Enables to Predict ICU Patients’ Outcome. Sci. Rep. 2022, 12, 2498. [Google Scholar] [CrossRef]
- Oktavian, P.; Haryanto, F.; Salman, A.H.; Raindini, R.; Suprijadi, S. A Real-Time Heart Rate Signal Detection Using an Electronic Stethoscope with Labview. J. Biomed. Phys. Eng. 2020, 10, 375–382. [Google Scholar] [CrossRef]
- Altıntop, Ç.G.; Latifoğlu, F.; Karayol Akın, A.; Çetin, B. A Novel Approach for Detection of Consciousness Level in Comatose Patients from EEG Signals with 1-D Convolutional Neural Network. Biocybern. Biomed. Eng. 2022, 42, 16–26. [Google Scholar] [CrossRef]
- Yue, Z.; Wang, Y.; Duan, J.; Yang, T.; Huang, C.; Tong, Y.; Xu, B. TS2Vec: Towards Universal Representation of Time Series. Proc. AAAI Conf. Artif. Intell. 2022, 36, 8980–8987. [Google Scholar] [CrossRef]
- Kim, S.; Sun, M.; Petrunin, I.; Shin, H.-S. DBSCAN-Based Particle Gaussian Mixture Filters. Digit. Signal Process 2026, 168, 105546. [Google Scholar] [CrossRef]
- Liu, Z.; Alavi, A.; Li, M.; Zhang, X. Self-Supervised Contrastive Learning for Medical Time Series: A Systematic Review. Sensors 2023, 23, 4221. [Google Scholar] [CrossRef]
- Mehari, T.; Strodthoff, N. Self-Supervised Representation Learning from 12-Lead ECG Data. Comput. Biol. Med. 2022, 141, 105114. [Google Scholar] [CrossRef]
- Kaverinskiy, V.; Chaikovsky, I.; Mnevets, A.; Ryzhenko, T.; Bocharov, M.; Malakhov, K. Scalable Clustering of Complex ECG Health Data: Big Data Clustering Analysis with UMAP and HDBSCAN. Computation 2025, 13, 144. [Google Scholar] [CrossRef]
- Zakri, A.A.; Putri, Y.R.A.R.Q.; Romadoni, S.; Hasneli, Y. IoT-Based Flex Sensor Gloves for Immobility Patients: A Prototype. Int. J. Adv. Sci. Eng. Inf. Technol. 2024, 14, 920–927. [Google Scholar] [CrossRef]
- Sangeethalakshmi, K.; Preethi Angel, S.; Preethi, U.; Pavithra, S.; Shanmuga Priya, V. Patient Health Monitoring System Using IoT. Mater. Today Proc. 2023, 80, 2228–2231. [Google Scholar] [CrossRef]
- Tyagi, S.; Singhal, H.; Gupta, T.; Mehrotra, K.; Kumar, A. Health Monitoring System Using ECG and PPG Techniques. Int. J. Sci. Res. Arch. 2024, 12, 3. [Google Scholar] [CrossRef]
- ISO 80601-2-61:2017; Medical Electrical Equipment—Part 2-61: Particular Requirements for Basic Safety and Essential Performance of Pulse Oximeter Equipment. International Electrotechnical Commission (IEC): London, UK, 2019.
- Galli, A.; Montree, R.J.H.; Que, S.; Peri, E.; Vullings, R. An Overview of the Sensors for Heart Rate Monitoring Used in Extramural Applications. Sensors 2022, 22, 4035. [Google Scholar] [CrossRef] [PubMed]
- Souza, A.S.; Bezerra, M.A.; Cerqueira, U.M.F.M.; Rodrigues, C.J.O.; Santos, B.C.; Novaes, C.G.; Almeida, E.R.V. An Introductory Review on the Application of Principal Component Analysis in the Data Exploration of the Chemical Analysis of Food Samples. Food Sci. Biotechnol. 2024, 33, 1323–1336. [Google Scholar] [CrossRef] [PubMed]
- Khanizadeh, F.; Ettefaghian, A.; Wilson, G.; Shirazibeheshti, A.; Radwan, T.; Luca, C. Smart Data-Driven Medical Decisions through Collective and Individual Anomaly Detection in Healthcare Time Series. Int. J. Med. Inform. 2025, 194, 105696. [Google Scholar] [CrossRef] [PubMed]
- Sugunakar, M.B.S.; Maruthy, K.N.; Srinivas, C.H.; Johnson, P. A Comparative Study between Single Lead AD8232 Heart Rate Monitor and Standard Electrocardiograh to Acquire Electrocardiographic Data for Cardiac Autonomic Function Testing. Indian J. Sci. Technol. 2021, 14, 534–540. [Google Scholar] [CrossRef]
- Novitasari, A.; Nuryani, N.; Darsono, D. Android-Based Wireless Single-Lead Electrocardiogram: Heart Rate Measurement and ECG Signal Visualization. Kinet. Game Technol. Inf. Syst. Comput. Netw. Comput. Electron. Control. 2024, 9, 253. [Google Scholar] [CrossRef]
- Balakarthikeyan, V.; Jais, R.; Vijayarangan, S.; Sreelatha Premkumar, P.; Sivaprakasam, M. Heart Rate Variability Based Estimation of Maximal Oxygen Uptake in Athletes Using Supervised Regression Models. Sensors 2023, 23, 3251. [Google Scholar] [CrossRef]
- Meza, C.; Juega, J.; Francisco, J.; Santos, A.; Duran, L.; Rodriguez, M.; Alvarez-Sabin, J.; Sero, L.; Ustrell, X.; Bashir, S.; et al. Accuracy of a Smartwatch to Assess Heart Rate Monitoring and Atrial Fibrillation in Stroke Patients. Sensors 2023, 23, 4632. [Google Scholar] [CrossRef]
- Chen, Z.; Wang, Q.; Bi, Y.; Lin, J.; Yang, W.; Deng, C.; Guo, S.; Liao, M. Analyzing Human Muscle State with Flexible Sensors. J. Sens. 2022, 2022, 1–11. [Google Scholar] [CrossRef]
- Rostami, M.; Goli-Bidgoli, S. An Overview of QoS-Aware Load Balancing Techniques in SDN-Based IoT Networks. J. Cloud Comput. 2024, 13, 89. [Google Scholar] [CrossRef]
- Younas, M.I.; Iqbal, M.J.; Aziz, A.; Sodhro, A.H. Toward QoS Monitoring in IoT Edge Devices Driven Healthcare—A Systematic Literature Review. Sensors 2023, 23, 8885. [Google Scholar] [CrossRef]
- Khan, Z.A.; Ambhaikar, A. The Impact of QoS Parameters on the Performance of IoT Applications. Int. J. Intell. Syst. Appl. Eng. 2024, 12, 4351. Available online: https://ijisae.org/index.php/IJISAE/article/view/6155 (accessed on 4 November 2025).
- ITU-T Y.1541; Network Performance Objectives for IP-Based Services. International Telecommunication Union (ITU-T): Geneva, Switzerland, 2011.
- Speed, C.; Arneil, T.; Harle, R.; Wilson, A.; Karthikesalingam, A.; McConnell, M.; Phillips, J. Measure by Measure: Resting Heart Rate Across the 24-Hour Cycle. PLoS Digit. Health 2023, 2, e0000236. [Google Scholar] [CrossRef] [PubMed]
- Ahammed, S.; Hassan, N.; Cheragee, S.H.; Islam, A.Z.M.T. An IoT-Based Real-Time Remote Health Monitoring System. Int. J. Recent Eng. Sci. 2021, 8, 23–29. [Google Scholar] [CrossRef]
- Niharika, M.; Saicharan, M.; Preethi, V.; Chaitanya, K.; Sathis, M. Heart Pulse Rate Detection and Alerting Using Arduino with GSM Module. J. Electron. Autom. Eng. 2023, 2, 58–63. [Google Scholar] [CrossRef]
- Wang, Y.; Huang, H.; Rudin, C.; Shaposhnik, Y. Understanding How Dimension Reduction Tools Work: An Empirical Approach to Deciphering t-SNE, UMAP, TriMap, and PaCMAP for Data Visualization. J. Mach. Learn. Res. 2021, 22, 1–73. [Google Scholar]
- Sieciński, S.; Kostka, P.S.; Tkacz, E.J. Heart Rate Variability Analysis on Electrocardiograms, Seismocardiograms and Gyrocardiograms on Healthy Volunteers. Sensors 2020, 20, 4522. [Google Scholar] [CrossRef] [PubMed]
- Dhanush Gowda, P. V IOT Based Health Monitoring System. Int. J. Res. Appl. Sci. Eng. Technol. 2020, 8, 1866–1871. [Google Scholar] [CrossRef]
- Zhang, J. Effect of Age and Sex on Heart Rate Variability in Healthy Subjects. J. Manip. Physiol. Ther. 2007, 30, 374–379. [Google Scholar] [CrossRef] [PubMed]
- Mielke, G.I.; Doust, J.; Chan, H.-W.; Mishra, G.D. Physical Activity Accumulated Across Adulthood and Resting Heart Rate at Age 41–46 Years in Women: Findings from the Menarche to Premenopause Study. J. Phys. Act. Health 2023, 20, 823–831. [Google Scholar] [CrossRef]
- Choi, J.; Cha, W.; Park, M.-G. Declining Trends of Heart Rate Variability According to Aging in Healthy Asian Adults. Front. Aging Neurosci. 2020, 12, 610626. [Google Scholar] [CrossRef]
- Wiersema, J.M.; Kamphuis, A.E.P.; Rohling, J.H.T.; Kervezee, L.; Akintola, A.A.; Jansen, S.W.; Slagboom, P.E.; van Heemst, D.; van der Spoel, E. The Association Between Continuous Ambulatory Heart Rate, Heart Rate Variability, and 24-h Rhythms of Heart Rate with Familial Longevity and Aging. Aging 2022, 14, 7223–7239. [Google Scholar] [CrossRef]
- Catela, D.; Santos, J.; Oliveira, J.; Franco, S.; Mercê, C. Heart Rate Variability, Blood Pressure and Peripheral Oxygen Saturation during Yoga Adham and Mahat Breathing Techniques without Retention in Adult Practitioners. J. Funct. Morphol. Kinesiol. 2024, 9, 184. [Google Scholar] [CrossRef]
- Black, N.; D’Souza, A.; Wang, Y.; Piggins, H.; Dobrzynski, H.; Morris, G.; Boyett, M.R. Circadian Rhythm of Cardiac Electrophysiology, Arrhythmogenesis, and the Underlying Mechanisms. Heart Rhythm. 2019, 16, 298–307. [Google Scholar] [CrossRef]
- Zakri, A.A.; Arfianti, A.; Hamzah, A.; Iqbal, M.; Madjid, H.; Fikri Aulia, N. Designing Flex Sensor Gloves with Temperature Sensor and Pulse Sensor to Help Stroke Patients. Int. J. Emerg. Technol. Adv. Eng. 2022, 12, 23–31. [Google Scholar] [CrossRef] [PubMed]
- Chalmers, T.; Hickey, B.A.; Newton, P.; Lin, C.-T.; Sibbritt, D.; McLachlan, C.S.; Clifton-Bligh, R.; Morley, J.W.; Lal, S. Associations between Sleep Quality and Heart Rate Variability: Implications for a Biological Model of Stress Detection Using Wearable Technology. Int. J. Environ. Res. Public Health 2022, 19, 5770. [Google Scholar] [CrossRef] [PubMed]
Disclaimer/Publisher’s Note: The statements, opinions and data contained in all publications are solely those of the individual author(s) and contributor(s) and not of MDPI and/or the editor(s). MDPI and/or the editor(s) disclaim responsibility for any injury to people or property resulting from any ideas, methods, instructions or products referred to in the content. |
© 2025 by the authors. Licensee MDPI, Basel, Switzerland. This article is an open access article distributed under the terms and conditions of the Creative Commons Attribution (CC BY) license (https://creativecommons.org/licenses/by/4.0/).