Abstract
This study explores the influence of the urban soundscape on pedestrian perception and walking experience in the historic and lower parts of Béjaïa, Algeria. More precisely, the analysis investigates how variations in soundscape configuration relate to perceived comfort, safety, and walking pleasantness across five morphologically distinct urban zones. A mixed-method approach combining quantitative tools (LAeq acoustic measurements) and qualitative methods (soundwalks, sound diaries, and mental maps) was applied in accordance with ISO 12913. The study involved 50 participants for the sound diaries and 58 for the soundwalks. Results show that natural and social sounds enhance perceived comfort and safety, while mechanical noise is associated with discomfort and avoidance behaviors. In the morning, moderate to strong correlations were observed between sound comfort and visual perception (ρ = 0.58, p = 0.001, 95% CI [0.27; 0.80]), as well as between sound comfort and walking pleasantness (ρ = 0.40, p = 0.033, 95% CI [0.05; 0.67]). The study highlights the need to integrate soundscape considerations into urban planning and heritage conservation strategies.
1. Introduction
Walking in urban areas presents a major challenge for many cities worldwide [,,]. The United Nations (UN) calls for the development of urban spaces that are favorable to walking, in order to face the many current challenges, mainly environmental degradation and the decline in quality of life in cities. The latest IPCC (UN) report considers the increase in the level of walkability in cities as a key strategy to fight against climate change []. Furthermore, the World Health Organization (WHO) highlights the rise in diseases related to people’s sedentary lifestyles and the excessive use of private cars and calls for the encouragement of walking in cities []. Indeed, it is scientifically proven that walking 6000 steps daily has significant benefits for physical and mental health [,].
The quality of the urban environment influences pedestrians’ experience and their willingness to walk. Among the most important factors is the soundscape. This concept was introduced by Murray Schafer in the 1970s. It is defined by ISO 12913-1 (2014) as “the acoustic environment as perceived, experienced and/or understood by one or more people, in a given context.” []. The emergence of the soundscape concept marks the beginning of a new way of studying urban sounds. Indeed, traditional approaches are limited to studying noise levels in cities and reducing noise pollution, whereas the soundscape offers a broader and more holistic dimension of sound environments by taking into account the meaning and emotional and subjective impact of all types of sounds, whether desirable or undesirable []. As a result, the study of the soundscape has made significant progress over the past two decades, with research focusing on users’ subjective perception of urban sounds. However, most studies remain centered on contexts from the Global North, while cities in the Maghreb, particularly those with strong urban dualities (between historic fabric and modern sectors), remain underexplored. Moreover, few studies simultaneously integrate subjective data, objective acoustic metrics (e.g., LAeq), and temporal variations within a single comparative protocol. In this context, the study raises the following question: How does the soundscape influence pedestrians’ perception and walking experience in the two parts of the city of Béjaïa (old city and lower city)?
This research makes three main contributions: (1) an analytical framework linking soundscape, visual ambiance, and walking comfort; (2) a mixed-method protocol aligned with ISO 12913-1:2014 [] and ISO 12913-2:2018 []; and (3) original data from the city of Béjaïa, which extends the literature beyond Global North contexts. The city of Béjaïa represents a highly relevant case study, composed of two contrasting parts (the medina and the modern city), as well as urban fabrics with diverse visual and spatial qualities (pre-colonial, colonial, planned, and spontaneous areas). The study combines qualitative methods including sound journals, soundwalks, and questionnaires with acoustic measurements (LAeq) across five different zones, carefully selected and distributed between the old city (OC) and the lower city (LC).
The following section presents a literature review on the topic of soundscape and urban walking, highlighting the methodologies used in this field of research as well as the main gaps identified. The case study and methodology are then presented, followed by the results, the discussion, and finally the conclusions.
2. Literature Review
2.1. Influence of Urban Soundscapes on Pedestrian Perception, Comfort, and Behavior
Urban noise is one of the most significant factors reducing walking comfort in cities. Noise pollution causes stress, fatigue, and discomfort among the listener, especially when noise exposure is chronic and excessive []. However, to improve the walking experience, it is not enough to only study noise levels and focus solely on reducing their intensity. Many studies have shown that the sound level measured in decibels (dB) accounts for only 20 to 40% of the discomfort experienced by users []. The type and nature of sounds also play an important role in perception. Sounds in urban environments are no longer considered nuisances to be eliminated but elements to be valued for a good walking experience []. For example, several studies indicate that natural sounds such as birdsong, fountains, and rustling leaves are perceived positively by pedestrians and generate positive emotions, in contrast to unpleasant sounds like road traffic noise, which cause anxiety and discomfort [,,]. Other factors, such as cultural characteristics and pedestrian profiles (age, sensitivity, habits), are also important to take into consideration []. Several studies have confirmed that the soundscape influences the cognitive aspect of pedestrians in urban areas. A pleasant sound environment promotes good mental health and improves overall mood. It also supports cognitive recovery by reducing excessive and constant vigilance during walking. Urban noise, especially when it is continuous, causes persistent stress in pedestrians []. This leads to the degradation of urban quality of life and the well-being of residents. In a recent study, F. Aletta et al. called for the study of the soundscape and emphasized that it significantly influences psychological health and social cohesion in cities [].
A noisy street tires pedestrians, pushing them to raise their voices to speak or remain in a constant state of alert while walking. Quiet spaces make urban walking paths more pleasant and increase pedestrians’ level of satisfaction. Soundscapes influence pedestrians’ perception and behavior in different ways. First, in terms of route choice within the city: several studies state that pedestrians often prefer to choose quieter paths, even if it slightly increases the duration of the trip [,]. In a study conducted in Stockholm, Andersson et al. [] state that noisy environments, mainly due to motorized traffic, discourage people from walking. They call on urban planners to take environmental variables such as urban sounds into account to encourage walking [].
Sounds in the city also influence pedestrian behavior. Undesirable sounds in urban areas can change walking speed and may cause pedestrians to either accelerate their pace due to discomfort or, conversely, slow down to enjoy the walk []. This also affects social interactions during walking in the city, as intense noise causes stress and discomfort, which reduces the time spent in space and decreases the desire to engage in conversations between people. Morillas et al. [] confirmed this phenomenon in a recent study, stating that loud sounds interrupt exchanges between people. Another important factor is the feeling of safety. Walking in the city is strongly impacted by the perceived level of safety along different urban routes. Sounds vary by intensity, nature, and origin; some sounds that are too loud in the city, such as traffic noise, can increase the feeling of insecurity among pedestrians by reinforcing the sense of danger. On the other hand, calm sounds, such as the presence of human conversations, can be reassuring in some cases, especially when the space is isolated. In this sense, a space that is too quiet at night, such as an isolated alley, can generate anxiety among pedestrians, which may lead them to avoid it or to use another mode of transport instead of walking. Successful urban spaces are those that offer a balance in the distribution of sounds by designing quiet routes for pedestrians. Accordingly, project initiatives based on urban mapping offer pedestrian’s alternative routes to avoid or reduce exposure to noise by relying on adapted algorithms []. Moreover, the soundscape influences the purpose of walking in the city. Pleasant sounds can encourage leisure and health-related walking, that is, when walking becomes a pleasure and not an obligation. Well-designed spaces with a carefully studied soundscape reinforce this type of walking purpose and thus contribute to the improvement in public health, the reduction in air pollution, and the decrease in the use of private cars.
2.2. Soundscape Analysis Methods: Quantitative and Qualitative Approaches
Several methods have been developed for the study of the soundscape. They include qualitative, quantitative, and sometimes mixed approaches, which may be subjective, objective, or a combination of both [,,]. Quantitative approaches are based on acoustic measurements and modeling. Sound Pressure Level (SPL) measurements are carried out in situ and consist of measuring sound intensity using integrating sound level meters []. ISO 1996-1:2016 [] explains the noise measurement protocol. These methods make it possible to correlate the measurements with comfort levels or to identify areas of noise pollution [,]. This approach often needs to be combined with other methods to accurately characterize a soundscape, as two environments may have the same sound level but produce different perceptions from one person to another. Spectral analysis represents another key measurement approach. This method is based on identifying the different dominant components of the soundscape (natural sounds, human sounds, and others) by analyzing sound frequencies []. In order to bridge the gap between physical measurements and human perception, researchers have developed psychoacoustic index analysis. They use software such as ArtemiS SUITE, developed by HEAD Acoustics to analyze recordings and identify the characteristics of the sound signal, such as loudness, sharpness, and roughness []. This makes it possible to evaluate perceived sound quality. For example, a sound with a moderate level can be perceived as very disturbing due to a strong tonality. Another category of quantitative approaches is acoustic modeling and sound mapping. Several simulation software tools have been developed to predict the propagation of sound in the urban environment. These modeling tools are based on the input of a set of urban data such as the layout and shape of buildings, the road network, topography, sound sources, etc., and enable visualization of sound distribution in the urban fabric and the application of different scenarios to enhance the quality of the soundscape [,]. These tools are more effective than isolated measurements, but they are not sufficient on their own for analyzing sound comfort, as they do not take human perceptions into account.
The second major category of methods for studying the soundscape is qualitative methods. A primary type of qualitative method is the use of subjective surveys. Researchers often use questionnaires to collect information about sounds from residents or passersby [,]. These surveys can be conducted either on-site or in laboratory settings and often use the Likert scale. ISO/TS 12913-2:2018 [] proposes an evaluation of sound perception based on a 5-point scale ranging from “not at all” to “extremely,” and ISO/TS 15666:2021 [] helps quantify annoyance due to noise. In addition to questionnaires, qualitative interviews or focus groups are often used for an in-depth exploration of people’s opinions, as well as their emotions and memories associated with the soundscape [,].
Soundwalks are a widely used method among researchers to study pedestrians’ perceptions in relation to the soundscape. It consists of conducting walks with participants along predefined routes, often while simultaneously taking sound measurements [,]. Participants listen to the sounds in the environment and then express their perceptions and emotions in different ways: either by filling out a questionnaire, participating in discussions, drawing mental maps, or even taking photos. ISO/TS 12913-2:2018 provides the necessary recommendations for successfully conducting soundwalks []. This method is considered effective because it places the researcher in close proximity to the participant and it allows for a better comparison between objective and subjective data. Non-participant or behavioral observations are also tools that are used []. These involve observing how people behave in urban spaces (time spent in a space, walking speed, stopping points, etc.). Some researchers also use content analysis to understand the soundscape. Crowdsourcing, for example, involves collecting audio data through mobile applications where users have submitted sound data []. Semantic analysis is also used. It consists of studying subjective descriptions of soundscapes to identify themes and associated perceptions []. Finally, other techniques have been developed recently, such as virtual reality (VR) and 3D audio. This involves creating a digital twin of an urban space and then providing participants with this immersive experience in a laboratory using appropriate equipment (virtual reality headset, 360° videos, etc.) [].
2.3. Identified Research Gaps in Soundscape Studies
Although research has progressed in the study of the influence of the soundscape on pedestrian perception [,,], several gaps remain. First of all, there is geographic underrepresentation in soundscape studies. Most research on the soundscape has focused on case studies from Western Europe, North America, and East Asia; few studies have been conducted on Africa, Latin America, and Southeast Asia. For instance, Aletta et al. [] analyzed pedestrian soundscapes along a tourist route in Sorrento (Italy), Doser et al. [] examined the interplay between anthropogenic and biological sounds in an urban–natural gradient in New York State (USA), and Hong et al. [] applied the soundwalk method to evaluate urban soundscapes in Seoul (South Korea).This gap is a significant limitation, as several studies have shown that cultural factors influence sound perception []. Moreover, most of the research has been conducted on a small scale, which limits the generalization of the results. It is important to use advanced prediction and visualization methods in order to account for the soundscape on a large scale []. Furthermore, research on noise and the soundscape often does not take into account the spatial contexts of human activities. It is important to understand how different daily activities, such as commercial or residential activities, influence sound perception [].
It is also important to point out the lack of integrative approaches that combine sound perception with other sensory components such as vision. It is necessary to intersect audio–visual dimensions in order to reflect the full experience of pedestrians in urban environments [,]. Moreover, temporal variations are sometimes overlooked in soundscape studies. Pedestrians’ perception of sound can vary significantly throughout the day and across different seasons [,]. Longitudinal studies are necessary to enrich the literature on temporal aspects.
Few studies combine the investigation of both historical and new urban fabrics []. Ancient cities, such as medinas, possess rich sound qualities that deserve further exploration. This current research attempts to fill this gap by proposing a broader study that takes into account two contrasting urban environments. Moreover, many existing studies focus mainly on a clearly defined urban space, such as a park, a public square, a university campus, etc. Research that spans diverse urban spaces remains relatively scarce. Therefore, it is crucial to study the transitions between urban environments in order to capture existing differences in sound quality and perception. Other aspects, such as the impact of vegetation on sound perception by pedestrians, remain underexplored, especially in the Maghreb and North African context []. The research presented in this article attempts to address this gap by studying selected gardens, in addition to streets and public squares.
The city of Béjaïa in Algeria represents a very relevant case study for examining the influence of the soundscape on pedestrians’ perception and walking experience. This city is composed of two contrasting parts: an old city (medina) rich in historical heritage that reflects the passage of several civilizations, and a lower, more modern city. This richness in terms of spatial and sensory qualities can differently influence the perception of pedestrians and offer different walking experiences. However, we have found only one study in the literature that has examined the soundscape within the urban fabric of Béjaïa: the study by Ikni et al. [] introduced the notion of sound chronotropy to describe the spatiotemporal variations in the soundscape and its relation to the identity aspect of the environment. This study focused only on the historical part (the medina of Béjaïa). Another study was conducted in 2022 on the sound experience, but it focused solely on the interior of a historical building, namely the Casbah of Béjaïa []. Two other studies have examined multisensory landscape in a general way in the historical part of the city: Boumezoued et al. [] studied pedestrians’ route choices by combining syntactic, affective, and multisensory characteristics. The second study was conducted by Bouaifel et al. [], who explored the sensitive dimension of the urban landscape of the medina of Béjaïa. However, these studies did not sufficiently delve into the soundscape of this part of the city. To the best of our knowledge, no research to date has studied the two parts of the city in a single work or made comparisons. Moreover, no research has yet combined pedestrians’ perceptions with sound measurements in the lower city of Béjaïa.
This review highlights the necessity of integrative, context-sensitive approaches to soundscape analysis. The present study addresses these gaps by investigating pedestrian perceptions in two contrasting urban zones of Béjaïa.
3. Methodology and Case Study
3.1. Study Context and Investigation Area
Béjaïa is an important city in North Africa, in the Maghreb region, Algeria. It is located in the southern basin of the Mediterranean Sea, at a distance of 230 km from the capital “Algiers” (Figure 1). Many civilizations have marked the history of the city of Béjaïa, starting with the Phoenicians, followed by the Romans in 33 B.C., then the Hammadids between 1067 and 1068. This latter period was marked by great prosperity and represented a significant turning point in the urban structure of the city. Subsequently, from 1509 (or 1510) to 1555, Béjaïa was occupied by the Spanish. This phase was completely different from the previous one, as military and defensive factors were the main principles of urban planning. For this reason, this period is characterized by the construction of large fortresses that exist today. In 1555, the Turkish civilization succeeded, before the arrival of French colonization, which lasted from 1830 until 1962. The latter brought profound restructurings to the city, completely transforming its image by importing the European urban model of that time, with certain formal adaptations to the conditions of the Algerian and Maghreb context. Afterwards, the city continued to expand towards the area known as the plain, thus forming the lower city of Béjaïa [,,].
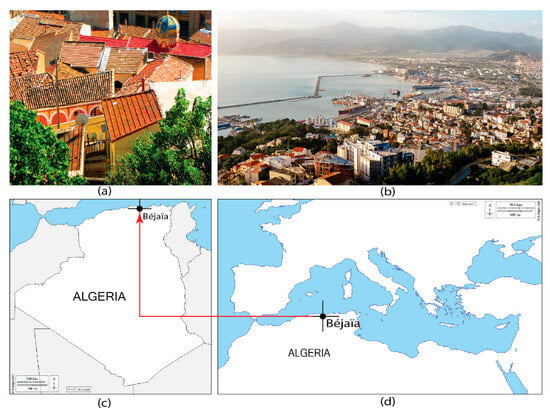
Figure 1.
Views and location of Béjaïa: (a) Old-city rooftops (Houma Keramane). Photo: frisamusic, via Wikimedia Commons, CC BY 2.0, cropped/annotated. (b) Citywide aerial view of Béjaïa. Photo: Walid Amghar, Unsplash (Unsplash License). This panel is not covered by the article’s CC BY 4.0 license. (c) Béjaïa within Algeria; (d) Béjaïa in the Mediterranean basin. Base maps for (c,d): © d-maps.com; original pages Algeria: https://d-maps.com/carte.php?num_car=784&lang=fr and Mediterranean Sea (states): https://d-maps.com/carte.php?num_car=3122&lang=fr (accessed on 8 September 2025). Authors’ edits and annotations.
The city of Béjaïa therefore contains two main parts:
- The Old City (OC): A historic city built before the independence of Algeria (before 1962). It contains old and historical urban fabrics as well as a rich architectural and cultural heritage (Figure 1a).
- The Lower City of Béjaïa (LC): Built mainly after the independence of Algeria in 1962, according to a more modern urban planning, it creates a contrast with the old city (Figure 1b).
3.2. Research Methodology
To answer the research question, we used both qualitative and quantitative methods. To ensure a rigorous study, we tried to conform as much as possible to the recent international standards on soundscape (ISO 12913) [,]. These standards helped us structure this methodology and ensure its comparability with other works. The research process followed in this study is presented in detail in Figure 2.
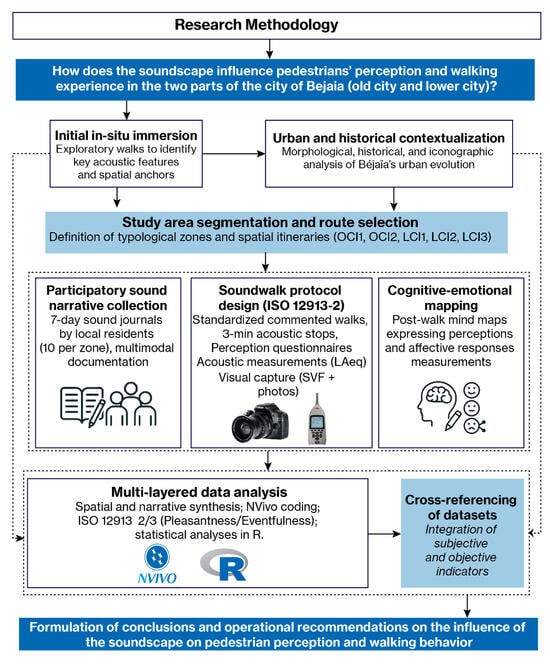
Figure 2.
Methodological framework used in the research.
3.2.1. Strolling as a Research Method (First Contact with the Field)
The objective at this stage is to obtain a general and spontaneous view of the study area through a walk without a specific purpose (walking as a research method). This approach allowed us to identify dominant sound sources (traffic noise, market activities, human voices, natural sounds, etc.) and to locate focal points suitable for observation (squares, intersections, characteristic alleyways…). The observations, sound recordings, and sketches resulting from this stroll formed a foundation and an essential basis for structuring the morphological, historical, and iconographic study that follows.
3.2.2. Morphological, Historical, and Iconographic Study
This stage aims to understand the urban evolution of Béjaïa (from the Roman period to the postcolonial period) and to analyze its values in terms of soundscape. It provided an overall view of the urban structure and its transformations, mainly the soundscapes of the past. In parallel, this study deepened the understanding of the historical and cultural characteristics of the city by identifying formerly frequented spaces and the routes taken by the population of Béjaïa over time, as well as the use of places such as important squares, gardens, alleyways, and urban stairways. This stage also made it possible to identify key areas to be analyzed in the two parts of the city (medina and lower city) and to define specific or transversal routes for guided walks. These methods of studying historical archives are highly recommended by several researchers due to their relevance in enriching in situ work []. The results of this first stage (morphological and historical study) also allowed us to move on to the next stage (the selection of zones and routes).
Selection of study zones and routes:
The objective of this stage is to divide the two parts of the study (OC and LC) into different zones (Figure 3) to allow for a more detailed analysis. This makes it possible to understand how each type of identified fabric differently influences pedestrians’ perception and the experience of the walk.
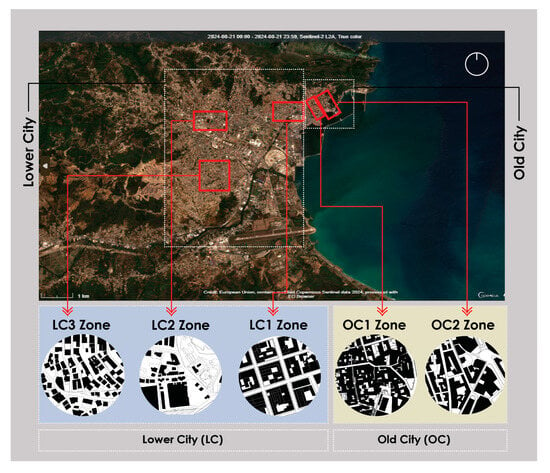
Figure 3.
Geographic location of the selected study areas in the Old City of Béjaïa (OC1 and OC2) and in the Lower City (LC1, LC2, and LC3).
The old city (medina): two zones OC1 and OC2:
- Zone OC1: zone characterized by precolonial fabrics (traces of Kabyle and Ottoman architecture).
- Zone OC2: zone characterized by colonial fabrics (according to the French model)
Lower city: Zones LC1, LC2, and LC3:
- Zone LC1: zone characterized by a planned fabric (well-defined blocks);
- Zone LC2: zone characterized by a mixed industrial fabric (industrial and residential);
- Zone LC3: zone characterized by an unplanned fabric (spontaneous fabric).
3.2.3. Selection of Routes
We have selected a series of itineraries that pass through the strategic locations established in each study area (Appendix A). In total, five itineraries correspond to the number of designated zones. The objective of connecting several spaces is to understand the changes in pedestrians’ perceptions when moving from one place to another. The effect of transitions is a crucial but often overlooked point in research. To determine the length of the itineraries and the walking duration, we followed scientifically recognized requirements for commented walks, namely a length of 1 to 2 km and a walking duration of 30 to 60 minutes’ maximum. The list of itineraries and their names is presented in Table 1. The itineraries followed and the measurement points are presented in Appendix A.

Table 1.
Table of predetermined itineraries in each study area. Adapted from Mansouri et al. [], CC BY 4.0.
3.2.4. Collection of Residents’ Sound Narratives (Sound Journals)
In order to deeply understand the sound experience of pedestrian residents in the different selected zones, we used the method of sound journals. In each selected zone in the two parts of the city (OC and LC), we contacted 10 participants to take part in this experience. Each participant was invited to keep a sound journal (also called a sensitive journal) in which they recorded their daily auditory experiences over a period of 7 days (a full week). We gave participants complete freedom to choose their way of noting and conveying the information; written notes could be accompanied by photos, drawings, sound recordings, etc. Altogether, this constituted a complete sound narrative. These narratives are very rich and contain qualitative information that deeply describes the sound practices of the pedestrian participants: descriptions of moments of noise and calm, appreciated and disturbing sounds, chosen walking routes and those avoided due to noise disturbances, places that generate stress and discomfort, as well as the cultural and symbolic meanings and emotions associated with the different sounds encountered during daily walks. These journals also reveal even subtle changes in soundscapes between weekends and other days of the week, as well as daily variations. Although this type of method is rarely used by researchers, it is validated by several research centers as being a very effective and reliable method [].
3.2.5. Design of Soundwalk Routes in Accordance with ISO 12913-2
After defining the itineraries to be followed with the pedestrians, as well as the measurement points, we organized soundwalks in compliance with the international standard ISO 12913-2, which provides the essential requirements and guidelines to follow. Participants walk with the researcher and stop for 3 min at each measurement point. A listening time of at least 3 min is recommended by several researchers, as it allows pedestrians to immerse themselves in the acoustic environment []. At each point, two tasks are carried out: measurement of sound intensity using a sound level meter, and at the same time, participants carefully listen to the environmental sounds and complete a Likert scale questionnaire, in which they indicate their subjective perceptions. Throughout the routes, participants may also choose to express their perceptions through other means, such as taking photos or drawing. During the walk, we made sure to keep silent within the group (except for necessary instructions), and we noted all particular events, such as the passage of a very noisy vehicle, etc. To avoid overloading participants during the soundwalk, we deliberately limited the number of questions and simplified the response formats as much as possible while ensuring compliance with ISO 12913-2 guidelines. The structure of the questionnaire is presented in Table 2.

Table 2.
The questions and answer options.
- The language of the questionnaire and the sound attributes
The mother tongue in the city of Bejaia is “Kabyle.” Unfortunately, the SATP (Soundscape Attributes Translation Project) does not yet offer a validated Kabyle version. For this reason, we used the French language, which is commonly used in this region. All participants confirmed their good command of French before the start of the soundwalks. To accurately translate the sound attributes, we used the provisional translations presented during Phase 1 of the SATP project, which were available at the time of the study []. When comparing these to the translations presented in 2024 (confidence level “Medium” for French), we observed that all the terms used remained consistent with those in the newer version []. Only one descriptor saw a change in its chosen wording: “annoying,” which was translated in 2020 as désagréable/déplaisant, became gênant/dérangeant in 2024. This change does not affect the semantic validity of the translation after the initial validation step. The exact French terms used for the attributes are presented in Table 3 of the article by Aletta et al. [].

Table 3.
Instrumentation for acoustic and visual data acquisition—key settings.
- Participant profile and recruitment
Most of the participants invited to all the experiments (sound journals and soundwalks) are either residents of the selected areas or local shopkeepers. These profiles represent local experts, as they already have good experience with the local soundscape. To enrich the study, we also invited external participants, either those who have already visited the study areas or those experiencing them for the first time. Sampling followed a non-probability purposive (with convenience) design stratified by urban morphology (old city vs. lower city); the sample does not aim at statistical representativeness of Béjaïa’s population but at analytical representativeness of contrasted contexts, supporting transferability to similar urban settings. We formed heterogeneous groups in terms of age and gender. Previous research confirms that these factors influence subjective perception []. We also recorded occupation and local status (resident/merchant/other) as proxies for everyday sound exposure to contextualize potential perceptual bias (Appendix B). Participants were screened via self-report (no diagnosed hearing impairment, tinnitus, or acute ear infection). No formal audiometric testing was conducted. In accordance with ISO 20252:2019 [], and to ensure strong methodological rigor, we obtained clear consent from all participants before conducting the experiments. We informed the participants about the overall course of the study, including its objectives, the confidentiality of responses, and their freedom to withdraw from the study at any time. A total of 58 participants completed the soundwalks, with 23 assigned to itineraries in the old city and 35 in the lower city, ensuring balanced representation across the different urban morphologies studied. Details on itinerary participation rates and the sociodemographic characteristics of the participants are provided in Appendix B (see Table A1 and Table A2).
- The method of sound measurement
Following ISO 1996-2:2017 [], which determines the conditions for measuring environmental noise, and in parallel with the participants’ subjective responses, the A-weighted equivalent noise level (LAeq) is calculated. The measuring device is calibrated before and after each session. At each measurement point, it is held at a height of 1.5 m above the ground, to approximate as closely as possible the height of the human ear. To ensure the accuracy of the recordings, several precautions were taken: the sound level meter is kept at a sufficient distance from obstacles to avoid reflection effects, and a windshield is used on the microphone. The measurements are timestamped and the corresponding GPS coordinates are recorded to facilitate data analysis. The measurement tool used was the 3M SE-402 sound level meter (Type 2). The characteristics of this device are presented in Table 3.
- Calculation of the Sky View Factor (SVF)
Upward-looking fisheye photos were taken and processed in RayMan Pro (v3.1 Beta) to compute SVF (0–1). SVF is treated as morphological and time-invariant, the same value is used for 9 am and 8 pm. Figure 4 shows the OC1 zone as an example. Previous studies have explored how SVF can influence the acoustic environment and sound perception in urban spaces [].

Figure 4.
OC1—SVF masks derived from upward-looking fisheye images. White denotes sky; black denotes obstructions (buildings/vegetation). SVF computed in RayMan Pro v3.1 Beta; one invariant value per listening point (applies to 9 a.m. and 8 p.m.).
- Directional photo capture and visual audit
Four shots per point (N-E-S-W, 1.5 m; 09 a.m./8 p.m., exposure locked) are rated 0–2 for vegetation cover, motor-vehicle density, and cleanliness by two independent coders (κ ≥ 0.70) using the audit grid provided in Appendix C.
- The use of mind maps
At the end of each walk, participants draw a mind map in which they retrace their perceptions and emotions experienced during the walk. Maps were produced immediately (about 10 to 15 min) and captured the route, key places, perceived sound sources, and emotions. This method is highly recommended for achieving in-depth results that complement other methods [,]. The maps contain drawings and annotations. Maps were photographed and textual labels were transcribed. The results of the mind maps are analyzed using NVivo software, version 14 (QSR International Pty Ltd., Melbourne, Australia). In NVivo, a hybrid coding strategy was applied (deductive nodes for sound-source types, spatial references, and valence/arousal, plus inductive themes). Sound-diary entries and soundwalk notes were imported as sources and linked to Cases with attributes (zone OC1–LC3 and time 9:00 or 20:00). Matrix coding queries were used to compare patterns by zone and by time. Often, the analysis of this type of result is complex for many researchers, which is why NVivo software is very useful for data coding []. For example, “LC2, roundabout, continuous car noise and horns; dynamic but tiring” was coded under Road traffic, Roundabout, High arousal, and Negative valence.
- The period of the study
The study was conducted between 11 and 19 March 2023, which corresponds to the spring season in Algeria. The choice of this period is justified by the fact that it is a phase often marked by a great sound diversity: a significant human presence outdoors, various urban activities, and natural sounds (birdsong, etc.). Moreover, this period allowed us to avoid the extreme weather conditions of winter and summer, which can influence the composition of the soundscape. The guided walks are carried out over 5 days, twice a day: in the morning at 9 a.m. and in the evening at 8 p.m., in order to understand the daily variations in terms of soundscapes and pedestrians’ perceptions.
3.3. Analysis of Measurement Data and Questionnaire Responses Using R Software
In order to carry out the necessary statistical tests for this research, the data are first encoded in Excel files, then statistically analyzed using R software (version 4.4.2), developed by the Foundation for Statistical Computing. The use of this software, widely used by researchers in various fields [,,], ensures good accuracy of the statistical tests.
For the analysis and visualization of the questionnaire’s sound attributes, Part 3 of the ISO 12913-3:2019 [] standard recommends grouping the eight attributes into only two values: “pleasantness” and “eventfulness” [,,]. To do so, we used a very recent visualization tool developed by Mitchell et al. [] called “Soundscapy”. This tool allows the data to be displayed as suggested by the ISO standard on a two-dimensional plane, with scatter plots:
- Horizontal axis = ISO Pleasant score (pleasantness).
- Vertical axis = ISO Eventful score (eventfulness).
The ISO coordinates are calculated using the following two equations:
- ISO Pleasant = [(pleasant − annoying) + cos 45° × (calm − chaotic) + cos 45° × (vibrant − monotonous)] × 1/(4 + √32);
- ISO Eventful = [(eventful − uneventful) +cos 45° × (chaotic − calm) + cos 45° × (vibrant − monotonous)] × 1/(4 + √32).
The complete calculation process is presented in detail in an article published by Mitchell et al. [].
4. Results
4.1. Results of the Historical and Iconographic Study on the Evolution of the Soundscape of the City of Béjaïa
During the historical and iconographic study, we found that historical sources on the soundscape of the city of Béjaïa are unfortunately very limited. For this reason, we relied on several sources such as travelers’ accounts, old photographs, and documents from the French military engineering corps (plans and archives produced during the French colonization of Algeria). Other information was obtained through in situ interviews with long-time residents of the neighborhoods. In order to simplify the study of the historical soundscape of the city of Béjaïa as much as possible, we first structured the results in the form of a table in which we classified the sounds according to sound category, places associated with the sound ambiance, and the historical function of the sounds, as well as the changes observed today (disappeared, persistent, reduced). Figure 5 synthesizes the historical review by mapping sound categories and sources to their current status, highlighting losses and continuities that guide the analysis of the contemporary soundscape.
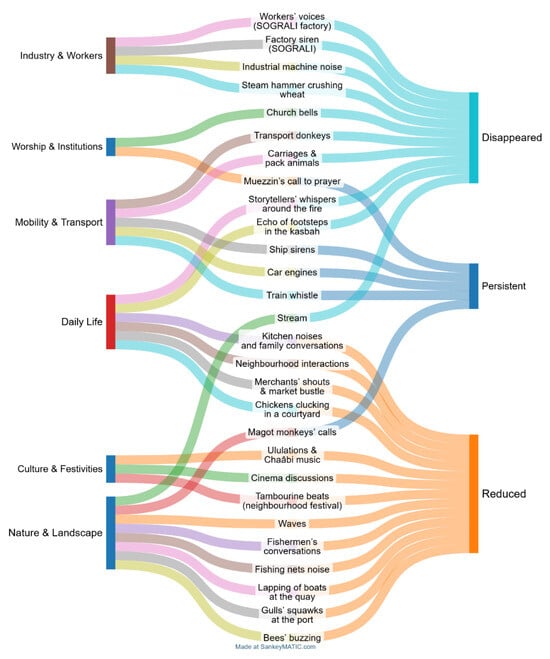
Figure 5.
Sankey diagram of Béjaïa’s historical soundscape. Left: six sound categories; center: individual historical sources; right: their current status (Disappeared, Persistent, Reduced). The diagram synthesizes the historical review by highlighting losses and continuities and provides an analytical framework for interpreting the contemporary soundscape. Figure 5 reveals that many industrial and institutional sounds, such as machines, factory sirens and church bells, have disappeared, while modern transport noises like cars and trains persist. Daily and festive ambiance, including market bustle and Chaâbi music, have diminished, as have natural tones such as bees and waves, illustrating Béjaïa’s profound sonic transformation.
4.2. Analysis of the Expressive Media Used by Participants According to the Research Methods
Given the gaps identified in the literature regarding the choice of research methodologies on sound perception, one of the objectives of this research was to understand how the methodologies and expressive media used make it possible to grasp the different qualities of the soundscape and the pedestrian experience. It also aims to assess the scope of each method and its complementarity. Figure 6 presents the expressive media used by the participants in each research method applied in this study.
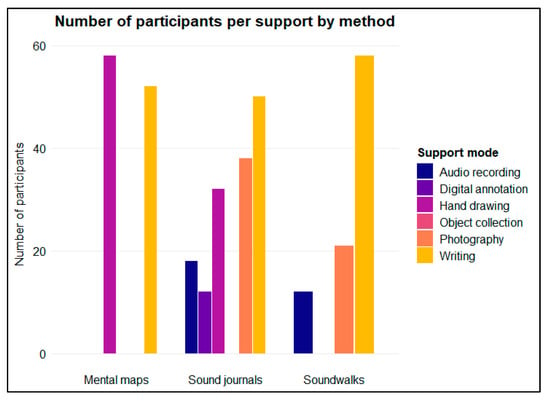
Figure 6.
Number of participants per support by method. Bar height indicates the number of participants; colors denote support modes (audio recording, digital annotation, hand drawing, object collection, photography, writing); the x-axis lists the methods (mental maps, sound journals, soundwalks). Participants could use more than one support within a method, so totals may exceed the sample size.
Figure 6 demonstrates that significant diversification can be observed in the means used for the sound journals, where all the media proposed to participants are used, except for the collection of objects, which is not used throughout the study. Writing is the dominant medium in the sound journals and soundwalks, and it is also widely used in the mental maps (52/58), alongside hand drawing (58/58). Photography is used by several participants in the sound journals (38/50) and by almost half of the participants in the soundwalks (21/58).
4.3. Results of the Sound Journals
4.3.1. The Sound Intensity Perceived by the Participants in the Sound Journals Across the Five Study Areas (OC1, OC2, LC1, LC2, LC3) Throughout the Week
Figure 7 presents temporal heat maps representing the sound intensity perceived in the two study areas of the old city (OC1, OC2) and the three areas of the lower city (LC1, LC2, LC3) throughout the week. The information is obtained by compiling all the data mentioned by the participants using NVIVO software. Each cell shows the mean perceptual intensity for the corresponding daytime slot, highlighting the daily and spatial variations in the perception of the soundscape. To determine the intensity levels, we assigned a score from 0 to 10 to each reported sound, based on its perceived loudness, according to a scale we developed. The scoring grid used is presented in Table A4 (Appendix D). The number of observations per cell may vary depending on participant’s availability; the mean is therefore calculated based on all responses actually provided (min. n = 6, max. n = 10) for the corresponding interval. The intensity scale (0–10) reflects a perceptual evaluation provided by the participants; it should not be interpreted as an objective acoustic measurement such as LAeq. This approach aimed to facilitate data processing and allowing for a clearer and more structured interpretation of the qualitative results.
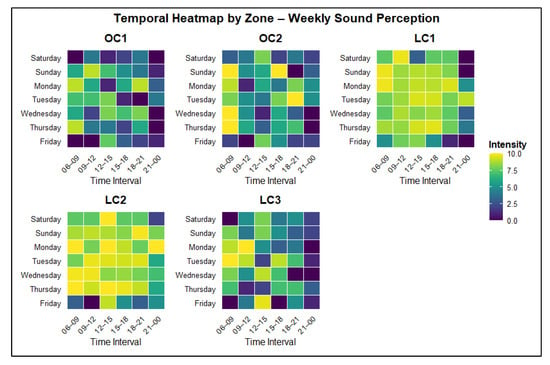
Figure 7.
Temporal heatmaps of weekly sound perception by zone (OC1–LC3). Rows represent days of the week, and columns represent time intervals. Color indicates the mean perceptual intensity based on the 0–10 coding grid (0 = very weak/absent, 10 = very intense). See Table A4 (Perceptual sound intensity coding grid (0–10)) for details. The scale bar shows darker colors as lower intensity and yellow as higher intensity. Data are aggregated from sound-diary entries.
Figure 7 shows that the lower city zones (LC1 to LC3) exhibit higher sound intensities across all time slots, particularly between 9:00 a.m. and 3:00 p.m. In contrast, the old city areas (OC1, OC2) display lower and more variable intensities, with quieter periods in the evening (6:00 p.m. to 9:00 p.m. and 9:00 p.m. to midnight). During weekdays, sound levels are generally higher than on weekends (Friday and Saturday), revealing distinct temporal and spatial patterns. Some intervals show slightly elevated intensities even on weekends, which generally correspond to Friday prayer times, frequently mentioned by several participants, as well as market hours.
4.3.2. Relationship Between Perceived Sounds, Emotions, and Their Impact on Walking Behavior
Figure A3 (Appendix E) presents the results of the walking journals filled out by participants over a period of seven days. The sounds are classified into eight categories that emerged from the content analysis. These categories were then cross-referenced with two other dimensions: the dominant emotion and the impact on walking as expressed by the majority of participants. For each category, the dominant values are the modal emotion and walking response, those reported in at least 50% of all coded occurrences. Positive and soothing sounds: Natural sounds (such as birdsong, water, and rustling leaves) as well as the call to prayer are associated with positive perceptions (pleasant walk), providing favorable emotions such as serenity and relaxation. Silence also supports a relaxed walk (pleasant walk). Other sounds are perceived as stressful or stimulating: construction and traffic noises are associated with a significant impact on walking, most often leading to avoidance or acceleration of walking. Machine noise also causes stress and increases walking speed. Sounds from markets and vendors are associated with two impacts, either “slowing” or “discomfort”, and they stimulate pedestrians. Finally, human voices generate a perception of conviviality, especially at night.
4.4. Results of the Questionnaires
4.4.1. Pleasantness Levels of Acoustic Sources by Urban Zone and Time of Day
Figure 8 presents a comparison of the levels of “pleasantness” attributed to four sound categories (natural sounds, urban sounds, transport, and human voices) across the five study zones (OC1, OC2, LC1, LC2, LC3) and during the two time slots: morning at 9 a.m. and evening at 8 p.m.
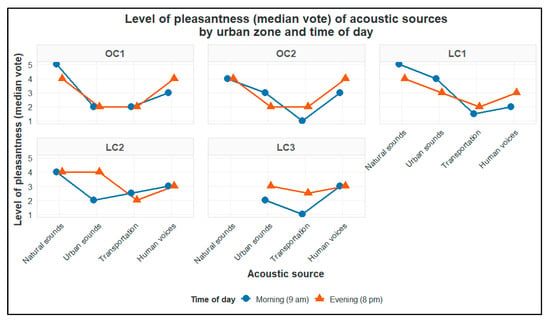
Figure 8.
Pleasantness Levels (Median Vote) of acoustic sources by urban zone and time of day.
Transport-related sounds are consistently rated as the least pleasant, with a slight decrease in the evening. Natural sounds were perceived positively in all zones. However, and somewhat surprisingly, there was a complete absence of votes for this category in zone LC3. Human sounds are slightly more appreciated in the evening, mainly in the areas of the old city (OC1 and OC2), perhaps due to a feeling of conviviality and safety. Some human voice sounds are appreciated in one zone but not in another. For example, urban sounds (such as music from shops) receive average ratings in the morning in zones OC2 and LC1, and lower ratings in zones OC1, LC2, and LC3. In zone LC2, urban sounds are better appreciated during the nighttime period.
4.4.2. Perceptual Attributes and ISO 12913-3 Projection (ISO 12913-2/-3)
Figure 9 summarizes the variation in perceptual attributes in the five studied zones, revealing notable temporal contrasts (morning/evening) across several dimensions (e.g., calm, lively, chaotic). The results highlight a strong variability of perceptual attributes both across zones and between times of day. At 9 a.m., levels of “Calm” range from moderate to low, with OC1 standing out as the calmest. By 8 p.m., the trend reverses: “Calm” increases across all zones, while “Chaotic” decreases significantly, with few exceptions. Several locations, particularly in LC3 (E3, E4, E5), are perceived as “Monotonous” both in the morning and evening. The “Uneventful” attribute shows moderate to high levels in multiple areas at both time points. Notably, gardens (B1, B4, B6, C2, C3) are consistently described as calm and pleasant, as is the urban staircase (C1), which benefits from surrounding vegetation.
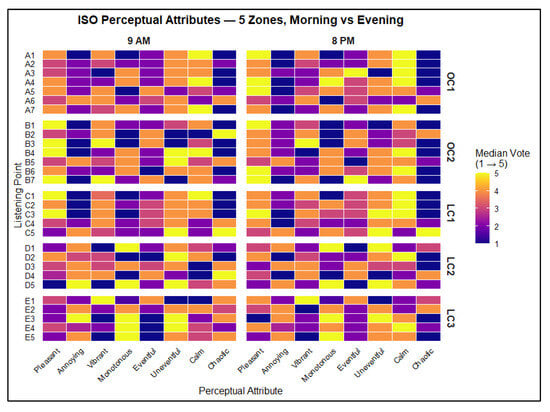
Figure 9.
ISO soundscape attributes (median 1–5) by zone and time. Rows are listening points coded A1–E5, grouped by zone (A = OC1, B = OC2, C = LC1, D = LC2, E = LC3). Columns are the eight ISO 12913-2 attributes: Pleasant, Annoying, Vibrant, Monotonous, Eventful, Uneventful, Calm, Chaotic. Color shows the median rating (1 low, 5 high). Read rows to compare points within a zone and columns to compare attributes across zones and between 9 a.m. and 8 p.m.
Beyond the attribute-level analysis (ISO 12913-2), we project these perceptions onto the ISO 12913-3 Pleasantness and Eventfulness axes, computed using the transformation equations presented in Section 3.3, to provide a compact and comparable representation across zones and time periods. The results for zone OC1 are presented in Figure 10, while the corresponding results for the remaining zones are detailed in Appendix F.
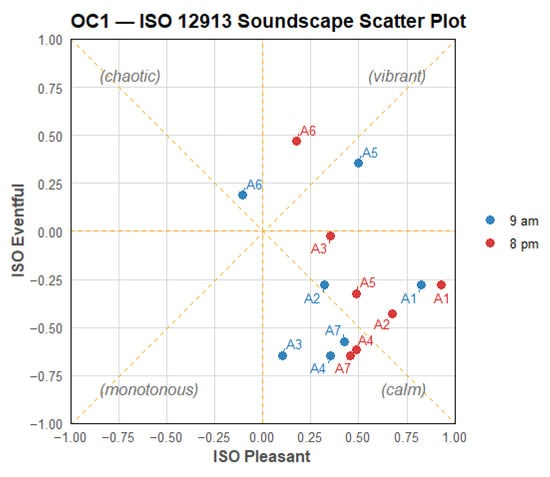
Figure 10.
OC1—ISO 12913 Soundscape Scatter Plot. Each point is the ISO coordinate (Pleasantness, Eventfulness) computed from median PA votes per listening point; axes in [−1, 1] [−1, 1] [−1, 1] with 0.25 ticks; diagonal guides at ±45°. Full plots for OC2, LC1–LC3 are provided in the Appendix F.
In the morning, OC1–OC2 are generally calm yet vibrant (Pleasant > 0; Eventful ≈ 0–0.5, with a few outliers), whereas LC2–LC3 drift toward monotonous/chaotic (Pleasant < 0; Eventful < 0). LC1 stays pleasant but weakly eventful. By evening, all points gain Pleasantness and lose Eventfulness: the old city retains slight vibrancy, while lower-city zones become chiefly calm, even monotonous.
4.4.3. Comparison of Sound Levels and Perceived Comfort Across Time Periods and Urban Zones
Figure 11 presents the comparison of sound levels (LAeq) and median comfort ratings (sound and walking) at different listening points across five urban zones, distinguishing between morning (9 am) and evening (8 pm) periods.
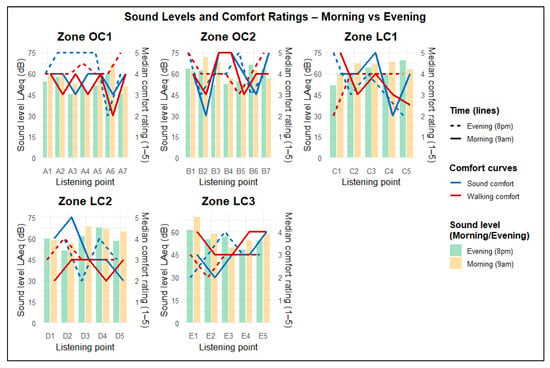
Figure 11.
Comparison of sound levels and comfort ratings (sound and walking) between morning and evening across zones.
The results indicate clear differences across urban zones. OC1, which appears relatively quiet, shows moderate sound levels and generally high ratings for walking comfort and visual ambiance. OC2, a more active area, presents occasionally high sound levels (71.6 dB at B2). Nevertheless, some locations such as B3, B4, and B7 receive relatively high evaluations in both sound and visual comfort. This may suggest that other factors, such as ambiance or spatial configuration, influence perception positively. Similarly, in LC1, point C3 stands out with favorable comfort ratings despite sound levels exceeding 66 dB. In contrast, some points in LC2 and LC3 combine higher noise levels with lower comfort evaluations, although this pattern is not consistently observed across all locations.
4.4.4. Study of the Correlation Between Sound Comfort (SC), Visual Ambiance (VA), and Walking Comfort (WC)
Figure 12 demonstrates that in the morning (9 a.m.), all correlations were moderate to strong and statistically significant: SC–VA (ρ = 0.58, p = 0.001, 95% CI [0.27; 0.80]), VA–WC (ρ = 0.68, p < 0.001, 95% CI [0.45; 0.84]), and SC–WC (ρ = 0.40, p = 0.033, 95% CI [0.05; 0.67]). Visual comfort (VA) appears to be strongly associated with both walking comfort (WC) and sound comfort (SC) in the morning. In the evening (8 p.m.), the SC–VA correlation remained significant (ρ = 0.57, p = 0.001, 95% CI [0.33; 0.74]), as did VA–WC (ρ = 0.50, p = 0.006, 95% CI [0.20; 0.78]). However, the SC–WC correlation weakened and did not reach statistical significance (ρ = 0.29, p = 0.125, 95% CI [−0.07; 0.62]).
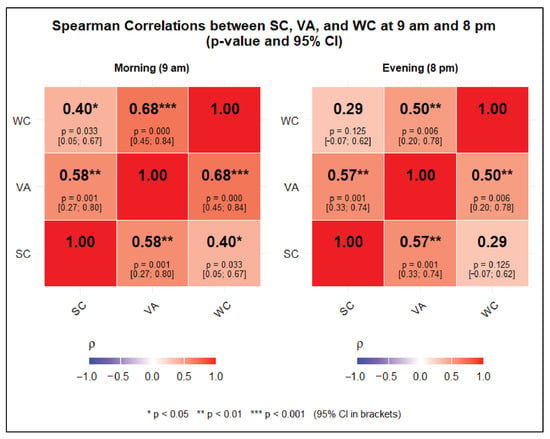
Figure 12.
Spearman correlations (ρ) among sound comfort (SC), visual perception (VA), and walking comfort (WC). Left: morning (9 a.m.); right: evening (8 p.m.). Each cell reports ρ with p-value and 95% CI (in brackets); asterisks indicate significance (* p < 0.05, ** p < 0.01, *** p < 0.001). Color scale encodes ρ from −1 (blue, negative) to +1 (red, positive).
Figure 13 displays the standardized partial coefficients (β) and 95% confidence intervals obtained from a multiple (multivariate) linear-regression OLS model that entered the five predictors simultaneously. Detailed outputs are in Table A5 (Appendix G). Only cleanliness remained significantly independently correlated with comfort (β = −0.28, CI [−0.54, −0.02]), indicating lower comfort scores where litter is more recurrent. The coefficients for vegetation cover (β = +0.25, CI [−0.03, +0.53]) and motor-vehicle density (β = −0.23, CI [−0.53, +0.07]) pointed in the anticipated directions but were not significant. LAeq showed a weaker, non-significant negative association (β = −0.18, CI [−0.47, +0.11]), and SVF contributed negligibly (β = −0.04, CI [−0.29, +0.21]).
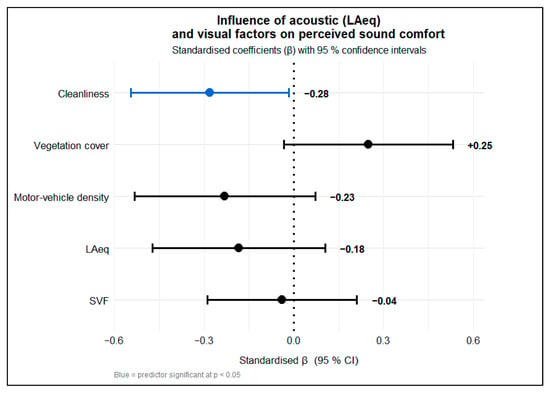
Figure 13.
Standardized regression coefficients (β) with 95% confidence intervals from a multiple linear model of perceived sound comfort. Predictors: cleanliness, vegetation cover, motor-vehicle density, acoustic level (LAeq) and sky view factor (SVF). Blue = predictor significant at p < 0.05.
4.5. Semantic Analysis of Mental Maps Reflecting Sound Perceptions and Cognitive Representation
This section presents the semantic analysis of the mental maps created by participants after the soundwalks conducted at 9 a.m. and 8 p.m. in each study area (OC1, OC2, LC1, LC2, LC3). A lexical cleaning was carried out to improve the clarity and readability of the textual data, without altering the semantic content. A word cloud was generated for each zone to visualize the most frequently shared perceptions across both time periods.
The word clouds obtained reveal differences in the perception of the soundscape between the different zones (Figure 14). In zone OC1 of the old city, the terms “silence,” “heritage,” “calm,” and “foot” dominate, highlighting a low-traffic atmosphere. Terms like “echo,” “stone,” “memory,” and “heritage” underline an attachment and intimate relationship with the city’s heritage. Some terms like “abandoned” reflect the deterioration of certain historical structures, notably one of the city’s most important gates, as emphasized by this participant: “It’s sad to see the Fouka gate in this condition” M_28. In general, this zone (OC1), mainly composed of historical fabric from before the French colonization, is perceived as quiet and calm.
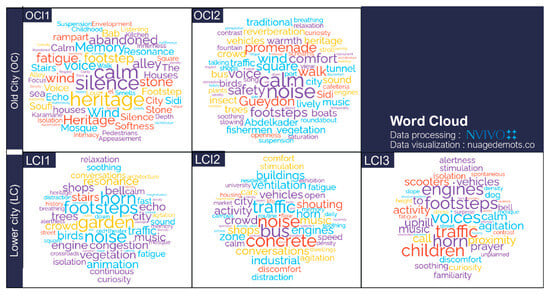
Figure 14.
Word clouds representing sound perceptions by zone, based on participants’ mental maps after the soundwalks.
In the second zone of the Old City, a clear contrast is observed between positive and negative perceptions of the soundscape. Terms such as “noise,” “bus,” and “cars” highlight a certain discomfort mainly linked to traffic in specific places, such as Medjehed Cherif Square, as well as port activities. On the other hand, terms like “calm” and “comfort” reflect a good level of acoustic comfort, mainly in the higher areas, far from traffic noise, and around the gardens. Mentions of “vegetation,” “birds,” and “insect” suggest the restorative role of vegetation. The presence of terms such as “promenade” and “fishermen,” noted by participants mainly along the Leonardo Fibonacci promenade, is also observed. The LC1 zone of the lower city presents a hybrid soundscape. The word cloud shows a clear duality between natural sounds (birds, trees, garden) and anthropogenic noise (engine, congestion, traffic, horn). Terms such as “shops” and “conversations” suggest the lively aspect of the zone.
The word cloud of the LC2 zone presents a saturated soundscape dominated by human activity and motorization (traffic, noise, concrete, bus, engines, horn). The presence of terms like “fatigue” and “discomfort” reflects a psychological impact on pedestrians and a significant cognitive load. The LCI3 word cloud reveals a sound environment marked by the immediate proximity of sources (children, horn, voices, engines), typical of high-density, unplanned residential areas. The presence of terms such as “discomfort” and “stimulation” likely indicates irregular and cognitively demanding sound exposure.
In most of the word clouds obtained, the presence of emotional terms such as “agitation,” “fatigue,” “soothing,” “resonance,” as well as physiological dimensions like “alertness,” “breathing,” and cognitive dimensions such as “memory,” “curiosity”, can be observed. By analyzing the word clouds in a cross-sectional manner, we observe clear differences between the soundscape of the historical zones located in the Old City of Béjaïa and those of the more contemporary areas in the lower city. Zones OC1 and OC2 are characterized by a strong presence of terms related to calm, silence, and memory, with exceptions in certain places. In contrast, zones LC1, LC2, and LC3 show a significant number of terms related to noise and traffic, except for gardens and some areas considered quieter.
5. Discussion and Recommendations
This research, conducted in two contrasting parts of the city of Béjaïa, combines ISO 12913 soundwalks and mixed tools to assess how urban soundscapes shape pedestrians’ perception and walking experience. This section presents a discussion of the results, and a set of recommendations, as well as the strengths and limitations of the study.
5.1. Changes in the Soundscape of the City of Béjaïa Between the Past and the Present
The historical and iconographic analysis allowed us to gain an initial insight into the former soundscape of the city of Béjaïa, mainly in the medina, and to observe the various changes over time. Figure 5 demonstrates that the city’s sound environments were very rich and offered residents and visitors an atmosphere that encouraged strong social interaction and attachment to different parts of the city. Sounds from various sources (human, natural) notably structured pedestrian movement and influenced the choice of walking routes and trajectories. Craft activities, markets, and maritime activities (such as fishing) were all elements that contributed to a sound environment influencing walking practices in the city. This was also noted by certain researchers, such as Berki [], who stated in his article: “Béjaïa on a summer night is also the invasion of private gardens by stray cats; it’s the cacophony of barking dogs, the noise of metal garage shutters, the music escaping from a sound system because there’s a wedding somewhere. It’s men talking while sitting under a streetlamp, the call of the muezzin waking you at four in the morning.” Through this initial study, we observed that several changes have occurred due to transformations in various domains (social, economic, cultural), resulting in a more standardized and less convivial environment. The majority of these changes were also observed by Ikni et al. [] in a study conducted on the old city of Bejaia, specifically focusing on the case of the Place 1st November 1954.
The situation identified in the present study is not limited to the old city of Béjaïa. Many soundscapes of historic urban centers around the world are evolving under the effects of modernization and socio-economic changes, sometimes in drastic ways. Numerous traditional sound scenes are tending to disappear or transform, raising debates among researchers and urban planners about the preservation of collective memory. For example, Mahroug et al. [] state that in the medina of Tunis, the 20th century brought profound changes, leading to the attenuation or disappearance of many cultural sounds and other significant soundscapes. In response to these changes, there is a growing awareness of the need to document and preserve urban sound heritage. For example, researchers have studied the manual ringing of bells in Cervera, Catalonia, using direct observation and semi-structured interviews, and noted that this type of sound “enhances the tourism experience” []. Other broader initiatives have also emerged, such as the creation of sound postcards, aimed at raising awareness about the richness of soundscapes in traditional urban fabrics.
Historic urban centers, particularly the medinas of Arab-Muslim cities, feature soundscapes with distinctive characteristics that are often overlooked in favor of visual and architectural dimensions. Establishing a permanent local sound archive and regularly conducting participatory campaigns is recommended to identify and safeguard endangered heritage soundmarks. This approach also represents a highly relevant research avenue for soundscape scholars by exploring techniques or strategies to preserve the acoustic richness of historic sound environments.
5.2. The Choice of Tools and Expressive Media for Sound Perceptions by Participants Across Different Methods
The choice of media used by the participants is very diverse (Figure 6). The richness of the selected media varies significantly depending on the research method. This diversity cannot be reduced solely to individual preferences. First, it reflects what is known as the “expressive agency” of participants, meaning their ability to choose the mode and tool of expression according to their cognitive experience. Second, it reveals the methodological affordances associated with each tool. In other words, certain methods may facilitate a freer expression of perceptions than others.
Writing is the most commonly used medium by the participants in this study. This medium is used in all methods due to its simplicity. Some studies conducted in other contexts have also mentioned the significant use of writing to express ideas. For example, a study by Geisler et al. conducted on the soundscapes of Kronsberg in Hanover indicated that writing was the most used medium []. However, for this same study [], drawing was not used by participants even though it was proposed by the researchers. The heterogeneity of the media used by participants in this research highlights the critical importance and necessity of using diverse methodological approaches and allows participants the freedom to choose how they express themselves during the exploration of urban soundscapes.
These results also demonstrate the importance of using qualitative methods such as sound diaries and mental maps. Certain types of information remain difficult to capture when relying solely on closed-ended questionnaires (e.g., yes/no responses). Qualitative methodologies enable a deeper exploration of pedestrians’ auditory and sensory perceptions, as well as their emotional responses and spatial associations. While standard tools and methodologies remain relevant, they are sometimes limited and do not allow access to the deeper dimensions of the soundscape, particularly its affective aspects. These methods have been used and recommended by several researchers in the field [,]. They enable a shift toward a phenomenological reading of sound perception: situated, embodied, and subjective.
5.3. Influence of the Soundscape on Sound Comfort and the Urban Walking Experience
The results of the present research demonstrate that the urban soundscape has an influence on sound comfort and the walking experience of pedestrians. Sounds perceived as pleasant improve comfort, while unpleasant sounds deteriorate it. Figure A3 (Appendix E) and Figure 8 show that urban mechanical noises (traffic, machines, construction) cause tension, fatigue, anxiety, and stress. This has also been mentioned by several researchers in the field [,,]. These sounds can lead to increased walking speed or the avoidance of exposed areas. Pleasant sounds (nature, call to prayer) help to improve sound comfort. They are associated with tranquility and relaxation and make walking more peaceful and comfortable.
These findings were also reported by Berkouk et al. [] in a study on the soundscape of oases in the city of Biskra, Algeria. They found that geophonic and biophonic sounds show a moderate but significant negative correlation with walking speed. In other words, the more natural sounds the sound environment contains, the more pedestrian walking tends to slightly slow down. The comparisons presented in Figure 11 show that even if the level of certain sounds is high, perception can remain positive. This suggests that high-quality urban soundscapes are not necessarily the quietest in terms of decibels, but those that offer a balance where pleasant sounds (natural or social) perceptually outweigh unpleasant noise.
The word cloud of zone LC2 shows terms such as “promenade” and “relaxation,” and several participants appreciated walking along the Leonardo Fibonacci promenade, next to the sea and the city’s fishing port. One participant stated, “I love walking here (Leonardo Fibonacci promenade), it’s a peaceful and calming place.” This suggests that pleasant sounds and landscapes encourage leisure or health-oriented walking. Transitions between spaces are elements that influence sound perception and walking experience. Moving from a very quiet area to a lively one, or vice versa, encourages sensory stimulation and variation, which makes the route more engaging and reduces monotony. The term “animation” appears in the word cloud of zone LC1. This may be explained by the fact that the route passes through several different spaces (stairway, garden, street), suggesting that the typology of spaces also plays a role in pedestrians’ perception by offering a diverse soundscape.
5.4. Soundscape and Pedestrians’ Sense of Safety
The results suggest that the urban soundscape has a significant influence on pedestrians’ sense of safety within public space. Figure 8 shows that human sounds are generally more appreciated at night than in the morning. The same applies to urban sounds in zones LC2 and LC3. The results from the sound diaries (Figure A3) also showed that human sounds often evoke a feeling of sociability among pedestrians. Sound environments can increase or decrease the sense of vulnerability to urban risk. Human presence in space reassures pedestrians by indicating that the risk of crime is low and that the likelihood of receiving help in case of a problem is high.
Sounds of conversations, children’s laughter, and music at moderate intensity are often perceived as reassuring, especially at night. This has also been demonstrated by some researchers in the field. Sayin et al. [] showed in a study conducted in car parks and metro stations that hearing people going about their activities signals social presence, thus reducing the feeling of fear and reinforcing the sense of safety. In contrast, when silence becomes excessive in an environment, especially where activity is normally expected, it can create a sense of insecurity by increasing the perception of risk and threat. The mental maps we collected at the end of each route also showed that the total absence of human activity in a deserted street at night, particularly when lighting is lacking, gives pedestrians the impression that the space is abandoned or uninhabited, which increases the perception of insecurity. Astolfi et al. [] observed in a study that introducing musical sounds in certain environments gives the impression of human presence in space and thus improves the feeling of safety. On the other hand, some sudden and aggressive urban sounds generate negative perceptions and a sense of insecurity among pedestrians. For example, in the word clouds shown in Figure 14, the horn is mentioned several times by participants, mainly in zones LC2 and LC3. Sounds like horns are often associated with danger and aggressiveness in the city. However, it is important to note that sound level is not the only indicator of perceived safety. Some sound sources, even when loud, can be perceived positively when they are human and familiar. This is the case with the five daily calls to prayer (adhān), which evoke positive emotions such as “serenity” and shared meaning, and can enhance the sense of safety.
This suggests that sound not only informs the perception of space but also acts as a social signal. Human sounds can operate as acoustic markers of community presence, while silence or aggressive noise can be interpreted as signs of social withdrawal or threat. This duality underlines the importance of interpreting urban soundscapes not only in terms of decibels, but also as part of a symbolic and affective ecology that shapes spatial experience.
5.5. Interaction Between Visual Perception and Sound Comfort
The perception of the urban soundscape does not depend solely on hearing; it results from a complex multisensory integration []. Figure 12 shows that there is a moderate correlation between sound comfort and visual perception. In the morning, this correlation is moderate to strong (ρ = 0.58, p = 0.001, 95% CI [0.27; 0.80]), and it remains stable in the evening with a nearly similar value (ρ = 0.57, p = 0.001, 95% CI [0.33; 0.74]). Visual elements can enhance or alter pedestrians’ sound perception. This reflects cross-modal correspondences, where visual features modulate the interpretation of auditory stimuli, affecting perceived sound comfort. Greenery significantly contributes to reducing noise-related annoyance, both in gardens and along streets. This is observed in most gardens in the city of Béjaïa (B1, B4, B6, C2, C3), as well as in the staircase (C1) surrounded by greenery (Figure 11 and Figure 13). Viollon et al. [] demonstrated that the more an environment lacks natural elements, the more surrounding sounds are perceived as unpleasant and uncomfortable. The word clouds obtained from the analysis of mental maps and shown in Figure 14 also highlight the word “garden” in zone LC1, which underlines the importance of natural presence in sound perception. On the other hand, the term “concrete” emphasized in zone LC2 illustrates the role of visual elements in shaping perception. Figure 13 further highlights that cleanliness significantly affects perceived sound comfort, with lower comfort reported in visually unclean environments. Cleanliness can be interpreted as an environmental affordance that signals safety, order, and predictability, indirectly enhancing auditory comfort. In a study in Tianjin, Zhou et al. [] showed that visual factors such as vegetation, façade design, or street openness had a positive correlation with perceived sound pleasantness. However, this positive effect of natural elements may be limited to moderate noise levels. Beyond a certain threshold, the influence of natural features, such as vegetation and water, becomes less effective. These results suggest that urban sound comfort emerges from an interaction between sensory modalities, spatial cues, and the symbolic meanings associated with the environment.
5.6. The Emotional and Affective Effects Related to the Soundscape
The results from the sound diaries and mental maps demonstrate that the soundscape can evoke deep emotions and revive personal or collective memories. These sounds contribute to the identity of the city and to collective memory. The terms “memory” and “identity” appear in the word clouds generated from the mental maps (Figure 14), and several participants stated that certain sounds reminded them of moments from the past. In addition, the results from the sound diaries (Figure A3) show that the sounds of the call to prayer evoke a sense of serenity among participants. Urban heritage sounds, as well as cultural and festive sounds, often contain what is referred to as “soundmarks,” a term introduced by Schafer []. They carry a strong symbolic and emotional weight and can generate deep emotions and nostalgia. Zhao et al. [] state that “Sound is a memory carrier in places with rich history and culture, which can invoke place memories and images.” Therefore, soundscapes are not limited to generating comfort or discomfort; they also contribute, in the long term, to building emotional attachment to places among pedestrians. Studying the influence of the soundscape on pedestrians’ emotions and affections represents one of the significant gaps in the literature, which calls for further exploration by researchers.
5.7. Strengths and Limitations of Research
5.7.1. Strengths
This research presents several strengths. First, it adopted a mixed methodological approach, combining quantitative and qualitative methods in accordance with ISO 12913 standards. The methodology is reproducible and can be used by other researchers for a detailed reading of urban ambiances in other underexplored cities. The analysis of two contrasting morphological contexts and the inclusion of different types of spaces (streets, alleys, stairways, gardens) in the same study (historic and contemporary) made it possible to identify variations related to spatial configuration, urban form, and the function of each area. Moreover, to our knowledge, this research is the second conducted on the soundscape of the old city of Bejaia and the first on the lower city, bringing new insights into a context that is poorly documented in the literature. It addresses the geographical bias often observed in soundscape studies, which remain largely focused on Global North settings. Finally, the originality of the study also lies in the consideration of users’ sensitive, emotional, and affective experience, articulated with spatial analysis and acoustic measurements, thus contributing to filling a gap in soundscape research in the Global South. This integration supports a more holistic approach to urban analysis, grounded in lived experience and sensory phenomenology.
5.7.2. Limitations
This study presents several limitations. First, although the participant samples were diverse, they were limited due to recruitment difficulties: 50 participants for the sound diaries and 58 for the soundwalks, distributed across the five zones in both parts of the city. Given the non-probability, purposive sampling stratified by urban morphology, the results are not statistically generalizable to Béjaïa’s population but are analytically transferable to similar urban contexts. Second, the temporal scope is restricted, focused on a single season (spring). This choice was made in line with the aim of the study, which was to capture the greatest variety of sounds (such as natural sounds) and avoid extreme conditions. However, the collected data do not reflect the situation during other seasons. In summer, with holidays and the arrival of tourists, the sound environment may change completely.
Moreover, although the study takes subjective perceptions into account, other physiological analyses (stress, heart rate) could enrich the assessment of sound comfort. Finally, some results, such as noise measurements (LAeq), are specific to the locations where they were recorded and to the time of the study (9 a.m. and 8 p.m.). However, the data may vary depending on the time and in other areas of the city. It is strongly recommended to conduct an in-depth study of urban noise across the entire city of Béjaïa, in order to identify the most exposed areas, by multiplying the measurements at different times through cross-sectional analyses.
5.8. Practical and Research Implications
5.8.1. For Urban Planners
The research highlights the importance of integrating the soundscape into urban design. It recommends the enhancement of natural and social sounds, as well as the reduction in traffic-related nuisances, to enhance pedestrian comfort, promote active mobility, and improve urban well-being. More specifically, the study also calls for the integration of the elements raised in this research into the heritage safeguarding plan of the old city of Béjaïa (PPSMVSS), in order to preserve its soundscape and its heritage identity. Urban planners can also adopt the perceptual attribute analysis method used in this study to identify problematic areas and propose targeted interventions for improving the urban soundscape. Such integration requires cross-sector collaboration between urban planners, environmental agencies, and local communities.
5.8.2. For Researchers
The study demonstrates the relevance of mixed and expressive approaches for analyzing sound perception. It encourages further exploration of the links between soundscape, emotions, perceived safety, and cultural contexts, particularly in Global South cities, which remain underrepresented in the international literature. This approach contributes to expanding the epistemological foundations of soundscape studies by integrating subjective, affective, and culturally situated dimensions of perception.
6. Conclusions
The study explores how soundscapes shape pedestrian perception in historically and morphologically diverse areas of Béjaïa (Algeria). By applying ISO soundscape protocols alongside participant-driven methods, it offers insights from a context rarely examined in the international literature. The main findings are summarized below.
The soundscape of Béjaïa has significantly changed, with the disappearance of many traditional sounds and the increased persistence of transport-related noise. This evolution reflects a reconfiguration of the city’s sensory and social landmarks. It is essential to preserve the city’s soundscape in order to maintain its acoustic identity. To study the soundscape effectively, it is important to diversify the methodologies and allow participants the freedom to express themselves in the way most appropriate for each individual. Qualitative methods based on free expression, such as mental maps, sound diaries, or experience narratives, are crucial for accessing the subjective, emotional, and contextual dimensions of sound perception. This approach fosters a situated, embodied, and nuanced reading of the urban sonic environment.
The soundscape has an important influence on pedestrian perception and walking. Loud noise in the city is perceived negatively. However, the nature of the sounds is a very important factor. Natural sounds are generally perceived positively and enhance the walking experience, while mechanical or aggressive sounds are often considered disturbing. Moreover, awareness of the sound’s origin and its appropriateness to the environment are also key elements in its perception. The soundscape also influences pedestrians’ sense of safety. Human sounds (conversations, children’s voices, call to prayer), especially at night, help reassure people and improve their perception of safety. In contrast, abrupt, unpredictable, or aggressive sounds, such as car horns, create a feeling of discomfort and insecurity.
The soundscape is not limited to decibels. Sound perception is multidimensional: it involves emotional, cognitive, and sensory aspects. Some sounds can evoke memories, while others may generate stress, curiosity, or a sense of well-being. These findings call for moving beyond a technicist reading of sound to fully grasp its social and affective implications. There is a strong relationship between visual ambiance and sound comfort (ρ = 0.58, p = 0.001, 95% CI [0.27; 0.80]) and between visual ambiance and walking comfort (ρ = 0.68, p < 0.001, 95% CI [0.45; 0.84]). The more visually pleasant a space is perceived to be, the more likely it is to be perceived as acoustically comfortable. Natural elements, such as natural sounds and vegetation, significantly enhance sound comfort.
The systematic incorporation of sound-sensitive criteria into urban planning frameworks is advocated. In practice, this entails establishing “quiet corridors” and “acoustic corridors” that prioritize natural and socially valued sound sources, alongside participatory soundwalks and sound-mapping workshops to inform context-specific and community-based interventions.
Author Contributions
Conceptualization, Y.M., M.E.M. and S.A.; methodology, Y.M., M.E.M., A.A., W.A.M. and S.A.; software, Y.M.; validation, M.E.M., A.A. and S.A.; formal analysis, Y.M.; investigation, Y.M. and A.A.; resources, Y.M., A.A. and S.A.; data curation, Y.M.; writing—original draft preparation, Y.M.; writing—review and editing, Y.M., M.E.M., A.A., W.A.M. and S.A.; visualization, Y.M.; supervision, M.E.M., W.A.M. and S.A.; project administration, M.E.M. and S.A.; funding acquisition, Y.M., W.A.M. and S.A. All authors have read and agreed to the published version of the manuscript.
Funding
This research received no external funding.
Institutional Review Board Statement
This study did not require ethical approval from an Institutional Review Board (IRB) under the University of Liège regulations, as it is purely an observational, non-interventional study without the collection of identifiable personal data and relies solely on fully anonymized datasets. This exemption is in accordance with: Belgian Law of 7 May 2004 on experiments on the human person (which explicitly excludes purely observational studies from its scope), and EU Regulation 2016/679 (GDPR) principles on data anonymization (anonymous data being exempt). You may consult the official text of the Belgian Law of 7 May 2004 on the Federal e-Justice portal at: https://www.ejustice.just.fgov.be/eli/loi/2004/05/07/2004022376/moniteur. Accessed on 19 June 2025.
Informed Consent Statement
Informed consent was obtained from all subjects involved in the study.
Data Availability Statement
The data presented in this study are available on request from the corresponding author.
Conflicts of Interest
The authors declare no conflicts of interest.
Appendix A. The Predefined Itineraries in the Old City and Lower City of Béjaïa (OC, LC)
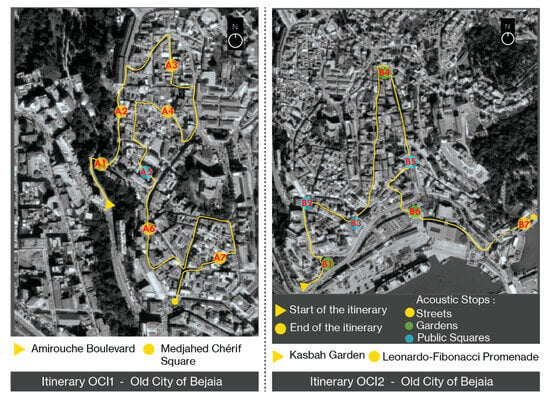
Figure A1.
The predefined itineraries in the Old City of Béjaïa (OCI1, OCI2).
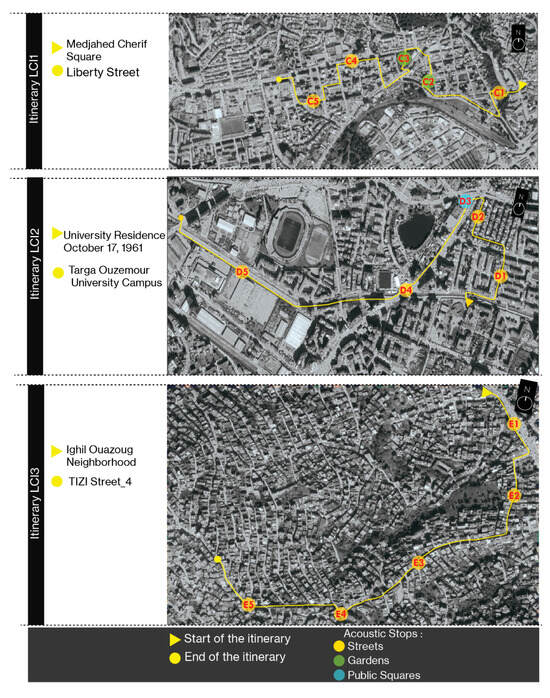
Figure A2.
The predefined itineraries in the Lower City of Béjaïa (LCI1, LCI2, LCI3).
Appendix B. Sociodemographic Profiles and Participation Rates

Table A1.
Table of details on participation rates for each itinerary.
Table A1.
Table of details on participation rates for each itinerary.
| Zone/Itinerary | Number of Participants | Participants in Both Zones | Unique Participants for This Itinerary | % of Total Participants |
|---|---|---|---|---|
| OCI1 | 12 | 7 | 5 | 20.7% |
| OCI2 | 11 | 5 | 6 | 19.0% |
| Total Old City | 23 | 39.7% | ||
| LCI1 | 12 | 3 | 9 | 20.7% |
| LCI2 | 10 | 6 | 4 | 17.2% |
| LCI3 | 13 | 9 | 4 | 22.4% |
| Total Lower City | 35 | 60.3% | ||
| Overall Total | 58 | 100.0% | ||

Table A2.
Sociodemographic characteristics of the survey participants.
Table A2.
Sociodemographic characteristics of the survey participants.
| Category | Number of Participants | Percentage (%) |
|---|---|---|
| Total Participants | 58 | 100.0% |
| Gender | ||
| Male | 36 | 62.1% |
| Female | 22 | 37.9% |
| Age Group | ||
| Under 18 | 8 | 13.8% |
| 18–30 years | 20 | 34.5% |
| 31–45 years | 16 | 27.6% |
| 46–60 years | 12 | 20.7% |
| Over 60 | 2 | 3.4% |
| Occupation | ||
| Students | 30 | 51.7% |
| Professionals | 20 | 34.5% |
| Retirees | 4 | 6.9% |
| Others | 4 | 6.9% |
| Status | ||
| Local residents | 31 | 53.4% |
| Merchants | 7 | 12.1% |
| Others | 20 | 34.5% |
Appendix C. Directional Photo Audit Grid (Ordinal Scale 0–1–2)

Table A3.
Directional photo audit grid (ordinal scale 0–1–2).
Table A3.
Directional photo audit grid (ordinal scale 0–1–2).
| Variable | 0-Low/Absent | 1-Moderate | 2-High/Dominant |
|---|---|---|---|
| Vegetation cover | ≤10% of the photo | 11–40% | >40% |
| Motor-vehicle density | 0 vehicles | 1–3 isolated vehicles | Continuous stream or queue (>3) |
| Cleanliness/Disorder | No litter | Occasional litter | Recurrent litter |
Appendix D. Perceptual Sound Intensity Coding Grid (0–10)

Table A4.
Perceptual Sound-Intensity Coding Grid (0–10).
Table A4.
Perceptual Sound-Intensity Coding Grid (0–10).
| Assigned Score * | Descriptive Category | Operational Criterion (Field Guide) | Illustrative Examples from Sound Journals |
|---|---|---|---|
| 0 | Silence | No sound perceived | “Complete silence”, “nothing audible” |
| 1–2 | Very faint | Barely audible; does not interrupt ongoing activity | “Background hum”, “dripping water” |
| 3–4 | Faint | Clearly audible yet non-intrusive | “Birdsong”, “soft conversation” |
| 5–6 | Moderate | Continuous sound that starts to divert attention | “Light traffic”, “background music” |
| 7–8 | Loud | Intrusive; voice must be raised to communicate | “Car horns”, “busy market” |
| 9–10 | Very loud | Marked annoyance or physical discomfort | “Siren”, “jackhammer” |
* Color-bar tick marks in Figure 7 (0, 2.5, 5, 7.5, 10) represent the mid-points of these intervals and are used solely for graphical rendering.
Appendix E. Modal Emotion (y-Axis) and Dominant Walking Response (Label) for Each Sound Category (x-Axis), Derived from Seven-Day Walking Journals (N = 50)
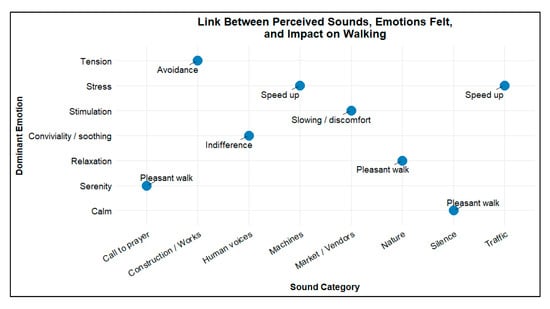
Figure A3.
Modal emotion (y-axis) and dominant walking response (label) for each sound category (x-axis), derived from seven-day walking journals (n = 50).
Appendix F. Results of the Sound Attribute Analysis for Each Study Area, Based on the ISO 12913 Framework and Visualized Using the ‘Soundscapy’ Tool Developed by Mitchell et al. []
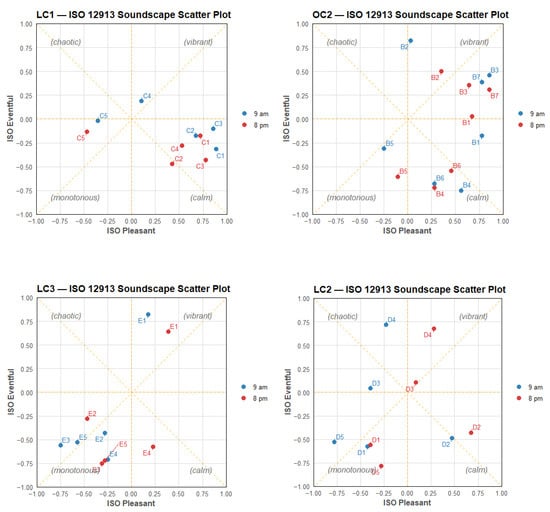
Figure A4.
Results of the Sound Attribute Analysis for Each Study Area, Based on the ISO 12913 Frame-work and Visualized Using the ‘Soundscapy’ Tool Developed by Mitchell et al. [].
Appendix G. Multivariate OLS Results (Standardized Variables, N = 58)

Table A5.
Multivariate OLS results (standardized variables, N = 58).
Table A5.
Multivariate OLS results (standardized variables, N = 58).
| Predictor | β (std.) | Std. Error | t | p-Value | 95% CI |
|---|---|---|---|---|---|
| LAeq | −0.18 | 0.14 | −1.27 | 0.208 | −0.47; +0.11 |
| Vegetation cover | +0.25 | 0.14 | +1.78 | 0.081 | −0.03; +0.53 |
| Motor-vehicle density | −0.23 | 0.15 | −1.53 | 0.131 | −0.53; +0.07 |
| Cleanliness | −0.28 | 0.13 | −2.13 | 0.038 | −0.54; −0.02 |
| SVF | −0.04 | 0.12 | −0.31 | 0.755 | −0.29; +0.21 |
Comfort score and all predictors were z-scored prior to estimation. Boldface indicates the only predictor whose 95% confidence interval does not cross zero (significant at p < 0.05).
References
- Baobeid, A.; Koç, M.; Al-Ghamdi, S.G. Walkability and Its Relationships With Health, Sustainability, and Livability: Elements of Physical Environment and Evaluation Frameworks. Front. Built Environ. 2021, 7, 721218. [Google Scholar] [CrossRef]
- Mansouri, Y.; Attar, A. Walking as a Vector of Urban and Landscape Requalification, Focused on the Perception of Lived Spaces. In Proceedings of the 58th ISOCARP World Planning Congress, Brussels, Belgium, 3–6 October 2022. [Google Scholar]
- Mansouri, Y.; Matallah, M.E.; Attar, A.; Mahar, W.A.; Attia, S. An Investigation of Microclimatic Influences on Pedestrian Perception and Walking Experience in Contrasting Urban Fabrics: The Case of the Old Town and the Lower City of Béjaïa, Algeria. Urban Sci. 2025, 9, 243. [Google Scholar] [CrossRef]
- Sundling, C.; Jakobsson, M. How Do Urban Walking Environments Impact Pedestrians’ Experience and Psychological Health? A Systematic Review. Sustainability 2023, 15, 10817. [Google Scholar] [CrossRef]
- Mansouri, Y.; Attar, A. The Role of Walkability in Creating Sustainable Cities and Communities. Case of the City of Bejaia in Algeria. In Proceedings of the OIC Youth Scientific Congress, Kazan, Russia, 21–23 November 2022. [Google Scholar]
- Schantz, P.; Olsson, K.S.E.; Salier Eriksson, J.; Rosdahl, H. Perspectives on Exercise Intensity, Volume, Step Characteristics and Health Outcomes in Walking for Transport. Front. Public Health 2022, 10, 911863. [Google Scholar] [CrossRef] [PubMed]
- ISO 12913-1:2014; Acoustics—Soundscape Part 1: Definition and Conceptual Framework 2014. ISO: Geneva, Switzerland, 2014.
- Kang, J. Soundscape in City and Built Environment: Current Developments and Design Potentials. City Built Enviro. 2023, 1, 1. [Google Scholar] [CrossRef]
- ISO/TS 12913-2:2018; Acoustics—Soundscape—Part 2: Data Collection and Reporting Requirements. ISO: Geneva, Switzerland, 2018.
- Basner, M.; Babisch, W.; Davis, A.; Brink, M.; Clark, C.; Janssen, S.; Stansfeld, S. Auditory and Non-Auditory Effects of Noise on Health. Lancet 2014, 383, 1325–1332. [Google Scholar] [CrossRef] [PubMed]
- Ozturk, Z.S.; Kang, J.; Aletta, F. Soundscape Research in Streets: A Scoping Review. Sustainability 2025, 17, 3329. [Google Scholar] [CrossRef]
- Axelsson, Ö.; Nilsson, M.E.; Berglund, B. A Principal Components Model of Soundscape Perception. J. Acoust. Soc. Am. 2010, 128, 2836–2846. [Google Scholar] [CrossRef]
- Morillas, J.M.B.; Montes González, D.; Vílchez-Gómez, R.; Rey-Gozalo, G. Estimation of the Occurrence and Significance of Noise Effects on Pedestrians Using Acoustic Variables Related to Sound Energy in Urban Environments. Appl. Sci. 2024, 14, 11212. [Google Scholar] [CrossRef]
- Clark, C.; Paunovic, K. WHO Environmental Noise Guidelines for the European Region: A Systematic Review on Environmental Noise and Quality of Life, Wellbeing and Mental Health. Int. J. Environ. Res. Public Health 2018, 15, 2400. [Google Scholar] [CrossRef]
- Aletta, F.; Zhou, K.; Mitchell, A.; Oberman, T.; Pluchinotta, I.; Torresin, S.; Cerwén, G.; Lam, B.; Can, A.; Guastavino, C.; et al. Exploring the Relationships between Soundscape Quality and Public Health Using a Systems Thinking Approach. npj Acoust. 2025, 1, 3. [Google Scholar] [CrossRef]
- Andersson, D.; Wahlgren, L.; Schantz, P. Pedestrians’ Perceptions of Route Environments in Relation to Deterring or Facilitating Walking. Front. Public Health 2023, 10, 1012222. [Google Scholar] [CrossRef]
- Kim, E.J.; Gong, Y. Perceived Built Environments Correlated to Route Choice for Healthy Leisure Walking. J. Asian Archit. Build. Eng. 2024, 24, 2936–2947. [Google Scholar] [CrossRef]
- Berkouk, D.; Bouzir, T.A.K.; Maffei, L.; Masullo, M. Examining the Associations between Oases Soundscape Components and Walking Speed: Correlation or Causation? Sustainability 2020, 12, 4619. [Google Scholar] [CrossRef]
- Wang, Z.; Novack, T.; Yan, Y.; Zipf, A. Quiet Route Planning for Pedestrians in Traffic Noise Polluted Environments. IEEE Trans. Intell. Transport. Syst. 2021, 22, 7573–7584. [Google Scholar] [CrossRef]
- Abo Eleinen, O.; Elrayies, G.; Hussein, R. Soundscape Approach for Analyzing and Evaluation Acoustic Environment in Urban Parks. Port-Said Eng. Res. J. 2016, 20, 10–16. [Google Scholar] [CrossRef]
- De Coensel, B.; Botteldooren, D. The Rhythm of the Urban Soundscape. Noise Vib. Worldw. 2007, 38, 11–17. [Google Scholar] [CrossRef]
- Mancini, S.; Mascolo, A.; Graziuso, G.; Guarnaccia, C. Soundwalk, Questionnaires and Noise Measurements in a University Campus: A Soundscape Study. Sustainability 2021, 13, 841. [Google Scholar] [CrossRef]
- Puyana Romero, V.; Maffei, L.; Brambilla, G.; Ciaburro, G. Acoustic, Visual and Spatial Indicators for the Description of the Soundscape of Waterfront Areas with and without Road Traffic Flow. Int. J. Environ. Res. Public Health 2016, 13, 934. [Google Scholar] [CrossRef]
- ISO 1996-1:2016; Acoustics—Description, Measurement and Assessment of Environmental Noise—Part 1: Basic Quantities and Assessment Procedures. ISO: Geneva, Switzerland, 2016.
- Ge, J.; Hokao, K. Applying the Methods of Image Evaluation and Spatial Analysis to Study the Sound Environment of Urban Street Areas. J. Environ. Psychol. 2005, 25, 455–466. [Google Scholar] [CrossRef]
- Rychtáriková, M.; Jedovnický, M.; Vargová, A.; Glorieux, C. Synthesis of a Virtual Urban Soundscape. Buildings 2014, 4, 139–154. [Google Scholar] [CrossRef]
- Nieto-Mora, D.A.; Rodríguez-Buritica, S.; Rodríguez-Marín, P.; Martínez-Vargaz, J.D.; Isaza-Narváez, C. Systematic Review of Machine Learning Methods Applied to Ecoacoustics and Soundscape Monitoring. Heliyon 2023, 9, e20275. [Google Scholar] [CrossRef]
- Erçakmak, U.B.; Dökmeci; Yörükoğlu, P.N. Comparing Turkish and European Noise Management and Soundscape Policies: A Proposal of Indoor Soundscape Integration to Architectural Design and Application. Acoustics 2019, 1, 847–865. [Google Scholar] [CrossRef]
- Harriet, S.; Murphy, D.T. Auralisation of an Urban Soundscape. Acta Acust. United Acust. 2015, 101, 798–810. [Google Scholar] [CrossRef]
- Lawrence, B.T.; Frücht, A.; Heying, D.; Schröer, K.; Gruehn, D. Acoustic Characterization of Potential Quiet Areas in Dortmund, Germany. Environments 2024, 11, 69. [Google Scholar] [CrossRef]
- Zhu, X.; Liu, F.; Kang, J.; Liu, S.; Wu, Y.; Zhao, W.; Xue, Y.; Wang, C. Assessing the Audio-Visual Environment at the Great Wall of China: Impacts on Visitor Satisfaction and Restoration. Appl. Acoust. 2024, 218, 109905. [Google Scholar] [CrossRef]
- ISO/TS 15666:2021; Acoustics—Assessment of Noise Annoyance by Means of Social and Socio-Acoustic Surveys 2021. ISO: Geneva, Switzerland, 2021.
- Aletta, F.; Kang, J.; Axelsson, Ö. Soundscape Descriptors and a Conceptual Framework for Developing Predictive Soundscape Models. Landsc. Urban Plan. 2016, 149, 65–74. [Google Scholar] [CrossRef]
- Sun, C.; Meng, Q.; Yang, D.; Wu, Y. Soundwalk Path Affecting Soundscape Assessment in Urban Parks. Front. Psychol. 2023, 13, 1096952. [Google Scholar] [CrossRef]
- Aletta, F.; Xiao, J. (Eds.) Handbook of Research on Perception-Driven Approaches to Urban Assessment and Design: Advances in Civil and Industrial Engineering; IGI Global: Hershey, PA, USA, 2018; ISBN 978-1-5225-3637-6. [Google Scholar]
- Kaarivuo, A.; Oppenländer, J.; Kärkkäinen, T.; Mikkonen, T. Exploring Emergent Soundscape Profiles from Crowdsourced Audio Data. Comput. Environ. Urban Syst. 2024, 110, 102112. [Google Scholar] [CrossRef]
- Jo, H.I.; Jeon, J.Y. Urban Soundscape Categorization Based on Individual Recognition, Perception, and Assessment of Sound Environments. Landsc. Urban Plan. 2021, 216, 104241. [Google Scholar] [CrossRef]
- Sacchelli, S.; Favaro, M. A Virtual-Reality and Soundscape-Based Approach for Assessment and Management of Cultural Ecosystem Services in Urban Forest. Forests 2019, 10, 731. [Google Scholar] [CrossRef]
- Aumond, P.; Can, A.; De Coensel, B.; Botteldooren, D.; Ribeiro, C.; Lavandier, C. Modeling Soundscape Pleasantness Using Perceptual Assessments and Acoustic Measurements Along Paths in Urban Context. Acta Acust. United Acust. 2017, 103, 430–443. [Google Scholar] [CrossRef]
- Ferguson, L.A.; Taff, B.D.; Blanford, J.I.; Mennitt, D.J.; Mowen, A.J.; Levenhagen, M.; White, C.; Monz, C.A.; Francis, C.D.; Barber, J.R.; et al. Understanding Park Visitors’ Soundscape Perception Using Subjective and Objective Measurement. PeerJ 2024, 12, e16592. [Google Scholar] [CrossRef]
- Yong Jeon, J.; Young Hong, J.; Jik Lee, P. Soundwalk Approach to Identify Urban Soundscapes Individually. J. Acoust. Soc. Am. 2013, 134, 803–812. [Google Scholar] [CrossRef]
- Aletta, F.; Brambilla, G.; Maffei, L.; Masullo, M. Urban Soundscapes: Characterization of a Pedestrian Tourist Route in Sorrento (Italy). Urban Sci. 2016, 1, 4. [Google Scholar] [CrossRef]
- Doser, J.W.; Hannam, K.M.; Finley, A.O. Characterizing Functional Relationships between Anthropogenic and Biological Sounds: A Western New York State Soundscape Case Study 2019. Landsc. Ecol. 2020, 35, 689–707. [Google Scholar] [CrossRef]
- Hong, J.; Jik Lee, P. Evaluation of Urban Soundscape Using Soundwalking. In Proceedings of the 20th International Congress on Acoustics, ICA 2010, Sydney, Australia, 23–27 August 2010. [Google Scholar]
- Aletta, F.; Oberman, T.; Mitchell, A.; Erfanian, M.; Kang, J. Soundscape Experience of Public Spaces in Different World Regions: A Comparison between the European and Chinese Contexts via a Large-Scale on-Site Survey. J. Acoust. Soc. Am. 2023, 154, 1710–1734. [Google Scholar] [CrossRef]
- Yin, Y.; Shao, Y.; Lu, H.; Hao, Y.; Jiang, L. Predicting and Visualizing Human Soundscape Perception in Large-Scale Urban Green Spaces: A Case Study of the Chengdu Outer Ring Ecological Zone. Forests 2023, 14, 1946. [Google Scholar] [CrossRef]
- Lu, X.; Xie, Z.; Zhu, P.; Dai, X.; Zhang, Y.; Tao, W.; Wang, S. Comparative Evaluation of Soundscapes in Human Activities Spatial Contexts of Pedestrian Spaces Adjacent to Arterial Roads. Sci. Total Environ. 2024, 928, 172198. [Google Scholar] [CrossRef]
- Hong, J.Y.; Lam, B.; Ong, Z.-T.; Ooi, K.; Gan, W.-S.; Kang, J.; Yeong, S.; Lee, I.; Tan, S.-T. Effects of Contexts in Urban Residential Areas on the Pleasantness and Appropriateness of Natural Sounds. Sustain. Cities Soc. 2020, 63, 102475. [Google Scholar] [CrossRef]
- Bian, Q.; Zhang, C.; Wang, C.; Yin, L.; Han, W.; Zhang, S. Evaluation of Soundscape Perception in Urban Forests Using Acoustic Indices: A Case Study in Beijing. Forests 2023, 14, 1435. [Google Scholar] [CrossRef]
- Zhang, H.; Qiu, M.; Li, L.; Lu, Y.; Zhang, J. Exploring the Dimensions of Everyday Soundscapes Perception in Spatiotemporal View: A Qualitative Approach. Appl. Acoust. 2021, 181, 108149. [Google Scholar] [CrossRef]
- Liu, J.; Yang, L.; Xiong, Y.; Yang, Y. Effects of Soundscape Perception on Visiting Experience in a Renovated Historical Block. Build. Environ. 2019, 165, 106375. [Google Scholar] [CrossRef]
- Bouzir, T.A.K.; Berkouk, D.; Eisenman, T.S.; Schwela, D.; Azab, N.; Gomma, M.M.; Boucherit, S. Soundscapes in Arab Cities: A Systematic Review and Research Agenda. SV 2024, 58, 1–24. [Google Scholar] [CrossRef]
- Ikni, K.; Debache-Benzagouta, S.; Woloszyn, P. La chronotopie du paysage sonore urbain des places publiques: Le cas de la place 1er novembre 1954 à Béjaïa (Algérie). Cybergeo: Eur. J. Geogr. 2020, 942. [Google Scholar] [CrossRef]
- Ikni, K.; Cherrat, H.; Saraoui, S. The Sound Experience in the Converted Buildings. Case of Bejaia’s Kasbah Library. Urbanism. Architecture. Constr. 2022, 12, 121–131. [Google Scholar]
- Boumezoued, S.; Bada, Y.; Bougdah, H. Pedestrian Itinerary Choice: Between Multi-Sensory, Affective and Syntactic Aspects of the Street Pattern in the Historic Quarter of Bejaia, Algeria. IRSPSD Int. 2020, 8, 91–108. [Google Scholar] [CrossRef]
- Bouaifel, K.; Madani, S. Urban landscape and sensitive dimension: The Case of the old city of Béjaia, Algeria. Bull. De La Société Géographique De Liège (BSGLg) 2021, 77, 45–67. [Google Scholar] [CrossRef]
- Caillart, E.; Cusenier, P.; Bazizi, K. Pour La Sauvegarde et La Mise En Valeur de La Médina de Béjaïa; UNESCO: Paris, France, 2004. [Google Scholar]
- Mansouri, Y.; Stefàno, D. The Perception of Mediterranean Cities through Walking. The Landscape of Béjaïa in Algeria and Loulé in Portugal. In Proceedings of the International Conference on Changing Cities VI: Spatial, Design, Landscape, Heritage & Socio-Economic Dimensions, Rhodes Island, Greece, 24–28 June 2024. [Google Scholar]
- Salvator, L. Bougie, La Perle de l’Afrique Du Nord; (V. Jambert, Trad.); L’Harmattan: Paris, France, 1999. [Google Scholar]
- Jordan, P. Historic Approaches to Sonic Encounter at the Berlin Wall Memorial. Acoustics 2019, 1, 517–537. [Google Scholar] [CrossRef]
- Geisler, É.; Manola, T. Les paysages de Kronsberg à Hanovre: Approches sonore et multisensorielle. Proj. De Paysage 2011, 6, 1–18. [Google Scholar] [CrossRef]
- Aletta, F.; Oberman, T. Soundscape Assessment: Towards a Validated Translation of Perceptual Attributes in Different Languages. In Proceedings of the Inter-Noise and Noise-Con Congress and Conference Proceedings, Seoul, Republic of Korea, 23 August 2020. [Google Scholar]
- Aletta, F.; Mitchell, A.; Oberman, T.; Kang, J.; Khelil, S.; Bouzir, T.A.K.; Berkouk, D.; Xie, H.; Zhang, Y.; Zhang, R.; et al. Soundscape Descriptors in Eighteen Languages: Translation and Validation through Listening Experiments. Appl. Acoust. 2024, 224, 110109. [Google Scholar] [CrossRef]
- ISO 20252:2019; Market, Opinion and Social Research, Including Insights and Data Analytics—Vocabulary and Service Requirements. International Organization for Standardization: Geneva, Switzerland, 2019.
- ISO 1996-2:2017; Acoustics—Description, Measurement and Assessment of Environmental Noise Part 2: Determination of Sound Pressure Levels 2017. ISO: Geneva, Switzerland, 2017.
- Parmar, V.; Jana, A. A Review of Tools and Techniques for Audio-Visual Assessment of Urbanscape. Discov. Cities 2024, 1, 29. [Google Scholar] [CrossRef]
- Huguenin-Richard, F.; Cloutier, M.-S. Mesure Du Potentiel de Marche et de l’accessibilité Dans Les Espaces Urbains Pour Les Piétons Âgés. Flux 2021, 123, 30–53. [Google Scholar] [CrossRef]
- Vallejo-Borda, J.A.; Cantillo, V.; Rodriguez-Valencia, A. A Perception-Based Cognitive Map of the Pedestrian Perceived Quality of Service on Urban Sidewalks. Transp. Res. Part F Traffic Psychol. Behav. 2020, 73, 107–118. [Google Scholar] [CrossRef]
- Limna, P. The Impact of NVivo in Qualitative Research: Perspectives from Graduate Students. J. Appl. Learn. Teach. 2023, 6, 2. [Google Scholar] [CrossRef]
- Bishwal, R.M. Potential Use of R-Statistical Programming in the Field of Geoscience. In Proceedings of the 2017 2nd International Conference for Convergence in Technology (I2CT), Mumbai, India, 7–9 April 2017; IEEE: New York, NY, USA; pp. 979–982. [Google Scholar]
- Lillis, D. Use R for Data Analysis and Research. N. Z. Sci. Rev. 2023, 68, 73–79. [Google Scholar] [CrossRef]
- Weinberg, S.L.; Harel, D.; Abramowitz, S.K. Statistics Using R: An Integrative Approach, 2nd ed.; Cambridge University Press: Cambridge, UK, 2023; ISBN 978-1-00-940014-5. [Google Scholar]
- ISO/TS 12913-3:2019; Acoustics—Soundscape—Part 3: Data Analysis. ISO: Geneva, Switzerland, 2019.
- Mitchell, A.; Aletta, F.; Kang, J. How to Analyse and Represent Quantitative Soundscape Data. JASA Express Lett. 2022, 2, 037201. [Google Scholar] [CrossRef] [PubMed]
- Song, B.; Gong, C.; Gao, Y.; Ke, Y.; Wang, Z.; Lin, R.; Cai, Y. Music Literacy and Soundscape Perception: A Study Based on the Soundwalk Method of Soundscapes. Int. J. Environ. Res. Public Health 2022, 19, 8471. [Google Scholar] [CrossRef]
- Berki, O. Une expérience paysagère: Béjaïa et ses environs, entre violence et douceur de vivre. Strates 2004, 11, 1–18. [Google Scholar] [CrossRef]
- Mahroug, E.; Belakehal, A. The Evolution of Heritage Atmospheres in the Medina of Tunis since the 19th Century. In Proceedings of the 1st International Conference on Islamic Heritage Architecture and Art (IHA 2016), Valencia, Spain, 17–19 May 2016. [Google Scholar]
- Rodrigues, G.F.; Aulet, S.; Vidal-Casellas, D. Soundscape, Intangible Cultural Heritage and Tourism: A Study of the Manual Ringing of Bells in Cervera (Catalonia, Spain). J. Herit. Tour. 2025, 20, 130–149. [Google Scholar] [CrossRef]
- Foale, K.; J Davies, W. A Listener-Centred Approach to Soundscape Evaluation. In Proceedings of the Acoustics 2012 Conference, Nantes, France, 23–27 April 2012. [Google Scholar]
- Li, W.; Zhai, J.; Zhu, M. Characteristics and Perception Evaluation of the Soundscapes of Public Spaces on Both Sides of the Elevated Road: A Case Study in Suzhou, China. Sustain. Cities Soc. 2022, 84, 103996. [Google Scholar] [CrossRef]
- Ren, X.; Wei, P.; Wang, Q.; Sun, W.; Yuan, M.; Shao, S.; Zhu, D.; Xue, Y. The Effects of Audio-Visual Perceptual Characteristics on Environmental Health of Pedestrian Streets with Traffic Noise: A Case Study in Dalian, China. Front. Psychol. 2023, 14, 1122639. [Google Scholar] [CrossRef] [PubMed]
- Sayin, E.; Krishna, A.; Ardelet, C.; Briand Decré, G.; Goudey, A. “Sound and Safe”: The Effect of Ambient Sound on the Perceived Safety of Public Spaces. Int. J. Res. Mark. 2015, 32, 343–353. [Google Scholar] [CrossRef]
- Astolfi, A.; Orecchia, P.; Bo, E.; Shtrepi, L.; Calleri, C.; Aletta, F. Influence of Soundscapes on Perception of Safety and Social Presence in an Open Public Space. In Advances in Civil and Industrial Engineering; IGI Global: Hershey, PA, USA, 2018; pp. 126–149. [Google Scholar]
- Marian, V.; Hayakawa, S.; Schroeder, S.R. Cross-Modal Interaction Between Auditory and Visual Input Impacts Memory Retrieval. Front. Neurosci. 2021, 15, 661477. [Google Scholar] [CrossRef] [PubMed]
- Viollon, S.; Lavandier, C.; Drake, C. Influence of Visual Setting on Sound Ratings in an Urban Environment. Appl. Acoust. 2002, 63, 493–511. [Google Scholar] [CrossRef]
- Zhou, Z.; Tian, J.; Zhu, Y.; Kang, J. Impact of Visual Factors on Soundscapes in Pedestrian Spaces along Trunk Roads. Transp. Res. Part D Transp. Environ. 2025, 139, 104583. [Google Scholar] [CrossRef]
- Schafer, R.M. The Soundscape: Our Sonic Environment and the Tuning of the World; Destiny Books: Rochester, VT, USA, 1994; ISBN 0-89281-455-1. [Google Scholar]
- Zhao, W.; Rui, Q.; Zhu, X.; Xu, H. Effect of Soundscape on Place Attachment for Historical Blocks: A Case Study of Harbin, China. Buildings 2023, 13, 607. [Google Scholar] [CrossRef]
Disclaimer/Publisher’s Note: The statements, opinions and data contained in all publications are solely those of the individual author(s) and contributor(s) and not of MDPI and/or the editor(s). MDPI and/or the editor(s) disclaim responsibility for any injury to people or property resulting from any ideas, methods, instructions or products referred to in the content. |
© 2025 by the authors. Licensee MDPI, Basel, Switzerland. This article is an open access article distributed under the terms and conditions of the Creative Commons Attribution (CC BY) license (https://creativecommons.org/licenses/by/4.0/).