Abstract
The failure of a porcelain insulator on a transmission line is a crucial cause of power supply interruptions, leading to poor reliability and revenue loss. The insulator’s performance is adversely affected by environmental contaminants, and wettability intensifies this adverse effect by developing a conductive path along the insulator’s surface, leading to premature flashover and insulator failure. This work aims to analyze the response of the electric field distribution and current density using the finite element method (FEM) under different wettability conditions. Discrete water droplets were placed along the surface, and the contact angle was varied to represent different levels of surface hydrophobicity. Abrupt rises and spikes were observed on the plots for the electric field and current density distribution, indicating distortion; however, the distortion kept on decreasing with the increase in the contact angle. Overall, the average stress followed a declining pattern, where the values of the electric field were reduced from 2.588 to 2.412 kV/cm, and current the density was reduced from 0.187 to 0.068 nA/cm2 for an increase in the contact angle from 60° to 140°. Simulation results advocate for hydrophobic insulator surfaces. Therefore, a proper coating is necessary to enrich hydrophobicity and mitigate the adversity of wettability. Polyurethane, due to its excellent hydrophobic and insulating properties, offers a potential coating. Flashover voltage tests have been performed for the coated insulator under dry and wet conditions, where the flashover voltage improved from 79.14 kV to 82.04 kV and 48.4 kV to 53.8 kV, respectively, which supports the simulations’ outcomes.
1. Introduction
For a reliable power system operation, consumers must receive an uninterrupted supply, and insulator failure is one of the key causes of interruption. Outdoor insulators are subjected to numerous factors, such as rain, dust, fog, and contamination, that affect their performance, making them vulnerable to repeated flashover [1,2]. The atmosphere contains diverse pollutants, including sea and road salts in coastal areas, as well as agricultural and road dust, bird droppings, fertilizers, and various industrial emissions depending on the location. Outdoor overhead transmission line insulators are exposed to these contaminants, with coastal regions being dominated by sodium chloride (NaCl) and areas near cement or coal plants experiencing higher levels of calcium oxide (CaO) salts [3,4]. The literature reveals that soluble contaminants have a more drastic influence on insulator performance [5]. This is due to the fact that the mobility of charged particles is enhanced with the increasing concentration of the soluble salts, which results in the formation of conductive path [6]. The path boosts the magnitude as well as the duration of the leakage current, producing heat dissipation. Then, dry bands are formed in highly stressed regions, which eventually bridge the insulator along the surface under certain applied voltages, and an arc discharge is developed, called a flashover [7,8]. Depending on the degree of wettability, the contamination distribution, and the shape of the insulator, the electric field distribution is differently affected [9].
Static contact angles offer a straightforward way to assess a surface’s natural attraction for a liquid when the system is stable. This angle reflects the balance of forces between the liquid’s surface tension (cohesive) and the adhesive forces between the liquid and the solid surface [10,11]. Consider a water droplet placed on a smooth surface; the angle the droplet’s edge makes with the surface is the static contact angle, which is elaborated in Figure 1a, where γSL, γSV, and γLV are interfacial tensions, and θ is the tangent angle at the interface of the liquid and the surface. Dynamic contact angles, on the other hand, are measured when the three-phase boundary (contact line) is in motion, either during the wetting (advancing) or de-wetting (receding) of the surface. The static contact angle, due to its simplicity and ease of measurement, is widely used to understand a material’s basic surface properties, such as desired wettability after treatments (coating or cleaning). A low static contact angle (usually less than 90°) indicates good wetting, meaning the liquid spreads easily on the surface and the surface is hydrophilic. A high static contact angle (usually greater than 90°) indicates poor wetting, and the liquid tends to take the form of a sphere and the surface is hydrophobic. The effect of the contact angle on the shape of the water droplet is explained in Figure 1b, where surface hydrophobicity decreases from top to bottom. It is obvious that the shape of the water droplet at the top surface, with a high contact angle, is close to a sphere, which helps it to roll from the surface, making it dry. Hydrophobic surfaces have also been witnessed in some plants and animal furs [12,13], and lotus leaf is the most prominent one [14,15].
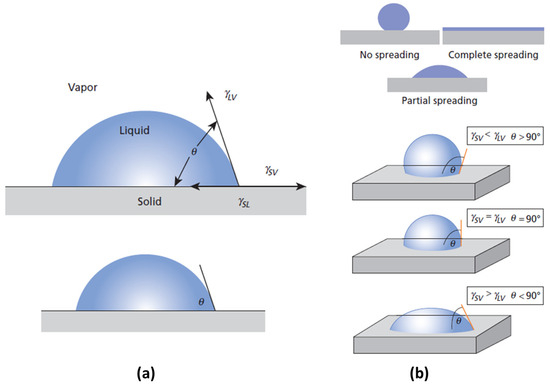
Figure 1.
(a) Contact angle. (b) Impact of contact angle on the shape of the water droplet. Reprinted from [13].
Among insulators, polymers have displayed better hydrophobicity, but ceramic insulators are superior in terms of their insulating capabilities and mechanical strength [16,17,18]; even composite insulators cannot match ceramics in terms of electromechanical stress [19,20,21,22,23]. Porcelain insulators are usually preferred for their rigidity and excellent cantilever strength, which is important for supporting heavy busbars and apparatus. The surface of a porcelain insulator is glazed to cope with the external effects. However, the surface still has a reasonable degree of adhesivity and hydrophilicity, facilitating contaminants and wettability, and is prone to flashover more often. Thus, a proper coating is essential for a ceramic insulator to enrich the hydrophobicity of the surface and to minimize the influence of pollution, and polymer-based coatings are commonly used to protect surfaces from external effects [24,25,26].
The aim of this study is to examine the impact of the contact angle of water droplets on the electric field and current density distribution of the insulator surface as wettability distorts these field distributions. As software provides more flexibility in studying the wide range of circumstances and conditions, different wettability scenarios have been modeled in COMSOL Multiphysics software® version 6.1. To intuitively analyze field distribution for complex geometries, the finite element method (FEM) stands out as crucial numerical technique [27,28], and it has been applied here. In addition, the insulator has been tested for flashover voltage using polyurethane as a potential coating material under dry and wet conditions.
2. Materials and Methods
2.1. Coating Material
There are several coating materials that are used for different purposes; however, for insulator surfaces, a few of the essentially hydrophobic examples have been discussed below; these are poly meta-phenylene isophthalamide (PMIA) paper (with nano-SiO2), silicon nitride (Si3N4), silicon carbide (SiC), and polyurethane (PU). Other important properties include relative permittivity, thermal conductivity, density, and insulating strength [29] (listed in Table 1).

Table 1.
Characteristics of potential coating material.
In areas with high temperatures and the possibility of heat buildup, a material with higher thermal conductivity increases the risk of flashover more than the one with low thermal conductivity. This is due to the fact that low thermal conductivity means low heat transfer capability, which minimizes the heat transfer, preventing the insulator from overheating and potentially causing flashover. The lower density and viscosity of the varnishes and coatings offer better coating atomization, resulting in a finer and more even spraying application. It also improves leveling, producing a more uniform, smoother, and aesthetic surface [42]. Moreover, as high-voltage insulators are applied by means of strings, the high density of the material further adds to the weight of the string and creates a burden for the supporting tower. Therefore, polyurethane and PMIA paper (with nano-SiO2) are of greater interest than other two materials.
Relative electrical permittivity is another crucial parameter to be discussed. The materials with lower permittivity are helpful for a more uniform distribution of the electric field along the surface; however, it must be kept in mind that when two materials with different permittivities are in contact, a significant portion of the electric field will be concentrated in the material with lower permittivity, potentially leading to overstressing and the failure of that component [43,44,45]. So, to achieve uniform electric field distribution, polyurethane, with comparable relative permittivity to that of ceramic materials, is better suited to being studied as a coating material.
2.1.1. Polyurethane
Polyurethane belongs to the class of block copolymers and possesses many useful features, such as biocompatibility, bio-stability, non-flammability, and nontoxicity [32]. It is also transparent, hard, and considered to be an anti-aging material with abrasion resistance. Its exceptional features are due to presence of hard–soft segments in its microstructure [46,47]. The general reaction for polyurethane is shown in Figure 2, and some other properties of polyurethane listed in Table 2.
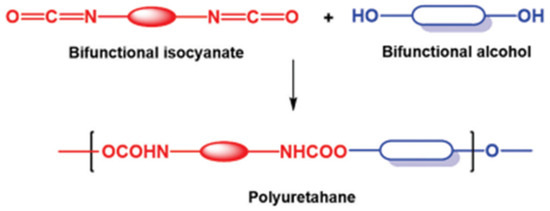
Figure 2.
Addition reaction to synthesize polyurethane. Reprinted from [47].
Table 2.
Polyurethane properties [28,29].
Thermoset polyurethane, owing to its rigidness and excellent hydrophobicity, is the preferred for coating on insulator surfaces. It is synthesized by a reaction between oxytetramethylene, which is a soft-segment polyol, and hexamethylene diisocyanate, providing the di-isocyanate functionality necessary for crosslinking. Dibutyltin dilaurate (DBTDL) was used as a catalyst to accelerate the reaction [48,49,50].
n(HO-O-(CH2)4-O-) + n(O=C=N-(CH2)6-N=C=O) → (HO-O-(CH2)4-O-U-O-(CH2)4-O-)n
2.1.2. Application Process
Three methods—namely, the brushing method, spraying method, and dipping method—are commonly used to deposit a layer on the surface of the insulator [51]. The spraying method with air atomization is more effective than the other methods due to its small dispersion [51,52], and it was utilized to deposit the coating in this work. In this method, compressed air is mixed with the polymer and sprayed on the insulator. The process of atomization takes place through increased air speed, which scatters polyurethane into fine droplets, facilitating a fine and uniform coating [52]. The thickness of the coating for high-voltage insulators should neither be very low nor too high as low thickness does not provide adequate hydrophobicity, while high thickness leads to an increase in temperature due to surface leakage current. The thickness of polyurethane was kept around 0.4 mm. The curing condition for the polyurethane coating is 10–25 °C, with relative humidity of 45–50% [53].
2.2. Finite Element Method (FEM)
The electric field is computed by gradient of potential:
Poisson’s equation for electrostatics in terms of the potential distribution is given as follows:
The finite element method (FEM) which was proposed by Courant in 1943 [54]. Later, it was applied in electromagnetics and microwave engineering to analyze wave propagation [55,56]. This method is employed in order to solve boundary value problems (BVPs), which are described by a partial differential equation along with a set of boundary conditions. The governing differential equation is converted into a set of linear algebraic equations to obtain the approximate solution of a given boundary value problem [57]. In this method, the region or domain of interest is subdivided into a finite number of subregions or subdomains known as “finite elements”, whose shape is defined by nodes. The trial functions, in the form of polynomials, defined in each element are known as shape functions or interpolation functions since they are used to find the primary unknown quantity within the element via its value at the nodes [58]. A system of linear equations is obtained through the conversion of the governing differential equation, using either the variational method or the weighted residual method. The variational method requires a functional that depicts the energy related to the boundary value problem (BVP), which is further minimized by setting its partial derivatives to zero with respect to dependent variables. On the other hand, the weighted residual method does not require any functional and directly starts by finding the residual from the differential equation of the boundary value problem (BVP). The product of the weight function and the residual is integrated over the domain, resulting in weak form representation of the BVP.
Rectangular elements are mostly applied for simple geometries; to cover the complex geometry, triangular elements as shown in Figure 3 [59], are preferred over rectangular elements [60,61]. The numbers 1, 2, and 3 in Figure 3 indicate the nodes of triangular element covering the geometry for which electric field and current density are measured. COMSOL software uses a Galerkin approach to the weighted residual method as it is simple and begins directly with the differential equation of the associated boundary value problem. The obtained system of linear equations can be solved either by using the Gauss elimination method or the LU factorization method to find the potential at all nodes, and potential elsewhere can be interpolated [62,63,64].
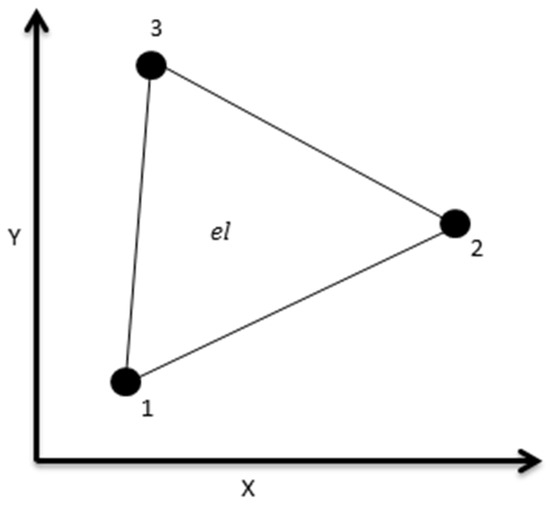
Figure 3.
Triangular element [59].
2.3. Flashover Testing
The experimental setup for power frequency flashover testing included a testing transformer of 25 kVA as a regulated AC voltage source up to 150 kV. The applied voltage increased linearly (2% per s) up to the flashover voltage within 1 min, as per the IEC-60060-1standard [65]. The water pipe acts as a series impedance, with the value adjusted to ~100 kΩ, and a capacitive voltage divider was used for measurement purposes, as shown in Figure 4. A disc insulator from class 52-10 ANSI, having 160 kN strength with an AC flashover voltage of 80 kV under dry conditions and 50 kV under wet conditions, was taken as a test specimen.
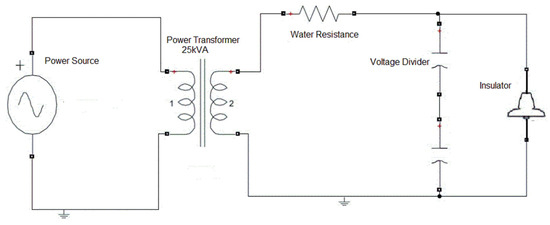
Figure 4.
Flashover test setup [66].
3. Results and Discussion
3.1. Simulations for Electric Field Distribution
The insulator specimen considered has been modeled in COMSOL Multiphysics®, as shown in Figure 5a,b, to analyze the electric filed distribution and current density via the finite element method. The outdoor porcelain insulator comprises three main parts: (1) the main porcelain insulating material; (2) the cap and pin iron ends employed to connect the insulator to the power system structure; and (3) the intermediary cement that clenches the insulator to the metal fittings. The diameter of the insulator has been taken as 30 cm, and pin-to-cap clearance has been taken as 16.5 cm.
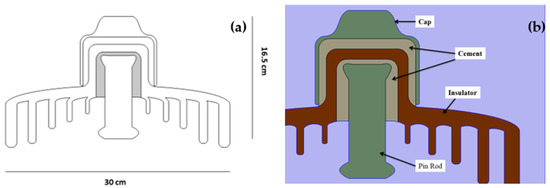
Figure 5.
Porcelain disc insulator: (a) dimension; (b) labeling.
The relative permittivity of porcelain has been taken to be 6 [67], while this value is taken to be 1 for air and cast iron and 10 for moist concrete (cement) [68].
3.1.1. Dry Condition
The modeled insulator has been simulated under dry conditions, where 50 kV is applied to the insulator. Figure 6 shows the potential distribution contour, along with the electric field lines, where it can be observed that the lines are dense at the junction of the cap, air, and cement, indicating maximum electric field. However, the field lines are more distant towards the edges of the surface.
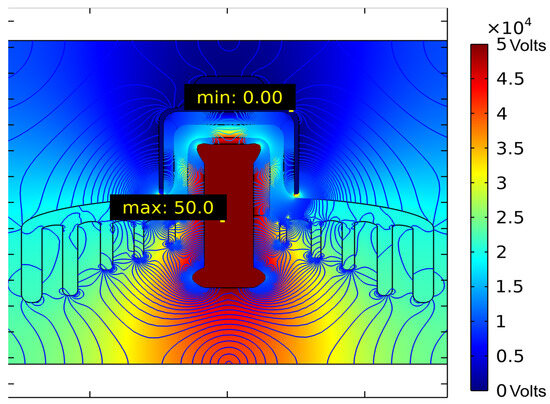
Figure 6.
Electric potential contour and electric field lines (dry surface).
The electric field was plotted along the creepage path, as shown in Figure 7a,b. It can be observed that the electric field decreases and then starts increasing, with some sudden rises. To elaborate further, the plot has been divided into two portions: Figure 8a illustrates the electric field for the upper surface; and Figure 8b illustrates the electric field for the lower surface. Figure 8a shows a decrease in the electric field value, and the decrease is seen to be gradual as it is traverses from the center to the ends. This pattern is consistent with that in Figure 6, where field lines are more distant at the edges, far away from the potential source. Figure 8b demonstrates some peaks on the plot, and the amplitude rises progressively as we approach the center near, the potential source.
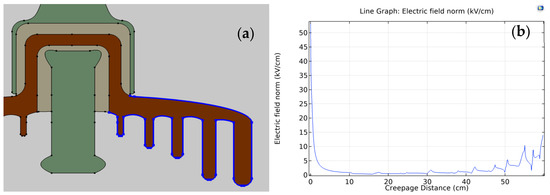
Figure 7.
Electric field plot (dry case): (a) selection path; (b) electric field curve.
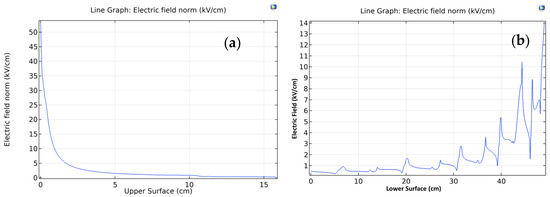
Figure 8.
Electric field plot (dry case): (a) upper surface; (b) lower surface (from the outer edge to the inner curve).
3.1.2. Wet Condition
Hydrophilic case: Six water droplets with typical relative permittivity of 80 [69,70] and conductivity of 178 /cm (0.0178 S/m) [71,72] were placed along the surface of the insulator with a contact angle of 60°, illustrating a hydrophilic situation, as shown in Figure 9.
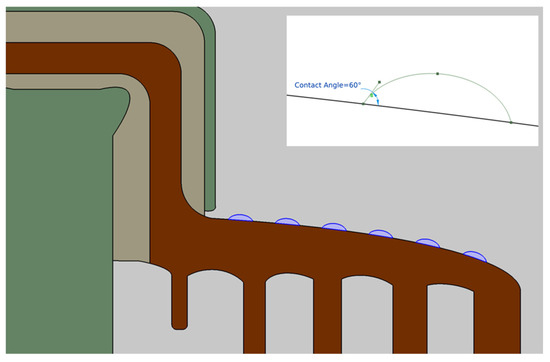
Figure 9.
Water droplets for hydrophilic case (contact angle: 60).
Water droplets with a radius of 2 mm were considered to have a volume of 33.5 mm3 . In 2D geometry, volume cannot be modeled, so the area of the circle was considered, which is 12.5664 mm2. The droplets are considered at rest, and their contact line is stationary, so a static angle has been considered. The focus of this study is on the discrete droplets with a fair distance between them, reducing the likelihood of droplet interactions [73]. The voltage distribution, through colors, as well as the electric field patterns around the water droplet are shown in Figure 10. It can be seen that the field lines are denser around the water droplets, indicating high electric field stress.
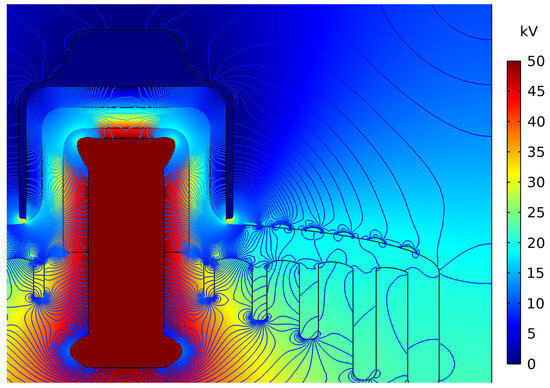
Figure 10.
Electric potential contour and electric field lines (hydrophilic surface).
The selection path and plot for electric field distribution along the outer surface is shown in Figure 11. Although the pl3.2.ot follows a declining pattern towards outer edge, this is not gradual; rather, it has been distorted. The peaks appeared due to the fact that water droplets have different permittivity than the insulator, and electric field lines are thus denser around water droplets. The first peak, magnified at the top right corner, reveals its width to be 0.86 cm.
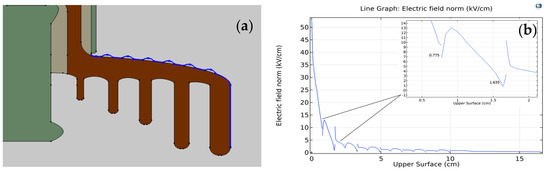
Figure 11.
Electric field for hydrophilic case (): (a) selection path; (b) electric field curve.
- (I)
- Hydrophobic case: The contact angle of the water droplets has now been changed to , resembling a hydrophobic case, as shown in Figure 12, where voltage distribution is indicated through varying colors and electric field patterns are indicated through lines. As discussed in Section 1, referring to Figure 1b, the water droplet splits over the surface with a low contact angle, and it tends to be spherical when the contact angle is high (approaching to ); however, its volume remains the same. In 2D geometry, volume cannot be modeled; thus, the area of the shape has been kept the same.
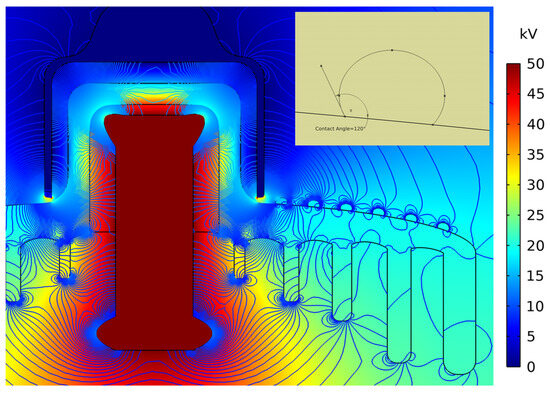 Figure 12. Electric potential contour and electric field lines (hydrophobic surface).The shape of the water droplets changes, as does the electric field around them. Electric field distribution has been plotted along the outer surface, as shown in Figure 13, where it can be seen that the curve is still distorted; however, the peaks have been narrowed down. The magnified first peak is shown at the top right corner, where the reduction in width is evident, i.e., 0.835 cm. Though the amplitude of the first peak is bit higher, the overall stress (average) is reduced to 2.425 kV/cm, compared with 2.588 kV/cm for the hydrophilic surface (Table 3). The maximum value of the curve (at the start of the curve) also has a declining pattern, as can be seen in Table 3. Average values have been measured using a measuring probe in the software, which traverses the predefined path and integrates the data then dividesby the path length; thus, the unit remains same i.e: kV/cm. The maximum values presented in Table 3 refer to the highest point on entire curve that appearsat the beginning of the curve the region closer to center, in the vicinity of first droplet It was noted that the values decreased with the increase in contact angle.
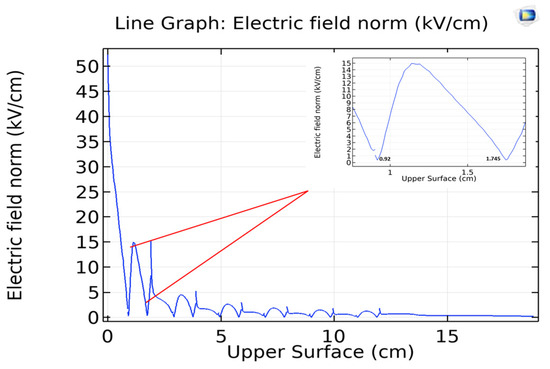 Figure 13. Electric field plot for the hydrophobic case ().
Table 3. Electric field measurement at the upper surface.
Figure 13. Electric field plot for the hydrophobic case ().
Table 3. Electric field measurement at the upper surface.
- (II)
- Strongly hydrophobic case: The water droplets tend to be more sphere-shaped with a higher contact angle of the hydrophobic surface and have a tendency to roll off from the surface, making it dry before too long [10,11,74]. It has been noted elsewhere that a contact angle of polyurethane up to 140 is achievable [30]. Here, an example of strongly hydrophobicity, with a contact angle of , where the voltage distribution is shown through colors and the lines represent electric field patterns, has been simulated for the worst-case scenario with the droplets still present on the surface, as illustrated in Figure 14.
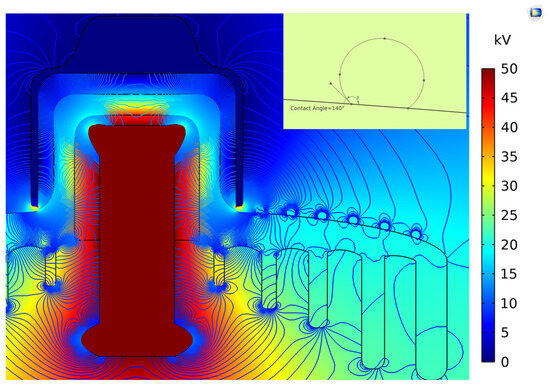 Figure 14. Electric potential contour and electric field lines (strong hydrophobic surface).Referring to Figure 15, the electric field plot for the strongly hydrophobic case still shows distortion; however, peaks have been further narrowed down. The magnified first peak (the top right corner of Figure 15) shows a width reduction to 0.719 cm, and overall stress is noted to be 2.412 kV/cm (Table 3), making this case better than that of the and cases.
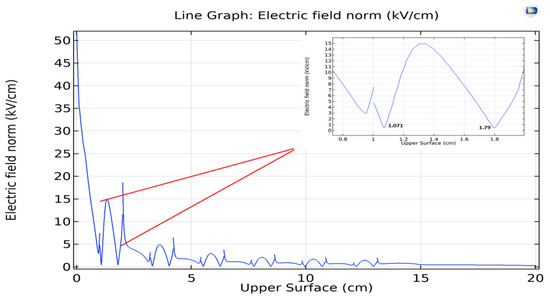 Figure 15. Electric field plot for strongly hydrophobic case ().Maximum values are indeed observed to decline with higher contact angles, showing less accumulation of field lines in the vicinity of the water droplet for the higher contact angle. This is mainly due to the fact that water droplets spread more on hydrophilic surfaces, while in case of hydrophobic surfaces, water droplets tend to be spherical in shape, resulting in a smaller contact area.
3.2. Simulations for Current Density
Current density curves have also been plotted for the conditions under study, as illustrated in Figure 16. Conductivity values were set as follows: water (rain) at 0.0178 S/m [71,72]; porcelain at 10−12 S/m [75]; air at 1.8 × 10⁻¹⁴ S/m [76]; concrete at 10−4 S/m [77]; and the iron rod and cap at 10+7 S/m [78]. The curve for the dry condition (Figure 16a) depicts a gradual decrease towards the outer edges; however, the decrease is not gradual for wet conditions; rather, it exhibit distortion in the form of sudden elevations or spikes, as shown in Figure 16b–d. By focusing at the prominent spike, the amplitude has been significantly reduced from 0.187 nA/cm2 for hydrophilic cases to 0.078 nA/cm2 for hydrophobic cases. This decline continues to 0.054 nA/cm2 for the strongly hydrophobic case. This declining trend strongly suggests that distortion or disruption is attenuated by surfaces that repel water.
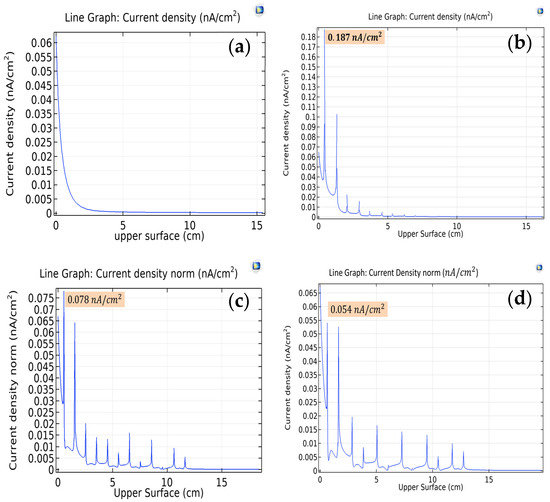
Figure 16.
Current density plot: (a) dry case; (b) wet case with hydrophilic surface; (c) hydrophobic surface; (d) strong hydrophobic surface.
The maximum and average values of current density along the outer surface for three cases of wettability have also been noted and are listed in Table 4. Values support the earlier observation of a decreasing trend with an increase in the contact angle. The average value, showing stress, has been noted to see a tremendous decrease of almost 64.03% for an increase in the contact angle from to .
Table 4.
Current density measurement at outer surface.
Hence, simulation results support the argument that a water droplet with a low contact angle intensifies distortion and stress. This is due to the fact that the water droplet spreads over the surface in low-contact-angle cases, boosting the surface conductivity. However, elevating the contact angle effectively lowers this stress. Therefore, a proper hydrophobic coating can significantly mitigate the distortion and adversity of wettability.
3.3. Polyurethane as a Remedial Coating
Figure 17 shows uncoated and polyurethane-coated disc insulators, which were tested to obtain AC flashover voltage under dry and wet conditions as per the experimental setup shown in Figure 4.
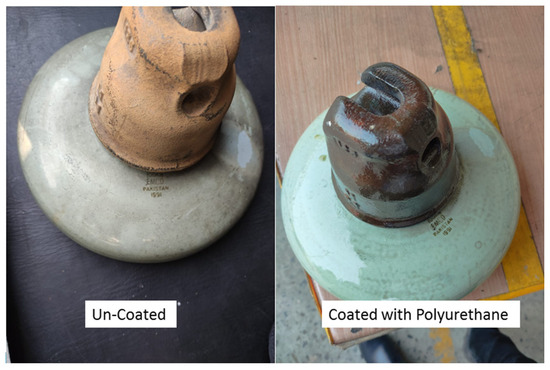
Figure 17.
Uncoated and coated insulator.
The experiment was conducted five times to obtain the mean flashover voltage value, and standard deviation (σ) has also been calculated using the following formulas:
where Vf represents the flashover voltage, Vk represents the flashover voltage for the kth time, and N represents the number of valid tests. The results are listed in Table 5.
Table 5.
Flashover characteristics of the coated and the uncoated insulator.
It is evident from Table 5 that the polyurethane coating has elevated the flashover voltage, making the insulator less vulnerable to premature flashover. However, extensive experimentation under various conditions of pollution and contamination is necessary before it can be used at the industrial level.
4. Conclusions
The disc insulator model has been evaluated for electric field and current density distribution under dry and wet conditions using the finite element method in COMSOL Multiphysics®. Three cases of wettability involving three surfaces—namely, hydrophilic, hydrophobic, and strongly hydrophobic surfaces—have been simulated by placing discrete water droplets at various contact angles. Abrupt increases have been witnessed on the plots for the electric field, showing distortion; however, this distortion was reduced from 2.588 kV/cm for the hydrophilic surface to 2.412 kV/cm for the strongly hydrophobic surface. Current density plots also showed spikes on the curve; however, they followed the same declining pattern, and overall stress was noticed, with an almost-64.03% reduction from 0.187 to 0.068 nA/cm2 following an increase in the contact angle from to . This is mainly due to the fact that water droplets spread more on hydrophilic surfaces, while in case of hydrophobic surfaces, water droplets tend to be spherical in shape, thus lowering the effect of wettability. The polyurethane coating evidently improved the insulator’s flashover voltage under both dry and wet conditions. The voltage improved from 79.14 kV to 82.04 kV for dry conditions, while that of wet conditions increased from 48.4 kV to 53.8 kV, surpassing the performance of the uncoated insulator. From the simulation and experimental results, it can be concluded that strongly hydrophobic surfaces make the insulator less vulnerable to flashover. This research work has not only introduced polyurethane as a potential coating but also opened new avenues for researchers working on improving the hydrophobicity of insulator surfaces. However, extensive experimental work under contaminated conditions is essential to fully characterize polyurethane-coated insulators’ flashover behavior.
Author Contributions
Conceptualization, T.A.R. and M.K.; methodology, T.A.R. and S.A.M.S.; software, T.A.R. and S.A.M.S.; formal analysis, T.A.R. and M.M.B.; writing—original draft preparation, T.A.R. and S.A.M.S.; writing—review and editing, M.K. and M.M.B.; supervision, M.K. All authors have read and agreed to the published version of the manuscript.
Funding
This research was funded by office of research, innovation, and commercialization (ORIC), University of Engineering and Technology, Lahore, Pakistan (Funding number: ORIC/112ASRB/2075, date: 3 November 2021), and was carried in laboratory of High Voltage at the Department of Electrical Engineering, University of Engineering and Technology, Lahore, Pakistan.
Institutional Review Board Statement
Not applicable.
Informed Consent Statement
Not applicable.
Data Availability Statement
The original contributions presented in this study are included in the article. Further inquiries can be directed to the corresponding author.
Conflicts of Interest
The authors declare no conflicts of interest. The funders had no role in the design of the study; in the collection, analyses, or interpretation of data; in the writing of the manuscript; or in the decision to publish the results.
References
- Lan, L.; Zhang, G.; Wang, Y.; Wen, X.; Wang, W.; Pei, H. The Influence of Natural Contamination on Pollution Flashover Voltage Waveform of Porcelain Insulators in Heavily Polluted Area. IEEE Access 2019, 7, 121395–121406. [Google Scholar] [CrossRef]
- Salem, A.A.; Lau, K.Y.; Rahiman, W.; Abdul-Malek, Z.; Al-Gailani, S.A.; Mohammed, N.; Rahman, R.A.; Al-Ameri, S.M. Pollution Flashover Voltage of Transmission Line Insulators: Systematic Review of Experimental Works. IEEE Access 2022, 10, 10416–10444. [Google Scholar] [CrossRef]
- Topalis, F.V.; Gonos, I.F.; Stathopulos, I.A. Dielectric Behavior of Polluted Porcelain Insulators. IEE Proc. Gener. Transm. Distrib. 2001, 148, 269. [Google Scholar] [CrossRef]
- Jiang, X.; Yuan, J.; Zhang, Z.; Hu, J.; Sun, C. Study on AC Artificial-Contaminated Flashover Performance of Various Types of Insulators. IEEE Trans. Power Deliv. 2007, 22, 2567–2574. [Google Scholar] [CrossRef]
- Yang, Z.; Jiang, X.; Han, X.; Zhang, Z.; Hu, J. Influence of Pollution Chemical Components on AC Flashover Performance of Various Types of Insulators. High Voltage 2019, 4, 105–112. [Google Scholar] [CrossRef]
- Khatoon, S.; Khan, A.A.; Sharma, A. Study the effect of contaminants on flashover performance of porcelain disc insulator by artificial pollution testing. In Proceedings of the 2016 International Conference on Recent Advances and Innovations in Engineering (ICRAIE), Jaipur, India, 23–25 December 2016; IEEE: Piscataway, NJ, USA, 2016. [Google Scholar] [CrossRef]
- Gencoglu, M.T.; Cebeci, M. The Pollution Flashover on High Voltage Insulators. Electr. Power Syst. Res. 2020, 181, 106180. [Google Scholar]
- Salem, A.A.; Rahman, R.A.; Al-Ameri, S. Pollution Flashover Characteristics of High-Voltage Outdoor Insulators: Analytical Study. Arabian J. Sci. Eng. 2021, 47, 2711–2729. [Google Scholar] [CrossRef]
- Cui, L.; Ramesh, M. Prediction of flashover voltage using electric field measurement on clean and polluted insulators. Int. J. Electr. Power Energy Syst. 2020, 116, 105574. [Google Scholar] [CrossRef]
- Shirtcliffe, N.J.; McHale, G.; Atherton, S.; Newton, M.I. An introduction to superhydrophobicity. Adv. Colloid Interface Sci. 2010, 161, 124–138. [Google Scholar] [CrossRef]
- Bhushan, B.; Jung, Y.C. Wetting, adhesion and friction of superhydrophobic and hydrophilic leaves and fabricated micro/nanopatterned surfaces. J. Phys. Condens. Matter 2008, 20, 225010. [Google Scholar] [CrossRef]
- Koch, K.; Bhushan, B.; Barthlott, W. Diversity of Structure, Morphology and Wetting of Plant Surfaces. Soft Matter 2008, 4, 1943–1963. [Google Scholar] [CrossRef]
- Drelich, J.; Marmur, A. Physics and Applications of Superhydrophobic and Superhydrophilic Surfaces and Coatings. Surf. Innov. 2014, 2, 211–227. [Google Scholar] [CrossRef]
- Farzane, M.; Chisholm, W.A. Protective Coatings for Overhead Lines in Winter Conditions. In Techniques for Protecting Overhead Lines in Winter Conditions; Springer: Berlin/Heidelberg, Germany, 2022; pp. 195–309. [Google Scholar] [CrossRef]
- Nguyen, T.V.; Nguyen, T.A.; Nguyen, T.H. The Synergistic Effects of SiO2 Nanoparticles and Organic Photostabilizers for Enhanced Weathering Resistance of Acrylic Polyurethane Coating. J. Compos. Sci. 2020, 4, 23. [Google Scholar] [CrossRef]
- Aman, A.; Abdullah, A.R.; Yaacob, M.M. Dielectric Property of Waste Tire Dust Polypropylene (WTD-PP) Composite for High Voltage Outdoor Insulation Application. In Proceedings of the IEEE International Power Engineering and Optimization Conference (PEOCO 2012), Melaka, Malaysia, 6–7 June 2012. [Google Scholar]
- Sawane, Y.B.; Ogale, S.B.; Banpurkar, A.G. Low Voltage Electrowetting on Ferroelectric PVDF-HFP Insulator with Highly Tunable Contact Angle Range. ACS Appl. Mater. Interfaces 2016, 8, 24049–24056. [Google Scholar] [CrossRef]
- Xia, Y.; Chen, J.; Zhu, Z.; Zhang, Q.; Yang, H.; Wang, Q. Significantly Enhanced Dielectric and Hydrophobic Properties of SiO2@MgO/PMMA Composite Films. RSC Adv. 2018, 8, 4032. [Google Scholar] [CrossRef]
- Ahmadi-Joneidi, I.; Majzoobi, A.; Shayegani-akmal, A.A.; Mohseni, H.; Jadidian, J. Aging Evaluation of Silicone Rubber Insulators Using Leakage Current and Flashover Voltage Analysis. IEEE Trans. Dielectr. Electr. Insul. 2013, 20, 212–220. [Google Scholar] [CrossRef]
- Cardoso, R.; Balestro, A.C.; Dellallibera, A.; Costa, E.C.M.; Angelini, J.M.G.; Mei, L.H.I. Silicone Insulators of Power Transmission Lines with a Variable Inorganic Load Concentration: Electrical and Physiochemical Analyses. Measurement 2014, 50, 63–73. [Google Scholar] [CrossRef]
- Othman, N.A.; Piah, M.A.M.; Adzis, Z. Contamination Effects on Charge Distribution Measurement of High Voltage Glass Insulator String. Measurement 2017, 105, 34–40. [Google Scholar] [CrossRef]
- Verma, A.R.; Subba Reddy, B. Interpretation of Surface Degradation on Polymeric Insulators. Eng. Failure Anal. 2019, 95, 214–225. [Google Scholar] [CrossRef]
- Mahmoodi, J.; Mirzaie, M.; Shayegani-Akmal, A.A. Surface Charge Distribution Analysis of Polymeric Insulator Under AC and DC Voltage Based on Numerical and Experimental Tests. Int. J. Electr. Power Energy Syst. 2019, 105, 283–296. [Google Scholar] [CrossRef]
- Al-Karawi, S.; Al-Taie, A. Insulators Used in Outdoor Power Applications: Materials and Coatings. In Proceedings of the 2023 6th International Conference on Engineering Technology and its Applications (IICETA), Al-Najaf, Iraq, 15–16 July 2023; IEEE: Piscataway, NJ, USA, 2023. [Google Scholar] [CrossRef]
- Küchler, A. High Voltage Engineering: Fundamentals—Technology—Applications; Springer: Berlin/Heidelberg, Germany, 2017. [Google Scholar]
- Zhang, Z.; Du, J.; Li, J.; Huang, X.; Kang, T.; Zhang, C.; Wang, S.; Ajao, O.O.; Wang, W.-J.; Liu, P. Polymer Nanocomposites with Aligned Two-Dimensional Materials. Prog. Polym. Sci. 2021, 114, 101360. [Google Scholar] [CrossRef]
- Lan, L.; Gorur, R. Computation of AC Wet Flashover Voltage of Ceramic and Composite Insulators. IEEE Trans. Dielectr. Electr. Insul. 2008, 15, 1346–1352. [Google Scholar] [CrossRef]
- Bala, P.; Bose, R.; Chatterjee, S. Electric Stress Analysis of a 11kV RTV Silicone Rubber Coated Porcelain Insulator. In Proceedings of the 2016 Biennial International Conference on Power and Energy Systems: Towards Sustainable Energy (PESTSE), Bangalore, India, 21–23 January 2016; IEEE: Piscataway, NJ, USA, 2016. [Google Scholar] [CrossRef]
- Allahdini, A.; Momen, G.; Munger, F.; Brettschneider, S.; Fofana, I.; Jafari, R. Performance of a Nanotextured Superhydrophobic Coating Developed for High-Voltage Outdoor Porcelain Insulators. Colloids Surf. A Physicochem. Eng. Asp. 2022, 649, 129461. [Google Scholar] [CrossRef]
- Gu, X.; Gao, T.; Meng, X.; Zhu, Y.; Wang, G. Enhanced Hydrophobicity of Polyurethane with the Self-Assembly of Perfluoropolyether-Based Triblock Copolymers. Prog. Org. Coat. 2022, 163, 106561. [Google Scholar] [CrossRef]
- De Souza, F.M.; Kahol, P.K.; Gupta, R.K. Introduction to Polyurethane Chemistry. In Polyurethane Chemistry: Renewable Polyols and Isocyanates; American Chemical Society: Washington, DC, USA, 2021; pp. 1–24. [Google Scholar]
- Kausar, A. Polyurethane Nanocomposite Coatings: State of the Art and Perspectives. Polym. Int. 2018, 67, 1470–1477. [Google Scholar] [CrossRef]
- John, K.; Naidu, S.V. Sisal Fiber/Glass Fiber Hybrid Composites: The Impact and Compressive Properties. J. Reinf. Plast. Compos. 2004, 23, 1253–1258. [Google Scholar] [CrossRef]
- Yu, X.; Wang, Q.; Fu, L.; Shen, G.; Zhang, W.; Yang, R.; Sun, K.; Lv, F.; Fan, S. Superhydrophobic Meta-Aramid Papers Prepared by the Surface-Embedded Spray Coating Strategy. Appl. Surf. Sci. 2023, 648, 159044. [Google Scholar] [CrossRef]
- Liu, B.; Lv, F.; Fan, X.; Li, Y.; Jiang, B. Molecular Dynamics Study of the Influence of Nano SiO2 on the Thermodynamic Properties of PMIA Composites. Polymers 2022, 14, 3134. [Google Scholar] [CrossRef]
- Liu, B.; Lv, F.; Fan, X.; Xiao, H.; Bi, H. Insulation Performance and Simulation Analysis of SiO2-Aramid Paper under High-Voltage Bushing. Nanomaterials 2022, 12, 748. [Google Scholar] [CrossRef]
- Biesuz, M.; Tomasi, M.; Santhosh, B.; Sglavo, V.M.; Sorarù, G.D. Polymer-Derived Si3N4 Nanofelts as a Novel Oil Spills Clean-Up Architecture. J. Environ. Chem. Eng. 2020, 8, 104134. [Google Scholar] [CrossRef]
- Huang, X.; Jiang, P.; Tanaka, T. A Review of Dielectric Polymer Composites with High Thermal Conductivity. IEEE Electr. Insul. Mag. 2011, 27, 8–16. [Google Scholar] [CrossRef]
- Matsunaga, C.; Zhou, Y.; Kusano, D.; Hyuga, H.; Hirao, K. Dielectric Breakdown of Silicon Nitride Substrates with Various Thicknesses. J. Ceram. Soc. Jpn. 2018, 126, 693–698. [Google Scholar] [CrossRef]
- Feoktistov, D.V.; Kuznetsov, G.V.; Sivkov, A.A.; Ivashutenko, A.S.; Nikitin, D.S.; Shanenkov, I.I.; Abdelmagid, A.M.; Orlova, E.G. Expanding the Scope of SiC Ceramics through Its Surface Modification by Different Methods. Surf. Coat. Technol. 2022, 435, 128263. [Google Scholar] [CrossRef]
- Han, Y.; Wang, Z.; Sun, J.; Li, Z. Enhanced Switching Electric Field and Breakdown Strength of Epoxy Composites with Core-Shell Silicon Carbide Nanoparticles. High Voltage 2023, 8, 583–589. [Google Scholar] [CrossRef]
- Jayasinghe, S.N.; Edirisinghe, M.J. Effect of Viscosity on the Size of Relics Produced by Electrostatic Atomization. J. Aerosol Sci. 2002, 33, 1379–1388. [Google Scholar] [CrossRef]
- Qasim, S.A.; Gupta, N. Comparison of the Dielectric Properties of Functionally Graded Material Dielectrics and Layered Dielectrics Used for Electric Stress Control. IET Sci. Meas. Technol. 2020, 14, 471–477. [Google Scholar] [CrossRef]
- Rachmawati, N.; Kojima, H.; Hayakawa, N.; Kato, K.; Zebouchi, N. Electric Field Simulation of Permittivity and Conductivity Graded Materials (ε/σ-FGM) for HVDC GIS Spacers. IEEE Trans. Dielectr. Electr. Insul. 2021, 28, 736–744. [Google Scholar] [CrossRef]
- Zaputra, S.; Fabio, M.R.; Hidayat, S. Application of Non-Linear Discrete Spatial Permittivity Distributions in Reducing Electric Field Concentration in GIS Spacer. In Proceedings of the 2023 4th International Conference on High Voltage Engineering and Power Systems (ICHVEPS), Denpasar Bali, Indonesia, 6–10 August 2023; pp. 717–721. [Google Scholar] [CrossRef]
- Peng, S.; Iroh, J.O. Dependence of the Dynamic Mechanical Properties and Structure of Polyurethane-Clay Nanocomposites on the Weight Fraction of Clay. J. Compos. Sci. 2022, 6, 173. [Google Scholar] [CrossRef]
- Zafar, F.; Sharmin, E. Polyurethane/Monograph; Intech: Rijeka, Croatia, 2012. [Google Scholar]
- Moody, V.; Needles, H.L. Polyurethane Coating. In Tufted Carpet; Elsevier: Amsterdam, The Netherlands, 2004; pp. 105–108. [Google Scholar] [CrossRef]
- Sonnenschein, M.F. Introduction to Polyurethane Chemistry. In Polyurethanes; John Wiley & Sons, Inc.: Hoboken, NJ, USA, 2014; pp. 105–126. [Google Scholar] [CrossRef]
- Barksby, N.; Dormish, J.F.; Haider, K.W. Polyurethane Synthesis. In Encyclopedia of Polymeric Nanomaterials; Kobayashi, S., Müllen, K., Eds.; Springer: Berlin/Heidelberg, Germany, 2014. [Google Scholar] [CrossRef]
- Dong, B.; Jiang, X.; Hu, J.; Shu, L.; Sun, C. Effects of Artificial Polluting Methods on AC Flashover Voltage of Composite Insulators. IEEE Trans. Dielectr. Electr. Insul. 2012, 19, 714–722. [Google Scholar] [CrossRef]
- Balakrishnan, A.; Saha, M.C. Influence of Air-Draft on Fabrication of Polyurethane Thin Films via Ultrasonic Atomization. At. Sprays 2012, 22, 23–35. [Google Scholar] [CrossRef]
- High Voltage Insulator Coatings: State of the Art & Future Development. INMR. Available online: https://www.inmr.com/high-voltage-insulator-coatings-state-of-the-art-future-development/ (accessed on 13 January 2025).
- Courant, R. Variational Methods for the Solution of Problems of Equilibrium and Vibrations. Bull. Am. Math. Soc. 1943, 49, 1–24. [Google Scholar] [CrossRef]
- Silvester, P. Finite Element Solution of Homogeneous Waveguide Problems. Alta Freq. 1969, 38, 313–317. [Google Scholar]
- Inoue, K.; Hayata, K.; Koshiba, M. Finite-Element Solution of Three-Dimensional Periodic Waveguide Problems. Electron. Commun. Jpn. Part II Electron. 1989, 72, 68–77. [Google Scholar] [CrossRef]
- Axelsson, O.; Barker, V.A. The Finite Element Method. In Finite Element Solution of Boundary Value Problems; SIAM: Philadelphia, PA, USA, 2001; pp. 163–267. [Google Scholar] [CrossRef]
- Gokhale, N.S. Practical Finite Element Analysis; Finite To Infinite: Maharashtra, India, 2020. [Google Scholar]
- Jin, J.-M. Finite Element Method in Electromagnetics; Wiley Sons, Inc., John: Hoboken, NJ, USA, 2014. [Google Scholar]
- Sastry, S.S. Introductory Methods of Numerical Analysis; Prentice Hall India Pvt., Ltd.: New Delhi, India, 2012. [Google Scholar]
- Rao, S.S. Finite Element Method in Engineering; Elsevier Science and Technology Books: Cambridge, MA, USA, 2017. [Google Scholar]
- Zienkiewicz, O.C.; Taylor, R.L. The Finite Element Method: Its Basis and Fundamentals, 7th ed.; Elsevier: Amsterdam, The Netherlands, 2013. [Google Scholar] [CrossRef]
- Arora, R.; Mosch, W. High Voltage and Electrical Insulation Engineering, 2nd ed.; IEEE Press: Piscataway, NJ, USA; Wiley: Hoboken, NJ, USA, 2022. [Google Scholar]
- Polycarpou, A.C. Introduction to the Finite Element Method in Electromagnetics; Springer Nature: Berlin/Heidelberg, Germany, 2022. [Google Scholar]
- IEC 60060-1:2025; High-Voltage Test Techniques—Part 1: General Terminology and Test Requirements, 4th ed. International Electrotechnical Commission: Geneva, Switzerland, 2025.
- Pei, S.; Liu, Y.; Ji, X.; Geng, J.; Zhou, G.; Wang, S. UV-Flashover Evaluation of Porcelain Insulators Based on Deep Learning. IET Sci. Meas. Technol. 2018, 12, 770–776. [Google Scholar] [CrossRef]
- Klüss, J.; Bichik, A.; Arshad, A.; Strandberg, J.; Kazmi, S.; Laiho, M.; Stark, T.; Panchal, J.; Ahmad, B.; Väkeväinen, K. Simulation Precision and the Human Factor. In Proceedings of the 24th Nordic Insulation Symposium on Materials, Components and Diagnostics, Copenhagen, Denmark, 15–17 June 2015. [Google Scholar] [CrossRef]
- Meyer, K.; Erdogmus, E.; Morcous, G.; Naughtin, M. Use of Ground Penetrating Radar for Accurate Concrete Thickness Measurements. In Proceedings of the AEI 2008 Conference—AEI 2008: Building Integration Solutions, Denver, CO, USA, 24–27 September 2008; Volume 328, pp. 1–10. [Google Scholar] [CrossRef]
- Archer, G.G.; Wang, P. The Dielectric Constant of Water and Debye-Hückel Limiting Law Slopes. J. Phys. Chem. Ref. Data 1990, 19, 371–411. [Google Scholar] [CrossRef]
- Ellison, W.J. Permittivity of Pure Water, at Standard Atmospheric Pressure, over the Frequency Range 0–25THz and the Temperature Range 0–100 °C. J. Phys. Chem. Ref. Data 2007, 36, 1–18. [Google Scholar] [CrossRef]
- Jones, R.G. Measurements of the Electrical Conductivity of Water. IEE Proc. Sci. Meas. Technol. 2002, 149, 320–322. [Google Scholar] [CrossRef]
- Lekouch, I.; Mileta, M.; Muselli, M.; Milimouk-Melnytchouk, I.; Šojat, V.; Kabbachi, B.; Beysens, D. Comparative Chemical Analysis of Dew and Rain Water. Atmos. Res. 2010, 95, 224–234. [Google Scholar] [CrossRef]
- Huhtamäki, T.; Tian, X.; Korhonen, J.; Ras, R.H.A. Surface-Wetting Characterization Using Contact-Angle Measurements. Nat. Protoc. 2018, 13, 1521–1538. [Google Scholar] [CrossRef]
- Danish, M. Contact Angle Studies of Hydrophobic and Hydrophilic Surfaces. In Handbook of Magnetic Hybrid Nanoalloys and their Nanocomposites; Springer: Berlin/Heidelberg, Germany, 2022; pp. 761–782. [Google Scholar] [CrossRef]
- Chaudhuri, S.P.; Sarkar, P.; Chakraborty, A.K. Electrical Resistivity of Porcelain in Relation to Constitution. Ceram. Int. 1999, 25, 91–99. [Google Scholar] [CrossRef]
- Kamsali, N.; Prasad, B.S.N.; Datta, J.; Nejadkoorki, F. The Electrical Conductivity as an Index of Air Pollution in the Atmosphere. In Advanced Air Pollution; Springer: Berlin/Heidelberg, Germany, 2011; pp. 365–390. [Google Scholar]
- Su, J.; Yang, C.; Wu, W.; Huang, R. Effect of Moisture Content on Concrete Resistivity Measurement. J. Chin. Inst. Eng. 2002, 25, 117–122. [Google Scholar] [CrossRef]
- National Nondestructive Testing Education Center. Copper Properties. In NDT Techniques: Eddy Current. Available online: https://www.nde-ed.org/NDETechniques/EddyCurrent/ET_Tables/ET_matlprop_Copper.xhtml (accessed on 13 January 2025).


Disclaimer/Publisher’s Note: The statements, opinions and data contained in all publications are solely those of the individual author(s) and contributor(s) and not of MDPI and/or the editor(s). MDPI and/or the editor(s) disclaim responsibility for any injury to people or property resulting from any ideas, methods, instructions or products referred to in the content. |
© 2025 by the authors. Licensee MDPI, Basel, Switzerland. This article is an open access article distributed under the terms and conditions of the Creative Commons Attribution (CC BY) license (https://creativecommons.org/licenses/by/4.0/).