Abstract
This paper reports the knowledge process and the analyses performed to assess the seismic behavior of a heritage masonry building. The case study is a three-story masonry building that was the house of the Renaissance architect and painter Giorgio Vasari (the Vasari’s House museum). An interdisciplinary approach was adopted, following the Italian “Guidelines for the assessment and mitigation of the seismic risk of the cultural heritage”. This document proposes a methodology of investigation and analysis based on three evaluation levels (EL1, analysis at territorial level; EL2, local analysis and EL3, global analysis), according to an increasing level of knowledge on the building. A comprehensive knowledge process, composed by a 3D survey by Terrestrial Laser Scanning (TLS) and experimental in situ tests, allowed us to identify the basic structural geometry and to assess the value of mechanical parameters subsequently needed to perform a reliable structural assessment. The museum represents a typology of masonry building extremely diffused in the Italian territory, and the assessment of its seismic behavior was performed by investigating its global behavior through the EL1 and the EL3 analyses.
1. Introduction
The dynamic response of ancient masonry buildings under seismic loads differs substantially from that of recent masonry constructions who are designed according to specific aseismic rules and recommendations. Observation of the damages exhibited by historic constructions after main earthquakes [1,2] shows that their structural response is mainly ruled by local failures, typically consisting of out-of-plane overturning of portions of the walls. This behavior is the consequence of the absence of a box-like behavior of the buildings and only if the out-of-plane collapses are prevented a satisfactory seismic performance (i.e., the development of a global failure mode) can be achieved. When the out-of-plane collapses are prevented, the in-plane stiffness, strength and deformation capacity of the masonry piers are fully exploited, and they rule the dynamic response of the structure. In this respect, it is widely recognized that adequate masonry quality, proper connections between orthogonal masonry walls and between walls and floors are effective features able to prevent the local failures [3,4,5]. A significant role in coupling the response of the different walls is also played by the in-plane stiffness of the diaphragms [6,7].
These few remarks point out the attention that the analyst must pay in analyzing the seismic behavior of an ancient masonry building. The so-called “knowledge process” and the use of reliable numerical models to evaluate the seismic risk are the two essential steps of the analysis. Although in many cases simplified partial models can be used, a global model can better capture the seismic response of the structure provided that a proper modelling of walls and floors is performed. Recently, methods based on an interdisciplinary approach in which local and global analyses are performed have been proposed. This is the case of the Italian technical document “Guidelines for the assessment and mitigation of the seismic risk of the cultural heritage” [8] that proposes a methodology based on three different levels of evaluation, according to an increasing knowledge of the structure. The first level (EL1, analysis at territorial scale) allows one to evaluate the collapse acceleration of the structure by means of simplified models based on a limited number of geometric and mechanical parameters as well as qualitative tools. The second level (EL2, local analysis) is based on a kinematical approach performed to analyze the local collapse mechanisms of single portions of the structure (the so-called macro-elements). The identification of proper macro-elements is based on the knowledge of the building structural details (construction techniques, connections between architectonic and structural elements, cracking patterns, etc.). The third level (EL3, global analysis) consists in a global analysis of the whole building under seismic loading by reliable numerical models. Compared to the previous two levels, the EL3 is the most accurate but it requires a large amount of input data and a great computational effort depending on the employed approach [9,10,11].
The fundamental prerequisite both for a reliable seismic safety assessment and for a correct maintenance and measures planning is the knowledge of the building. If compared with modern constructions, the definition of a numerical model of heritage and ancient buildings need more information including a detailed and in-depth investigation process. For these reasons, the model reliability is strictly connected with the knowledge level and the available data. The Italian Guidelines [8], in this respect, define the knowledge process as composed by the following main activities: (i) building identification and functional characterization of its spaces, (ii) geometric survey, (iii) historical analysis (past events, interventions and geometric changes over time), (iv) construction technique survey and state of conservation, (v) material identification and characterization, (vi) geotechnical identification of the soil.
In recent years, taking into account the powerful technologies like the Terrestrial Laser Scanning (TLS), the Aerial Laser Scanning (ALS) and the digital multi-view photogrammetry that allow collecting a large amount of detailed data in a short time, the relevance of the geometric survey has been increased. Nevertheless, the data obtained with such technologies (usually structured in a dense cloud of 3D points) are still not directly suitable for the creation of a numerical model, and several operations are necessary to this aim. Several studies are now available in literature, and various semiautomatic methods have been proposed to face different cases and situations. Some researchers focus on the parametric extraction of the building geometry from the point cloud and then on the creation of the finite element (FE) mesh starting from a solid geometry. For instance, Barazzetti et al. [12] generated a FE model starting from a Building Information Modelling (BIM). A procedure based on curve networks and parametrization of NURBS surfaces was used to semiautomatically obtain a BIM that preserves the complexity offered by the laser cloud. Xu and Neumann [13] proposed a generic methodology based on parametric models, approximating 3D feature data with T-spline, B-spline and NURBS. Other scholars focus on the creation of the FE mesh directly from the point cloud. Castellazzi et al. [14] introduced a technique called CLOUD2FEM to generate a FE model directly from a laser scanner survey. The method is based on slides extraction that contributes to the creation of the voxel model, but the procedure needs user intervention. Hinks et al. [15] introduced a point-based voxelization method to automatically transform the point cloud data into a solid model for computation modelling and FE analysis. The method is fast and offers a high degree of automation, but it still requires better shape detection and the ability to distinguish the real openings from the occlusions. Bassier et al. [16] proposed a method to create an accurate and realistic FE mesh of a heritage masonry wall with the integration of crack information. Finally, some researchers focus on the automated extraction of building structural elements, like beams, trusses and arches. For instance, Armesto et al. [17] exploited photogrammetry to extract trusses for the evaluation of historic timber roof structures. The literature review shows that much of the efforts of the researchers are related to the automatic or semiautomatic creation of 3D geometric models to be employed for the creation of a 3D FE model [18,19,20,21,22]. Still, several issues emerge in the representation of heritage structures that always require several manual preprocessing operations.
Within this framework, this paper presents the results of a study performed on an historic masonry building representative of a very common typology in Italy. The investigated structure is the Vasari’s House museum in Arezzo (Italy) that was analyzed within a research project promoted and financed by the Italian MIBACT (Italian Ministry for the Heritage, Cultural Activities and Tourism). The paper illustrates the methodology employed to develop the knowledge process and to evaluate the seismic risk of the museum. At first, a historic investigation was performed with the purpose to analyze the evolution of the complex over the centuries comprehending a detailed geometric survey through the Terrestrial Laser Scanning (TLS) technology [23,24]. The TLS allowed a complete and detailed geometric characterization of the building, the correct spatial distribution of the structural elements with their deviation from planarity and verticality, and the assessment of the real thickness of walls and roofs which are not directly measurable with a traditional survey. Subsequently, the typologies of floors, roofs and masonry walls were investigated through visual inspections, nondestructive in situ tests, semidestructive tests on mortar (DRMS) and flat-jack tests. The seismic risk was eventually investigated according to the three levels of the Italian standards. This paper is focused on the results obtained by the two global approaches (EL1 and EL3), while the details of the local analysis (EL2) are reported in [25]. The adopted survey procedure is discussed with the aim of highlighting several peculiarities of the case study that are recurrent in similar historic structures and that play a significant role in the seismic response of the building.
2. Building Description and Historical Notes
The Vasari’s House museum is a masonry palace located in the northern part of the historic city center of Arezzo (central Italy). The museum was the family house of Giorgio Vasari, who was born in Arezzo on 30 July 1511. He is one of the most famous Italian architects, painters, and historians of the XVI century. Vasari for instance was involved, working for the Medici family in Florence, in the design of the Uffizi Gallery (the loggia and a long passageway that connects Palazzo Vecchio with Palazzo Pitti today called Vasari Corridor) and on the execution of the frescoes inside the Cupola of Santa Maria del Fiore (that were later completed by Federico Zuccari with the help of Giovanni Balducci). The Vasari’s House (Figure 1) was bought by the artist in 1540. He was involved in the building renovation and personally contributed to the decoration of the rooms which was completed in 1548. The main façade of the building, which is independent by the neighboring constructions, faces via XX Settembre and is organized in three levels: ground, first, second floor, and an attic. The rear façade, which faces the garden (Figure 1), being partially underground is characterized by only two levels: the first and the second floor, in addition to the attic.
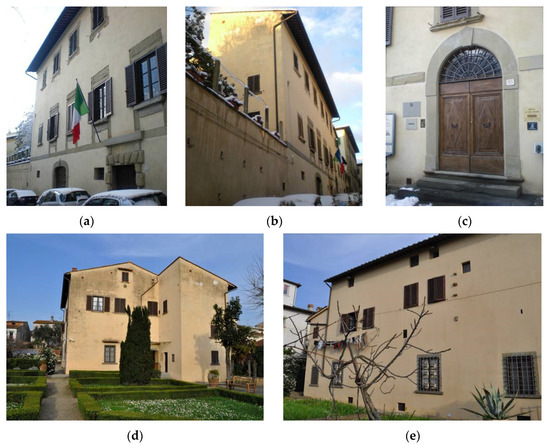
Figure 1.
Views of the façades, (a–c) South-East front façade, views from the street (via XX Settembre), (d) South-West rear façade, (e) North-West rear façade.
Since 1955, the Vasari’s House is a museum dedicated to Giorgio Vasari. The first floor locates the main part of the museum where a collection of Mannerist paintings is exposed. The rooms of this floor are decorated with the frescoes painted by Vasari. The ticket office together with other technical spaces is located at the ground floor. The second floor hosts the library, together with two private spaces (the residence of the building caretaker, as well as another apartment owned by the Superintendence of the Cultural Heritage). The last level is the attic: one half of it is used as deposit, while the other one, accessible only for maintenance purposes, is unused.
Inside the museum is kept the so-called Vasari Archive, a collection of sketches, paintings and private letters by Pope Pius V and Cosimo I de’ Medici. Figure 2 shows some internal views of the museum.
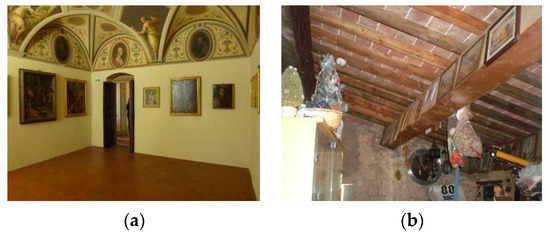
Figure 2.
Internal views, (a) First floor, (b) Timber roof.
The analysis of historic documents and past studies allowed one to obtain information about the evolution process [26]. The original structure, quite similar to the current one, had a rectangular plan layout with dimensions of 16 m × 15 m. Some external parts were added during the centuries, as is also clear even observing the main façade and the roof plan. Some of these changes appeared for the first time in a plan of the XIX century. In recent times, the museum has been interested by minor interventions: slight modification of some openings, substitution of some internal floors and refurbishment of a portion of the wooden roof. During the 1960s, at the ground floor some walls and vaults were thickened adding an additional masonry brick leaf.
3. Geometric Survey
To correctly evaluate the risks that a cultural heritage is exposed to, it is essential to assess the object geometry realistically. Conversely to new constructions, historical buildings require considering irregular geometries, complex shapes, lack of symmetries, differences in thickness, etc. A so-called “digital twin” of the real building can profitably conduct computation and simulation [27]. The digital model derived from the real object constitutes the virtual representation of the physical system. Geomatics studies cutting-edge technologies that can be elected to digitize first of all the geometric consistency of the object and integrate information of other nature. Range-based (laser scanning) and image-based (digital photogrammetry) techniques both produce high-resolution 3D models, initially made up of points (the so-called “point clouds 3D models”), which can then be processed to obtain different 3D and 2D outputs.
The Vasari’s House museum is an excellent example to demonstrate the potential of a 3D survey to document the metric consistency of a historical building, analyze its structural deformations, highlight the traces that remain from its transformations and support structural studies.
3.1. Previous Survey Assessment and Data Reuse
Before starting a new survey activity, it is necessary to check the available documentation to evaluate the possibility of integrating it, updating it or certifying the need for a new and complete survey. The curation of spatial and metric data is a hot topic in the world of cultural heritage [28], and a number of ongoing projects are developing guidelines and examples of how to aggregate such data. Digital archaeology is a closely related field in which scholars promote greater reuse of data curated in repositories, as recently discussed in [29].
Concerning the previous surveys of the Vasari’s House museum, those that were made available by the Superintendence are: (i) plans of the basement and first floor, a cross-section, North-East and North-West elevations; drawings are hand-drawn, and they were subsequently digitized in raster format (PDF); (ii) plans of the basement, first, second, and attic floors, a cross-section, North-West façade, digitized in vector format (DWG). Both drawing sets are not accompanied by the corresponding metadata, i.e., information on when, how and by whom they were made. The analysis of the documents highlights that in the first survey some particularly articulated spaces, such as those in the basement, are represented with strong geometric schematization, neglecting the very evident out-of-square of the walls. The projections of the coffered and vaulted roof structures of the rooms are reported and the drawings are not dimensioned, but a graphic scale is reported. The state of the building at the time of the restoration work in the 1970s is represented. In the second survey the plan of the basement floor gives a plausible account of the irregular conformations of the rooms, but the drawings are not dimensioned (although implicitly scaled thanks to their vector format) and in part correspond to the digitization of the previous survey.
To assess this kind of document several aspects need to be considered, including completeness, reliability, effectiveness and usability [30]. In the present case they constitute a good documentation of the state of the building. In particular, the latter survey appears to be up to date, documenting the latest interventions made on the building (except for some details related, for example, to the technical compartment for the recently installed lift). Their equivalent graphic scale corresponds nominally to what is necessary to carry out the structural analyses so that their effectiveness is almost good. However, both representations contain information related only to the reference section plane but lack the essential information about elevations of, e.g., floors and openings. In addition, the description of the important differences in height between the street and the garden is missing. In both cases only one section is available, making their completeness very much lacking.
Considering the noticeable differences in the representation of the more irregular compartments, it can be assumed that their metric reliability is also limited, thereby their usability for the project described here was not appropriate. Therefore, it was decided to carry out a new survey aimed at the construction of a 3D database to document the building with high resolution. This detailed 3D survey was performed by the GeCo Lab of the University of Florence (Geomatics for the Environment and Cultural Heritage Conservation Lab).
3.2. Topographic Control Network
The topographical survey is the least noticeable phase of the 3D survey, whose traces are not evident in the three-dimensional models and the final drawings. However, at the same time, it is the geometric structure that guarantees the reliability of the entire survey and is the way to correctly connect all the spaces, internal and external, of the building. It is in fact a matter of determining the position of a few points, whereas laser scanning and photogrammetry generate multi-million-point models. Yet, the control network plays a key role: in the Vasari’s House museum, it consists of eight vertices. They are in the street in front of the building, in the back garden and at the beginning and end of the stairs leading to the main floor and a closed traverse connects them. A large part of the rooms on the second floor and in the attic were reached from the traverse vertices with topographic measurements through the windows (Figure 3).
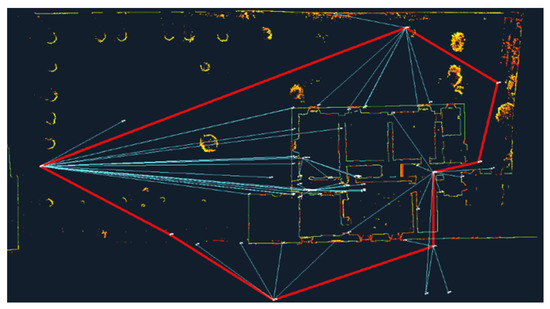
Figure 3.
Control network supporting the 3D laser scanning survey.
All the vertices were materialized stably, and witness diagrams were sketched. Their position was determined to ensure sub centimetric accuracy: measurements were collected by total station, repeating observations, and applying rigorous methods. This allowed for the establishment of a local reference system for the entire survey and allowed spatial relationships to be defined even between spaces that are not directly connected; this enabled the accurate evaluation of the thickness of walls, slabs, and vaults.
3.3. Laser Scanning Survey
A terrestrial laser scanner has acquired the high-resolution 3D model. Fifty scan positions were set up in most of the rooms and all around the building, acquiring data with a 360° field of view. Forty-seven targets were measured starting from the control network and supported the alignment of the scans, further optimized by a global registration based on Iterative Closest Point (ICP) algorithm. Furthermore, 762 million points made the final 3D model (Figure 4).
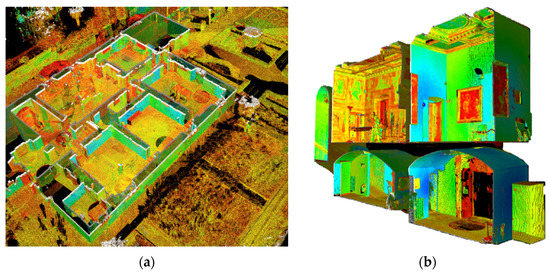
Figure 4.
Digital reconstructions of the museum, (a,b) tridimensional views.
Starting from thin slices of the point cloud model, the plans and the building cross-sections were vectorized, thus obtaining a reliable representation of rooms and the thickness of walls and slabs. To provide more exhaustive documentation of the inner spaces, orthoimages of the 3D model integrated the section profile in cross-section, describing in-view elements and characterizing technological elements (as in roof structure) and the excellent paintings in some rooms at the first floor. Similarly, the façade drawings were based on 3D model orthoimages, accurately documenting doors and windows, with their corniches and the relationship of the building with the sloping road in the front and the garden in the back (Figure 5 and Figure 6). Orthoimages render the orthogonal view of the 3D model, which (as a 3D photo) records everything in view from the scan position; unwanted points removal and data classification currently still require manual procedures.
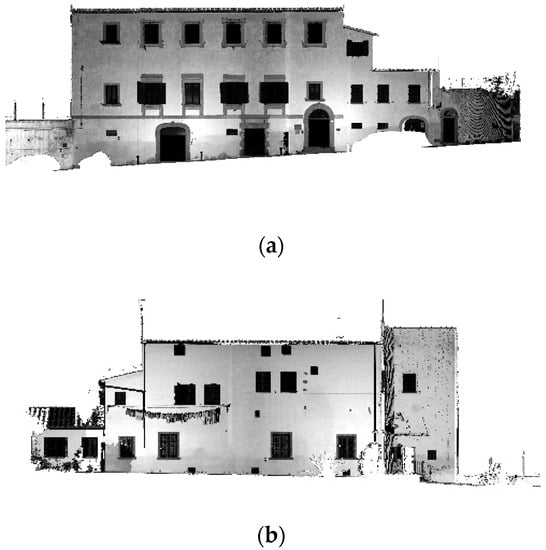
Figure 5.
Orthoimages of the main façades (front (a) and rear (b)).
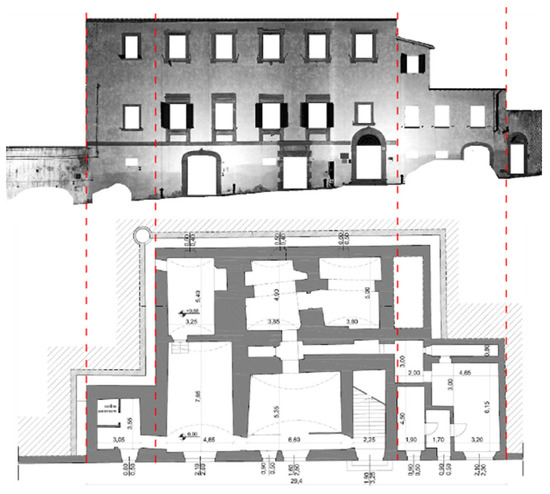
Figure 6.
Representation of the façade on via XX Settembre and of the ground floor.
The application of state-of-the-art techniques and devices and the choice of the best protocols and methods improves the understanding of Cultural Heritage; 3D metric models bring new knowledge and support collaboration between disciplines, with a time and costs efficiency perspective. It is important, however, to plan the fieldwork in advance. Particularly in morphologically articulated conditions as in the case of the Vasari’s House museum, lines of sights must be carefully verified, the position of targets must be as homogeneous as possible, but at the same time they must respect the surfaces and furnishings (on which, in this case, it was obviously not possible to stick anything). The rooms must be given a unique identification code, to allow immediate identification and better management of the subsequent data processing phases.
4. Material Survey
A comprehensive survey composed by visual inspections and in situ tests was performed to assess the masonry typologies, the mortar quality, the typology of floors and roof and the effectiveness of the connections between the walls. The type and the position of the tests are resumed in Figure 7, and they included: 10 visual inspections on masonry (S) in different zones selected based on the historic survey, two flat-jack tests (FJ), 3 mechanical investigation of the mortar by the Drilling Resistance Measurement System (DRMS) technique [31] and a Ground Penetrating Radar (GPR) test to investigate the structure of the second level floor. Chemical analysis and X-ray diffraction analysis on three samples of mortar were also performed, as well as a complete exploration of all external and internal walls to detect cracks and defects.
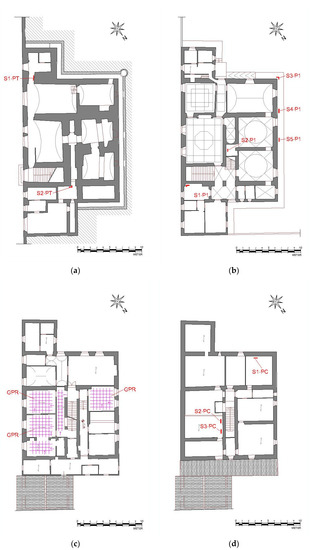
Figure 7.
Plan layouts of the building with the positions of the tests, (a) ground floor, (b) first floor, (c) second floor, (d) attic.
To check the masonry typologies, the organization of its texture and the effectiveness of the connections between the masonry walls, several portions of the plaster were removed in 10 zones of the building. As shown in Figure 8, Figure 9 and Figure 10, several types of texture were found with different dimensions and shapes of the stones and, in general, a different organization of the masonry.
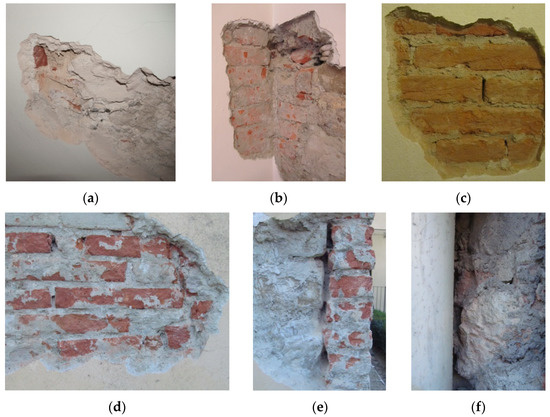
Figure 8.
Details of the different textures of the walls, (a) S1-PT, (b) S1-P1, (c) S2-P1, (d,e) S3-P1, (f) S4-P1.
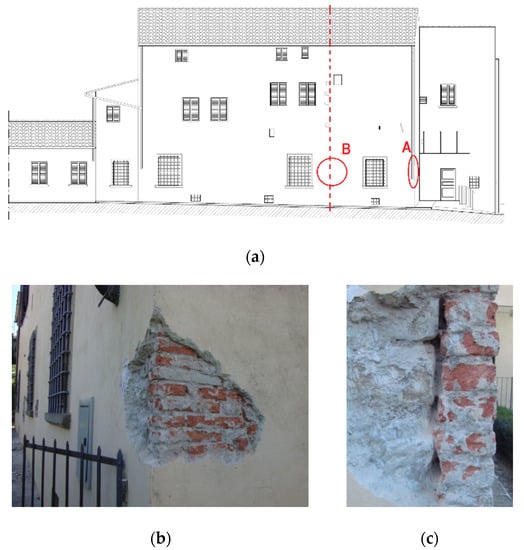
Figure 9.
Vertical discontinuity on the Nord-West façade detected during the survey, (a) North-West façade, (b,c) Zone “A”, detail.
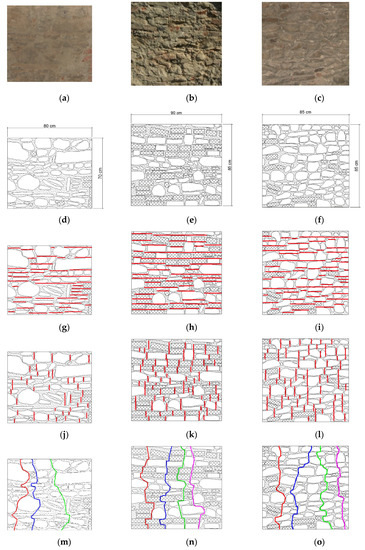
Figure 10.
Details of some textures of the walls and material detection, (a–c) View of the textures, (d–f) reconstruction of the textures, (g–i) Horizontality of the bed joints (HJ), (j–l) Stagger properties of the vertical joints (VJ), (m–o) Calculation of ML. (a,d,g,j,m) S2-PT, (b,e,h,k,n) S5-P1, (c,f,i,l,o) S3-PC.
The examination of the walls in the zones S1-PT and S2-PT, which belong to the original nucleus of the building, evidenced single leaf walls constituted by irregular stone blocks with different sizes, few inclusions of bricks, mortar of low quality and a thickness of the plaster in the range 2–5 cm. A similar typology was detected in the zone S1-P1. The internal wall in the zone S2-P1 is made by a three heads regular brick masonry (with average dimensions of the units of 29 cm × 14.5 cm) and lime mortar with thickness of 1.5 cm.
The inspection in the zone S3-P1 was performed in an external corner of the building to detect the connection between the two orthogonal walls. The presence of a leaf of brick masonry with one head added on the original stone masonry wall is evident (Figure 8). Again, in the zones S4-P1 and S5-P1 the walls are made by a prevalence of irregular stone masonry with several inclusions of bricks and lime mortar with high thickness (3.5–4 cm). In the zones S1-PC, S2-PC and S3-PC (in the attic) the walls are made in prevalence of stone masonry with chaotic texture with some strips of bricks (S2-PC). This investigation allowed us to conclude that the vertical structures are mainly constituted by disorganized stone masonry walls along the perimeter (with thicknesses of about 1 m at the ground floor) and brick masonry walls for some of the internal alignments.
During the experimental campaign, some specific aspects were found. Particularly significant is the presence of a vertical discontinuity in the perimeter wall on the North-West façade (the one facing the garden), which seems to run throughout the whole height (line “B” in Figure 9). In addition, under the plaster on the corner (area “A” in Figure 9a), a one-left layer of bricks was found to cover the masonry stone wall.
The evaluation of the masonry quality was performed by applying the Masonry Quality Index (MQI) and the Minimum Length (ML) [32,33] methods analyzing five masonry panels of the building (Table 1). The MQI values are rather low (in a scale from 0 to 10) signifying a poor-quality masonry (the ML values confirm this result). According to [32] the MQI index is correlated with some mechanical properties of the masonry, i.e., the compressive strength f, the shear strength τ0 and the longitudinal modulus of elasticity E. The ranges reported in Table 1 refer to the minimum and maximum estimation of each property.

Table 1.
Masonry quality indexes (MQI) for five panels of the Vasari’s House museum.
The panels S2-PT, S1-PC and S3-PC correspond to the first category (Cat. I) of the classification of the existing masonry reported in the Italian standards [34,35]. Although the ranges furnished in [35] are based on a national data base there is a good correspondence with those obtained by the MQI index. The panels S5-P1 and S2-PC belong to the same category; however, the horizontal layer of bricks improves the mechanical characteristics f and τ0 and the coefficient 1.3 is suggested in [35]. Again, the MQI indexes are in agreement with such increase. ML indexes are similar for the five panels and no significant differences in the quality can be predicted (Figure 10).
Two masonry cores (COR) with diameter of 64 mm 42 cm length were extracted in the zone S2-PT to detect the inner material structure. The two examples illustrated in Figure 11 show the irregularity of the masonry and the high percentage of mortar.
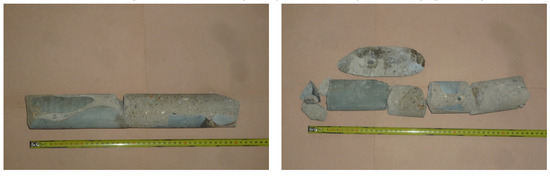
Figure 11.
Examples of masonry cores (S2-PT).
The quality of the mortar was investigated through DRMS tests (Figure 12) [31], performed in three different zones of the building, i.e., S2-PT, S5-P1 and S1-PC to obtain a spatial characterization of the mortar quality over the building. Each test consists in executing a set of perforations in the mortar by an instrumented drill which measures the force applied versus the depth of the hole, parameter correlated to the compressive strength of the mortar. The drill measures continuously the force of drilling, keeping constant the r.p.m. and the perforation velocity. The result of each perforation is a diagram which shows the drilling force versus the hole depth. The recorded samples are statistically treated, calculating the so-called data outliers and focusing on the values related to the inner part of the mortar joints. This assumption is necessary to exclude the data of the first and the last parts of the record, since they can be affected by errors, related to the local external conditions of the mortar and to the presence of the drilling dust in the last part of the hole. Laboratory DRMS and compressive tests (specimens with section 40 mm × 40 mm) were performed on a sample mortar (Sm) to calibrate the procedure. Some results are reported in Table 2. The mean and median statistics are referred to the part of the records from 5 to 35 mm of the perforation. Considering the high variability of the recorded data, it has not been possible to correlate the drilling forces with the in situ compressive strength of the mortar. Nevertheless, the results highlight that the mortar of the wall at the ground level has a low quality, while the mortar at the upper levels has better properties, comparable or even higher than that of the sample mortar, characterized by a compressive strength fm of 2.5 N/mm2.
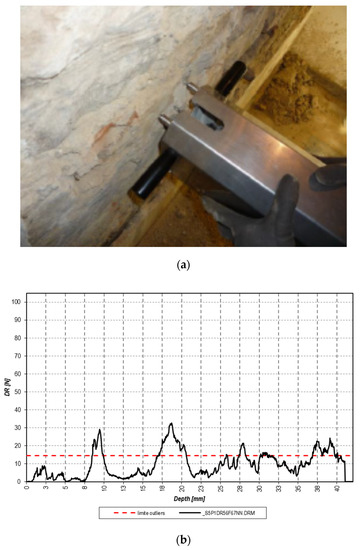
Figure 12.
DRMS test on the mortar. (a) drilling device, (b) result of the DRMS test.
Table 2.
Results of semidestructive tests on mortar (DRMS) tests performed on the mortar.
Chemical tests were also performed on some mortar samples. In particular, investigations by the optical microscope with polarized light were performed as well as X-ray diffraction analysis. Three different mortar samples were tested. The results showed that the quantity of the binder is low, with a volumetric ratio binder/aggregates approximately equal to 1/3–1/4. The binder is composed of hydraulic lime, with a quite well distributed aggregate fraction. The optical microscope has highlighted the presence of pores, due to the lack of binder. The X-ray diffraction analysis confirmed a relevant presence of quartz in the aggregate fraction (Figure 13).
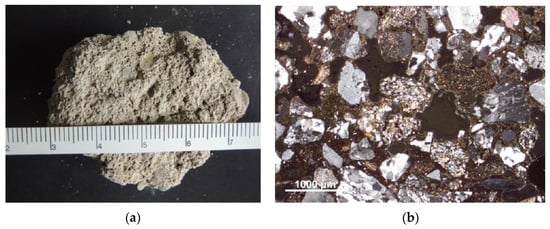
Figure 13.
A sample of mortar (a) and an optical microscope view (b).
Two flat-jack tests (FJ) [36,37] were also performed in the zones S2-PT and S5-P1. In each zone both the single (S) and the double flat-jack (D) versions of test were done (Figure 14). As well known, the test by single flat-jack allows for the estimation of the in situ vertical stress σ0 acting on the masonry wall, while the double flat-jack test allows for the evaluation of the modulus of elasticity of the masonry E in the tested zone in the range of the applied compressive stress (generally the investigation is limited at low-to-medium compressive stress with respect to the masonry strength).
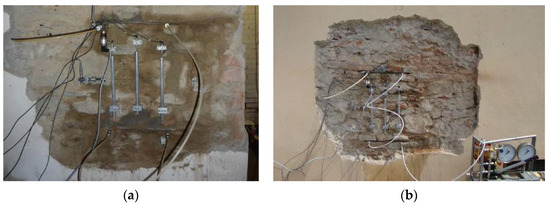
Figure 14.
Double flat-jack tests performed, (a) S2-PT-D, (b) S5-P1-D.
Table 3 collects the relevant data and the results of the tests.
Table 3.
Flat-jack test results.
The obtained vertical compressive stresses of 0.10 and 0.33 N/mm2 are in good agreement with the estimated stresses due to the gravity loads. Both the double flat-jack tests were performed with two load cycles, with maximum pressure inside the jacks approximately equal to 1.2 N/mm2 for the first cycle and 1.4 N/mm2 for the second one. Three vertical strain gauges were placed to measure the vertical deformation history and another strain gauge was positioned in the horizontal direction to control the lateral deformation.
Considering the diagram of Figure 15, it is possible to observe that the S2-PT test at the ground floor shows significant residual deformations at the end of the first cycle, while the second one has almost no plastic deformations. The S5-P1 test has negligible residual deformations for both cycles. Different interpretations of the double flat-jack test results have been used to evaluate the elastic modulus E, i.e., considering the initial slope of the stress–strain diagram, the slope of the unloading branch (in the first or in the second cycle) or the most representative part of the diagram which shows a linear behavior. In the present case E was evaluated as the secant modulus at a prefixed stress level. For the S2-PT test a range of E from 1600 N/mm2 to 1200 N/mm2 was obtained at level of stress of 0.5 N/mm2 and 1.0 N/mm2. Values of 1900 and 1800 N/mm2 were obtained for the second test. As expected, these estimations of E are higher than those obtained by the MQI evaluation. This reflects the well-known general trend obtained in the flat-jack tests in which the size effects are relevant. It is interesting to cross the results obtained by the FJ tests with the ones of the DRMS tests on the mortar. The mortar sample of the first floor shows the highest compressive strength, which could be one of the reasons for the better behavior of the flat jack-test, together with the observed better weaving of the masonry.
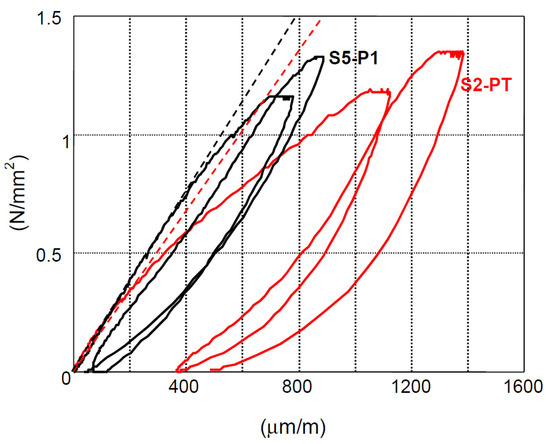
Figure 15.
Stress–strain diagram obtained by the two double flat-jack tests.
Different typologies of floors were found. The lower two levels are characterized by the occurrence of masonry vaults, mainly barrel vaults for the ground level, cross and rib ones for the first floor. Reinforced concrete with hollow tiles floors and steel floors were recognized too. The upper levels are mainly characterized by the presence of wooden floors, with double order of the beams, with a portion of the roof replaced in recent years. Considering the historic value of the building, it was not possible to perform direct investigations to detect the floor structure and their thicknesses (such as endoscopy tests). However, some detailed information was obtained by the laser scanner relief.
The structural elements of the second floor were also investigated by the GPR technique. This procedure uses a radio transmitting apparatus, able to send multi-frequency electromagnetic pulses in the subsoil and to receive reflections. The obtained profiles help in the individuation of the distances among structural elements and of the type of materials, as shown in the example of Figure 16, which allowed for the identification of a steel and hollow tiles floor at the second level.
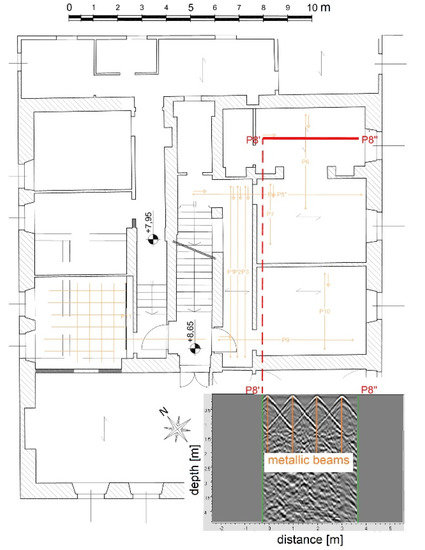
Figure 16.
Ground Penetrating Radar (GPR) inspection for the identification of the structure of the floors.
Overall, the in-situ survey and the tests made possible to analyze the masonry typologies and to assess some of their mechanical properties. Considering the observed textures and the results of DRMS and FJ tests, the two categories “Irregular stone masonry (pebbles, erratic and irregular stones)” (Cat. I in Table 1) and “Solid brick masonry with lime mortar” of the Italian standard [34,35] were selected. To account for the uncertainties in the knowledge of the structural properties of the existing buildings, the Italian standard introduces a specific correcting factor, called confidence factor FC. This coefficient has the purpose of grading the reliability of the structural analysis considering the effect of the modelling uncertainties. The confidence factor depends on the level of knowledge obtained with respect to the geometry, the structural details and the mechanical properties of the masonry. With specific reference to the monumental heritage, in [8] the confidence factor is defined as the sum of the unity plus four independent partial factors FCi. The first factor, FC1 accounts for the knowledge of the geometric and structural survey (including the cracking pattern). FC2 accounts for the knowledge of the materials and of the constructive details. FC3 accounts for the tests to determine the mechanical properties and the last, FC4, accounts for the knowledge on soil and foundations.
In the case of the Vasari’s House museum, the factor FC1 was obtained equal to zero due to the exhaustive geometric survey, which included the cracking pattern. The factor FC2 was obtained equal to 0.06 since it was possible to reconstruct the main phases of the construction. The mechanical properties of the materials were obtained by means of experimental data; therefore, the coefficient FC3 was obtained equal to 0.06. Geological and geotechnical data were available, as well as the foundation typology. In addition, the execution of the surface seismic test Multichannel Analysis of Surface Waves (MASW) provided further data allowing the selection of the soil category needed to obtain the seismic action (soil of B type, deposits of very dense sand, gravel or stiff clay). Consequently, the factor FC4 was obtained equal to 0.03. Hence, the whole confidence factor FC was fixed equal to 1.15.
5. Seismic Analysis
The Italian standards [8] provide a methodological tool in the European context to assess the seismic risk of an ancient and monumental building. The methodology is organized on three levels: (a) the first level of analysis (EL1) is a first evaluation based on simplified global mechanical models. For buildings and palaces, the procedure requires the evaluation of the maximum shear strength of each floor in two orthogonal directions, calculated as the shear strength in the diagonal cracking failure mechanism; (b) the second level of analysis (EL2) considers the local collapse mechanisms of the single macro-elements. This approach is useful to highlight the local lacks the structure, due to the absence of connections among the structural elements; (c) the third level of analysis (EL3) is based on detailed full models of the structure. These models are performed by finite elements discretization or are based on equivalent framed structures. The response spectrum and the pushover method are generally used too. This approach is reliable only if the local failure modes have been prevented.
The document [8] defines two safety indexes or indicators of the seismic risk. The first one is called “seismic safety index” and it is the ratio between TSLV, i.e., the return period of the seismic action that causes the achievement of the limit state SLV and the demanded return period, TR,SLV:
The second index is the ratio between the peak ground acceleration aSLV that causes the achievement of the SLV, and the demanded ag,SLV:
Following the previous approach, the results of the EL1 and EL3 global analyses performed on the museum of the Vasari’s House are presented to highlight the reliability of the simplified approach. Obviously, such analyses presume that the local out-of-plane failure modes of the single walls are prevented.
5.1. Seismic Hazard
The reference seismic action was evaluated according to the Italian standard ([34]) which provides the basic parameters of the hazard in terms of: ag (maximum peak ground horizontal acceleration), F0 (maximum spectral amplification factor) and TC* (cut-off period for beginning of the constant velocity part of the spectrum). The spectral shape, i.e., the elastic response spectrum on rigid ground (soil type A and horizontal topographic surface) is hence defined through the triplet {ag, F0, TC*} and it is provided for nine return periods TR,SL (between 30 and 2475 years), each characterized by a probability PVR of overcoming in the reference period VR.
For the museum of the Vasari’s House (latitude 43°47′ N and longitude 11°88′ E), the life safety limit state (SLV) was considered for the analyses, with a probability of overcoming of 10%. The reference period is a function of the nominal life of the structure VN (50 years, ordinary buildings) and the class of use (III, buildings with significant crowding), respectively. The CU coefficient, which depends on the class of use, is equal to 1.5 and the return period (TR,SLV) is 712 years. The set of parameters to be selected to define the response spectrum are collected in Table 4 (refer to [34] for full list of the parameters).
Table 4.
Parameters assumed for the definition of the elastic response spectrum.
5.2. First Level of Analysis (EL1)
This level is aimed to provide a first estimation of the seismic risk of the analyzed structure, expressed in terms of IS,SLV (Equation (1)) and fa,SLV (Equation (2)), through a simplified mechanical model. The method is based on the assumption of global response of the structure, a hypothesis that must be verified separately by the EL2 analyses. This mean that with this assumption the approach just provides an indication about the global capacity of the structures and detailed analyses are always required.
The analytical procedure is, substantially, based on the evaluation of the shear strength of the building at each level in both the horizontal directions (assuming the diagonal cracking failure mechanism [38,39,40]) with a modifying factor for the rocking collapse possibility. Dividing these strengths at each level by the total weight, it is possible to obtain the minimum spectral acceleration of capacity, which leads to the evaluation of the associated Peak Ground Acceleration through a scaling procedure of the demand spectrum. The calculation can be performed considering the uniform collapse (corresponding to a triangular modal shape) or the collapses of each single level. Here the main steps are briefly resumed (more details on the procedure are reported in the Italian Guidelines [8]). The spectral elastic acceleration related to the collapse and to the fundamental period of the building T1 is:
in which q is the behavior factor (q = 3.0), e* is the fraction of the mass participating to the first mode and M is the total mass given by (N = number of floors, g = gravity acceleration, the characteristics dead (Gk) and variable (Qki) loads are combined by the coefficients ψ2i):
Finally, FSLV is the shear strength capacity of the building. Simplified formulae for e* related to the uniform collapse and to the collapse of the ith-floor are, respectively:
Starting from Se,SLV the return period TSLV corresponding to the capacity of the building can be evaluated by the geographic hazard parameters; the related Peak Ground Acceleration aSLV can be also calculated. A key point of the procedure is the evaluation of FSLV. The formula proposed the Italian Guidelines [8] is rather articulated, e.g., for the ith-floor and the x direction:
in which Axi is the total area of the shear walls in the ith-floor along the x direction, τdi the specific shear strength related to the collapse for diagonal cracking (the other coefficients take into account the plan regularity, the possibility of flexure failure of the piers, the strength of the masonry spandrels). κi is introduced to scale the seismic capacity of the ith-floor in the equivalent strength of the building FSLV, and it is assumed as:
The hypotheses of uniform collapse and single floor collapses lead to the results collected in Table 5 and Table 6. The uniform collapse highlights that the weakest direction is the transversal one (without considering results of the ground floor, where the thicknesses of the walls are much greater than those of the upper floors). The indexes pertinent to the attic are not significant for the case study, due to its conformation (different heights of the resistant piers). Similarly, results obtained considering the collapses of each floor confirm that the structure shows two different behaviors along the main horizontal directions: in particular, along the longitudinal direction, the weakest level is the ground floor, as expected in a regular behavior, while in the transversal one, the capacity is governed by the first floor. This is due to the lack of transversal resistant systems as better described in the global analyses of the third level.
Table 5.
Results of the EL1 analysis, considering the uniform collapse (triangular modal shape).
Table 6.
Results of the EL1 analysis, considering the collapses of a single floor.
The comparison between the two hypotheses shows a significant difference in the estimation of the capacity indexes: the uniform collapse approach leads to more conservative results. From a quantitative point of view the building has very low safety indexes fa,SLV: 0.44 in the longitudinal direction and 0.31 in the transversal one. Despite these low values, it should be observed that the EL1 approach operates at territorial scale and it is mainly aimed at providing a comparative ranking risk and highlighting the need for subsequent in-depth investigations.
5.3. Third Level of Analysis (EL3)
The third level of analysis proposed in [8] envisages the use of numerical models which are employed to investigate the global structural behavior of the structure. They are used to evaluate the ground accelerations leading the structure to each limit state. The numerical models must be able to account for the actual masses and stiffness distribution and to simulate the nonlinear behavior of the materials. Since this level of analysis is based on a global discretization of the building, the obtained risk evaluation is connected to the in-plane strength of the masonry panels.
Taking into account the regular geometric configuration of the museum, the numerical evaluations were performed by the software 3Muri. This is a user-friendly computer code specifically proposed for the seismic analysis of regular masonry buildings through the pushover method. The code was originally developed at the University of Genoa and then implemented in a commercial software ([41,42]). The software uses an equivalent frame modelling approach (FME, Frame by Macro Elements) in which the structure is idealized as a combination of one-dimensional macro-elements. Therefore, each wall is divided into piers and spandrels connected by rigid zones called nodes. The in-plane behavior of the macro-elements is assumed as elastic-perfectly plastic, with the shear strength and the ultimate displacement obtained according to the provisions of the Italian standards ([34,35]). Failure modes by bending and diagonal cracking are considered for each panel with ultimate displacements assumed as a percentage of the length of the macro-element. It is worth noting that the Italian Guidelines [8] do not identify the use of a specific modeling approach to perform the EL3 analyses and the selection of the convenient code is left to the judgement of the analyst. Recent study deals with this topic by reporting the results of blind benchmarks for seismic assessment of unreinforced masonry structures which compares different modeling approaches (e.g., [43,44,45]).
According to the historical information and by observing the differences of the thickness and of the material of the walls, it was possible to make some hypotheses about the layout of the building. The original structure had a rectangular shape, then the lateral buildings were added, altering the regular shape of the plan. The disconnection in the façade facing the garden (Figure 9) suggests an added part in the South-West corner. Consequently, to cover these features, two different numerical models were realized: Model 1 (Figure 17a) representing the actual configuration of the building and Model 2 (Figure 17b) representing the original configuration.
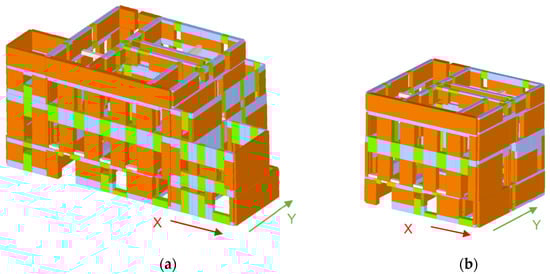
Figure 17.
3D views of the numerical models: (a) Model 1; (b) Model 2.
The seismic risk of the structure was assessed by performing static nonlinear analyses through the pushover approach. Both a uniform distribution of the forces proportional to the masses of each level (distribution G2) and a modal distribution proportional to the forces evaluated with the first mode shape (distribution G1) were considered. Each of these seismic loads were separately applied in both the two main directions of the structure (longitudinal X and transversal Y), assuming the presence and the absence of the conventional eccentricity (5% of the total length of the building in the considered direction, i.e., the forces are applied at the center of mass considering this eccentricity).
Considering all the possible combinations of the above-mentioned variables, overall 24 analyses were performed for each numerical model (Model 1 and Model 2).
Model 1: the presence of the lateral annexes alters the in-plan regularity of the structure. The modal analysis highlighted a torsional behavior, with a percentage of activated mass equal to about 49%, while the longitudinal direction is characterized by a regular translational behavior (67% of activated mass). In both cases, the period is lower than 0.3 s. The pushover results showed that the transversal direction Y is the weakest one, with the minimum acceleration factor fa,SLV equal to 0.68 (obtained with the load profile G1 with an eccentricity of 5% L). The collapse pattern of the most representative walls indicated a concentrated damage in the first level in which several piers collapsed for diagonal cracking (Figure 18). Concerning the longitudinal direction X, the minimum value of the acceleration index of safety is equal to 0.84. In this case the structure behaves more regularly (Figure 19), with a widespread damage distribution along each wall, except for the ground level due to the high thickness of the walls.
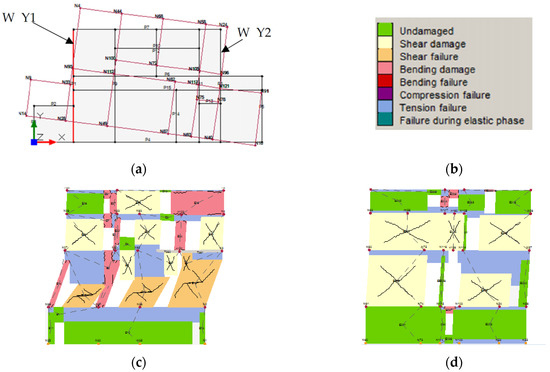
Figure 18.
Pushover analysis in the transversal direction Y for Model 1: damage state at failure for the walls W_Y1 and W_Y2.
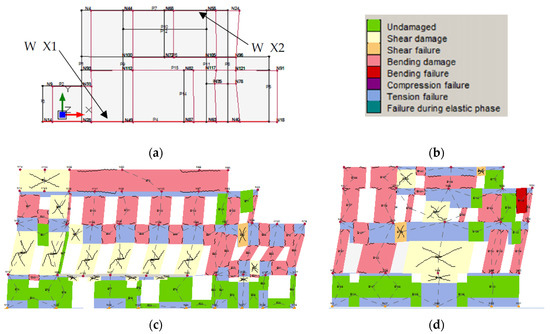
Figure 19.
Pushover analysis in the longitudinal direction X for Model 1: damage state at failure for the walls W_X1 and W_X2.
Model 2: the original configuration is characterized by a regular shape (with plan dimensions of 16 m × 15 m), even if the internal distribution of the shear walls is not symmetric along the two main directions. The results show that the building has almost the same safety index in both the directions, equal to 0.71 for the Y direction and 0.73 for the longitudinal one. With respect to Model 1 there is not a remarkable change in the level of safety in the Y direction whereas in the X direction there is an evident decrease of the index, since the exclusion of the added parts reduces the inertia of the longitudinal walls, causing a decrease of the capacity. The mode shapes are more regular than the previous ones, with reduced torsional components. In the Y direction we observe a more regular distribution of the damage along the height. In the longitudinal direction, we observe a different cracking pattern in the main façade, with the damage that reaches even the ground floor. The piers are mainly damaged by the bending behavior (Figure 20 and Figure 21).
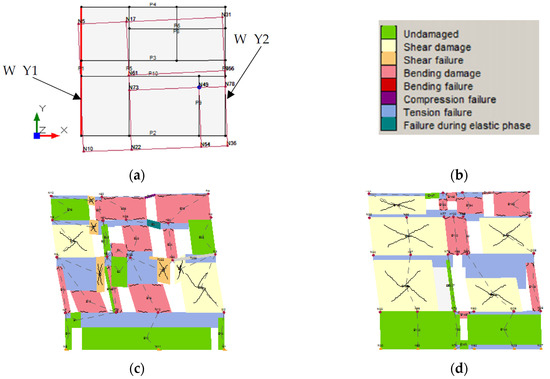
Figure 20.
Pushover analysis in the transversal direction Y for Model 2: damage state at failure for the walls W_Y1 and W_Y2.
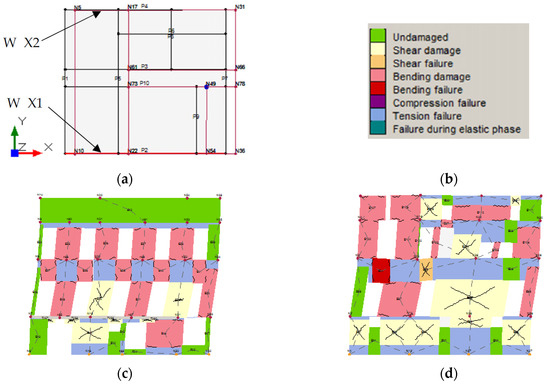
Figure 21.
Pushover analysis in the longitudinal direction X for Model 2: damage state at failure for the walls W_X1 and W_X2.
The seismic safety indexes obtained with the EL3 analysis are reported in Table 7. As said, the transversal direction Y is the weakest with limited differences obtained by the two models. The minimum value of fa,SLV is 0.68 (Model 1). From Table 5 the same index obtained with the EL1 analysis was 0.31, approximately one-half of the previous value. This difference must be interpreted in the light of the two different modelling approaches of global analysis (EL1 and EL3) and indirectly represents a measure of the benefits introduced by a survey which increases the knowledge over the building. If the local failure modes are prevented, the results of the EL3 analysis are the most reliable and suggest possible remedial measures aimed to improve the seismic strength of the structure.
Table 7.
EL3 results in terms of return period TSLV, acceleration factor fa,SLV and seismic safety index IS,SLV.
6. Conclusive Remarks
The knowledge process represents a critical phase for the definition of reliable structural models of historical buildings. The case study here discussed highlights that, even in a quite simple construction, many peculiar aspects can be found with a detailed and careful in situ investigation, through focused and not destructive tests.
The Italian Guidelines offer a guided procedure for the evaluation of seismic safety, through three different levels of detail, which help in the structural analysis. In any case, the numerous uncertainties which can characterize a monumental building require a remarkable sensibility during the structural assessment, since many aspects cannot be included in guided schemes. For example, considering the computational aspects, it is important to highlight that the safety assessment of an historical building, due to its structural uncertainties (related to the evolution of the considered complex), should consider different configurations in case of evident discontinuities. As a consequence, different models should be used. The proposed analyses show a possible approach for the investigation of the seismic capacity of an ancient masonry building, considering two different levels of accuracy: the first is a global evaluation based on a simplified approach (EL1) and the second is based on the application of the classical pushover with a macro-element 3D model (EL3).
The seismic risk index estimated by the EL1 analysis is equal to 0.31 while the same index estimated by the EL3 analysis is equal to 0.68. This large discrepancy underlines that the simplified approaches, despite their speediness, can produce a wrong evaluation of the safety level. Their difference is an indirect measure of the benefits that can be obtained increasing the knowledge over the building both in terms of reliability of the seismic risk provisions and impact of the possible retrofitting. It must be observed that the results of the EL1 and EL3 models should be considered as an upper limit of the building capacity, which can be reached only when the out-of-plane damage mechanisms are not first activated.
Author Contributions
Conceptualization, M.B., V.B., L.G., E.P., G.T. and A.V.; methodology, M.B., V.B., L.G., G.T. and A.V.; investigation, M.B., V.B., L.G., G.T. and A.V.; writing—original draft preparation, M.B., V.B., L.G., E.P., G.T. and A.V.; writing—review and editing, M.B., V.B. and L.G. All authors have read and agreed to the published version of the manuscript.
Funding
This research received no external funding.
Institutional Review Board Statement
Not applicable.
Informed Consent Statement
Not applicable.
Data Availability Statement
Not applicable.
Acknowledgments
The authors kindly acknowledge the MIBACT and the ARCUS S.p.A. who promoted and financed this research project.
Conflicts of Interest
The authors declare no conflict of interest.
References
- D’Ayala, D.F.; Paganoni, S. Assessment and analysis of damage in L’Aquila historic city centre after 6th April 2009. Bull. Earthq. Eng. 2010, 9, 81–104. [Google Scholar] [CrossRef]
- Lucibello, G.; Brandonisio, G.; Mele, E.; De Luca, A. Seismic damage and performance of Palazzo Centi after L’Aquila earthquake: A paradigmatic case study of effectiveness of mechanical steel ties. Eng. Fail. Anal. 2013, 34, 407–430. [Google Scholar] [CrossRef]
- Penna, A. Seismic assessment of existing and strengthened stone-masonry buildings: Critical issues and possible strategies. Bull. Earthq. Eng. 2014, 13, 1051–1071. [Google Scholar] [CrossRef]
- Betti, M.; Galano, L.; Vignoli, A. Time-History Seismic Analysis of Masonry Buildings: A Comparison between Two Non-Linear Modelling Approaches. Buildings 2015, 5, 597–621. [Google Scholar] [CrossRef]
- Mallardo, V.; Malvezzi, R.; Milani, E.; Milani, G. Seismic vulnerability of historical masonry buildings: A case study in Ferrara. Eng. Struct. 2008, 30, 2223–2241. [Google Scholar] [CrossRef]
- Betti, M.; Galano, L.; Vignoli, A. Comparative analysis on the seismic behaviour of unreinforced masonry buildings with flexible diaphragms. Eng. Struct. 2014, 61, 195–208. [Google Scholar] [CrossRef]
- Lourenço, P.B.; Mendes, N.; Ramos, L.F.; Oliveira, D.V. Analysis of Masonry Structures Without Box Behavior. Int. J. Arch. Heritage 2011, 5, 369–382. [Google Scholar] [CrossRef]
- DPCM2011. Direttiva del Presidente del Consiglio dei Ministri per la Valutazione e Riduzione del Rischio Sismico del Patrimonio Culturale con Riferimento alle Norme Tecniche per le Costruzioni di cui al Decreto del Ministero delle Infrastrutture e dei Trasporti del 14 gennaio 2008. Gazzetta Ufficiale Serie Generale n. 47 del 26 febbraio 2011, Supplemento Ordinario n. 54. Available online: https://www.gazzettaufficiale.it/atto/serie_generale/caricaDettaglioAtto/originario?atto.dataPubblicazioneGazzetta=2011-02-26&atto.codiceRedazionale=11A02374&elenco30giorni=false (accessed on 3 March 2021). (In Italian).
- Bartoli, G.; Betti, M.; Vignoli, A. A numerical study on seismic risk assessment of historic masonry towers: A case study in San Gimignano. Bull. Earthq. Eng. 2016, 14, 1475–1518. [Google Scholar] [CrossRef]
- Acito, M.; Bocciarelli, M.; Chesi, C.; Milani, G. Collapse of the clock tower in Finale Emilia after the May 2012 Emilia Romagna earthquake sequence: Numerical insight. Eng. Struct. 2014, 72, 70–91. [Google Scholar] [CrossRef]
- Torelli, G.; D’Ayala, D.; Betti, M.; Bartoli, G. Analytical and numerical seismic assessment of heritage masonry towers. Bull. Earthq. Eng. 2020, 18, 969–1008. [Google Scholar] [CrossRef]
- Barazzetti, L.; Banfi, F.; Brumana, R.; Gusmeroli, G.; Oreni, D.; Previtali, M.; Roncoroni, F.; Schiantarelli, G. Bim from Laser Clouds and Finite Element Analysis: Combining Structural Analysis and Geo-Metric Complexity. ISPRS Int. Arch. Photogramm. Remote. Sens. Spat. Inf. Sci. 2015, XL-5/W4, 345–350. [Google Scholar] [CrossRef]
- Xu, W.; Neumann, I. Finite Element Analysis based on A Parametric Model by Approximating Point Clouds. Remote Sens. 2020, 12, 518. [Google Scholar] [CrossRef]
- Castellazzi, G.; D’Altri, A.M.; Bitelli, G.; Selvaggi, I.; Lambertini, A. From Laser Scanning to Finite Element Analysis of Complex Buildings by Using a Semi-Automatic Procedure. Sensors 2015, 15, 18360–18380. [Google Scholar] [CrossRef] [PubMed]
- Hinks, T.; Carr, H.; Truong-Hong, L.; Laefer, D.F. Point Cloud Data Conversion into Solid Models via Point-Based Voxelization. J. Surv. Eng. 2013, 139, 72–83. [Google Scholar] [CrossRef]
- Bassier, M.; Hardy, G.; Bejarano-Urrego, L.; Drougkas, A.; Verstrynge, E.; Van Balen, K.; Vergauwen, M. Semi-automated Creation of Accurate FE Meshes of Heritage Masonry Walls from Point Cloud Data. RILEM Bookseries 2019, 18, 305–314. [Google Scholar] [CrossRef]
- Armesto, J.; Lubowiecka, I.; Ordóñez, C.; Rial, F.I. FEM modeling of structures based on close range digital photogrammetry. Autom. Constr. 2009, 18, 559–569. [Google Scholar] [CrossRef]
- Korumaz, M.; Betti, M.; Conti, A.; Tucci, G.; Bartoli, G.; Bonora, V.; Korumaz, A.G.; Fiorini, L. An integrated Terrestrial Laser Scanner (TLS), Deviation Analysis (DA) and Finite Element (FE) approach for health assessment of historical structures. A minaret case study. Eng. Struct. 2017, 153, 224–238. [Google Scholar] [CrossRef]
- Pepi, C.; Cavalagli, N.; Gusella, V.; Gioffrè, M. An integrated approach for the numerical modeling of severely damaged historic structures: Application to a masonry bridge. Adv. Eng. Softw. 2021, 151, 102935. [Google Scholar] [CrossRef]
- Tucci, G.; Bartoli, G.; Betti, M. TLS Survey and FE Modelling of the Vasari’s Cupola of the Basilica dell’Umiltà (Italy). An Interdisciplinary Approach for Preservation of CH. In Proceedings of the First International Conference Transdisciplinary Multispectral Modeling and Cooperation for the Preservation of Cultural Heritage, Athens, Greece, 10–13 October 2018; pp. 487–499. [Google Scholar] [CrossRef]
- Quattrini, R.; Clementi, F.; Lucidi, A.; Giannetti, S.; Santoni, A. From TLS to Fe Analysis: Points Cloud Exploitation for Structural Behaviour Definition. The San Ciriaco’s Bell Tower. ISPRS Int. Arch. Photogramm. Remote Sens. Spat. Inf. Sci. 2019, XLII-2/W15, 957–964. [Google Scholar] [CrossRef]
- Dall’Asta, A.; Leoni, G.; Meschini, A.; Petrucci, E.; Zona, A. Integrated approach for seismic vulnerability analysis of historic massive defensive structures. J. Cult. Heritage 2019, 35, 86–98. [Google Scholar] [CrossRef]
- Pieraccini, M.; Dei, D.; Betti, M.; Bartoli, G.; Tucci, G.; Guardini, N. Dynamic identification of historic masonry towers through an expeditious and no-contact approach: Application to the “Torre del Mangia” in Siena (Italy). J. Cult. Heritage 2014, 15, 275–282. [Google Scholar] [CrossRef]
- Tucci, G.; Bonora, V. Geomatics and management of at-risk cultural heritage. Rend. Lince 2015, 26, 105–114. [Google Scholar] [CrossRef]
- Betti, M.; Borghini, A.; Ciavattone, A.; Boschi, S.; Del Monte, E.; Vignoli, A. Assessment of the seismic risk of the museum of Casa Vasari in Arezzo (Italy). Int. J. Mason. Res. Innov. 2017, 2, 107. [Google Scholar] [CrossRef]
- Loffredo, M. Da casa a museo. Le trasformazioni della dimora aretina di Giorgio Vasari. Med. Riv. Interdiscip. Studi Med. 2011, 10, 50–57. (In Italian) [Google Scholar]
- Grieves, M.; Vickers, J. Digital Twin: Mitigating Unpredictable, Undesirable Emergent Behavior in Complex Systems. In Transdisciplinary Perspectives on Complex Systems; Kahlen, F.J., Flumerfelt, S., Alves, A., Eds.; Springer: Berlin/Heidelberg, Germany, 2017; pp. 85–113. [Google Scholar]
- Ioannides, M.; Quak, E. (Eds.) 3D Research Challenges in Cultural Heritage: A Roadmap in Digital Heritage Preservation; Lecture Notes in Computer Science 8355; Springer: Berlin/Heidelberg, Germany, 2014; ISBN 9783662446300. [Google Scholar]
- Kansa, S.W.; Kansa, E.C. Data Beyond the Archive in Digital Archaeology. Adv. Archaeol. Pract. 2018, 6, 89–92. [Google Scholar] [CrossRef]
- Di Giulio, R.; Maietti, F.; Piaia, E.; Medici, M.; Ferrari, F.; Turillazzi, B. Integrated Data Capturing Requirements for 3d Semantic Modelling of Cultural Heritage: The Inception Protocol. ISPRS Int. Arch. Photogramm. Remote. Sens. Spat. Inf. Sci. 2017, XLII-2/W3, 251–257. [Google Scholar] [CrossRef]
- Del Monte, E.; Vignoli, A. In situ mechanical characterization of the mortar in masonry buildings with DRMS. In Proceedings of the Sacomatis Conference, Varenna, Italy, 1–2 September 2008. [Google Scholar]
- Borri, A.; Corradi, M.; Castori, G.; De Maria, A. A method for the analysis and classification of historic masonry. Bull. Earthq. Eng. 2015, 13, 2647–2665. [Google Scholar] [CrossRef]
- Borri, A.; Corradi, M.; De Maria, A. The Failure of Masonry Walls by Disaggregation and the Masonry Quality Index. Heritage 2020, 3, 1162–1198. [Google Scholar] [CrossRef]
- NTC2008. Decreto Ministeriale del Ministero delle Infrastrutture e dei Trasporti del 14/01/2008. Nuove Norme Tecniche per le Costruzioni. Gazzetta Ufficiale Serie Generale n. 29 del 04 Febbraio 2008, Supplemento Ordinario n. 30. Available online: https://www.gazzettaufficiale.it/eli/id/2008/02/04/08A00368/sg (accessed on 3 March 2021). (In Italian).
- MIT2009. Istruzioni per l’Applicazione Nuove Norme Tecniche Costruzioni di cui al Decreto Ministeriale 14 gennaio 2008. Circolare n. 617 del 2 Febbraio 2009. Gazzetta Ufficiale Serie Generale n. 47 del 26 febbraio 2009, Supplemento Ordinario n. 27. Available online: https://www.gazzettaufficiale.it/eli/id/2009/02/26/09A01318/sg (accessed on 3 March 2021). (In Italian).
- ASTM. C1196-91 Standard Test Method for In Situ Compressive Stress within Solid Unit Masonry Estimated Using Flat-Jack Measurements; ASTM: West Conshohocken, PA, USA, 1991. [Google Scholar]
- ASTM. C1197-91 Standard Test Method for In Situ Measurement of Masonry Deformability Properties the Using Flat-Jack Method; ASTM: West Conshohocken, PA, USA, 1991. [Google Scholar]
- Betti, M.; Galano, L.; Petracchi, M.; Vignoli, A. Diagonal cracking shear strength of unreinforced masonry panels: A correction proposal of the b shape factor. Bull. Earthq. Eng. 2015, 13, 3151–3186. [Google Scholar] [CrossRef]
- Monaco, M.; Calderoni, B.; Iannuzzo, A.; Gesualdo, A. Behaviour of in-plane loaded masonry panels. Procedia Struct. Integr. 2018, 11, 388–393. [Google Scholar] [CrossRef]
- Gesualdo, A.; Calderoni, B.; Iannuzzo, A.; Fortunato, A.; Monaco, M. Minimum energy strategies for the in-plane behaviour of masonry. Frat. Integrità Strutt. 2019, 14, 376–385. [Google Scholar] [CrossRef]
- Galasco, A.; Lagomarsino, S.; Penna, A. TREMURI Program: Seismic Analyser of 3D Masonry Buildings; Università di Genova: Geneva, Switzerland, 2002. [Google Scholar]
- Lagomarsino, S.; Penna, A.; Galasco, A.; Cattari, S. TREMURI program: An equivalent frame model for the nonlinear seismic analysis of masonry buildings. Eng. Struct. 2013, 56, 1787–1799. [Google Scholar] [CrossRef]
- Bartoli, G.; Betti, M.; Biagini, P.; Borghini, A.; Ciavattone, A.; Girardi, M.; Lancioni, G.; Marra, A.M.; Ortolani, B.; Pintucchi, B.L.; et al. Epistemic Uncertainties in Structural Modeling: A Blind Benchmark for Seismic Assessment of Slender Masonry Towers. J. Perform. Constr. Facil. 2017, 31, 04017067. [Google Scholar] [CrossRef]
- Aşıkoğlu, A.; Vasconcelos, G.; Lourenço, P.B.; Pantò, B. Pushover analysis of unreinforced irregular masonry buildings: Lessons from different modeling approaches. Eng. Struct. 2020, 218, 110830. [Google Scholar] [CrossRef]
- Parisse, F.; Cattari, S.; Marques, R.; Lourenço, P.; Magenes, G.; Beyer, K.; Calderoni, B.; Camata, G.; Cordasco, E.; Erberik, M.; et al. Benchmarking the seismic assessment of unreinforced masonry buildings from a blind prediction test. Structures 2021, 31, 982–1005. [Google Scholar] [CrossRef]
Publisher’s Note: MDPI stays neutral with regard to jurisdictional claims in published maps and institutional affiliations. |
© 2021 by the authors. Licensee MDPI, Basel, Switzerland. This article is an open access article distributed under the terms and conditions of the Creative Commons Attribution (CC BY) license (https://creativecommons.org/licenses/by/4.0/).