Abstract
Aglime (agricultural lime), commonly applied to acid soils to increase the soil pH and productivity, may lead to the release of CO2 into the atmosphere or to carbon (C) sequestration, although the processes involved are not fully understood. As large acreages of arable land are limed annually, exploring soil management practices that reduce aglime-induced CO2 emissions from acid soils while maintaining or improving the soil quality is paramount to mitigating the effects of global climate change. This study, therefore, assessed the effects of organic residues and ammonium on CO2 emissions and soil quality indicators in two limed soils. Two contrasting acid soils (Nariva series, Mollic Fluvaquents and Piarco series, Typic Kanhaplaquults) were amended with varying combinations of aglime (0% and 0.2% w/w CaCO3), organic residue (0% and 5% w/w biochar or poultry litter), and NH4-N (0% and 0.02% w/w) and were incubated in 300 mL glass jars for 31 days. The sampling for CO2 was performed on 11 occasions over the course of the incubation, while soil sampling was conducted at the end. The results indicate that aglime application significantly (p < 0.05) increased the cumulative CO2 emissions in all cases except with the addition of poultry litter. Alternatively, ammonium did not regulate the effect of aglime on CO2 emissions, which was likely because of the low rate at which it was applied in comparison to aglime. The results also showed that poultry litter significantly (p < 0.05) increased the soil electrical conductivity (EC), available nitrogen (N), and pH, especially in the Piarco soil, while the hardwood biochar had little to no effect on the soil properties. Our findings indicate the potential for utilizing poultry litter to reduce the impact of aglime on CO2 emissions while improving the soil quality. Further studies utilizing 13C to trace aglime CO2 emissions are, however, required to identify the mechanism(s) that contributed to this reduction in the emissions.
1. Introduction
Acid soils play a pivotal role in the production of food globally, as they occupy ~30% of the world’s arable land and more than 70% of its potentially arable land [1,2]. The largest proportion of these soils exists in the humid tropics [1,3], as the rainfall in this region is often sufficient to severely leach the soil profile [3]. Much of these soils require periodic pH correction to improve and sustain their productivity, which is commonly achieved through the application of agricultural lime (aglime) [3,4]. Aglime, however, can serve as a source of CO2 to the atmosphere when applied to these soils, thereby contributing to global warming and climate change [5,6,7,8].
The tier 1 approach of the Intergovernmental Panel on Climate Change (IPCC) assumes that all of the carbon (C) that is stored in aglime is released into the atmosphere when the lime dissolves [9]. However, Hamilton et al. [10] and West and McBride [11] have suggested that this is not always the case. They argued that the biogeochemical theory suggests that carbonates in soils may sequester or release CO2 depending on the type of acid existing. Aglime dissolved by weak acids, such as H2CO3, which is formed as a result of the dissolution of CO2 generated from root and microbial respiration in soil water, serves as a net sink of CO2. This reaction leads to the formation of non-gaseous HCO3−, which can then leach through the soil profile and subsequently be transported into the ocean via streams [10,11]. Alternatively, if aglime is dissolved by strong acids, such as HNO3, which can be formed from the nitrification of NH4+, CO2 is the product [10,11]. Therefore, the overuse of ammonium-based fertilizers in crop production may enhance the CO2 source potential of aglime; however, studies directly measuring CO2 are yet to confirm this [5]. Notwithstanding the findings of Hamilton et al. [10] and West and McBride [11], Semhi et al. [12] reported on a positive relationship between the levels of HCO3− and NO3− in the waters of the Garonne river basin in France, which can be the case even with CO2 being the product of carbonate dissolution in the presence of nitrification-derived HNO3 at the reaction site.
The practice of applying organic residues solely, or in combination with inorganic amendments to soils, has gained much interest as a strategy for enhancing soil fertility and carbon sequestration [12]. The effects of these organic residues are, however, quite variable depending on the quantity and quality of the organic residue and soil characteristics, such as the moisture content, microbial population, redox potential, pH, and texture [13,14,15,16,17], which justifies the need for soil-specific studies. In addition, since organic residues are known to stimulate microbial respiration, contributing to H2CO3 formation, they may also influence the dynamics of aglime-C applied to acid soils.
The quantity of aglime that is applied to agricultural soils is expected to increase as crop production extends into marginal land; previous predictions by Tillman et al. [18] on the global expansion of agriculture suggest that global lime use may increase by nearly threefold by the year 2050. Therefore, the suggestion by Ahmad et al. [8] that even a small change in the C dynamics of these limed soils could have significant implications on the fluxes of atmospheric CO2 on a global scale is very valid. It is, therefore, imperative to understand the impact of various soil management practices on the C dynamics of these soils, as this will later aid in the development of CO2 mitigation strategies for these soils.
In the island of Trinidad, acid soils are of major agronomic importance, as they occupy more than 80% of the island’s total land area [19,20,21], and any elucidation about the fate of aglime applied to these acid soils can be relevant to understanding the implications on a global scale. A study was therefore established to determine the effects of aglime on CO2 emissions from Trinidad acid soils amended with nitrogen (N) fertilizer and organic residues. The study also examined the effects of these amendments on selected soil properties. The major hypotheses investigated in this study were: (1) Aglime application would result in an increase in CO2 emissions, (2) the effects of aglime on CO2 emissions are regulated by organic residues and ammonium fertilizer, and (3) poultry litter and biochar improve the quality of acidic tropical soils.
2. Materials and Methods
2.1. Collection and Preparation of Soils and Organic Residues
Bulk soil samples of two contrasting Trinidad acid soils (Nariva series: Very fine, mixed, semi-active, isohyperthermic Mollic Fluvaquents and Piarco series: Clayey, kaolinitic, isohyperthermic Typic Kanhaplaquults) were collected at a depth of 0–15 cm from fields that had long histories of vegetable crop production (at 10°27ʹ19ʺN, 61°19ʹ26ʺW and 10°36ʹ37ʺN, 61°19ʹ26ʺW, respectively). After collection, the soil samples were transported to the Department of Food Production greenhouse at The University of the West Indies, St. Augustine Campus, where they were air-dried, ground, and passed through a 2 mm mesh sieve to obtain the ‘fine earth fraction’. The hardwood biochar and poultry litter that were used in the study were obtained from a local agro-shop and a local poultry farm, respectively. The poultry litter was allowed to dry and cure for ~3 weeks before being sieved to obtain a fraction <2 mm.
2.2. Analysis of Soils and Organic Residues
The pH of the soils was determined in H2O/CaCl2 slurries (water with 0.01 M CaCl2 on 1:1 soil) that were left to equilibrate for 15 min [22], while the electrical conductivity (EC) was determined on saturated paste extracts (ECe) and 1:2 soil:water slurries (ECs) that were shaken for 30 min on a Burrell 75 Wrist Action Shaker [23]. The soil lime requirement (LR) was determined by adding 3–5 mL of 0.0171 M Ca(OH)2 solution incrementally to a 1:1 soil:water slurry until reaching approximately pH 7 [24]. The particle size analysis of the soils was determined using the hydrometer method [25], while the soil water holding capacity (WHC) was estimated by allowing water to freely drain for 48 h from soil (~600 g on an air-dried basis) that was packed in covered styrofoam containers with perforated bases [17]. The soil cation-exchange capacity (CEC) was determined using the buffered salt extraction method [26]. The available N (NH4+ and NO3−) was extracted using 2 M KCl in a 1:10 soil:extract volume [27] and the concentration of these ions was then determined using colorimetric methods on a Technicon auto-analyzer [28]. The soil organic C (SOC) was determined using finely-ground samples (<250 µm) by rapid dichromate oxidation [29], while the total soil nitrogen (TN) was determined from Kjeldahl digests that were analyzed by steam distillation on a Labconco II Rapidstill [30]. As no inorganic C (IC) was detected in the soil samples, the SOC also represents the total C (TC) in this study.
The ECs and the NH4+ and NO3− concentrations of the organic residues were determined as described above for the soils. However, the pH of the residues was determined in 1:2.5 soil: H2O/CaCl2 slurries. The TC and TN were determined by dry combustion of finely-ground samples (<250 µm) on a Costech Elemental Analyzer. As IC was present in the poultry litter, these samples were exposed to 12 M of HCl vapor in a sealed desiccator for 48 h [31] in order to remove the carbonates, which can confound the organic C (OC) measurement. To characterize the IC fraction of the litter, the methods of Burford and Bremner [32] and Nelson [33] were employed. The procedure involved adding 2 g of finely-ground (<250 µm) oven-dried material to a 125 mL serum bottle that was sealed completely by capping with a 20 mm butyl-rubber stopper and a crimp cap (Thermo Scientific, Inc.). The bottle was flushed with N2 and then evacuated, followed by the injection of 10 mL of 5% HCl into the bottle using a 12 mL polyethylene syringe. After 2 h, a 20 mL gas sample was withdrawn using a polyethylene syringe and was analyzed for the total CO2 on a Bruker 450 Gas Chromatograph. Gas samples were also taken from ‘blank’ bottles to correct for any CO2 that was present in the vessel after flushing with N2. The IC in the litter was then calculated from the concentration of CO2 in the sample after correcting for the increase in pressure in the bottle. The CaCO3 content was calculated from the quantity of IC present in the soil, on the basis that C accounts for 12% of the relative molecular mass of CaCO3. A validation test, using a range of masses of analytical grade CaCO3, yielded recoveries of 101% to 104%, an R2 of 0.999 for the relationship between the measured and predicted values, and a coefficient of variation (CV) of 0.451% to 1.06%.
As a quality control measure, all analyses were carried out to include triplicates. The results of the characteristics described above are summarized in Table 1.

Table 1.
The selected properties of the soils and organic residues used in the experiment.
2.3. Experimental Treatments, Design, and CO2 Flux Measurement
Each of the two soils were amended with varying combinations of aglime (0% and 0.2% w/w = 4 Mg ha−1 CaCO3), organic residue (0% and 5% w/w = 100 Mg ha−1 biochar or poultry litter), and NH4Cl (0% and 0.02% w/w = 400 kg ha−1 N), giving a total of 24 treatment combinations for the four factors being investigated. The higher order three-way and four-way interactions of this factorial design were then confounded within the error term of the analysis of the variance of the variables measured. This allowed the main and two-way interaction effects, which were of greater significance in this study, to be assessed with a greater degree of precision [34].
Each experimental unit consisted of 80 g of soil on an oven-dried basis incubated in 300 mL glass jars equipped with alkali traps at times when the CO2 flux was measured [35]. The soils were incubated for 31 days in a laboratory at 22.3 ± 1 °C. The soil moisture content was adjusted to 100% water holding capacity (WHC) at the start of the experiment and rewetted to this initial moisture content at 9, 19, and 26 days after incubation (DAI). Prior to each CO2 measurement, 5 mL of 1 M NaOH was placed in polyethylene caps, which were fixed to the glass jar covers, and the jars were then completely sealed for a maximum of 24 h. After this period, the alkali traps were removed and the NaOH was transferred into 50 mL conical flasks and unreacted NaOH was back-titrated with 1 M of HCl to a phenolphthalein end-point, to quantify the CO2 emitted following the addition of ~3 mL of 1.5 M BaCl2 to precipitate the carbonates as BaCO3 [36]. The sampling was carried out on 11 occasions at 1, 3, 6, 9, 10, 15, 18, 21, 24, 28, and 31 DAI in this experiment, at which time three identical blank jars were included in the analysis to correct for the CO2 that was present in the headspace prior to installing the alkali traps [37].
2.4. Post-Incubation Sampling and Analyses
All soil treatments were sampled at the end of the incubation; they were air dried at ~30 °C for 3 days and analyzed for pH (H2O), ECs, NH4+, and NO3− as described above. The moisture content of these air-dried samples was determined by oven-drying a 5 g subsample of soil at 105 °C for 24 h.
2.5. CO2 Calculations
The CO2 evolved was calculated according to the formula of Stotzky [37]:
where B = the volume of acid required to titrate NaOH from the incubation jars with no soil treatment to the endpoint; V = the volume of acid required to titrate NaOH from the jars incubated with soil treatments to the endpoint; N = the normality of the acid; and E = the equivalent weight of C, expressed as CO2-C (6).
Milligrams of CO2-C evolved = (B − V) N*E,
The cumulative CO2 emissions were estimated by linear interpolation followed by numerical integration of the measured data points [7].
2.6. Statistical Analysis
The GenStat Discovery Edition 4 statistical package was used to perform a Repeated Measures Analysis (RMA) on the CO2 emission rates and a General Linear Model (GLM) ANOVA analysis on the cumulative CO2 emissions and the soil properties that were measured at the end of the study. Fisher’s Least Significant Difference (LSD) was used to separate the means of significant interactions and the main effects at p < 0.05. Only the main effects and the interactions that were statistically significant and related to the objectives of the study are presented.
3. Results and Discussion
3.1. CO2 Emissions
3.1.1. Soil-Aglime Effects
The application of the aglime significantly increased the CO2 emission rates in both soils; however, the magnitude of this increase was almost five times greater in the Piarco soil within the first 24 h of incubation (Figure 1). This enhanced release of CO2 following the aglime application has been shown to be directly due to aglime dissolution and indirectly due to priming, which is driven by the soil’s biological activity [5,6,7,8,38]. While the enhanced emission rate was more substantial in the Piarco soil, which had a much lower SOC than the Nariva soil, the interaction between this soil and the aglime was short-lived, as an RMA found it to be only significant within the first three days of incubation (Figure 1). Moreover, the cumulative emissions over the 31 days of incubation were not significantly affected by this interaction.
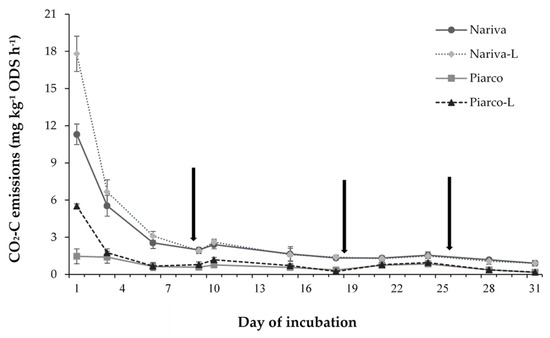
Figure 1.
The interactive effect of the soil and aglime (L) on CO2 emission rates. The least significant difference (LSD) (Time × Soil × Lime, p < 0.05) is 2.95 mg CO2-C kg−1 ODS h−1. The error bars represent one standard error (SE) for the means of the samples for each treatment at specific times. The bars are hidden when they are smaller than the symbol. The arrows indicate the days on which soils were re-wetted.
Priming has been found to be positive (enhanced SOC-CO2) following aglime application [6,7,8], although some studies [5,38,39] have reported negative to little or no effects. In 13C tracer studies to distinguish CO2 emissions originating from the aglime and SOC, Grover et al. [38] found that the priming effect of the aglime was greater for the soil with an initially lower SOC content, while Dumale et al. [6] found it to be the opposite. While the soils used by Dumale et al. [6] were of a similar texture, the fine-textured soil (with a greater clay content) in the study by Grover et al. [38] had less priming, even though it initially had the higher SOC. The latter findings provide some evidence that the greater clay content (and likely the greater stability of the aggregates) in the Nariva soil, in comparison to the Piarco soil, would have contributed to the protection of the SOC from microbial decomposition [37], thereby minimizing the priming effect in the soil.
A Repeated Measures Analysis also showed that the main effect of the aglime on CO2 emission rates was also short-lived, lasting for less than six days (data not shown). Other researchers, who utilized 13C tracer technology, such as Dumale et al. [6] and Miyazawa et al. [40], also reported that aglime CO2 emissions were short-lived, which suggests that the aglime solubility is greatly enhanced in acid soils. Nevertheless, cumulative emissions from the limed soils in this study were 270 mg CO2-C kg−1 ODS h−1 greater than in the non-limed soils.
3.1.2. Organic Residue-Aglime Effects
Support for the hypothesis that the aglime effects on CO2 emissions are regulated by organic residue application was found in this study, whereby a significant interactive effect between the organic residue and aglime was observed in emission rates and cumulative emissions (Figure 2 and Figure 3). The application of aglime significantly increased CO2 emission rates on the first day of incubation by 5.86 mg CO2-C kg−1 ODS h−1 (103%) and 7.85 mg CO2-C kg−1 ODS h−1 (139%) when biochar and no organic residue were applied, respectively, but only minimally (by 0.89 mg CO2-C kg−1 ODS h−1 or 9.90%) when poultry litter was applied (Figure 2). An RMA on the rates of the emissions and cumulative emissions for each wetting cycle (WC) showed that this interactive effect was significantly affected by time, as it was only found to be significant in the first wetting cycle (Figure 2 and Figure 3). This was related to the fact that the effect of the aglime on CO2 emission rates was short-lived, as evident by the main effects only being significant within the first WC (data not shown). The total cumulative CO2 emissions over the 31 days, however, depicted the same trend that was observed in the first WC, with the increase in total CO2 emissions as a result of the aglime addition being 332 mg CO2-C kg−1 ODS (36.2%), 104 mg CO2-C kg−1 ODS (5.80%), and 373 mg CO2-C kg−1 ODS (40.9%) from the no-organic residue, poultry litter, and biochar amended soils, respectively (Figure 3).
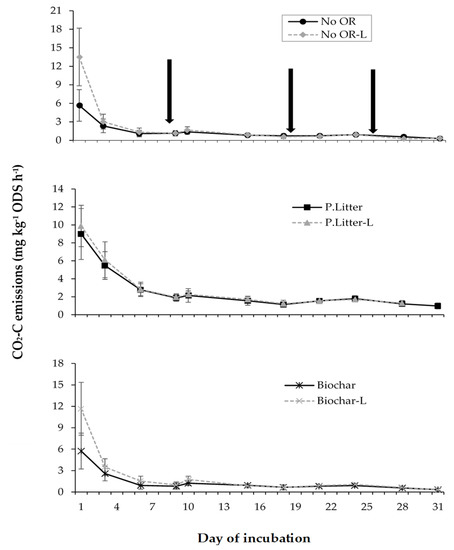
Figure 2.
The interactive effect of the organic residue (OR) and aglime (L) on CO2 emission rates. The least significant difference (LSD) (Time × Organic residue × Aglime, p < 0.05) is 3.61 mg CO2-C kg−1 ODS h−1. The error bars represent one standard error (SE) for the means of the samples for each treatment at specific times. The bars are hidden when they are smaller than the symbol. The arrows indicate the days on which soils were re-wetted.
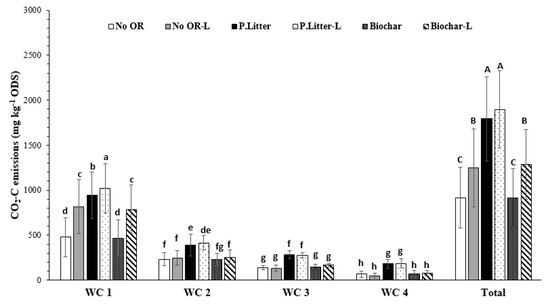
Figure 3.
The cumulative CO2 emissions for the individual wetting cycles (WCs) and over the entire study, as affected by the interaction between organic residues (ORs) and aglime (L). The error bars are standard errors. The least significant differences (LSDs) (0.05) for the WC × OR × Aglime and the OR × Aglime are 62.2 and 183 mg CO2-C kg−1 ODS, respectively. The different lowercase letters denote significant (p < 0.05) differences between the WC × OR × Aglime means, while the different uppercase letters denote significant differences between the OR × Aglime means.
These results suggest that the aglime-CO2 emissions were reduced when poultry litter was applied, which may be attributed to enhanced sequestration of aglime-C [10,11]. This is plausible since the enhanced microbial respiration (as indicated by a 70.4% to 82.7% greater release in cumulative CO2 emissions from the poultry litter treatments compared to the control and biochar treatments, respectively) would have increased the partial pressure of CO2 in the soil pores, leading to the increased dissolution of CO2 in the soil water and the formation of H2CO3 [41,42]. This process can thus enhance the dissolution of aglime [10,11] and, since there was only a 5.8% increase in the CO2 emissions with liming, it is strong evidence for the sequestration theory. In keeping with this mechanism, the higher proportion of labile C in the poultry litter compared to the biochar meant that it would have stimulated microbial activity more [14,17] and could explain why the sequestration may not have been as pronounced with the biochar.
Notwithstanding, the aglime solubilization could have also been decelerated in the poultry litter amended soils, given that the pH was as much as 1.27 units greater in these treatments compared to the others. This is also a plausible mechanism through which the aglime CO2 emissions may be reduced by organic residue addition, which has been proposed by Ahmad et al. [8] but not tested. This study is quite novel in the context of the role of organic residues in regulating the effects of aglime on CO2 emissions in soils; however, further studies utilizing 13C tracer technology would be needed to confirm the theories proposed here.
3.1.3. Ammonium-Aglime Effects
The hypothesis that the effect of liming on CO2 emissions is regulated by the addition of ammonium was not supported by the results of this study. In fact, the cumulative CO2 emissions from the limed ammonium-amended and limed no-ammonium control were similar, at 1460 and 1494 mg CO2-C kg−1 ODS, respectively, over the 31 day incubation period, despite there being evidence of nitrification-induced acidification in the ammonium-amended soils (Figure 4a). In addition to the observed effects on the soil pH, an interesting effect was observed whereby ammonium addition reduced the moisture loss in the soils between wetting, allowing these soils to retain more of the added water that could then contribute to aglime dissolution. While increasing the soil moisture has been shown to favor carbonate solubilization [6,43], it was not observed in this study.
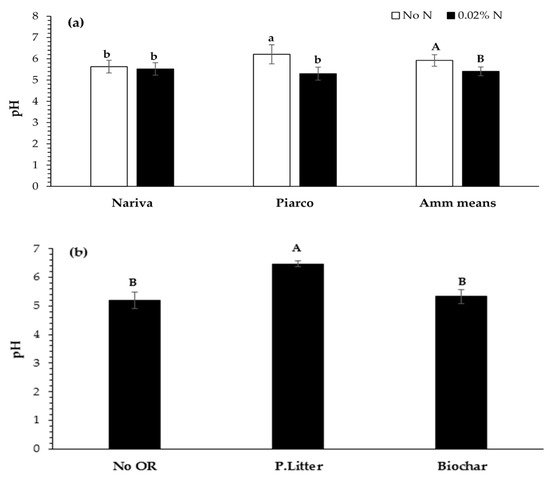
Figure 4.
The soil pH after 31 days, as affected by (a) the interaction between the soil and the ammonium (amm) and the main effect of the ammonium. The least significant differences (LSDs) (0.05) for the interaction and the main effect means are 0.514 and 0.364 units, respectively; and (b) the main effect of the organic residue (OR) on the soil pH. The LSD (0.05) is 0.445 units. The error bars are standard errors. The different lowercase letters denote significant (p < 0.05) differences between the interaction means, while the different uppercase letters denote significant differences between the main effect means.
In agreement with our study, the results of a field study and complementary laboratory studies by Biasi et al. [5] utilizing 13C tracer technology also showed that aglime-CO2 emissions were not significantly affected by the application of N fertilizer, but no explanation for this observation was provided. Perhaps these results can be explained by the low rate at which N was applied, in comparison to the aglime rate in these studies (i.e. at a ratio of 1:10 in this study and 1:45 in the Biasi et al. studies) [5]. These N:aglime ratios may have been too low to drive the pathway where aglime is dissolved by strong acids, as two moles of strong acids (such as HNO3) are required to dissolve every mole of the aglime present. Future experiments investigating the role of ammonium in aglime dissolution should, therefore, consider an N rate that is close to the rate at which the aglime is applied.
In addition to this explanation, it is also possible that the addition of ammonium fertilizer may play a greater role in regulating inorganic CO2 emissions from calcareous soils than from strongly to moderately acidic soils where strong acids are already present. This is a reasonable hypothesis since some studies [28,43] have reported an increase in inorganic CO2 emissions from calcareous soils with increased soil acidification. It is also worth noting that the study by Hamilton et al. [10], which provides evidence that may support the importance of ammonium in regulating CO2 emissions from aglime in acid soils, did not actually measure the CO2 emissions [10]. Therefore, more studies looking at the direct effects of the addition of ammonium to soils on the aglime-CO2 emissions are needed, which should also include calcareous soils.
3.2. Soil Properties
3.2.1. Soil Electrical Conductivity (EC)
A significant interaction between the organic residue and soil type was evident in this study, which showed that, while the addition of poultry litter increased the EC of both soils, the increase observed for the Piarco soil was almost twice that for the Nariva (Table 2). This was possibly because of a relatively low initial EC in the Piarco soil in comparison to the Nariva, in addition to a greater potential for ion adsorption in the Nariva soil (Table 1). On the other hand, biochar application significantly increased the EC of the Nariva soil (by 0.16 dS m−1) but decreased that of the Piarco soil (by 0.12 dS m−1), although not significantly. This may be due to the biochar having a more substantial effect of increasing the ion adsorption capacity of the Piarco soil, which is expected with low cation-exchange capacity (CEC) soils, thereby reducing the free ion concentration in that soil compared to the other [44,45,46]. The main effect of the organic residue was also significant and followed the order of poultry litter > biochar = control (data not shown), demonstrating the dominant influence of the initial EC of the applied organic residue on the soil EC.
Table 2.
The soil electrical conductivity (EC) after 31 days, as affected by various interactions and main effects.
The soil EC at the end of the experiment was also significantly affected by the interaction between the soil type and ammonium (Table 2). The increase in the soil EC, following the application of ammonium to the Piarco soil, was 0.954 dS m−1 (98.8%), as opposed to 0.62 dS m−1 (42.8%) in the Nariva soil. This higher magnitude of increase in the Piarco soil is again due to its lower buffering capacity compared to the Nariva soil (Table 1). Moreover, N mineralization in the Nariva soil was much greater than in the Piarco soil (Table 3), which could further mask the effect of the ammonium on the soil EC in comparison to the no-ammonium control. Overall, the ammonium means were 1.99 and 1.21 dS m−1 with and without ammonium, respectively (Table 2).
Table 3.
The soil ammonium (amm) and nitrate concentrations after 31 days, as affected by the various interactions and main effects.
Contrasting effects on the soil EC were observed when the aglime was applied to the soils used in this study. The soil EC significantly declined (by 0.17 dS m−1 or 9.24%) when aglime was applied to the Nariva soil but increased (by 0.24 dS m−1 or 18.2%) when aglime was applied to the Piarco soil (Table 2). This decline observed for the Nariva soil may be due to greater assimilation of ions being released from the aglime dissolution by soil microorganisms compared to the Piarco soil. Furthermore, an increase in pH due to liming could have resulted in the deprotonation of the pH-dependent charge sites, which would have consequently increased the capacity for cation adsorption in the Nariva soil due to its greater organic matter content compared to the Piarco soil [47,48]. Overall, the EC of the Nariva soil was significantly higher (by 0.36 dS m−1) than that of the Piarco soil.
3.2.2. Soil pH
The pH of soils often declines following the application of ammonium, as protons are released when this compound is nitrified [49]. The application of ammonium to the Nariva and Piarco soils in this study resulted in a 0.11 and 0.91 unit decrease in their pH, respectively, although the decline in the former was not statistically significant (Figure 4a). The available N data in Table 3 strongly suggest that nitrification was greater in the Piarco soil, which would have enhanced the acidification in that soil relative to the other soil. In addition, the pH of soils with high buffering capacities, like Nariva, have been shown to be less sensitive to nitrification-induced acidification compared to those with low buffering capacities [49]. The main effect of the addition of ammonium was the significantly reduced soil pH by an average of 0.6 units.
As expected, the aglime application significantly increased the soil pH (by an average across the two soils of 0.687 units); however, no significant interactions were observed between the aglime and other factors. The soil pH was also significantly affected by the main effect of the organic residue, with the poultry litter addition significantly increasing the soil pH by 1.27 units in relation to the no-organic residue control, while the biochar had no effect (5.33 vs. 5.3 pH units, respectively; Figure 4b). Previous studies have shown that organic residues can affect the soil pH [17,50,51,52], with the nature and magnitude of this effect being highly dependent on factors such as the nature of the residue and the soil to which it is applied [19,52]. The poultry litter used in this study had a calcium carbonate content of 9.2%, which could explain the marked increased in the soil pH with this amendment. It is not unusual for poultry litter to have such an appreciable calcium carbonate content since limestone is commonly applied to the broiler feed for bulking and calcium nutrition improvement [53]. However, its potential as a liming material is limited by its high EC.
3.2.3. Available Nitrogen in the Soil
The sound management of nitrogen (N) in tropical soils is crucial, given that much of this element can become unavailable [34]. In the tropics, organic residues can serve as an important alternative N source to conventional fertilizers. In this study, the application of ammonium fertilizer (at a rate of 200 mg N kg−1 ODS) significantly increased the concentration of NH4+ by 153 and 69.4 mg kg −1 ODS in the Nariva and Piarco soils, respectively (Table 3), with the relative increase being much greater for the Piarco soil, at 342%. Overall, the concentration of NH4+ in the Nariva soil was seven times higher than that in the Piarco soil at the end of the incubation (Table 3). This suggests that more N was mineralized in the Nariva soil, given that its organic N content was around five times greater than that of the Piarco soil.
The effects of the organic residues on NH4+ levels also contrasted for each soil. While the biochar did not significantly affect the soil NH4+ at the end of the experiment (which is corroborated by Belfon [17], who utilized similar hardwood biochars), poultry litter addition significantly increased the concentration of NH4+ in the Nariva soil by 163 mg kg−1 ODS (47.7%) but decreased it by 40.7 mg kg−1 ODS (52.7%) in the Piarco soil (Table 3). This increase in the Nariva soil is due to the high initial NH4+ concentration of this amendment (Table 1) and the fact that more NH4+ can be supplied when organic N is mineralized [54,55]. However, most of this poultry litter derived-NH4+ seems to have been nitrified in the Piarco soil, which is reflected by the poultry litter treatments having the lowest concentration of NH4+ but the highest concentration of NO3− (Table 3). This high rate of nitrification can be attributed to more favorable pH conditions being created for this process in the poultry litter treatments. It is noteworthy that the low buffering capacity (CEC) of the Piarco soil in relation to the Nariva soil would have facilitated a faster and more sustained increase in pH with poultry litter addition. In addition, the significant increase in the NO3− concentration in the Piarco soil with the aglime addition, as opposed to the Nariva soil (Table 3), provided further evidence of the enhanced nitrification in this soil with an increasing pH.
3.2.4. Soil Moisture Content
The capacity of a soil to retain moisture is affected by factors such as the soil texture, structure, and organic matter (OM) content [3]. The effect of these factors was evident in this experiment, as the moisture content (expressed as a percentage of the WHC) in the clayey, high OM Nariva soil was significantly higher than that of the sandy, low OM Piarco soil (Table 4). A more interesting observation, however, was that significantly more moisture was retained when ammonium was applied, especially to the Piarco soil (Table 4). This effect was also time-sensitive, as Table 4 shows that it was significantly affected by the WCs, with the effect becoming negligible in the Nariva soil by WC3 and even increasing slightly by WC4. In addition, a significant interaction between the ammonium and aglime was observed, whereby the increase in moisture retention with ammonium addition was more significant when the soils were not limed (Table 5). The main effect of the aglime was also significant (Table 5).
Table 4.
The soil moisture content for the individual wetting cycles (WCs) and across all of the WCs, as affected by the interaction between the soil and ammonium (amm).
Table 5.
The soil moisture content, as affected by the interaction between the ammonium and aglime and the main effect of the aglime.
The following theories are proposed in relation to the effect of the ammonium and aglime increasing the retention of the soil water: (1) The application of the ammonium could have resulted in the breakdown of soil aggregates [56], which would have, in turn, caused the sealing of the soil surface [57] and would, as such, reduce the evaporative loss of the water; and (2) Both the ammonium fertilizer and aglime are salts that, upon dissolution, would have increased the soil EC, thereby decreasing the osmotic potential of the soil water and reducing the evaporative loss [58]. The second hypothesis is perhaps more plausible, given that the reduction in the moisture loss was more pronounced in the Piarco soil, which seemed to be more sensitive to salt addition (Table 2); however, further research is needed for confirmation. It is also important to note that these results are probably more applicable to a greenhouse setting, where excessive N fertilization may occur [49], than under field conditions.
4. Conclusions
The application of aglime increased the quantity of CO2 emitted from the soils used in this study. This increase was minimal, however, when poultry litter was applied, which suggests that the aglime CO2 emissions were reduced in soils that received this amendment. Further studies utilizing 13C to trace the aglime emissions are necessary to elucidate this effect. There is also the need for further investigation into the conditions under which aglime CO2 emissions are regulated by ammonium addition since this amendment was not seen to regulate the effects of aglime on CO2 emissions in this study, although the soil acidification was enhanced with its application. It is possible that the rate of fertilizer used in this study was too low to significantly enhance the release of aglime CO2 emissions, in which case, a higher rate of fertilizer (perhaps one that is similar to the rate of the aglime applied) should be considered in future studies.
This study also showed that poultry litter can increase the pH of acid soils to an extent that is comparable to aglime, but no interactive effects were observed on the soil pH when these amendments were applied in combination. The high EC of the litter, however, limits its potential to be used as a liming agent. This is especially a concern for low-activity soils, such as the Piarco series that was highly sensitive to the addition of salts supplied through organic residues, aglime, and fertilizer. In addition, as poultry litter is also able to supply an appreciable quantity of inorganic N, which was evident in this study, there is the possibility that it may have an acidifying effect in the long-term when this N is nitrified. Biochar, on the other hand, had no effect on the available N in this study and the effects of this amendment on the other soil properties tested in this experiment were little to none, which suggests that hardwood biochar may not be an effective amendment for improving soil fertility in the short-term.
Author Contributions
Conceptualization, D.E.B. and G.A.G.; Data curation, D.E.B. and G.A.G.; Investigation, D.E.B. and G.A.G.; Methodology, D.E.B. and G.A.G.; Supervision, G.A.G. and R.R.; Writing—original draft, D.E.B.; Writing—review and editing, D.E.B., G.A.G. and R.R.
Funding
This research received no external funding.
Acknowledgments
The authors would like to thank Deneil Lara and Akil St. Clair of the Soil Science Unit in the Department of Food Production, The UWI, for assisting with some of the soil analyses. We are also grateful to the two anonymous referees for their helpful suggestions.
Conflicts of Interest
The authors declare no conflict of interest.
References
- Bian, M.; Zhou, M.; Sun, D.; Li, C. Molecular approaches unravel the mechanism of acid soil tolerance in plants. Crop J. 2013, 1, 91–104. [Google Scholar] [CrossRef]
- von Uexküll, H.R.; Mutert, E. Global extent, development and economic impact of acid soils. Plant Soil 1995, 171, 1–15. [Google Scholar] [CrossRef]
- Brady, N.C.; Weil, R.R. The Nature and Properties of Soils, 14th ed.; Pearson Prentice Hall: Upper Saddle River, NJ, USA, 2008. [Google Scholar]
- da Costa, C.H.M.; Crusciol, C.A.C.; Neto, J.F.; Castro, G.S.A. Residual effects of superficial liming on tropical soil under no-tillage system. Pesq. Agropec. Bras. 2016, 51, 1633–1642. [Google Scholar] [CrossRef]
- Biasi, C.; Lind, S.E.; Pekkarinen, N.M.; Huttunen, J.T.; Shurpali, N.J.; Hyvönen, N.P.; Repo, M.E.; Martikainen, P.J. Direct experimental evidence for the contribution of lime to CO2 release from managed peat soil. Soil Biol. Biochem. 2008, 40, 2660–2669. [Google Scholar] [CrossRef]
- Dumale, W.A., Jr.; Miyazaki, T.; Hirai, K.; Nishimura, T. SOC Turnover and lime-CO2 evolution during liming of an acid Andisol and Ultisol. Open J. Soil Sci. 2011, 1, 49–53. [Google Scholar] [CrossRef]
- Ahmad, W.; Singh, B.; Dijkstra, F.A.; Dalal, R.C. Inorganic and organic carbon dynamics in a limed acid soil are mediated by plants. Soil Biol. Biochem. 2013, 57, 549–555. [Google Scholar] [CrossRef]
- Ahmad, W.; Singh, B.; Dijkstra, F.A.; Dalal, R.C.; Geelan-Small, P. Temperature sensitivity and carbon release in an acidic soil amended with lime and mulch. Geoderma 2014, 214, 168–176. [Google Scholar] [CrossRef]
- IPCC. 2006 IPCC guidelines for national greenhouse gas inventories. In The National Greenhouse Gas Inventories Programme; Eggleston, S., Buendia, L., Miwa, K., Ngara, T., Tanabe, K., Eds.; Institute for Global Environmental Strategies: Hayama, Japan, 2006. [Google Scholar]
- Hamilton, S.K.; Kurzman, A.L.; Arango, C.; Jin, L.; Robertson, G.P. Evidence for carbon sequestration by agricultural liming. Glob. Biogeochem. Cycles 2007, 21, GB2021. [Google Scholar] [CrossRef]
- West, T.O.; McBride, A.C. The contribution of agricultural lime to carbon dioxide emissions in the United States: Dissolution, transport, and net emissions. Agric. Ecosyst. Environ. 2005, 108, 145–154. [Google Scholar] [CrossRef]
- Semhi, K.; Suchet, P.M.; Clauer, N.; Probst, J. Impact of nitrogen fertilizers on the natural weathering-erosion processes and fluvial transport in the Garonne basin. Appl. Geochem. 2000, 15, 865–878. [Google Scholar] [CrossRef]
- Khalil, M.I.; Hossain, M.B.; Schmidhalter, U. Carbon and nitrogen mineralization in different upland soils of the subtropics treated with organic materials. Soil Biol. Biochem. 2005, 37, 1507–1518. [Google Scholar] [CrossRef]
- Hossain, M.B.; Puteh, A.B. Emission of carbon dioxide influenced by different water levels from soil incubated organic residues. Sci. World J. 2013, 2013, 638582. [Google Scholar] [CrossRef] [PubMed]
- Carrington, E.M.; Hernes, P.J.; Dyda, R.Y.; Plante, A.F.; Six, J. Biochemical changes across a carbon saturation gradient: Lignin, cutin, and suberin decomposition and stabilization in fractionated carbon pools. Soil Biol. Biochem. 2012, 47, 179–190. [Google Scholar] [CrossRef]
- Schwendener, C.M.; Lehmann, J.; de Camargo, P.B.; Luizão, R.C.; Fernandes, E.C.M. Nitrogen transfer between high-and low-quality leaves on a nutrient-poor Oxisol determined by 15N enrichment. Soil Biol. Biochem. 2005, 37, 787–794. [Google Scholar] [CrossRef]
- Belfon, R. Sequestering Carbon and Improving Soil Fertility Using Organic Amendments. Ph.D. Thesis, The University of the West Indies, St. Augustine, Trinidad and Tobago, 2015. [Google Scholar]
- Tillman, D.; Fargione, J.; Wolff, B.; D’Antonio, C.; Dobson, A.; Howarth, R.; Schindler, D.; Schlesinger, W.H.; Simberloff, D.; Swackhamer, D. Forecasting agriculturally driven global environmental change. Science 2001, 292, 281–284. [Google Scholar] [CrossRef] [PubMed]
- Brown, C.B.; Bally, G.S. Land Capability of Trinidad and Tobago. Volume 3: Soils of Northern Trinidad; Government Printery: Port-of-Spain, Trinidad and Tobago, 1966.
- Brown, C.B.; Bally, G.S. Land Capability of Trinidad and Tobago. Volume 5: Soils of Southern Trinidad; Government Printery: Port-of-Spain, Trinidad and Tobago, 1968.
- Brown, C.B.; Bally, G.S. Land Capability of Trinidad and Tobago. Volume 4: Soils of Central Trinidad; Government Printery: Port-of-Spain, Trinidad and Tobago, 1970.
- McLean, E.O. Soil pH and lime requirement. In Methods of Soil Analysis. Part 2. Chemical and Microbiological Properties; Page, A.L., Miller, R.H., Keeney, D.R., Eds.; Soil Science Society of America, Inc.: Madison, WI, USA, 1982; pp. 199–223. [Google Scholar]
- Rhoades, J.D. Soluble salts. In Methods of Soil Analysis. Part 2. Chemical and Microbiological Properties; Page, A.L., Miller, R.H., Keeney, D.R., Eds.; Soil Science Society of America, Inc.: Madison, WI, USA, 1982; pp. 167–178. [Google Scholar]
- Hardy, F.; Lewis, A.H. A rapid electrometric method for measuring “lime requirements” of soils. J. Agri. Sci. 1929, 19, 17–25. [Google Scholar] [CrossRef]
- Gee, G.W.; Or, D. Particle-size analysis. In Methods of Soil Analysis. Part 4. Physical Methods; Dane, J.H., Topp, G.C., Eds.; Soil Science Society of America, Inc.: Madison, WI, USA, 2002; pp. 255–293. [Google Scholar]
- Rhoades, J.D. Cation exchange capacity. In Methods of Soil Analysis. Part 2. Chemical and Microbiological Properties; Page, A.L., Miller, R.H., Keeney, D.R., Eds.; Soil Science Society of America, Inc.: Madison, WI, USA, 1982; pp. 149–157. [Google Scholar]
- Maynard, D.G.; Kalra, Y.P.; Crumbaugh, J.A. Nitrate and exchangeable ammonium nitrogen. In Soil Sampling and Methods of Analysis, 2nd ed.; Carter, M.R., Gregorich, E.G., Eds.; CRC Press: Boca Raton, FL, USA, 2008; pp. 181–196. [Google Scholar]
- Tamir, G.; Shenker, M.; Heller, H.; Bloom, P.R.; Fine, P.; Bar-Tal, A. Organic N mineralization and transformations in soils treated with animal waste in relation to carbonate dissolution and precipitation. Geoderma 2013, 209, 50–56. [Google Scholar] [CrossRef]
- Nelson, D.W.; Sommers, L.E. Total carbon, organic carbon, and organic matter. In Methods of Soil Analysis. Part 2. Chemical and Microbiological Properties; Page, A.L., Miller, R.H., Keeney, D.R., Eds.; Soil Science Society of America, Inc.: Madison, WI, USA, 1982; pp. 539–577. [Google Scholar]
- Bremner, J.M.; Mulvaney, C.S. Nitrogen—Total. In Methods of Soil Analysis. Part 2. Chemical and Microbiological Properties; Page, A.L., Miller, R.H., Keeney, D.R., Eds.; Soil Science Society of America, Inc.: Madison, WI, USA, 1982; pp. 595–624. [Google Scholar]
- Harris, D.; Horwáth, W.R.; van Kessel, C. Acid fumigation of soils to remove carbonates prior to total organic carbon or carbon-13 isotopic analysis. Soil Sci. Soc. Am. J. 2001, 65, 1853–1856. [Google Scholar] [CrossRef]
- Burford, J.R.; Bremner, J.M. Gas chromatographic determination of carbon dioxide evolved from soils in closed systems. Soil Biol. Biochem. 1972, 4, 191–197. [Google Scholar] [CrossRef]
- Nelson, R.E. Carbonate and gypsum. In Methods of Soil Analysis. Part 2. Chemical and Microbiological Properties; Page, A.L., Miller, R.H., Keeney, D.R., Eds.; Soil Science Society of America, Inc.: Madison, WI, USA, 1982; pp. 181–196. [Google Scholar]
- Gouveia, G.A.; Eudoxie, G.D. Distribution of fertiliser N among fixed ammonium fractions as affected by moisture and fertiliser source and rate. Biol. Fertil. Soils 2007, 44, 9–18. [Google Scholar] [CrossRef]
- Belfon, R.; Bekele, I.; Eudoxie, G.; Voroney, P.; Gouveia, G. Sequestering carbon and improving soil fertility; validation of an improved method for estimating CO2 flux. Geoderma 2014, 235, 323–328. [Google Scholar] [CrossRef]
- Anderson, J.P.E. Soil Respiration. In Methods of Soil Analysis. Part 2. Chemical and Microbiological Properties; Page, A.L., Miller, R.H., Keeney, D.R., Eds.; Soil Science Society of America, Inc.: Madison, WI, USA, 1982; pp. 831–871. [Google Scholar]
- Stotzky, G. Microbial Respiration. Methods of Soil Analysis. Part 2. Chemical and Microbiological Properties; Black, C.A., Evans, D.D., White, J.L., Eds.; American Society of Agronomy: Madison, WI, USA, 1965; pp. 1550–1572. [Google Scholar]
- Grover, S.P.; Butterly, C.R.; Wang, X.; Tang, C. The short-term effects of liming on organic carbon mineralisation in two acidic soils as affected by different rates and application depths of lime. Biol. Fert. Soils 2017, 53, 431–443. [Google Scholar] [CrossRef]
- Keller, J.K.; Bridgham, S.D.; Chapin, C.T.; Iversen, C.M. Limited effects of six years of fertilization on carbon mineralization dynamics in a Minnesota fen. Soil Biol. Biochem. 2005, 37, 1197–1204. [Google Scholar] [CrossRef]
- Miyazawa, M.; Takahashi, T.; Sato, T.; Kanno, H.; Nanzyo, M. Factors controlling accumulation and decomposition of organic carbon in humus horizons of Andosols. Biol. Fertil. Soils 2013, 49, 929–938. [Google Scholar] [CrossRef]
- Karberg, N.J.; Pregitzer, K.S.; King, J.S.; Friend, A.L.; Wood, J.R. Soil carbon dioxide partial pressure and dissolved inorganic carbonate chemistry under elevated carbon dioxide and ozone. Oecologia 2005, 142, 296–306. [Google Scholar] [CrossRef] [PubMed]
- Ramnarine, R.; Wagner-Riddle, C.; Dunfield, K.E.; Voroney, R.P. Contributions of carbonates to soil CO2 emissions. Can. J. Soil Sci. 2012, 92, 599–607. [Google Scholar] [CrossRef]
- Lardner, T.; George, S.; Tibbett, M. Interacting controls on innate sources of CO2 efflux from a calcareous arid zone soil under experimental acidification and wetting. J. Arid Environ. 2015, 122, 117–123. [Google Scholar] [CrossRef]
- Mukherjee, A.; Zimmerman, A.R.; Hamdan, R.; Cooper, W.T. Physicochemical changes in pyrogenic organic matter (biochar) after 15 months of field aging. Solid Earth 2014, 5, 693–704. [Google Scholar] [CrossRef]
- Clough, T.J.; Condron, L.M.; Kammann, C.; Müller, C. A review of biochar and soil nitrogen dynamics. Agronomy 2013, 3, 275–293. [Google Scholar] [CrossRef]
- Yao, Y.; Gao, B.; Zhang, M.; Inyang, M.; Zimmerman, A.R. Effect of biochar amendment on sorption and leaching of nitrate, ammonium, and phosphate in a sandy soil. Chemosphere 2012, 89, 1467–1471. [Google Scholar] [CrossRef]
- Edmeades, D.C. Effects of lime on effective cation exchange capacity and exchangeable cations on a range of New Zealand soils. N. Z. J. Agric. Res. 1982, 25, 27–33. [Google Scholar] [CrossRef]
- Buni, A. Effects of liming acidic soils on improving soil properties and yield of haricot bean. J. Environ. Anal. Toxicol. 2014, 5, 248. [Google Scholar]
- Han, J.; Shi, J.; Zeng, L.; Xu, J.; Wu, L. Effects of nitrogen fertilization on the acidity and salinity of greenhouse soils. Environ. Sci. Pollut. Res. 2015, 22, 2976–2986. [Google Scholar] [CrossRef] [PubMed]
- Omari, R.A.; Bellingrath-Kimura, D.S.; Fujii, Y.; Sarkodee-Addo, E.; Sarpong, K.A.; Oikawa, Y. Nitrogen Mineralization and Microbial Biomass Dynamics in Different Tropical Soils Amended with Contrasting Organic Resources. Soil Syst. 2018, 2, 63. [Google Scholar] [CrossRef]
- Judge, A. The Effects of Surface-Applied Poultry Manure on Top-and Subsoil Acidity and Selected Soil Fertility Characteristics. Master’s Thesis, University of Natal, Pietermaritzburg, South Africa, 2001. [Google Scholar]
- Li, Z.; Wei, B.; Wang, X.; Zhang, Y.; Zhang, A. Response of soil organic carbon fractions and CO2 emissions to exogenous composted manure and calcium carbonate. J. Soils Sediments 2018, 18, 1832–1843. [Google Scholar] [CrossRef]
- Manangi, M.R.; Coon, C.N. The effect of calcium carbonate particle size and solubility on the utilization of phosphorus from phytase for broilers. Int. J. Pollut. Sci. 2007, 6, 85–90. [Google Scholar]
- Tamir, G.; Shenker, M.; Heller, H.; Bloom, P.R.; Fine, P.; Bar-Tal, A. Can soil carbonate dissolution lead to overestimation of soil respiration? Soil Sci. Soc. Am. J. 2011, 75, 1414–1422. [Google Scholar] [CrossRef]
- Rothrock, M.J.; Cook, K.L.; Warren, J.G.; Eiteman, M.A.; Sistani, K. Microbial mineralization of organic nitrogen forms in poultry litters. J. Environ. Qual. 2010, 39, 1848–1857. [Google Scholar] [CrossRef]
- Haynes, R.J.; Naidu, R. Influence of lime, fertilizer and manure applications on soil organic matter content and soil physical conditions: A review. Nutr. Cycl. Agroecosyst. 1998, 51, 123–137. [Google Scholar] [CrossRef]
- Sajjadi, S.A.; Mahmoodabadi, M. Aggregate breakdown and surface seal development influenced by rain intensity, slope gradient and soil particle size. Solid Earth 2015, 6, 311–321. [Google Scholar] [CrossRef]
- Tedeschi, A.; Zong, L.; Huang, C.; Vitale, L.; Volpe, M.; Xue, X. Effect of salinity on growth parameters, soil water potential and ion composition in Cucumis melo cv. Huanghemi in north-western China. J. Agron. Crop Sci. 2017, 203, 41–55. [Google Scholar] [CrossRef]
© 2019 by the authors. Licensee MDPI, Basel, Switzerland. This article is an open access article distributed under the terms and conditions of the Creative Commons Attribution (CC BY) license (http://creativecommons.org/licenses/by/4.0/).