Article

Summertime Soil-Atmosphere Ammonia Exchange in the Colorado Rocky Mountain Front Range Pine Forest

Department of Chemistry, University of Toronto, 80 St. George Street, Toronto, ON M5S 3H6, Canada
*
Author to whom correspondence should be addressed.
Soil Syst. 2019, 3(1), 15; https://doi.org/10.3390/soilsystems3010015
Submission received: 1 December 2018 / Revised: 6 February 2019 / Accepted: 11 February 2019 / Published: 14 February 2019
(This article belongs to the Special Issue Formation and Fluxes of Soil Trace Gases)

Abstract

:
Understanding the NH3 exchange between forest ecosystems and the atmosphere is important due to its role in the nitrogen cycle. However, NH3 exchange is dynamic and difficult to measure. The goal of this study was to characterize this exchange by measuring the atmosphere, soil, and vegetation. Compensation point modeling was used to evaluate the direction and magnitude of surface-atmosphere exchange. Measurements were performed at the Manitou Experimental Forest Observatory (MEFO) site in the Colorado Front Range by continuous online monitoring of gas and particle phase NH3-NH4+ with an ambient ion monitoring system coupled with ion chromatographs (AIM-IC), direct measurements of [NH4+] and pH in soil extracts to determine ground emission potential (Γg), and measurements of [NH4+]bulk in pine needles to derive leaf emission potential (Γst). Two different soil types were measured multiple times throughout the study, in which Γg ranged from 5 to 2122. Γst values ranged from 29 to 54. Inferred fluxes (Fg) from each soil type predicted intervals of emission and deposition. By accounting for the total [NH4+] pool in each compartment, the lifetime of NH3 with respect to the surface-atmosphere exchange in the soil is on the order of years compared to much faster naturally occurring processes, i.e., mineralization and nitrification.

1. Introduction

Atmospheric ammonia (NH3) plays an important role in the global nitrogen cycle [1,2,3]. A large portion of NH3 sources are directly linked to human activities, such as agriculture [4], transportation [5,6,7], and industry [8]. NH3 is also the main neutralizing agent for atmospheric trace acidic gases, such as HCl, HNO3, or H2SO4, so it can also be found in particulate form (NH4+), allowing it to travel long distances. As a result, the lifetime of NHx, the sum of gas phase NH3 and particle phase NH4+, can range from several hours to several days before being removed from the atmosphere by dry or wet deposition [9]. In contrast, the fate and mobility of NHx (dissolved NH3 + NH4+) found in soils is dictated by soil type, moisture content, and local microbiota. NH4+ can be chemically fixed to clay minerals and organic matter, physically sorbed to colloids, or dissolved in soil pore water [10]. Soil NHx can also undergo nitrification as part of the natural N cycling occurring within the soil leading to the production of NO2 and NO3, as shown in Scheme 1.
The local soil biota also dictates the mineralization and immobilization processes that control the fate of NHx. The coupling of these two contrasting systems, the soil and the atmosphere, results in a dynamic exchange of NH3 involving many different drivers.
Due to their N sensitivity, forest ecosystems are generally believed to be a sink for NH3, which has led to a large body of research focusing on what are the critical loads for these systems [11,12,13]. However, the exchange of NH3 in forested regions has been shown to be dependent on the atmospheric concentrations. There are many factors controlling the movement of NH3 through the forest ecosystem making it difficult to assess to what degree is the forest a source or sink of NH3. Langford and Fehsenfeld found the direction of atmosphere-ecosystem exchange of NH3 in Roosevelt National Forest in Northern Colorado could be positive (emission) or negative (deposition) depending on the direction of the prevailing wind. The study location was on the boundary between a natural forest ecosystem that is NH3-poor and regions with heavy anthropogenic activities, namely urban and agricultural centers. They observed the NH3-rich air masses from anthropogenic activity centers were being depleted and NH3-poor air from the nearby forest were gaining NH3 as the air passed through the forested site [14]. The NH3 concentration of the air mass entering the forest seemed to dictate the forest ecosystem exchange. The correlation they observed with air temperature led to the assumption the plant canopy was solely responsible for increased NH3 concentrations in the NH3-poor air. More than two decades later, a study examined the soil contribution of NH3 emissions to the atmosphere within the Colorado Front Range [15]. Based on chamber measurements of extracted soil cores, Stratton et al. reported an average emission flux of 0.21 ± 0.03 mg NH3–N m−2 d−1. However, this was derived from temperature-dependent NH3 flux modeling, not direct forest measurements.
Understanding the magnitude and direction of NH3 exchange is critical in assessing its environmental impact. Subalpine mountain ecosystems in particular, such as the Colorado Front Range, are vulnerable to slight increases in additional N input, 3–5 kg N ha−1 y−1 [11,16]. A critical review of the effect of N input into the Colorado Rocky Mountains and southern Wyoming reported eutrophication and acidification of surface water, soil, and lake with only an additional input of 1.5–3 kg N ha−1 y−1, causing a measured decrease in diatom population and biodiversity of the surrounding forest [17].
Exchange of NH3 between the soil and the atmosphere is still subject to large uncertainties due to difficulty in direct flux measurements and an incomplete understanding of the biological processes occurring in the soil. As a result, the magnitude, and even sign, of net NH3 exchange are challenging to predict. Many reports, including Stratton et al., use compensation point (χ) modeling to predict the magnitude and direction of NH3 exchange (i.e., flux) [15,18,19,20,21,22,23]. Due to the technical and instrumental demands of measuring fluxes directly (i.e., through eddy covariance), compensation point modeling offers an affordable alternative to infer fluxes.
NH3 fluxes between the soil (Fg) and atmosphere can be inferred based on the concentration difference in compensation point of the ground surface (χg) and atmospheric NH3 and accounting for the physical limitation to exchange between the surface and the air within the canopy, represented by a transfer velocity (vtr), shown by Equation (1):
Fg = vtr ∙ (χ − [NH3]).
The transfer velocity characterizes the transport between the ground surface and height of the atmospheric NH3 measurement. Its parameterization is described in detailed in Section 2.1 in the Supplementary Materials, where NH3 in Equation (1) is denoted as the NH3 concentration at the canopy top (χz0+d), representing the transport of NH3 over the vertical extent of the pine forest canopy.
Compensation point modeling provides a framework for estimating NH3 exchange between a surface reservoir and the atmosphere. The compensation point χ represents the atmospheric NH3 concentration in equilibrium with the ammonium content of the surface reservoir at the surface-atmosphere interface. The relationship between the compensation point is governed by the Henry’s law constant of neutral NH3 (KH), and the acid dissociation constant of NH4+ (Ka). This relationship at the interface between a surface pool and the atmosphere can be described as
χ = Ka∙[NH4+]
   KH∙[H+],
where χ is the surface compensation point as a function of soil NH4+ and H+ concentrations, and the equilibrium constants KH and Ka. Both equilibrium constants (KH and Ka) are strongly temperature dependent, making temperature an important driver for scaling χ. When accounting for the temperature dependence of the equilibrium constants, Equation (2) can be rewritten using the van ‘t Hoff equation:
χ = 13587 ∙ Γ ∙ exp(−10396/T),
where T is surface temperature in Kelvin, the emission potential (Γ) is a unitless value equal to [NH4+(aq)] (mol kg−1) divided by the pH-derived [H+] (mol kg−1), and χ is in units of atm [21,24]. Using the local temperature and pressure conditions, and the molecular mass of NH3, the compensation point can be converted from a partial pressure to an air concentration in units of µg m−3. Assuming the atmosphere tends toward equilibrium with the surface reservoir, the deviation of ambient concentrations of NH3 from χ above a surface determines the direction of the net exchange, flux, that would occur to restore equilibrium. For example, mixing ratios in the ambient atmosphere larger than the calculated compensation point lead to net deposition.
In most current bi-directional exchange models, Γ is treated as a static value [25,26,27]. The Γ is independent of meteorological conditions and represents the potential of a surface to emit NH3 based on what proportion of NHx is not protonated, which is governed by the surface acidity, i.e., [H+]. The ground layer emission potential is typically determined by the soil, but in some cases can also be influenced by the litter layer, particularly during periods of heavy leaf fall [26]. An extensive model review by Zhang et al. has shown that values of Γg (ground emission potential) of unfertilized areas generally fall within 20–1000, with the majority of the data reported for grasslands where the soils are largely homogeneous across the landscape [20]. This review reported only a single emission potential measurement for forest soil and the value of Γg = 20 was interpreted as having been impacted by a nearby swine facility [28]. However, based on data reported in Stratton et al., the Γg for their extracted forest soil is an order of magnitude larger, 117 ± 49 (n = 7). This presents a wide range of possible Γg in the few reported ground layer emission potentials from forest soils. In addition, current studies have not distinguished between the variety of soil environments that exist within a forested region.
In representing ecosystem-atmosphere exchange of NH3 in forests, interactions with the forest canopy should also be considered. Bi-directional exchange with vegetation can also be expressed in terms of a compensation point [29,30,31,32]. Measuring the available NH3 for exchange with the atmosphere from plants is far more challenging compared to soil analysis. It is assumed NH3 deposition occurs onto the leaf surfaces (cuticles) and NH3 bi-directional exchange occurs through the stomata depending on the stomatal compensation point [29]. For the stomatal exchange pathway, the relevant emission potential (Γst) is determined by the [NH4+] content found in the apoplastic fluid within the leaf membrane. A direct measurement of this emission potential requires selective extraction of the apoplastic fluid from inside the vegetation. As a result of this technical challenge, other methods have been developed to characterize the emission potential of vegetation, such as the bulk method proposed by Massad et al., which relates the Γst to the [NH4+] measured in bulk leaf samples [18]:
Γst = 19.3 exp(0.0506∙[NH4+]bulk),
where the [NH4+]bulk is the ammonium concentration in full leaf extracts in µg g−1 of leaf tissue.
The goal of this study was to characterize the ammonia content of the atmosphere, soil and dominant vegetation, Ponderosa pine, to evaluate the direction and magnitude of atmosphere-ecosystem exchange. Measurements were performed at the Manitou Experimental Forest Observatory (MEFO) site in the Colorado Front Range by continuous online monitoring of gas and particle phase NH3-NH4+ with an ambient ion monitoring system coupled with ion chromatographs (AIM-IC), direct measurements of [NH4+] and pH in soil extracts to determine Γg, and measurements of [NH4+]bulk in pine needles to derive Γst. We measured the soil multiple times during the study to evaluate whether the assumption of static values of Γg are reasonable. The values reported in this study can better inform inferential models in predicting atmosphere-ecosystem exchange of montane forests in summer conditions.

2. Materials and Methods

2.1. Site Description

The Manitou Experimental Forest Observatory (MEFO) lies in the Front Range of the Colorado Rocky Mountains in the South Platte River drainage (39.1006° N, 105.0942° W), representative of a mid-elevation (~2000–2500 m a.s.l.), semi-arid, Ponderosa pine ecosystem common in the Rocky Mountain West. The temperature ranged from 6 to 28 °C with 70% of its annual precipitation (396 mm) occurring between April and August. The site has been managed as a research facility under the USDA Forest Services Rocky Mountain Research Station since 1938, therefore, the site has been well protected and changes in the landscape have occurred naturally. It spans roughly 6760 ha of semi-arid montane forest ecosystems sitting ~80 km south of Denver and ~40 km northwest of Colorado Springs. The site straddles the watershed of Trout Creek, a tributary of the South Platte River.
The forest surrounding the field site is an open canopy filled with uneven aged trees ranging from 27 to 201 years old, dominated by Ponderosa pine and containing some Douglas fir, oak, spruce and aspen. The average canopy height is 16 m with reported leaf area index (LAI) of 3.0 [33]. During the campaign period (26 July to 19 August 2015), areas with no tree coverage and direct sunlight showed understory development of sage brush, wild grass and thistle, particularly in August. The cryptogrammic soil is exposed in places with no vegetation and classified as deep, well-drained sandy loams and sandy gravelly loams originating from alluvial deposits weathered from the arkosic sandstone and granite formations [34]. Previous soil studies measured a soil pH range between 5.4 to 7.8, organic matter content of 1-4%, and a 50 to 150 mm h−1 permeability with an average 1.3 m root depth [33].
The MEFO field site consists of a combination of two distinct soil environments. The open canopy is characterized as an area where significant sunlight reaches the forest floor resulting in a well-developed understory. In contrast, the dense canopy area contains mature pines and a thick plant litter layer mainly composed of fallen pine needles.
The site was also equipped with a chemistry/flux tower, maintained by National Center for Atmospheric Research (NCAR), measuring temperature, relative humidity and wind speed at various heights within (1.8 m, 7.0 m, and 14.1 m) and above the canopy (27.8 m), above canopy global radiation, in-canopy particle size distribution, and soil moisture and temperature at 5, 20, 35, and 120 cm depths. Precipitation composition data was retrieved from the National Trends Network, in part of the National Atmospheric Deposition Program, site CO21, Manitou. The site has been collecting deposition data since 1978.

2.2. In-Canopy Trace Gas and Particle Composition Measurements

Water-soluble PM2.5 and trace gases were measured using an Ambient Ion Monitoring system (AIM 9000D, URG Corp, Chapel Hill, NC, USA) coupled with two Ion Chromatographs (Dionex ICS-2000, Thermo Fisher Scientific, Mississauga, ON, Canada). The AIM-IC inlet was positioned at ~5 m above the forest floor. A detailed description of the AIM-IC sampling system can be found in Markovic et al., 2012 [35]. In brief, ambient air was drawn at 3.0 L/min through a PM2.5 impactor allowing the bulk flow containing particles less than 2.5 µm to pass through a parallel plate denuder equipped with nylon membranes. A continuous flow of 2 mM H2O2 solution was fed into the parallel plate denuders to capture all water-soluble gases. Particles that pass through the denuder were then hygroscopically grown and collected in a particle condensation chamber. Flows containing the dissolved forms of the gas and particle analytes were collected over an hour in separate sample reservoirs. Concentrator columns were used to improve the detection limit of the overall system by trapping all analyte molecules prior to injection on the ion chromatographs. Samples were analyzed with suppressed conductivity detection and reagent-free eluent (methylsulfonic acid for cation separation and potassium hydroxide for anion separation). The ICs were calibrated using high-purity mixed standards (Thermo Fisher Scientific). Systematic background runs were conducted by overflowing the inlet using ultra-pure zero air (Praxair, Loveland, CO, USA). Using the measurements from background runs, the 3σ detection limits were determined to be 0.1, 0.002, 0.001, and 0.001 µg m−3 of NH3, HCl, HNO3, and SO2, respectively. The higher detection limit for NH3 is mainly the result of more variability in the signal during systematic background experiments.
Due to technical difficulties, anionic particulate components (pCl, pNO3, pSO4, and organics) were measured during the first half of the campaign, and acidic gases (HCl, SO2, and HNO3) measured during the latter half. Measurements of these compounds are presented in the Supplementary Materials.

2.3. Soil Measurements

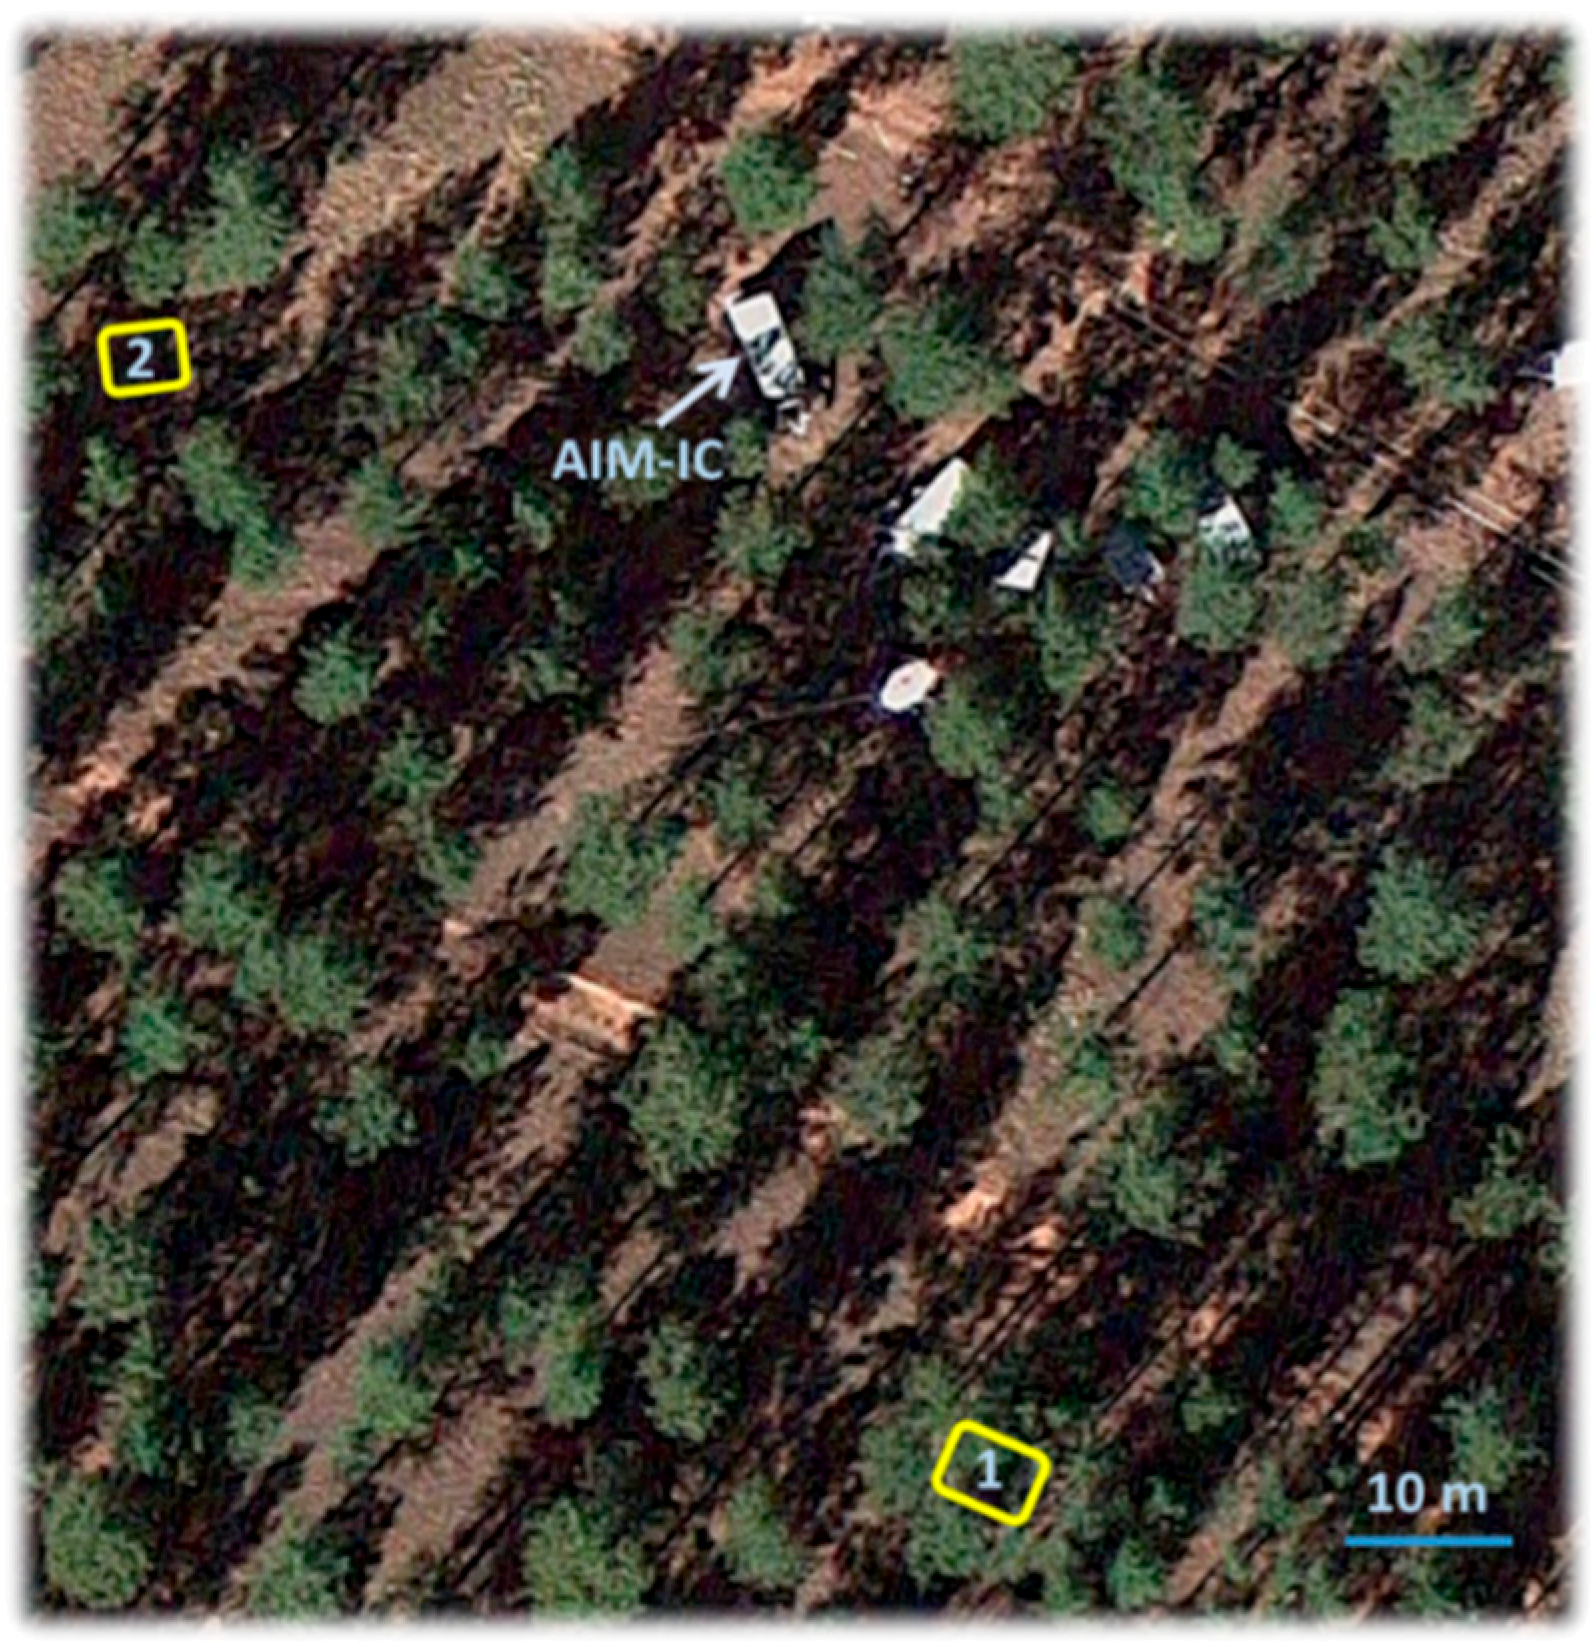
In order to fully characterize the soil-atmosphere exchange of NH3, it is necessary to investigate the dominating soil types. The field site consists of a combination of two distinct soil environments, open and dense canopy areas, in which both elements cover roughly 50% of the MEFO site. The open canopy is characterized as an area where significant sunlight reaches the forest floor resulting in a well-developed understory. In contrast, the dense canopy area contains mature pines and a thick plant litter layer mainly composed of fallen pine needles. Within a 70-m radius of the AIM-IC inlet, 5 m by 5 m sampling sites were demarcated, depicted in Figure 1, including the two predominant types of soil surfaces in contact with the atmosphere.
Site 1 (dense canopy) was in a small clearing between several mature pines with roughly a ~5 cm thick needle bed and no forest floor flora. Site 2 (open canopy) contained a mix of bare soil and understory, including sagebrush, wheatgrass, bluegrass, thistles, fleabane, and wild flowers. Beneath the surface, the soil profile characteristics between the two sampling sites showed marked differences. The open canopy plot, with its mature understory, supported a relatively shallow root system that dominated the top 5 cm, and patches of bare soil with no organic matter including needle litter. In contrast, the dense canopy contained root network of the surrounding pine reaching >1 m in depth.
Soil samples were collected on four dates between 31 July 2015 and 17 August 2015. Within each sampling site, vegetation was removed, and five randomly spaced soil cores were taken using a 5 cm diameter by 12 cm deep beveled soil corer in a 0.3 by 0.3 m plot. These plots were sampled once. Each sampling day involved a new plot within the sampling site. Only the top 5 cm of the soil core, excluding the litter layer, was taken for processing and analysis. Samples in the dense canopy plot had a consistent appearance over the top 5 cm, whereas in the open canopy plot, the surface soil was dark brown only 2–3 cm deep before reaching dry, brittle, densely-packed soil underneath.
The five soil cores from the same plot were immediately mixed and sieved with 2 mm coarse mesh to create a single batch sample. Three ~8 g subsamples were dispersed in 50 mL 0.25% KCl w/w solution and agitated for 30 min [24,36]. The suspensions were then filtered by gravity using ashless filters (Whatman Ltd., Maidstone, UK). Filtrates were filtered again using 0.2-µm PES membrane syringe filters (Pall Ion Chromatography Acrodisc®, VWR International, Mississauga, ON, Canada) to remove any fine particulates before analysis by IC. Water content was determined by comparing weight before and after drying 10 g of subsample overnight in a preheated oven set to 105 °C. Soil pH was measured by creating a 1:1 w/w slurry of soil and deionized water (DIW) and using a standard pH probe (SympHony 14002-782, VWR International).
Soil temperature measurements are necessary to calculate χg, as expressed in Equation (2). Soil temperature profiles (Campbell Scientific, Logan, UT, USA, model T107 thermistors) from 5, 20, 35, and 120 cm depths and soil moisture (Decagon Devices, Pullman, WA, USA, model EC-5) in the top 5 cm were provided from National Center for Atmospheric Research Atmospheric Chemistry Observations and Modeling (NCAR-ACOM): Manitou Experimental Forest Observatory Field Site. The temperature measured at 5 cm was used to calculate the χg of each plot, so any temperature difference related to the amount of direct sunlight and litter was not measured.

2.4. Ponderosa Pine Measurements

Pine needles were collected from the same mature Ponderosa pine tree (8.5 m tall) to avoid any variability found between different aged trees. To account for the different levels of sunlight exposure to different sections of the tree, needle samples were taken at three sampling heights (1, 3.6, and 7 m) and analyzed for bulk NH4+ content. Pine needle samples were collected in early morning, midday, and evening periods on 16 to 18 August. Collected pine needles were immediately frozen using liquid nitrogen, mixed with sand, and homogenized with mortar and pestle. Both the pine needle sample mass (~0.2 g) and the sand mass (~0.5 g) were determined before the homogenization step. The total mass after the homogenization was determined to account for any loss of pine needle material during the process. The sample mixture was dispersed in 1 mL of DIW in a 1.5-mL Eppendorf tube and centrifuged at 12,000 g for 15 min. Five hundred microliters of the supernatant were transferred to a 2-mL 0.45 μm polysulphone centrifuge filter tube (Micro VectraSpin, Whatman, VWR International), stabilized with 1 mL of citric acid solution and spun at 2000 g for 5 min. The filtrate was then directly analyzed by IC. The pine needle water content was determined gravimetrically by drying pine needle subsamples for 24 h at 105 °C.

2.5. Flux Calculations

The flux of NH3 between the soil and the atmosphere ( F g ) is governed by the soil compensation point ( χ g ), calculated using Equation (2), and the ambient NH3 concentration at the canopy top ( χ z 0 + d ), coupled by the transfer velocity ( v t r ):
F g = v t r ·   ( χ z 0 + d χ g ) .
The top of the canopy is defined as the sum of the roughness length ( z 0 ) and the zero-plane displacement height ( d ), which is applied for tall canopies such as forests. For z 0 a typical value of 2 m for forests was used, while d equals 2 / 3 ·   h c = 10.67 m with an average canopy height ( h c ) of 16 m. Due to the sparse forest canopy structure, we assumed that χ z 0 + d is equal to the concentration measured by the AIM-IC taken at ~5 m a.g.l.
In accordance with the two-layer compensation point model described by Nemitz et al. (2001), the stomatal flux ( F s ) is driven by the difference between the canopy compensation point ( χ c ) and the stomatal compensation point ( χ s ) (see Equation (2)) and calculated as follows:
F s = χ c χ s R s ,
where Rs is the stomatal resistance.
The deposition of NH3 to the pine needles’ cuticles ( F c u t ) was determined by the ratio of χ c and the cuticular resistance R c u t :
F c u t = χ c R c u t .
The derivations of v t r , χ c , R s , and R c u t are found in the detailed description of the compensation point resistance model in the Supplementary Materials.

3. Results

3.1. Atmospheric Trace Gas and PM2.5 Composition

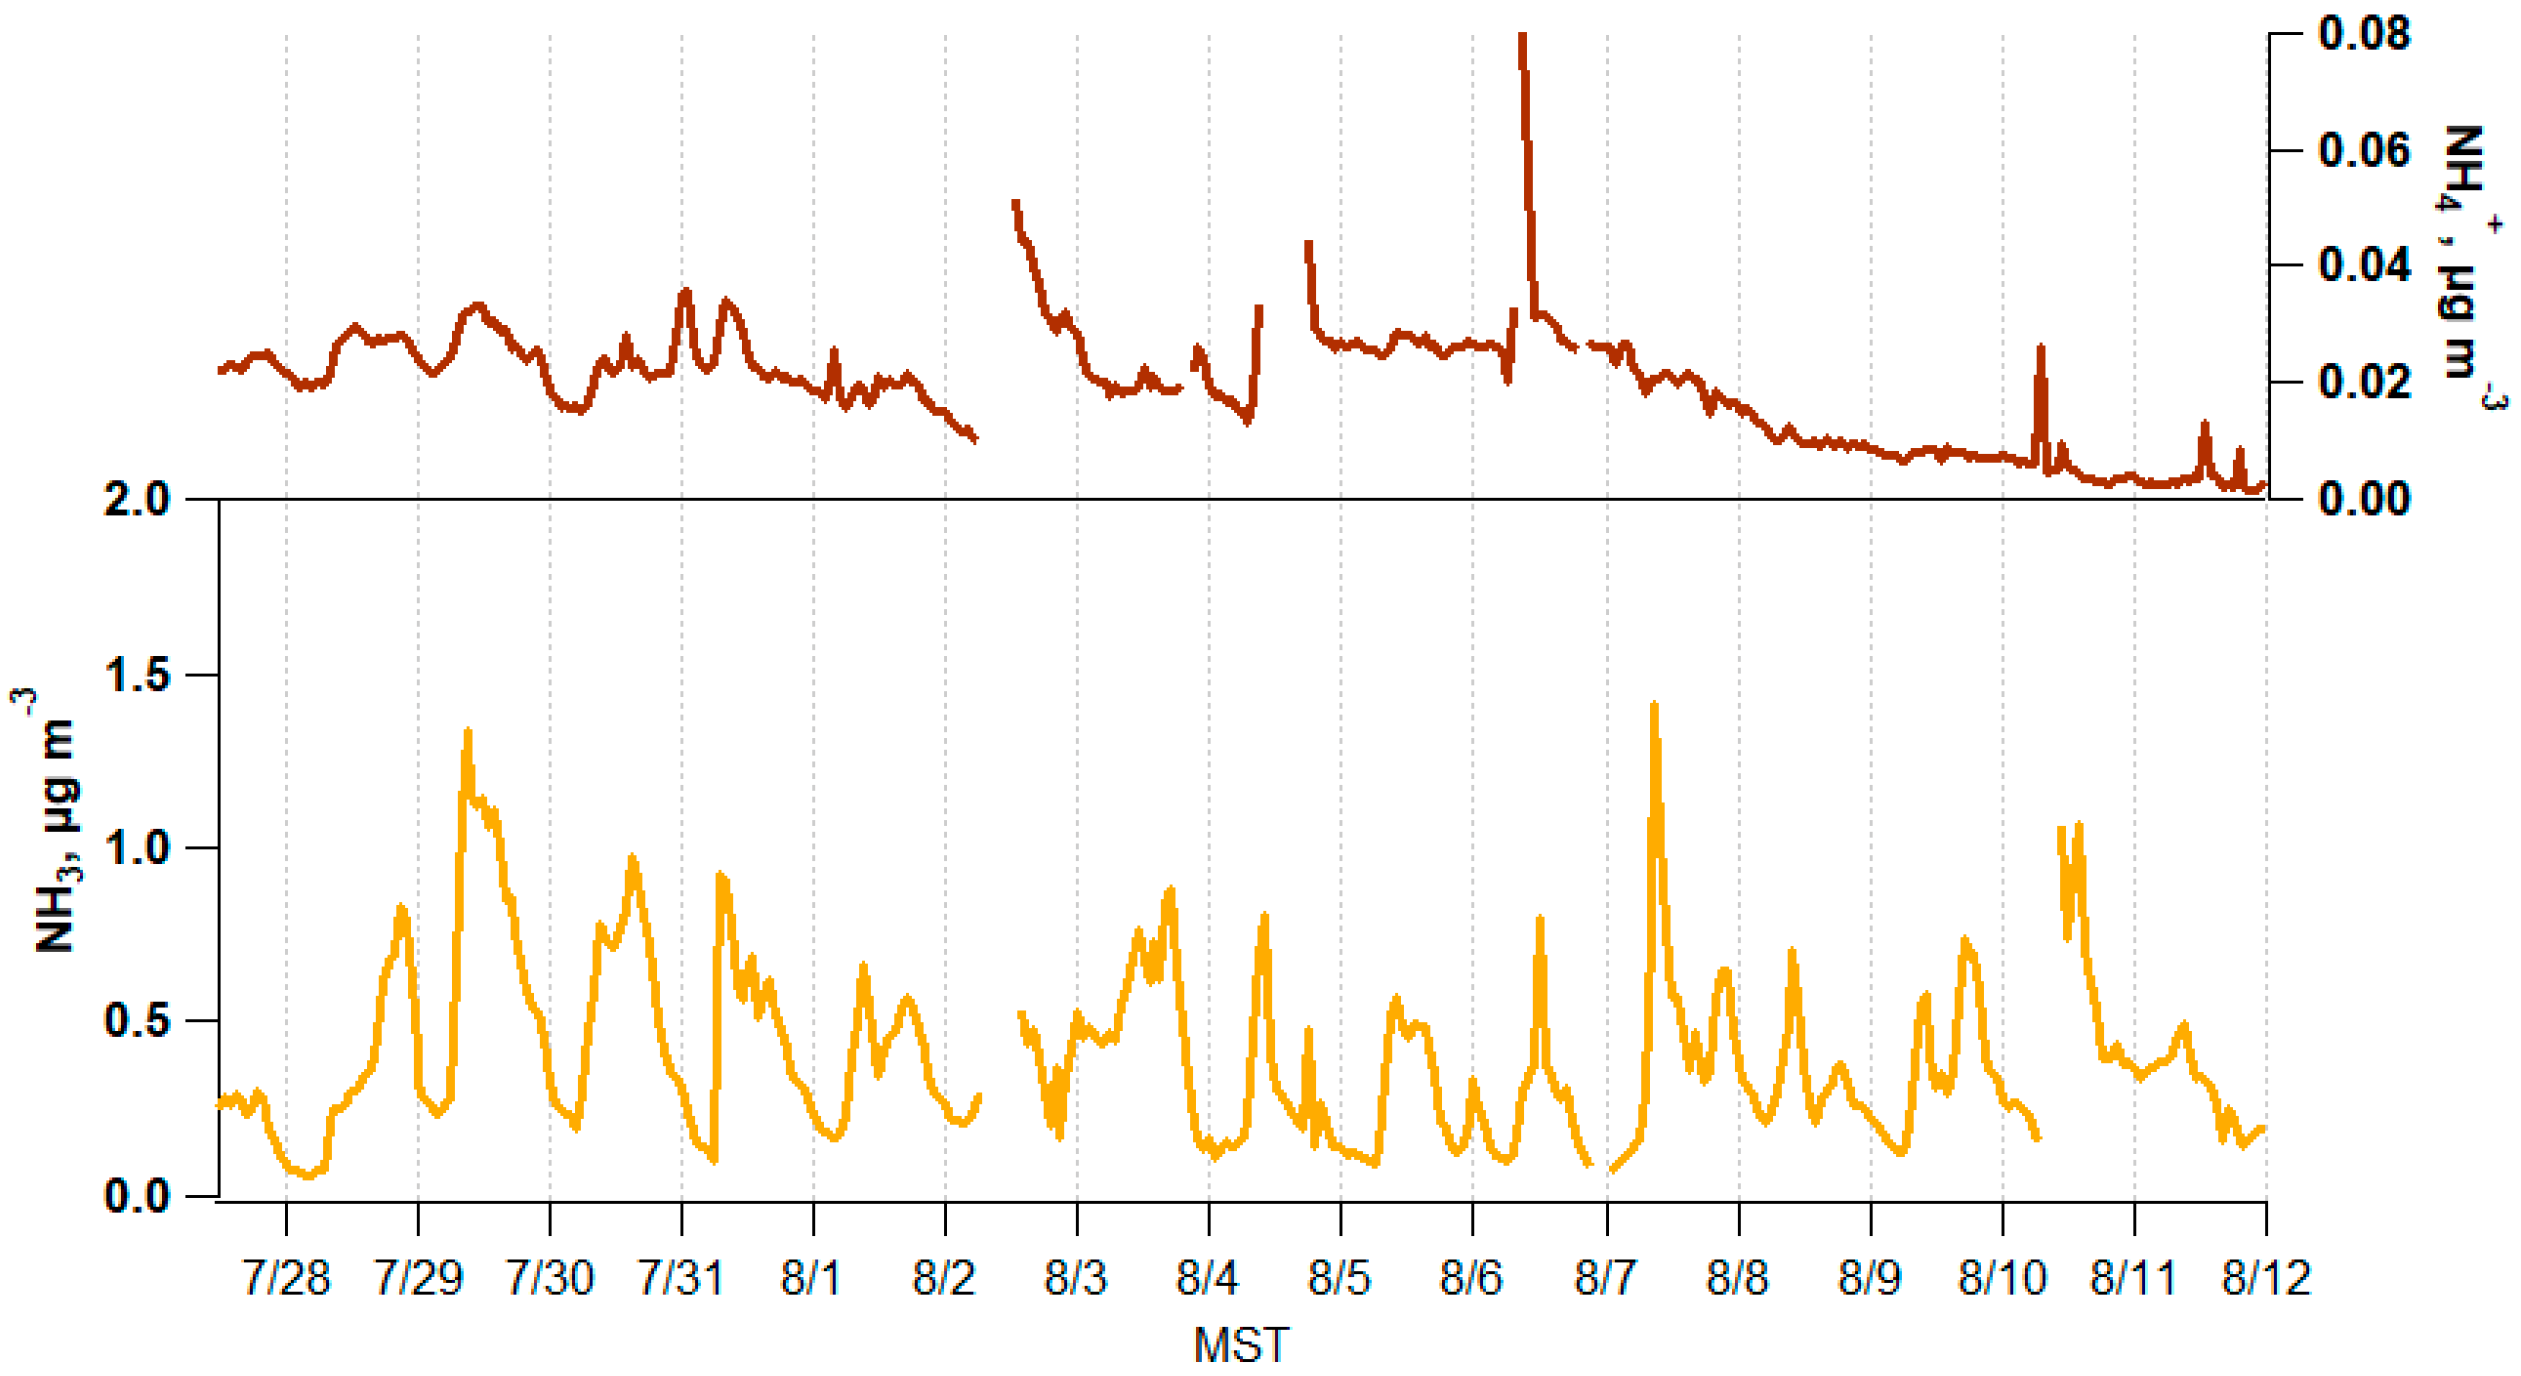
Atmospheric measurements made by the AIM-IC, depicted in Figure 2, show a consistent diurnal cycle of ambient NH3 concentrations reaching highs of ~0.5 to 1.5 µg m–3 during midday while dropping to below detection limit at night. Particulate NH4+ mass loadings were typically close to the detection limit, with a maximum at 0.08 µg m–3. The diurnal pattern of ambient NH3 concentrations observed by the AIM-IC shows no drastic increase in concentration associated with large emission events.
Overall low particle concentrations were confirmed with particle sizing data, provided by NCAR measuring a few meters away from the AIM-IC inlet. Average particle number concentrations were less than 2 × 103 cm–3, which is typical for rural continental environments. Acidic trace gas concentrations (Figure S1) are comparable to background concentrations seen in a summer montane forest [26,37]. Ambient concentrations of HCl and HNO3 were on average well below 0.4 μg m–3, and their concentrations appeared correlated. In contrast, SO2 was typically close to the detection limit with a few exceptions where events occurred causing spikes of 0.4 to 1 μg m–3 over a period of three hours. In general, the concentrations of acidic gases that react readily with NH3 were all less than 20% of the observed NH3 concentrations. The low concentrations of acidic gases and fine particulate NH4+ simplifies our interpretation of the behavior of gas phase NH3 because it indicates that gas-to-particle partitioning is not dominating its behavior.
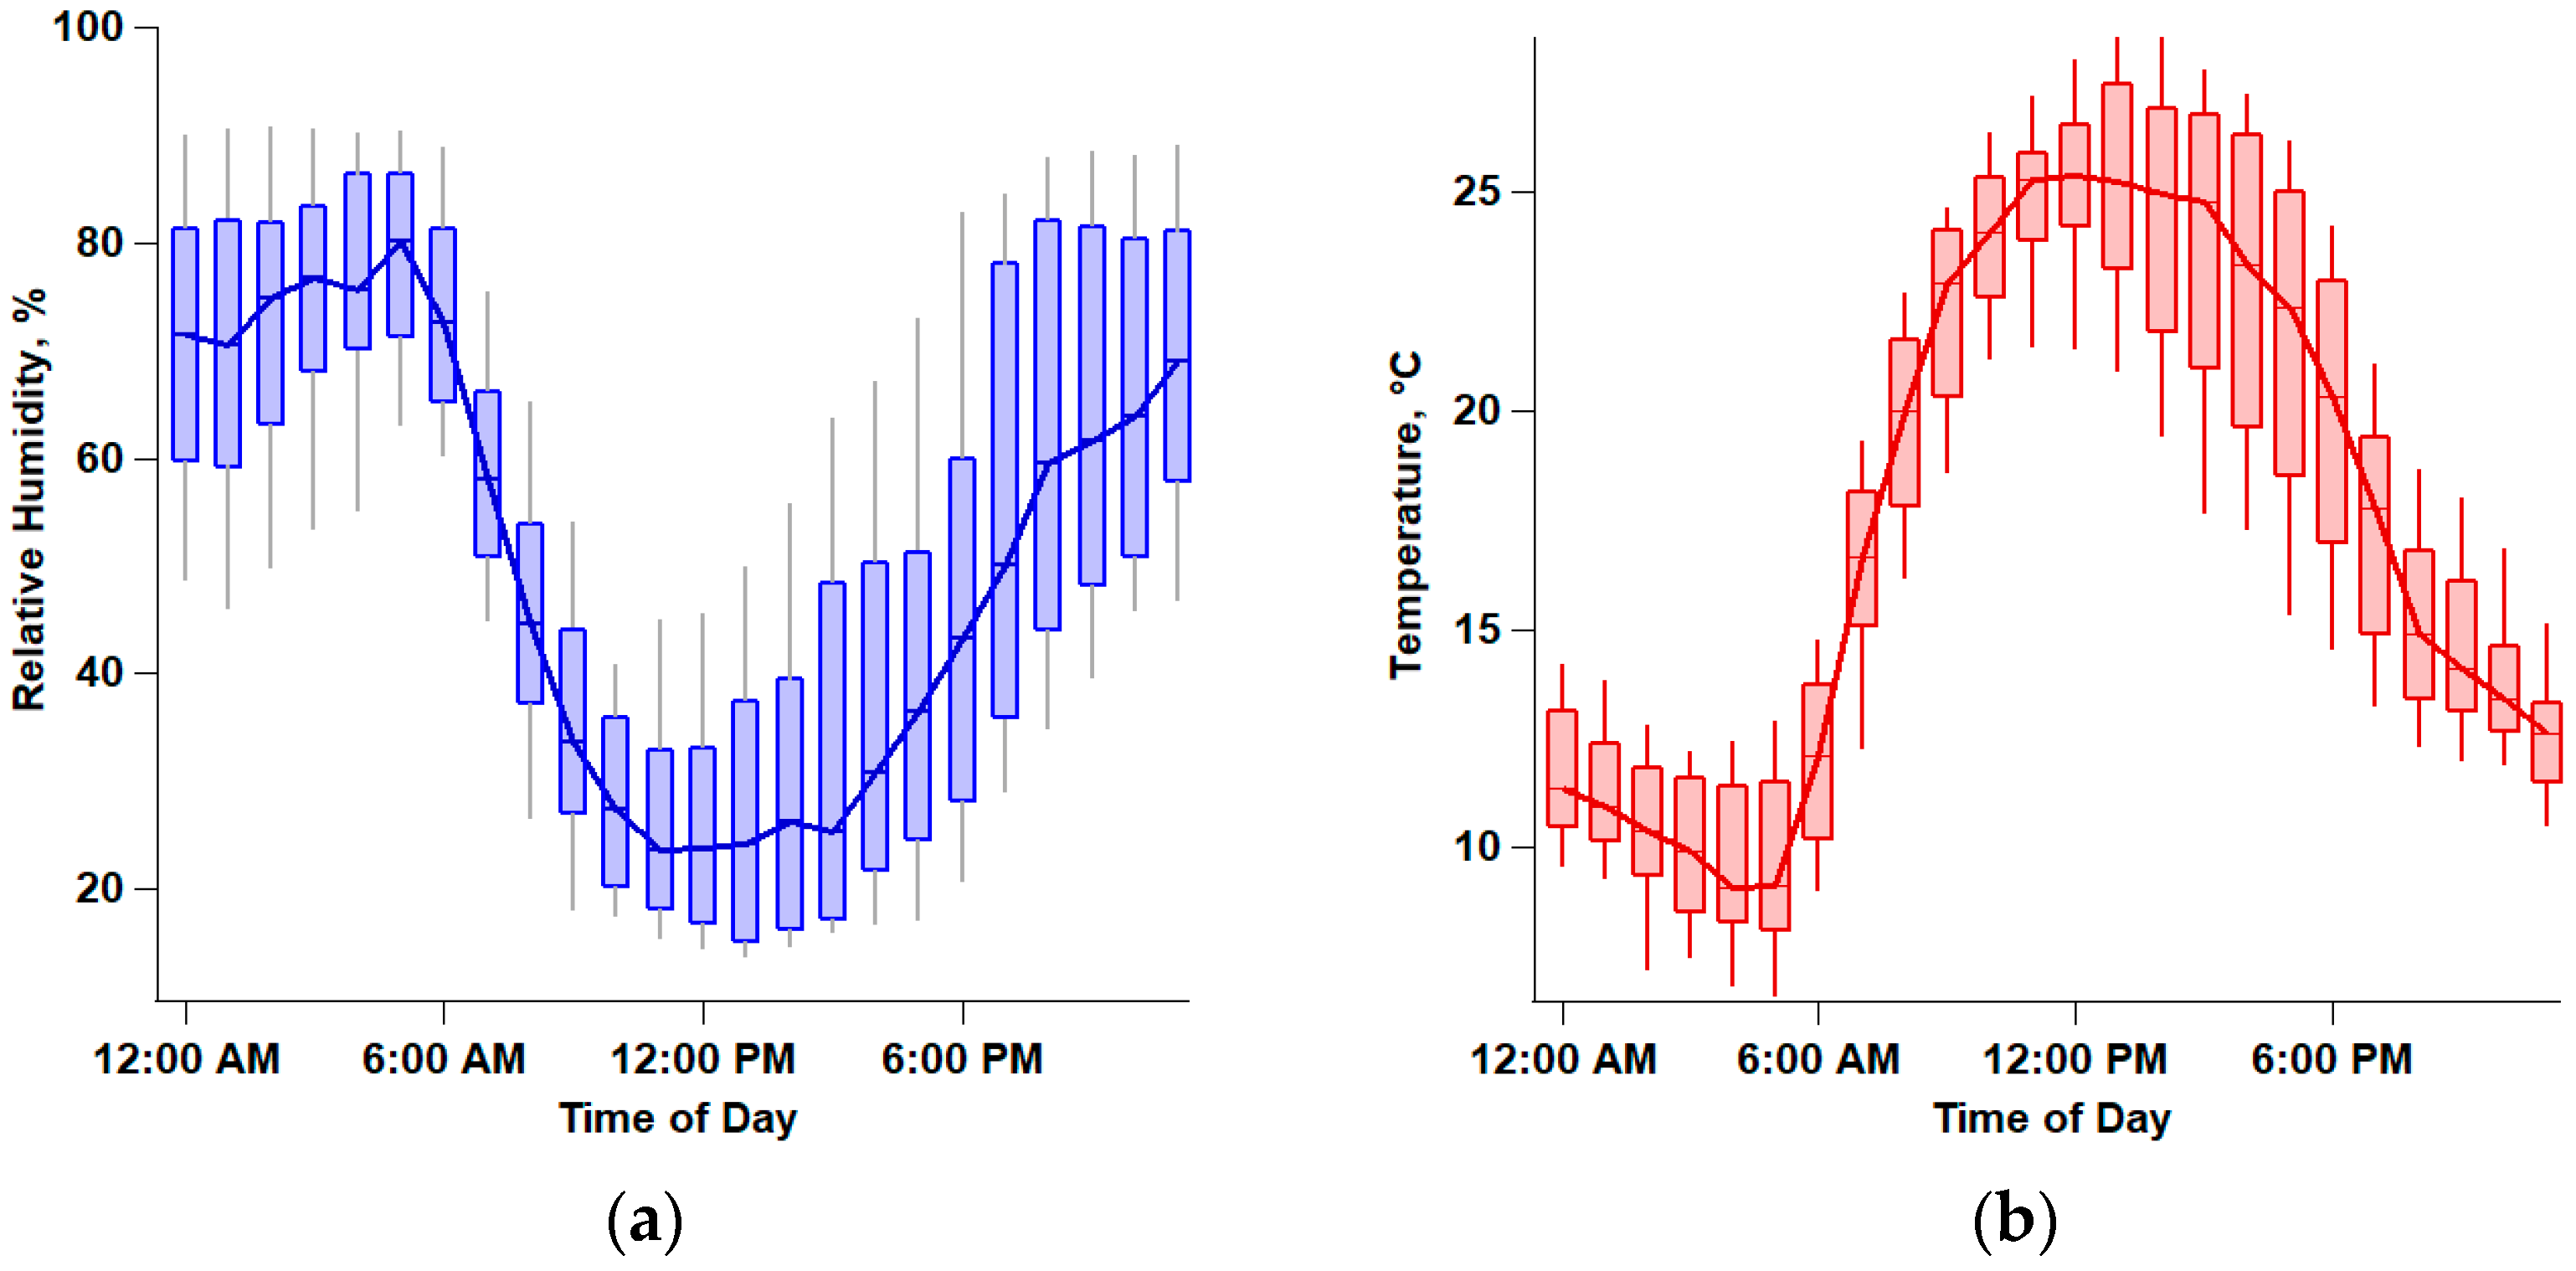
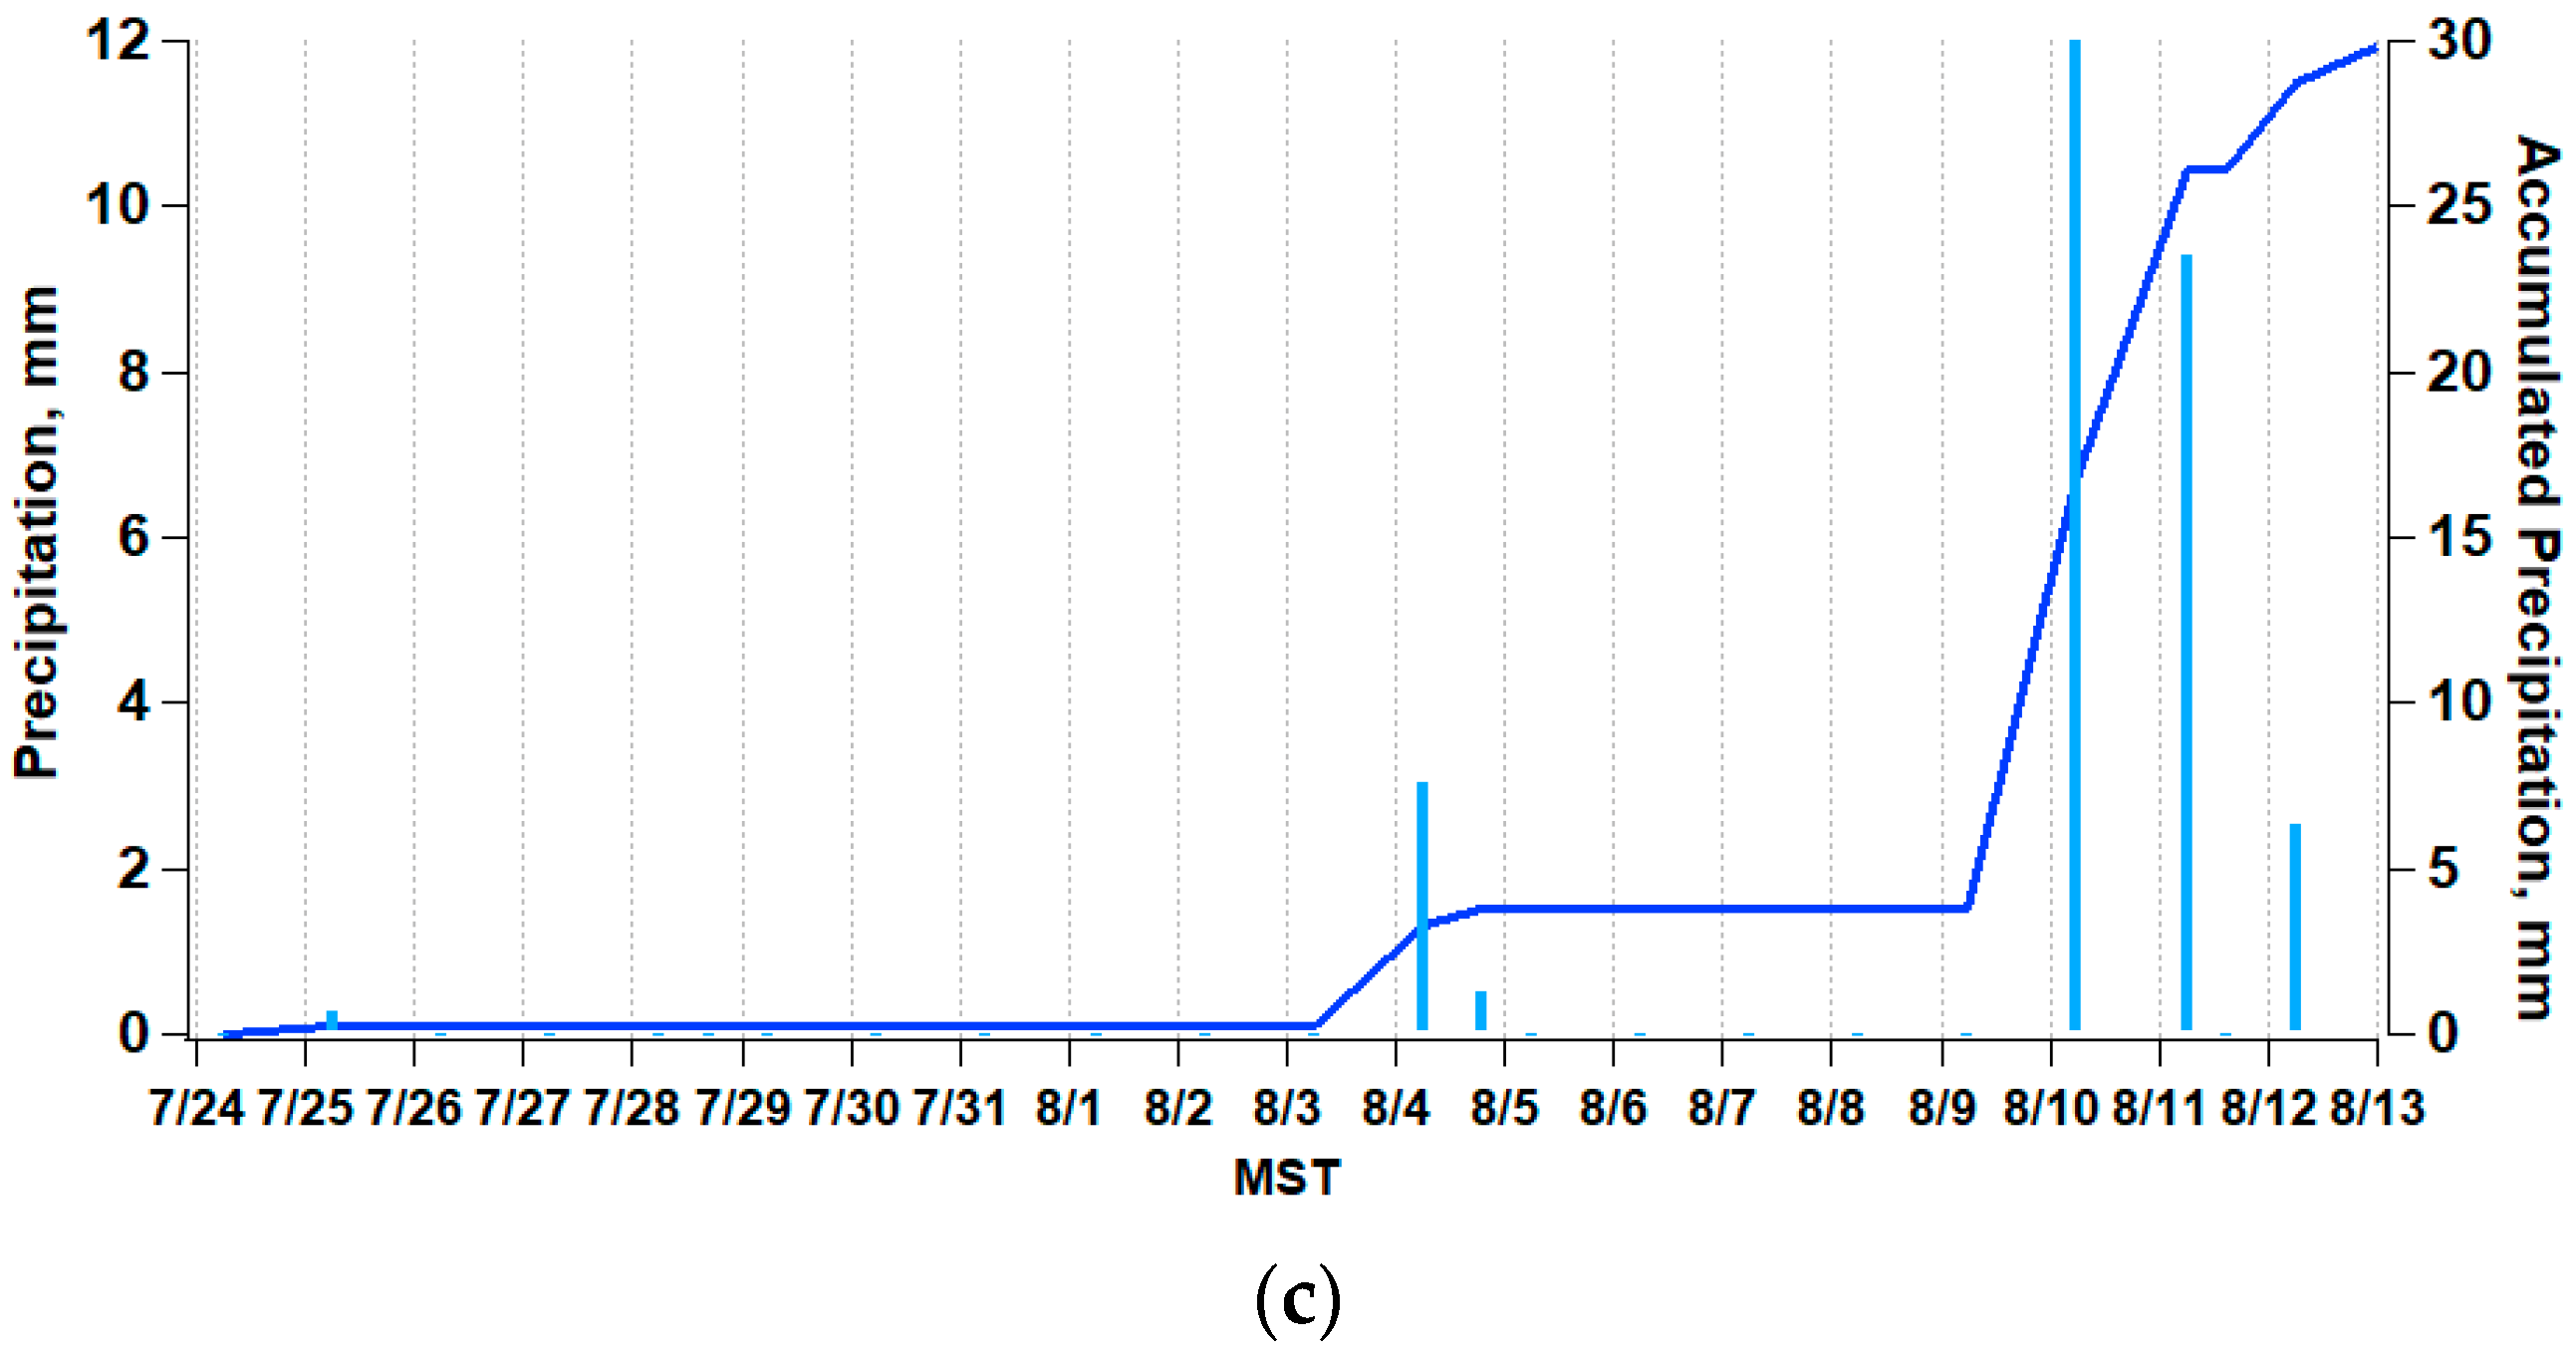
The average diurnal cycles of temperature and relative humidity shown in panels (a) and (b) in Figure 3, were typical of previous summers. However, precipitation occurred in the form of moderate showers, ranging from 2 to 6 mm per event. In typical years, precipitation more commonly occurs during heavy rain storms in the late afternoon. The difference in rainfall patterns may influence the removal rate of trace gases and particles from the atmosphere and input into the forest ecosystem.
With only a few periods of heavy thunderstorms, occurring later in August, the majority of the measurement period captured atmospheric concentrations and soil emission potentials during warm and dry conditions.

3.2. Physiochemical Soil Properties

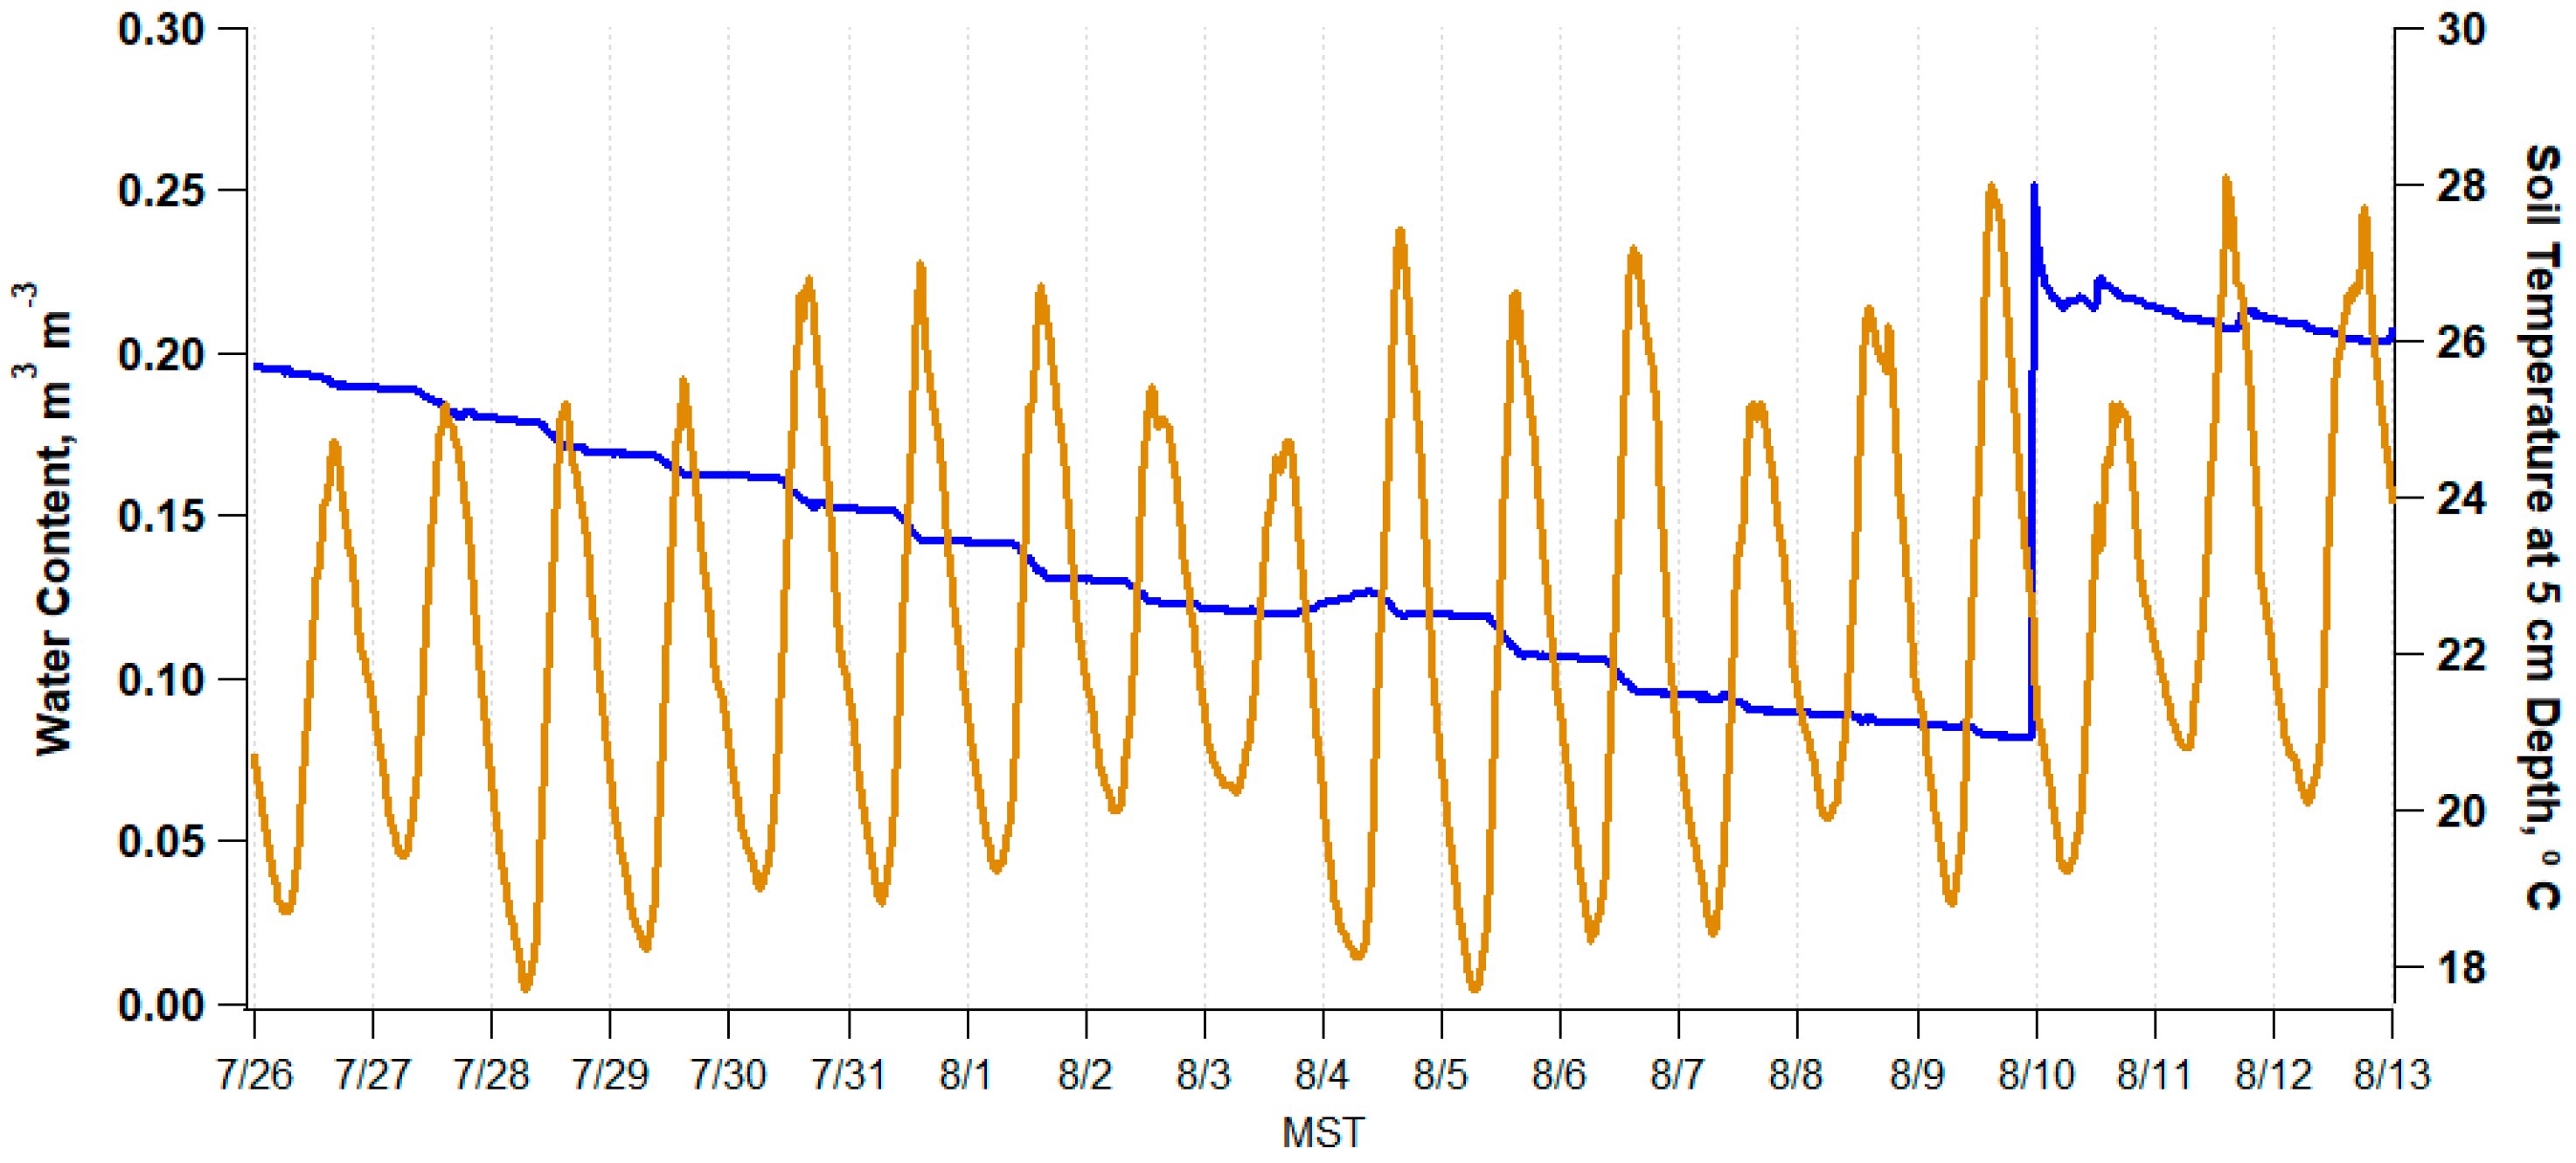
The soil physical structure, pH, moisture content and temperature gradient directly impact the processes that govern NHx loss to assimilation, nitrification and exchange with the atmosphere. Soil temperature and moisture data, collected by NCAR, shown in Figure 4 depict a consistent water content within the top 5 cm of the soil bed.
Soil temperatures in the top 5 cm of the profile showed a typical diurnal cycle of retaining heat from incoming radiation peaking at on average 25 °C and slowly dissipating heat during late night and early mornings. The amplitude of the soil temperature daily cycle ranged between 5 and 10 °C. Following a rainy period that preceded the campaign, the soil moisture slowly decreased during our study period with small and large increases following periods of precipitation on 4 and 10 August, respectively.

3.3. Measured Soil Emission Potentials

The average and standard deviations of the soil composition measurements are shown in Table 1. For each sampling date and plot, the standard deviation of the soil [NH4+] is derived from the variability among the triplicate extracts. In contrast, the variability in pH among replicate extracts was always less than 0.1 pH units. Each measurement of soil [NH4+] is combined with the measurement of soil [H+] to calculate the average and standard deviation of the soil emission potential. Comparison of Γg in open and dense canopy areas of the forest shows the inherent heterogeneity in the forest ecosystem. In general, the soil supporting the dense canopy is more acidic, leading to lower emission potentials for comparable soil [NH4+].
Over the course of the campaign period, the open canopy areas displayed active brush and understory development. In contrast, the dense canopy areas maintained a thick layer of decomposing litterfall primarily composed of pine needles. It is well known that decomposing pine needles acidify soil, and with high acidity, a larger proportion of NH3 is trapped in its protonated form (NH4+) unable to volatilize. Soil from the dense canopy plot had much higher NH4+ on the first two sampling dates leading to the largest emission potentials observed during the campaign. The NH4+ content of the soil in the dense canopy plot decreased dramatically for the last two samples, leading to emission potentials that were orders of magnitude smaller. In contrast, the open canopy soil exhibited moderate increases in its NH4+ content with decreasing soil acidity, leading to comparable relative increases in the emission potential. Overall, our soil measurements from the MEFO site in summer of 2015 produced Γg values with a wide range in variability from 5 to 2122 for the dense canopy soil alone.

3.4. Measured Stomatal Emission Potentials

A single mature Ponderosa pine tree was used to characterize stomatal emission potential variability and to determine the direction of NH3 exchange with the forest canopy. Extracted NH4+ concentrations were all within a factor of two as seen in Table 2.
The Γst was calculated for each sample, or group of samples, using the bulk leaf relationship described by Equation (3). In the exponential fit used by Massad et al. [18], the bulk NH4+ values measured in MEFO fall within the linear section leading to a factor of two range in the stomatal emission potential.

4. Discussion

4.1. Challenges of Measuring NH3 in Ecosystem Compartments

Predicting the direction and magnitude of surface-atmosphere NH3 exchange is difficult in natural ecosystems, where the legacy of land use and nutrient inputs is often not known. The bi-directional flux framework was developed to represent the flux of NH3 between different environmental compartments (e.g., soil, vegetation, atmosphere) driven by thermodynamics [21,29]. Ground and stomatal emission potentials (Γ) can provide insight about the net exchange of NHx in these ecosystems. Decoupling each compartment can be challenging, particularly when all compartments come together to comprise an ecosystem. Isolating the soil Γg parameter, for example, requires removing other closely linked influences, such as litter and root systems that can also have an impact on the amount of N in the soil system [26]. There have been extensive studies on developing proper soil extraction methods [36]. By virtue of all aqueous extraction methods, all removable NHx is extracted in the form of NH4+. This assumes all extracted [NH4+] represents the amount found in soil pore water that can volatilize into the atmosphere. Recent chamber studies of soil, either of core samples [15] or overtop the intact soil [38,39], overcome this limitation by measuring the NH3 emission directly. However, enclosure experiments, such as chambers, have difficulty in recreating the turbulent mixing that regulates the transfer velocity between the soil and atmosphere under ambient conditions, which is critical for fluxes that are driven by a compensation point, such as for NH3. Both approaches are limited but are an important step in providing necessary data to determine the extent of available NHx in the soil. The soil extraction method used in this study is a commonly used technique that was further refined by Wentworth et al. to improve the NH4+ detection using IC. The method uses a lower concentration of salt in the extraction solution and therefore may slightly underestimate the total amount of NH4+ in the soil. However, given that the proportion of total soil NHx that is exchangeable with the atmosphere is unknown, it is not clear if this introduces a bias in the soil emission potentials we report.
Direct NHx measurements of vegetation are equally challenging. In bi-directional exchange models, the vegetation-atmosphere exchange is the sum of NH3 exchange with plant stomata and deposition to the thin liquid layer that forms on the cuticles of the plant. In principle, calculating the stomatal emission potential requires measurements of [NH4+] and [H+] in the apoplastic fluid. For practical reasons, Γst is often inferred from [NH4+] concentration found in the bulk leaf material.
The data used to produce the fit described in Equation (3) were assembled from measured data and inferred [NH4+]bulk values [19]. Only two studies by Hill et al. and Mattsson and Schojoerring involved apoplast extraction, bulk measurements, and plant chamber measurements to calculate χst, and by inversion of Equation (2), Γst [40]. In the remaining studies [NH4+]bulk concentrations from unmanaged grassland and forest ecosystem types were not measured but were derived based on a relationship with total nitrogen deposition (Ndep) estimates [41]. The relationship in Equation (3) was derived for a range of bulk [NH4+] between 0 to 120 µg per g of leaf tissue, with forest ecosystems spanning the entire concentration range. The measurements of bulk [NH4+] concentrations observed at MEFO remained within a range from 7.9 to 13.7 µg g of needle-1. Therefore, the small variability in [NH4+]bulk was reflected in the small variability calculated in Γst.

4.2. Implications of Γg Variability on NH3 Flux

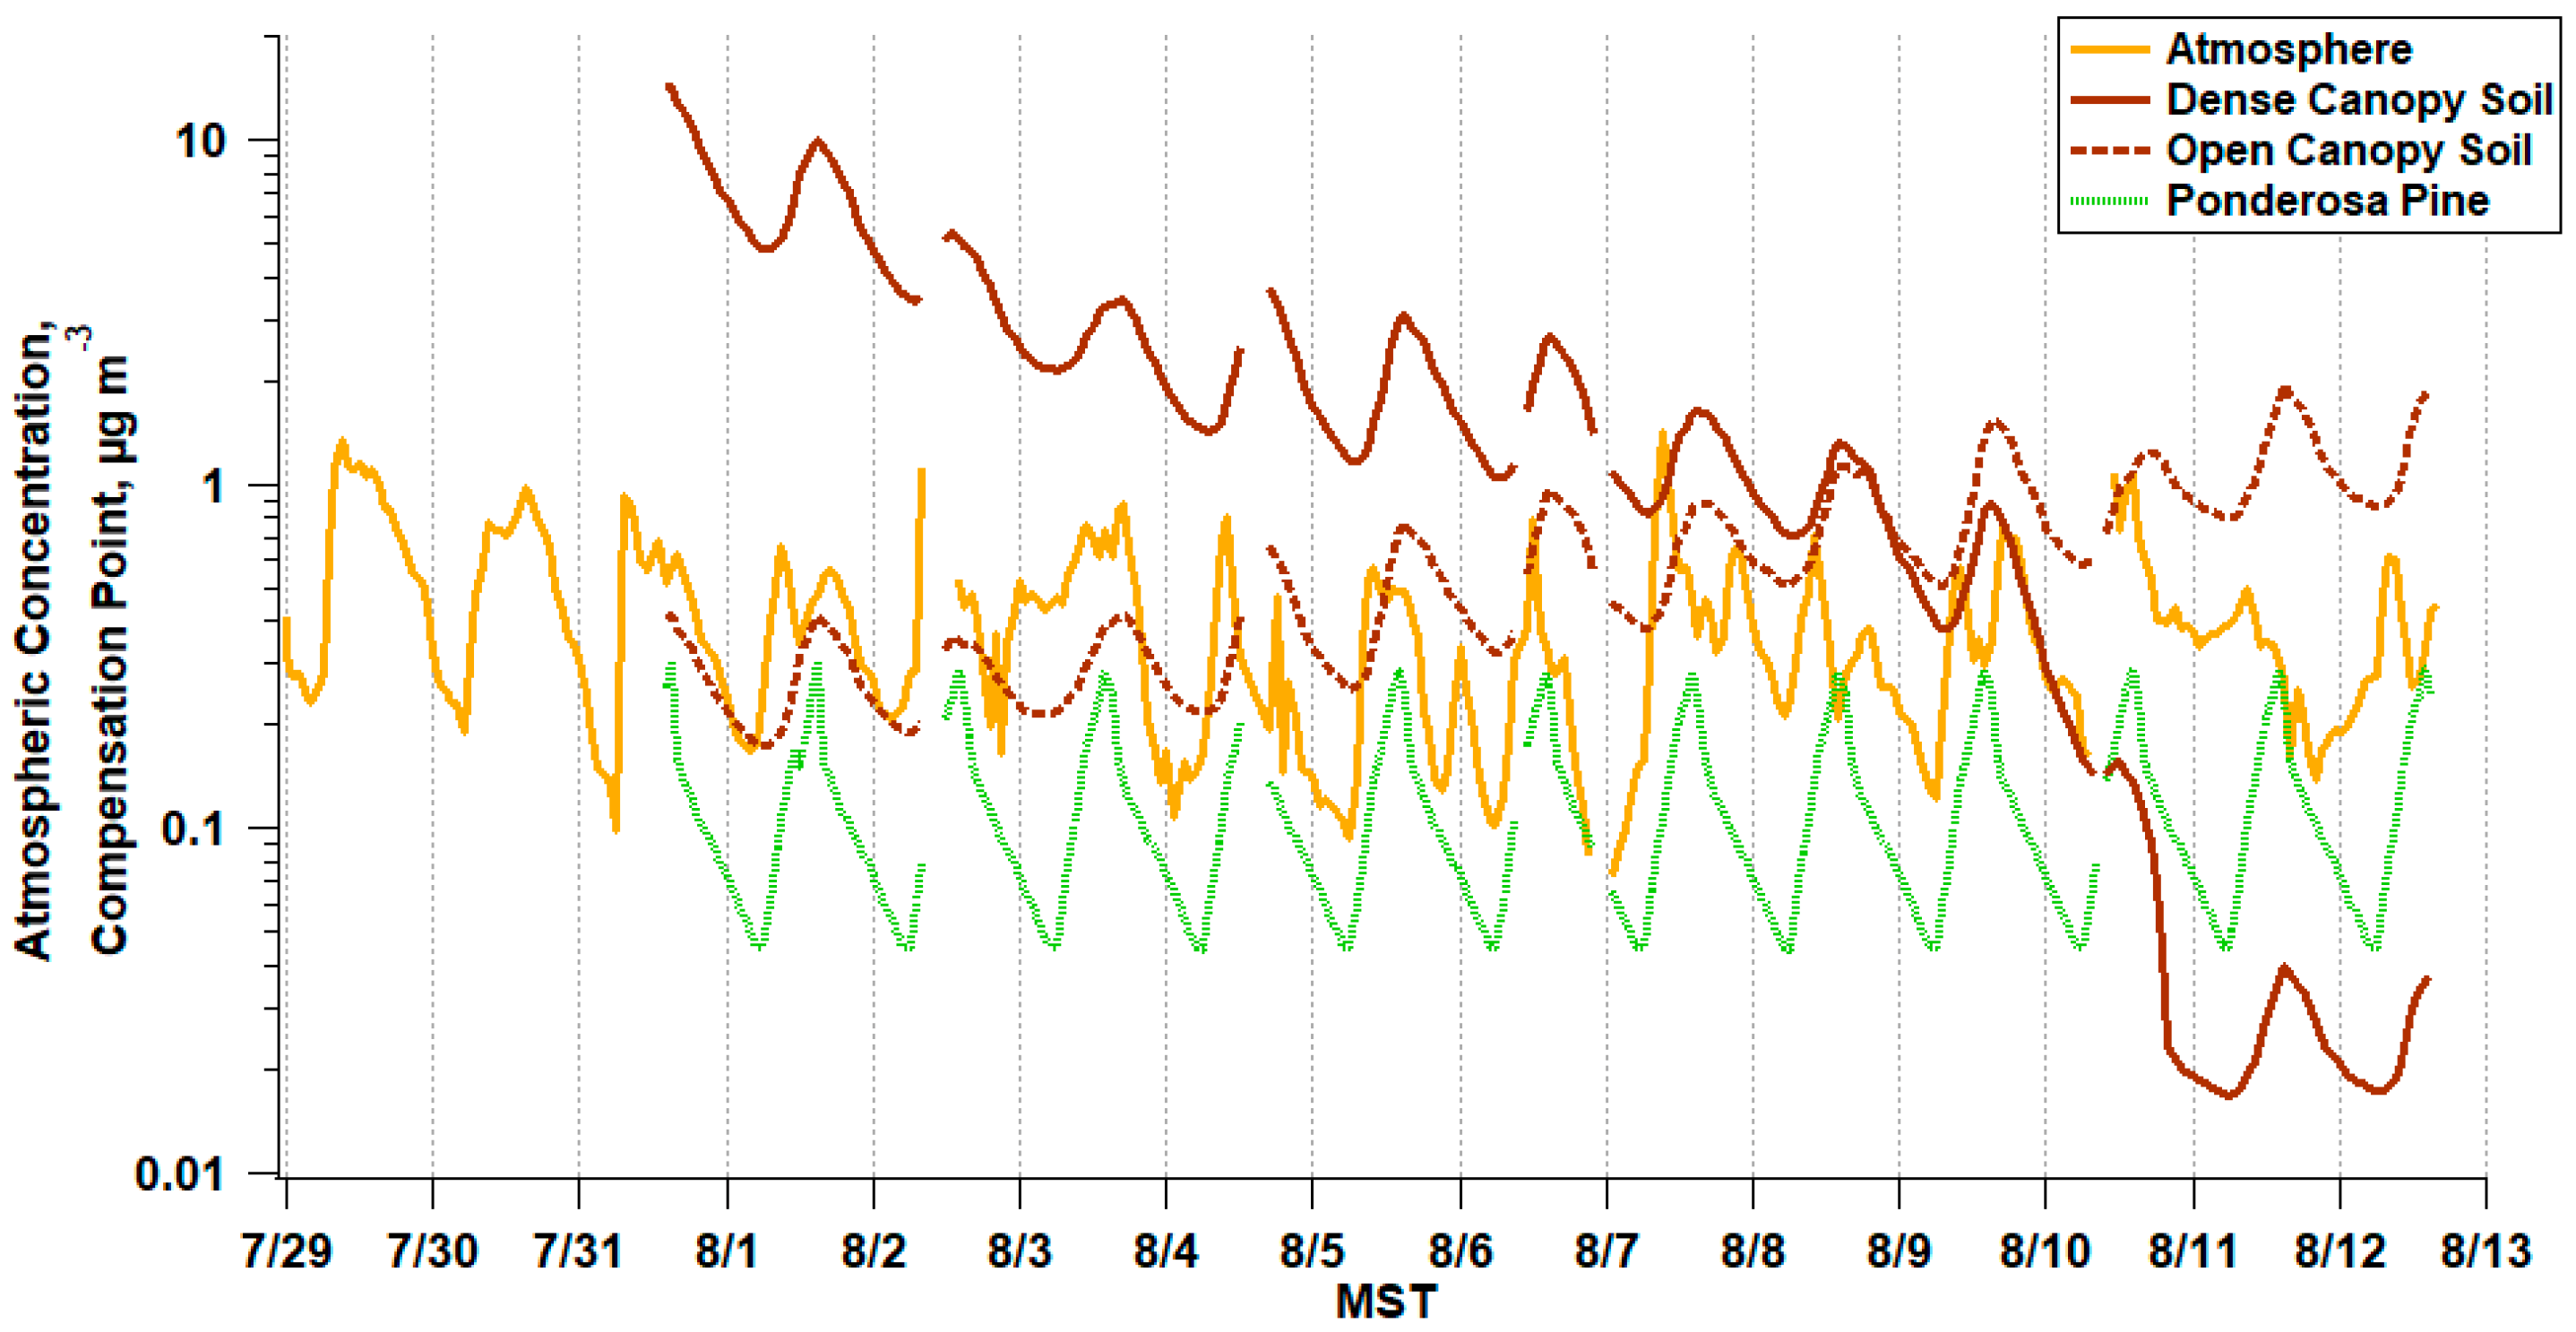
Emission potential (Γ) and temperature collectively regulate the NH3 compensation point (χ) of a compartment. When compared to the ambient concentrations, χ in turn defines the direction and influences the magnitude of the NH3 exchange. Compensation points that are greater than ambient concentrations suggest emission to the atmosphere will occur in order to re-establish equilibrium. The reverse is also true, in which compensation points smaller than concentrations observed in the atmosphere are predicted to tend towards deposition from the atmosphere. To account for changes in the measured soil [NH4+] content and pH, mean Γg values were linearly interpolated between measurement periods for both soil types to generate hourly Γg values over the course of the campaign period. This approach assumes that the change between the measured values of Γg is linear. The soil temperature of the top 5 cm was then used to compute the hourly values of χg for each soil type, using Equation (2). The large variability in Γg of both soil types, especially for the dense canopy, translates into large variability in χg, in which values range from 0.02 to 14.2 µg m-3, as seen in Figure 5. The χst was calculated using mean Γst (35) in Equation (3) and hourly air temperatures. Given that Γst had much smaller variability compared to Γg, using the average value of Γst measured following the atmospheric measurement period should not introduce too much uncertainty.
The calculated values of χg show substantial variability in the gas phase NH3 that would be in equilibrium with the soil compartment. The range of χg values for both the dense and open canopy soils span the range of the atmospheric concentrations of NH3 observed by the AIM-IC (0.1 to 1.5 µg m−3). As a result, there are periods in which the soil is predicted to emit NH3, and other periods where the soil is more likely to receive NH3 through deposition.
The two soil types display significantly different trends in χg over the course of the measurement campaign. The χg of the dense canopy soil type exhibits a decline in compensation point from 14.2 to 0.83 µg m−3 between 31 July and 9 August. After 10 August, the sudden decrease in χg to 0.15 µg m−3 implies that atmospheric exchange with the dense canopy soil area changes sign. The decreasing trend observed in dense canopy soil χg is predominately caused by a sharp decrease in [NH4+] content, while the soil pH and diel pattern of soil temperature remained consistent throughout the measurement period. The opposite trend was observed in open canopy soil χg values. There is a gradual increase in open canopy soil χg that initially lies below atmospheric concentrations and eventually is slightly above. Therefore, the predicted open canopy soil-atmosphere exchange of NH3 begins as deposition and evolves into emission over the measurement period. This gradual increase is related back to the increase in [NH4+] content paired with a decrease in soil acidity and consistent soil temperature pattern. On the other hand, extrapolated time series for χst, ranges from 0.04 to 0.31 µg m−3, suggesting that the direction of exchange is consistently from the atmosphere into the vegetation via the stomata.
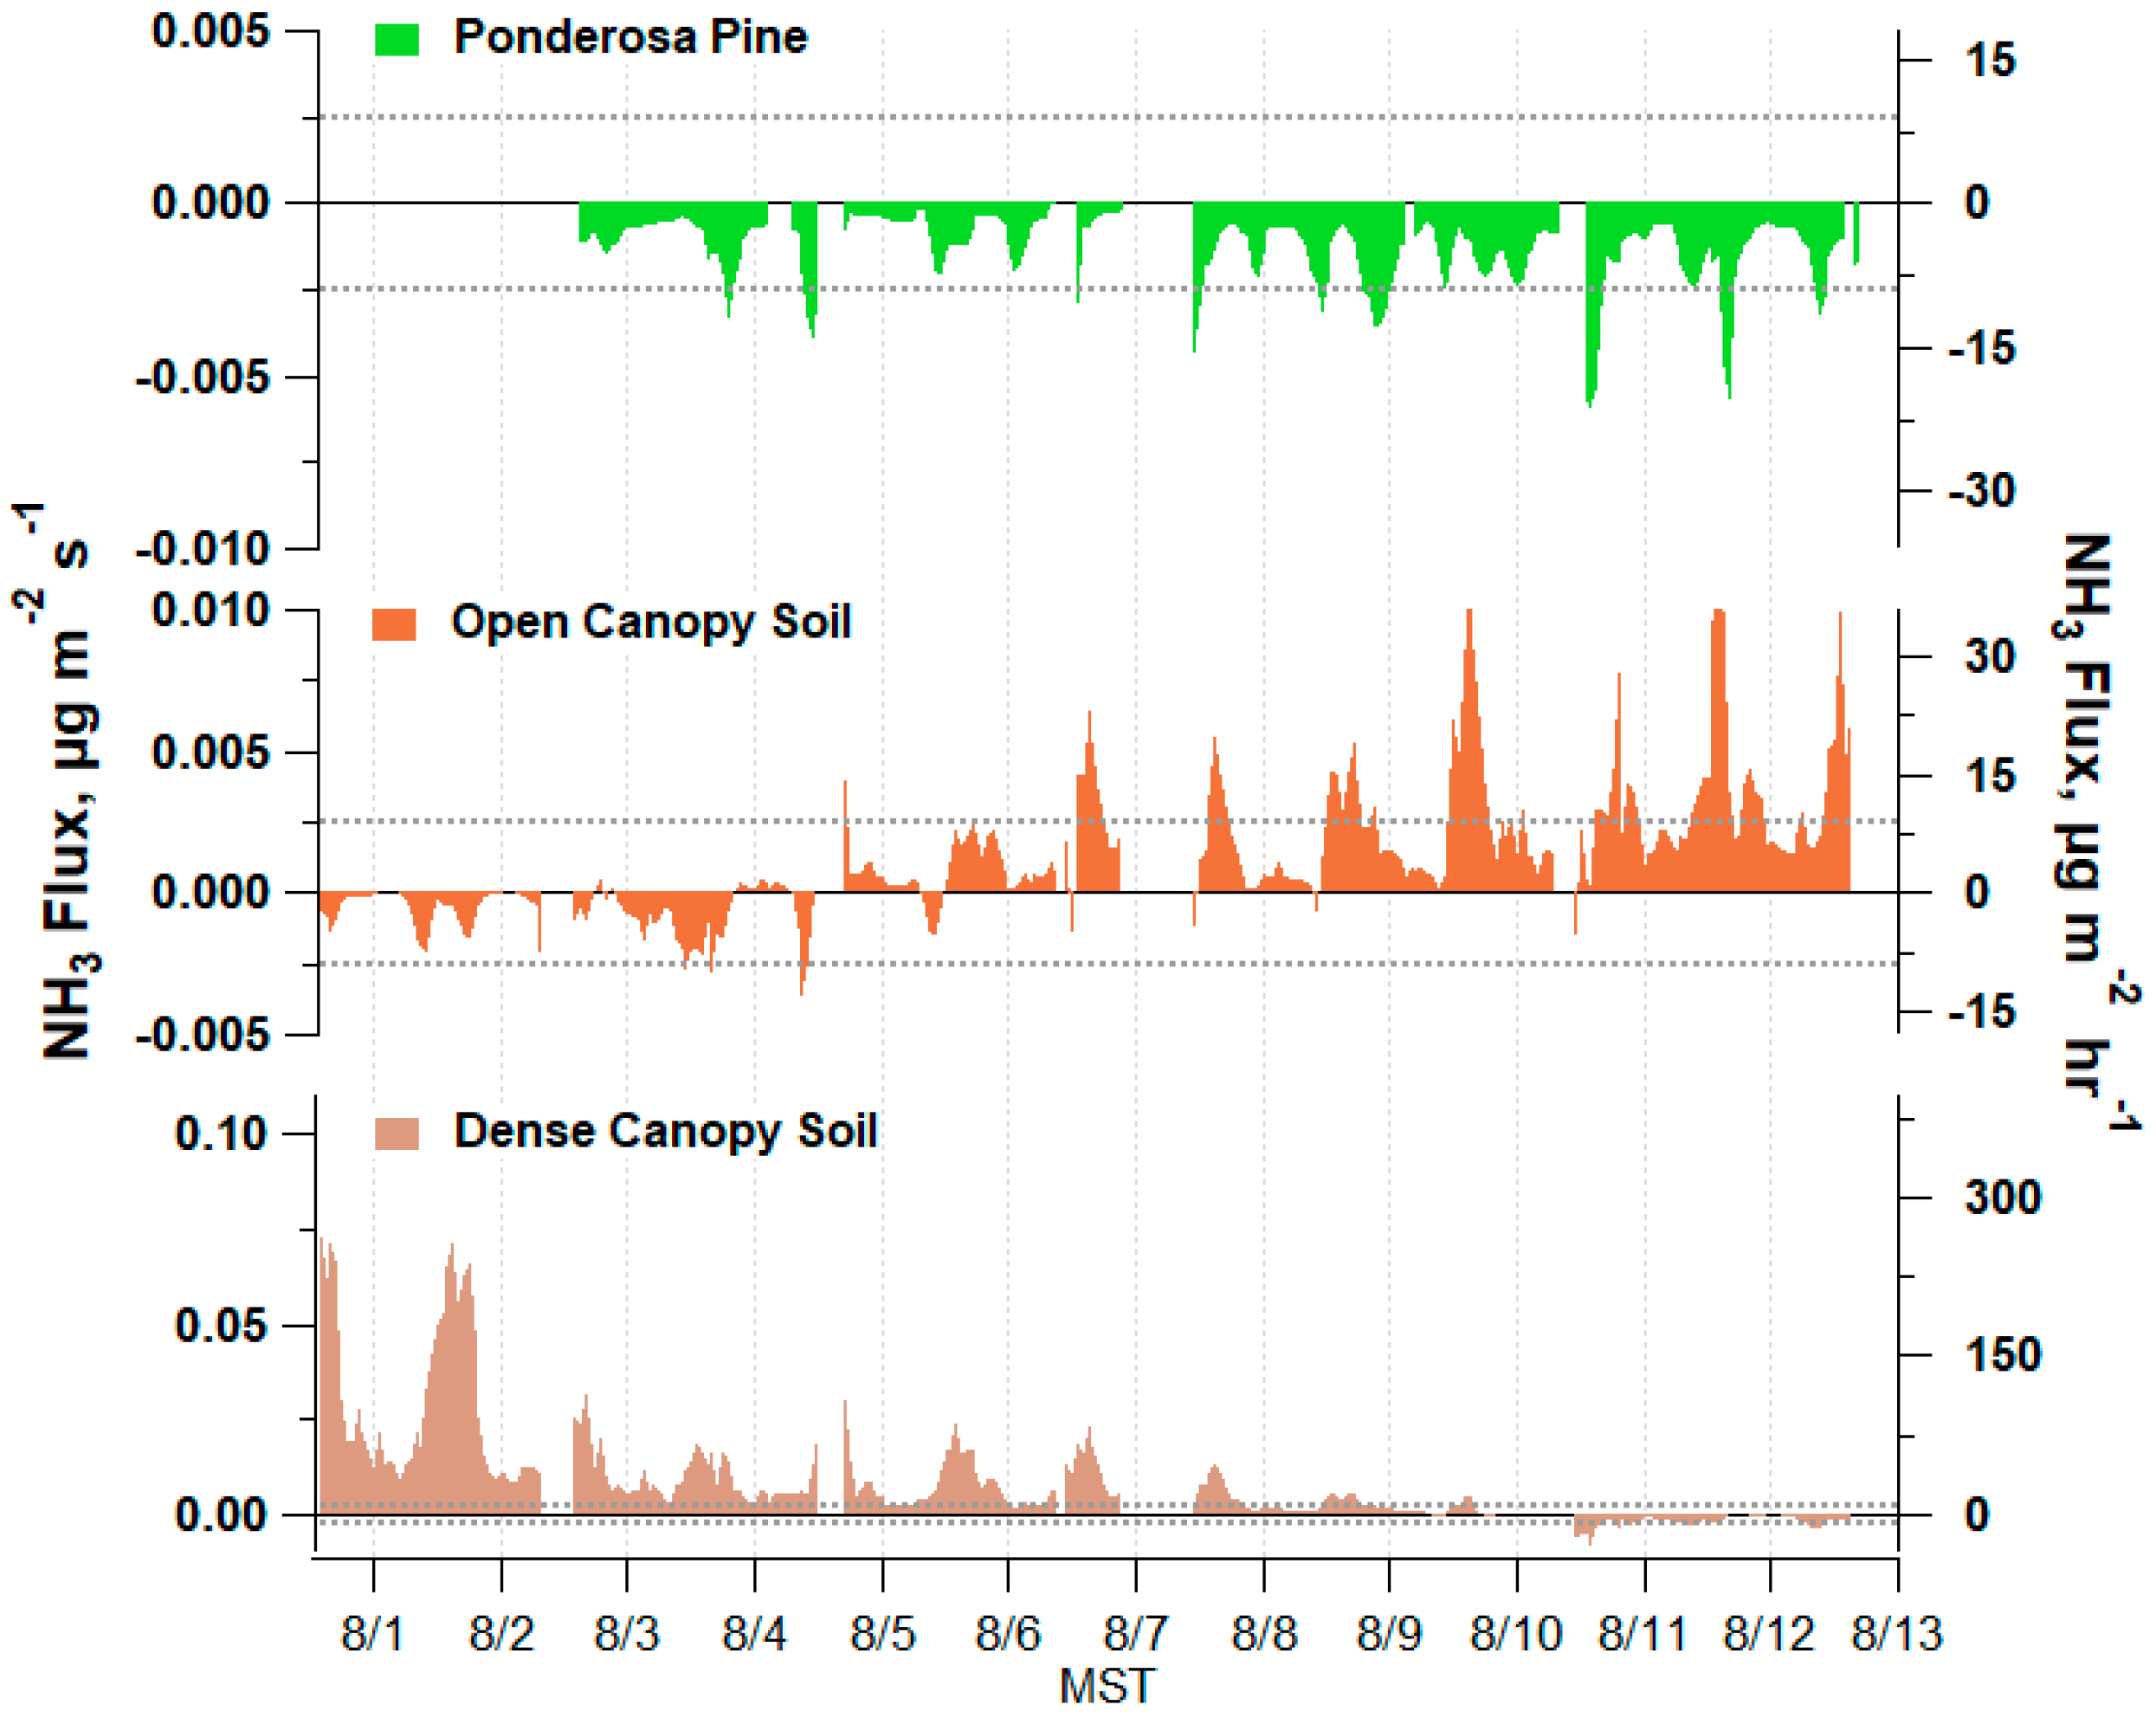
The dynamic trends in χg translate into variable NH3 fluxes for both soil types during the measurement period. The resulting inferred fluxes shown in Figure 6, highlight the influence of varying χg over time for both soil types, leading to both NH3 emission (positive) and deposition (negative) fluxes. From the dense canopy soil, inferred NH3 fluxes range from 370 to −14 µg m−2 h−1. Open canopy NH3 fluxes showed a smaller range of 39 to −10 µg m−2 h−1. The drastic changes in the soil [NH4+] content and inferred Fg can, therefore, have a large impact on the composition of the atmosphere.
The stomatal NH3 fluxes using the χst values presented in Figure 5. In addition, the deposition of NH3 to the pine needle cuticles was inferred as a function of relative humidity and the acid ratio in ambient air. Details on the calculation of the pine needle flux pathways are presented in Section 2.2 in the Supplementary Materials. The fluxes from the Ponderosa pine shown in Figure 6 represent the sum of both stomatal and cuticular fluxes. In contrast to the fluxes from soil, the Ponderosa pine NH3 fluxes also change sign, but to a much smaller degree ranging from 0.14 to −21.5 µg m−2 h−1. Therefore, the inferred pine-atmosphere exchange in the MEFO ecosystem shows a predominate negative flux, or deposition, portraying the surrounding Ponderosa pine as constant sink for NH3 during the measurement period. This is consistent with the small χst calculated.
Inferential modeling of NH3 fluxes typically holds the emission potential of an ecosystem or land cover type constant; however, we found through repeated measurements of soil characteristics under open and dense canopies that the soil χg changed dramatically over just a three-week measurement campaign. As a consequence, the magnitude and even direction of the NH3 flux between the soil and atmosphere inferred by our measurements is very different than had the χg of the soil compartment only been driven by temperature changes. Beyond the variability in time, there is the additional challenge in correctly representing the spatial distribution of the two distinct soil types observed at MEFO. Addressing both types of variability would be necessary for larger scale modeling.
Precipitation volume and composition data reported by the National Trends Network can be used to calculate the wet deposition of NHx during the measurement period. As a result of the rainfall events between 4 and 11August, a total of 17 mg m-2 of NH3 was scavenged from the atmosphere and delivered to the ecosystem. Despite the infrequency of rain events that occurred during the campaign period, wet deposition is still a more significant process in delivering NH3 into the forest soil. Focusing on the periods of dry deposition depicted in Figure 6 can provide an estimate of total dry deposition NH3 input from the atmosphere to the soil when periods of negative fluxes are calculated. From 31 July to 3 August, dry deposition totaling 202 µg m−2 of NH3 occurred over the open canopy soil type. The estimated amount of dry deposition NH3 input to the dense canopy soil between 10 and 13 August is ~360 µg m−2. Thus, wet deposition is roughly two orders of magnitude more important than dry deposition as a source of NH3 to the soil during this period. When compared to the size of the NHx pools in both soil types, the total NH4+ input from wet deposition over one week still falls in the lower end of the total NHx observed in the estimated range of soil NH4+ content (10,000 to 850,000 µg m−2).

4.3. Distribution of NH3 Pools in Forest Ecosystem

The measurements from our study can be used to provide a sense of the relative amounts of NHx in the atmosphere, Ponderosa pine, and soil, by calculating the moles of NHx present in each compartment for a given ground surface area. The total NHx pools of each measured compartment in the MEFO site is displayed in Figure 7 in µg m−2.
The range of NHx shown in each compartment covers all the measurement data collected for the campaign period. Both dense and open canopy soil NH4+ pools were calculated using the total sampling area (0.98 m2), based on the area of the soil corer, the total mass of soil collected from the top 5 cm, and the extracted [NH4+] µg per kg of soil. The range of the Ponderosa pine NH4+ pool was estimated assuming a specific leaf area index (43.8 cm2 g−1), associating leaf surface area with pine needle mass, to express [NH4+]bulk ug g−1 in terms of needle surface area [38]. Then by using the leaf area index characterized for the MEFO canopy (LAI = 3) reported by Ortega et al. [33], the [NH4+]bulk µg cm2 was converted from leaf surface area to ground surface area. The atmospheric NH3 pool was approximated based on NH3 mixing ratios measured during the campaign and an assumed 1000-m boundary layer height that provided the total NH3 µg m−2.
Examining all the major NHx pools characterized in the study shows the wide range of NHx content between the different compartments that undergo surface-atmosphere exchange of NH3. It is evident the pool of NH4+ found in both soil types, despite their differences, is far greater than what was estimated in the pine needles and in the atmosphere combined. The calculated ranges of NH4+ of dense canopy soil and open canopy soil were 10,000 to 850,000 and 20,000 to 110,000 µg m−2, respectively. This is 2–3 orders of magnitude larger than the NH4+ amount estimated in the Ponderosa pine needles, with a range of 3000 to 15,000 µg m−2. Of the four compartments studied, the atmosphere has the least NH3, ranging from 200 to 670 µg m−2.
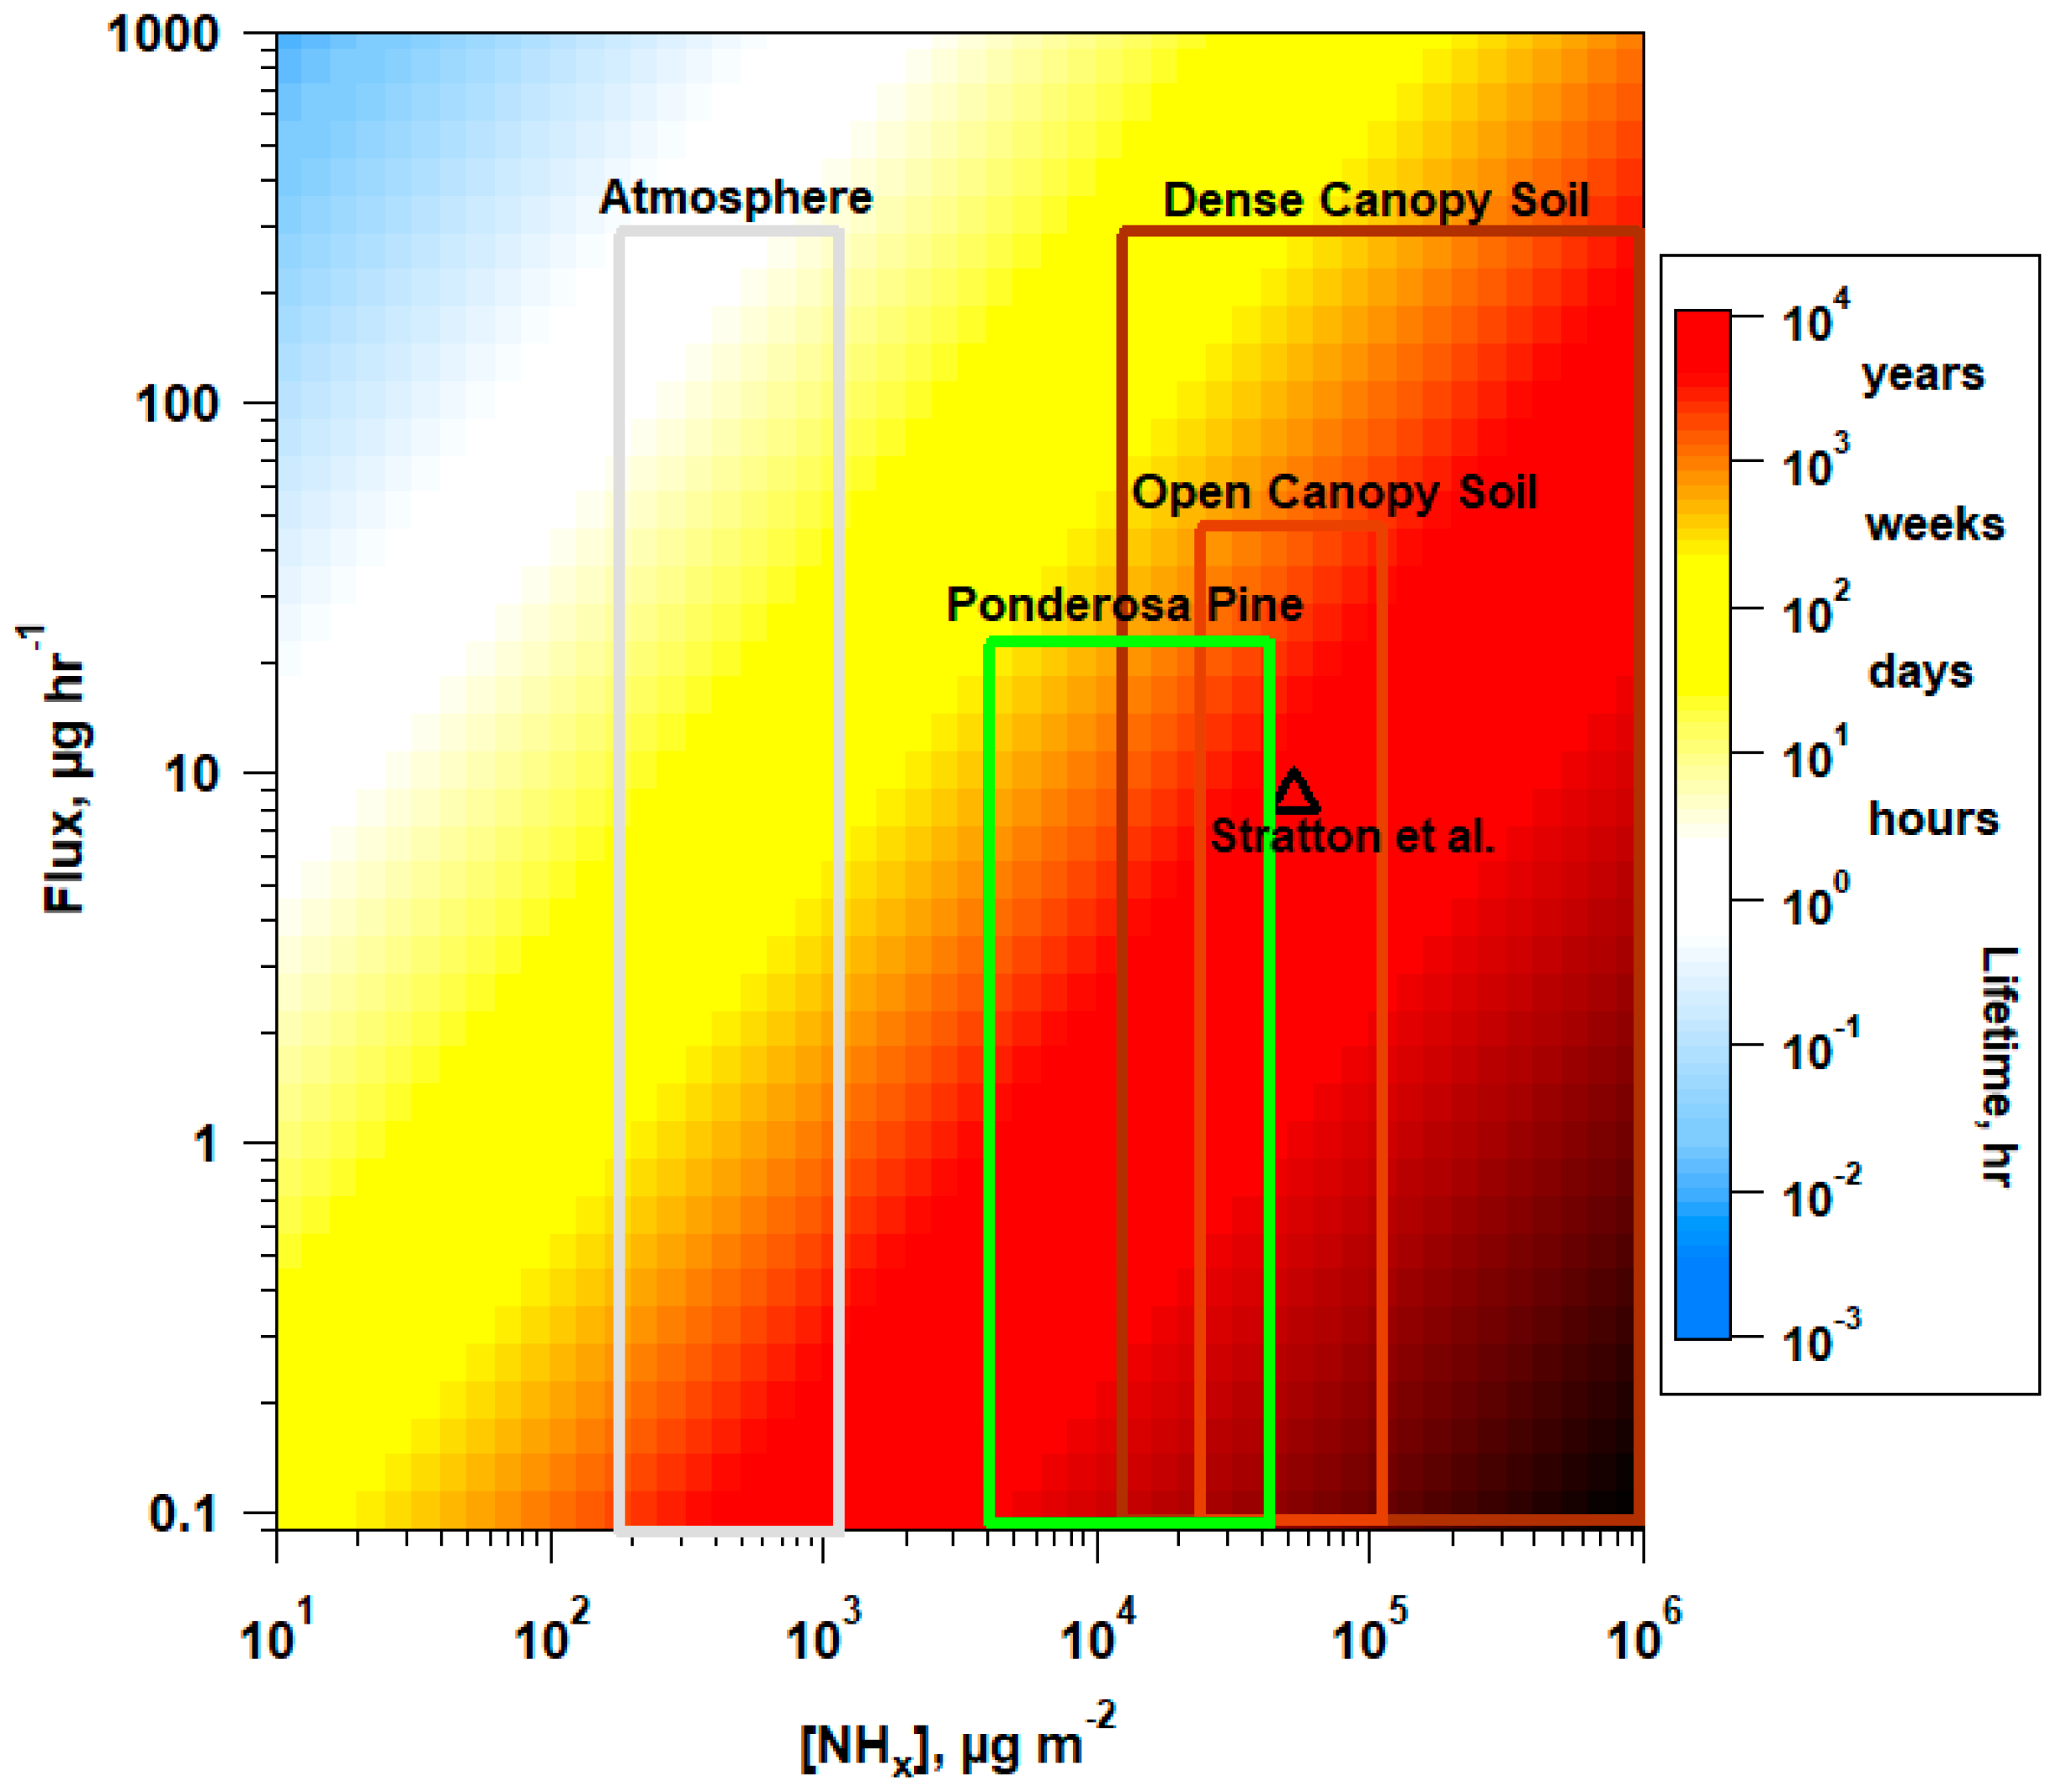
The implications of dynamic χ values from different environmental compartments make it difficult to predict the direction of the net NHx exchange between the atmosphere and remote forest ecosystems. The relevance of atmospheric input into the soil system and surrounding canopy is, therefore, examined in terms of lifetime of soil NHx with respect to surface-atmosphere exchange. The lifetime of NH3 is defined by the size of the chemical pool and the net flux, the combination of loss and gain rate of NH3 between the compartment and the atmosphere. The ranges of calculated NHx pools and fluxes, are shown in Figure 8, highlighting the areas of the forest compartments measured in MEFO. The open black triangle represents the previously reported soil NHx content of unmanaged forest soils from Stratton et al., for comparison. Soil density is needed to calculate the size of the [NH4+] pool, which is rarely reported. Therefore, the average soil density observed at MEFO (0.2 kg of soil per m2) was used to estimate the extent of the [NH4+] pool from Stratton et al. study. The forest site studied in Stratton et al. falls within the [NH4+] pool observed at MEFO. The emissions average they reported from their chamber studies is also on the same order of magnitude, as was calculated by compensation point modeling in this study.
From the perspective of the atmosphere, the lifetime of NH3 with respect to the most extreme emission case calculated is on the order of minutes to hours. From the perspective of the soil, the lifetime of NHx against exchange with the atmosphere can range from weeks to years depending on the strength of the flux. Thus, the process of soil-atmosphere NH3 exchange has a big influence on the composition of the atmosphere, and a much smaller relative effect on the composition of the soil system. The overall lifetime of NHx within the soil must be much shorter, given the extreme variability we observed in soil [NH4+]. This implies that other processes like mineralization and denitrification must be important for regulating soil [NH4+], and consequently these processes also impact soil-atmosphere NH3 exchange. Some studies have shown the gross rates of nitrification in mature forests containing Ponderosa pine to be as high as 25 and 79 mg N m−2 d−1 in New Mexico and Oregon field sites, respectively [43]. Such rates are orders of magnitude larger than the largest computed fluxes based on χg and χst. Using the median value of the Ponderosa pine-atmosphere exchange we inferred (−3.61 µg m−2 h−1), corresponds to a lifetime against exchange of 12 weeks for the needles and five days for the atmosphere. Our framework does not investigate the rate of exchange of NH4+ between the pine and the soil, which may be much greater than the rates of exchange of either of these compartments with the atmosphere.
One of the challenges to these approaches is the lack of information on the biological processes, namely local biota that govern mineralization, immobilization, and nitrification. More research into genomics, paired with flux chamber experiments, for other atmospherically relevant gases are currently being explored and show promise in converging our understanding of the physical processes that govern trace gas exchange and the microbiology that contributes to this exchange [44]. This also highlights the need for ecological data on the soil, such as microbiological processing and litter decay rates that can be another source of NH3 input. This could potentially lead to the advent of more available N-rich nutrients through the mineralization of organic nitrogen. Many studies have broadened the number of N-fixation bacteria investigated in order to improve our understanding of the total N budget found in forest regions [45,46,47]. Ultimately, more research on the soil pools of NH3 input could help explain the high [NH4+] seen in MEFO soils.

5. Conclusions

The resulting study offers the extent of NHx pools observed in MEFO during summertime conditions and the impact of atmospheric input into the forest ecosystem. The changes and variability in NH4+ we observed in the soil system suggest there are processes, namely mineralization, immobilization and nitrification, occurring on a much shorter timescale compared to a year and that during these summertime conditions, the ecosystem-atmosphere exchange of NH3 is negligible from the perspective of the soil NHx budget.

Supplementary Materials

The following are available online at https://www.mdpi.com/2571-8789/3/1/15/s1. Figure S1. Ambient concentrations of trace gases (HCl, SO2, HNO3, and NH3) and average PM2.5 composition (pCl, pNO3, pSO4, pNH4, and *organics) observed in MEFO by the AIM-IC from 27 July to 13 August 2015.

Author Contributions

Conceptualization, J.M., A.M., A.H.; methodology, A.M., A.H., H.S.-N.; formal analysis, J.M., A.M., A.H.; investigation, A.M., A.H.; writing—original draft preparation, J.M., A.H.; writing—review and editing, J.M., A.M., A.H.

Funding

This research received no external funding.

Acknowledgments

The authors would like to thank the following people: John Ortega for soil temperature data provided by NCAR, Janel Owens and Chuck Simmons from the University of Colorado, Colorado Springs for much-needed deionized water, and Steve Alton, the USDA Forest Services MEFO site manager, for logistical help.

Conflicts of Interest

The authors declare no conflict of interest. The funders had no role in the design of the study; in the collection, analyses, or interpretation of data; in the writing of the manuscript, or in the decision to publish the results.

References

  1. Galloway, J.N.; Townsend, A.R.; Erisman, J.W.; Bekunda, M.; Cai, Z.; Freney, J.R.; Martinelli, L.A.; Seitzinger, S.P.; Sutton, M.A. Transformation of the Nitrogen Cycle: Recent trends, questions, and potential solutions. Science 2008, 320, 889–892. [Google Scholar] [CrossRef]
  2. Sutton, M.A.; Reis, S.; Riddick, S.N.; Dragosits, U.; Nemitz, E.; Theobald, M.R.; Tang, Y.S.; Braban, C.F.; Vieno, M.; Dore, A.J.; et al. Towards a climate-dependent paradigm of ammonia emission and deposition. Philos. Trans. R. Soc. B 2013, 368, 20130166. [Google Scholar] [CrossRef]
  3. Sutton, M.A.; Erisman, J.W.; Dentener, F.; Möller, D. Ammonia in the environment: From ancient times to the present. Environ. Pollut. 2008, 156, 583–604. [Google Scholar] [CrossRef]
  4. Eilerman, S.J.; Peischl, J.; Neuman, J.A.; Ryerson, T.B.; Aikin, K.C.; Holloway, M.W.; Zondlo, M.A.; Golston, L.M.; Pan, D.; Floerchinger, C.; et al. Characterization of Ammonia, Methane, and Nitrous Oxide Emissions from Concentrated Animal Feeding Operations in Northeastern Colorado. Environ. Sci. Technol. 2016, 50, 10885–10893. [Google Scholar] [CrossRef]
  5. Sun, K.; Tao, L.; Miller, D.J.; Pan, D.; Golston, L.M.; Zondlo, M.A.; Griffin, R.J.; Wallace, H.W.; Leong, Y.J.; Yang, M.M.; et al. Vehicle Emissions as an Important Urban Ammonia Source in the United States and China. Environ. Sci. Technol. 2017, 51, 2472–2481. [Google Scholar] [CrossRef]
  6. Bishop, G.A.; Stedman, D.H.; Burgard, D.A.; Atkinson, O. High-Mileage Light-Duty Fleet Vehicle Emissions: Their Potentially Overlooked Importance. Environ. Sci. Technol. 2016, 50, 5405–5411. [Google Scholar] [CrossRef]
  7. Nowak, J.B.; Neuman, J.A.; Bahreini, R.; Middlebrook, A.M.; Holloway, J.S.; McKeen, S.A.; Parrish, D.D.; Ryerson, T.B.; Trainer, M. Ammonia sources in the California South Coast Air Basin and their impact on ammonium nitrate formation. Geophys. Res. Lett. 2012, 39, 6–11. [Google Scholar] [CrossRef]
  8. Behera, S.N.; Sharma, M.; Aneja, V.P.; Balasubramanian, R. Ammonia in the atmosphere: A review on emission sources, atmospheric chemistry and deposition on terrestrial bodies. Environ. Sci. Pollut. Res. 2013, 20, 8092–8131. [Google Scholar] [CrossRef]
  9. Seinfeld, J.H.; Pandis, S.N. Atmospheric Chemistry and Physics: From Air Pollution to Climate Change, 2nd ed.; Wile-Interscience: New York, NY, USA, 2006; ISBN 9780471720171. [Google Scholar]
  10. Malo, B.A.; Purvis, E.R. Soil absorption of atmospheric ammonia. Soil Sci. 1964, 97, 242–247. [Google Scholar]
  11. Talhelm, A.F.; Burton, A.J.; Pregitzer, K.S.; Campione, M.A. Forest Ecology and Management Chronic nitrogen deposition reduces the abundance of dominant forest understory and groundcover species. For. Ecol. Manag. 2013, 293, 39–48. [Google Scholar] [CrossRef]
  12. Sutton, M.A.; Asman, W.A.H.; Schjoerring, J.K. Dry deposition of reduced nitrogen. Tellus B 1994, 46, 255–273. [Google Scholar] [CrossRef]
  13. Husted, S.; Schjoerring, J.K.; Nielsen, K.H.; Nemitz, E.; Sutton, M.A. Stomatal compensation points for ammonia in oilseed rape plants under field conditions. Agric. For. Meteorol. 2000, 105, 371–383. [Google Scholar] [CrossRef]
  14. Langford, A.O.; Fehsenfeld, F.C. Natural Vegetation as a Source or Sink for Atmospheric Ammonia: A Case Study. Science 1992, 255, 581–583. [Google Scholar] [CrossRef]
  15. Stratton, J.J.; Ham, J.; Borch, T. Ammonia Emissions from Subalpine Forest and Mountain Grassland Soils in Rocky Mountain National Park. J. Environ. Qual. 2018. [Google Scholar] [CrossRef]
  16. Baron, J.S.; Rueth, H.M.; Wolfe, A.M.; Nydick, K.R.; Allstott, E.J.; Minear, J.T.; Moraska, B. Ecosystem responses to nitrogen deposition in the Colorado Front Range. Ecosystems 2000, 3, 352–368. [Google Scholar] [CrossRef]
  17. Burns, D.A. The effects of atmospheric nitrogen deposition in the Rocky Mountains of Colorado and southern Wyoming, USA—A critical review. Environ. Pollut. 2004, 127, 257–269. [Google Scholar] [CrossRef]
  18. Massad, R.S.; Nemitz, E.; Sutton, M.A. Review and parameterisation of bi-directional ammonia exchange between vegetation and the atmosphere. Atmos. Chem. Phys. 2010, 10, 10359–10386. [Google Scholar] [CrossRef] [Green Version]
  19. Massad, R.S.; Loubet, B. Review and Integration of Biosphere-Atmosphere Modelling of Reactive Trace Gases and Volatile Aerosols; Springer: Berlin/Heidelberg, Germany, 2015; ISBN 9789401772853. [Google Scholar]
  20. Zhang, L.; Wright, L.P.; Asman, W.A.H. Bi-directional air-surface exchange of atmospheric ammonia: A review of measurements and a development of a big-leaf model for applications in regional-scale air-quality models. J. Geophys. Res. Atmos. 2010, 115. [Google Scholar] [CrossRef] [Green Version]
  21. Nemitz, E.; Milford, C.; Sutton, M. A two-layer canopy compensation point model for describing bi-directional biosphere-atmosphere exchange of ammonia. Q. J. R. Meterorol. Soc. 2001, 127, 815–833. [Google Scholar] [CrossRef]
  22. Nemitz, E.; Sutton, M.A.; Wyers, G.P.; Otjes, R.P.; Schjoerring, J.K.; Gallagher, M.W.; Parrington, J.; Fowler, D.; Choularton, T.W. Surface/atmosphere exchange and chemical interaction of gases and aerosols over oilseed rape. Agric. For. Meteorol. 2000, 105, 427–445. [Google Scholar] [CrossRef]
  23. Twigg, M.M.; House, E.; Thomas, R.; Whitehead, J.; Phillips, G.J.; Famulari, D.; Fowler, D.; Gallagher, M.W.; Cape, J.N.; Sutton, M.A.; et al. Surface/atmosphere exchange and chemical interactions of reactive nitrogen compounds above a manured grassland. Agric. For. Meteorol. 2011, 151, 1488–1503. [Google Scholar] [CrossRef]
  24. Wentworth, G.R.; Murphy, J.G.; Gregoire, P.K.; Cheyne, C.A.L.; Tevlin, A.G.; Hems, R. Soil-atmosphere exchange of ammonia in a non-fertilized grassland: Measured emission potentials and inferred fluxes. Biogeosciences 2014, 11, 5675–5686. [Google Scholar] [CrossRef]
  25. Nemitz, E.; Sutton, M.A.; Schjoerring, J.K.; Husted, S.; Paul Wyers, G. Resistance modelling of ammonia exchange over oilseed rape. Agric. For. Meteorol. 2000, 105, 405–425. [Google Scholar] [CrossRef]
  26. Hansen, K.; Sørensen, L.L.; Hertel, O.; Geels, C.; Skjøth, C.A.; Jensen, B.; Boegh, E. Ammonia emissions from deciduous forest after leaf fall. Biogeosciences 2013, 10, 4577–4589. [Google Scholar] [CrossRef] [Green Version]
  27. Whaley, C.H.; Makar, P.A.; Shephard, M.; Zhang, L.; Zhang, J.; Zheng, Q.; Akingunola, A.; Wentworth, G.; Murphy, J.; Kharol, S.K.; Cady-Pereira, K.E. Contributions of natural and anthropogenic sources to ambient ammonia in the Athabasca Oil Sands and north-western Canada. Atmos. Chem. Phys. 2018, 18, 2011–2034. [Google Scholar] [CrossRef] [Green Version]
  28. Walker, J.; Spence, P.; Kimbrough, S.; Robarge, W. Inferential model estimates of ammonia dry deposition in the vicinity of a swine production facility. Atmos. Environ. 2008, 42, 3407–3418. [Google Scholar] [CrossRef]
  29. Farquhar, G.D.; Firth, P.M.; Wetselaar, R.; Weir, B. On the Gaseous Exchange of Ammonia between Leaves and the Environment: Determination of the Ammonia Compensation Point. Plant Physiol. 1980, 66, 710–714. [Google Scholar] [CrossRef] [Green Version]
  30. Denmead, O.T.; Freney, J.R.; Dunin, F.X. Gas exchange between plant canopies and the atmosphere: Case-studies for ammonia. Atmos. Environ. 2008, 42, 3394–3406. [Google Scholar] [CrossRef]
  31. Denmead, O.T.; Freney, J.R.; Simpson, J.R. A closed ammonia cycle within a plant canopy. Soil Biol. Biochem. 1976, 8, 161–164. [Google Scholar] [CrossRef]
  32. Fowler, D.; Pilegaard, K.; Sutton, M.A.; Ambus, P.; Raivonen, M.; Duyzer, J.; Simpson, D.; Fagerli, H.; Fuzzi, S.; Schjoerring, J.K.; et al. Atmospheric composition change: Ecosystems-Atmosphere interactions. Atmos. Environ. 2009, 43, 5193–5267. [Google Scholar] [CrossRef]
  33. Ortega, J.; Turnipseed, A.; Guenther, A.B.; Karl, T.G.; Day, D.A.; Gochis, D.; Huffman, J.A.; Prenni, A.J.; Levin, E.J.T.; Kreidenweis, S.M.; et al. Overview of the Manitou experimental forest observatory: Site description and selected science results from 2008 to 2013. Atmos. Chem. Phys. 2014, 14, 6345–6367. [Google Scholar] [CrossRef]
  34. Moore, R. Soil Conservation Service Soil Survey of Pike National Forest, Eastern Part, Colorado, Parts of Douglas, El Paso, Jefferson and Teller Counties; Forest Service: Washington, DC, USA, 1992. [Google Scholar]
  35. Markovic, M.Z.; VandenBoer, T.C.; Murphy, J.G. Characterization and optimization of an online system for the simultaneous measurement of atmospheric water-soluble constituents in the gas and particle phases. J. Environ. Monit. 2012, 14, 1872–1884. [Google Scholar] [CrossRef]
  36. Li, K.; Zhao, Y.; Yuan, X.; Zhao, H.; Wang, Z.; Li, S.; Malhi, S.S. Comparison of Factors Affecting Soil Nitrate Nitrogen and Ammonium Nitrogen Extraction. Commun. Soil Sci. Plant Anal. 2012, 43, 571–588. [Google Scholar] [CrossRef]
  37. Hansen, K.; Pryor, S.C.; Boegh, E.; Hornsby, K.E.; Jensen, B.; Sørensen, L.L. Background concentrations and fluxes of atmospheric ammonia over a deciduous forest. Agric. For. Meteorol. 2015, 214–215, 380–392. [Google Scholar] [CrossRef]
  38. Miola, E.C.C.; Aita, C.; Rochette, P.; Chantigny, M.H.; Angers, D.A.; Bertrand, N.; Gasser, M.-O. Static Chamber Measurements of Ammonia Volatilization from Manured Soils: Impact of Deployment Duration and Manure Characteristics. Soil Sci. Soc. Am. J. 2015, 79, 305. [Google Scholar] [CrossRef]
  39. Delon, C.; Galy-Lacaux, C.; Serça, D.; Loubet, B.; Camara, N.; Gardrat, E.; Saneh, I.; Fensholt, R.; Tagesson, T.; Le Dantec, V.; et al. Soil and vegetation-atmosphere exchange of NO, NH3, and N2O from field measurements in a semi arid grazed ecosystem in Senegal. Atmos. Environ. 2017, 156, 36–51. [Google Scholar] [CrossRef]
  40. Hill, P.W.; Raven, J.A.; Loubet, B.; Fowler, D.; Sutton, M.A. Comparison of Gas Exchange and Bioassay Determinations of the Ammonia Compensation Point in Luzula sylvatica (Huds.) Gaud. Plant Physiol. 2001, 125, 476–487. [Google Scholar] [CrossRef]
  41. Sutton, M.; Pitcairn, C.; Whitfield, C. Bioindicator and Biomonitoring Methods for Assessing the Effects of Atmospheric Nitrogen on Statutory Nature Conservation Sites; Report No. 356; Joint Nature Conservation Committee: Peterborough, UK, 2004.
  42. Xiao, C.W.; Janssens, I.A.; Curiel Yuste, J.; Ceulemans, R. Variation of specific leaf area and upscaling to leaf area index in mature Scots pine. Trees-Struct. Funct. 2006, 20, 304–310. [Google Scholar] [CrossRef]
  43. Stark, J.M.; Hart, S.C. High rates of nitrification and nitrate turnover in undisturbed coniferous forests. Nature 1997, 385, 61–64. [Google Scholar] [CrossRef]
  44. Scharko, N.K.; Schütte, U.M.E.; Berke, A.E.; Banina, L.; Peel, H.R.; Donaldson, M.A.; Hemmerich, C.; White, J.R.; Raff, J.D. Combined Flux Chamber and Genomics Approach Links Nitrous Acid Emissions to Ammonia Oxidizing Bacteria and Archaea in Urban and Agricultural Soil. Environ. Sci. Technol. 2015, 49, 13825–13834. [Google Scholar] [CrossRef]
  45. Corre, M.D.; Beese, F.O.; Brumme, R. Soil Nitrogen Cycle in High Nitrogen Deposition Forest: Changes under Nitrogen Saturation and Liming. Ecol. Appl. 2003, 13, 287–298. [Google Scholar] [CrossRef]
  46. Vitousek, P.M.; Menge, D.N.L.; Reed, S.C.; Cleveland, C.C. Biological nitrogen fixation: Rates, patterns and ecological controls in terrestrial ecosystems. Philisophical Trans. R. Soc. Lond. B Biol. Sci. 2013, 368, 20130119. [Google Scholar] [CrossRef]
  47. DeLuca, T.H.; Zackrisson, O.; Nilsson, M.-C.; Sellstedt, A. Letters To Nature. Lett. Nat. 2002, 419, 917–920. [Google Scholar] [CrossRef]
Scheme 1. Simplified scheme of NHx exchange between an ecosystem, composed of soil and vegetation, and the atmosphere. The solid orange boxes highlight the NHx measured in this study, with the grey dashed boxes showing processes and pools that were not measured.
Soilsystems 03 00015 sch001
Figure 1. Bird’s-eye view of the research site, with AIM-IC and soil sampling locations (\sites 1 and 2) marked.
Soilsystems 03 00015 g001
Figure 2. Ambient concentrations particulate NH4+ (top) and ambient NH3 (bottom) observed in MEFO by the AIM-IC from 27 July to 13 August 2015, in which date and time are presented in Mountain Standard Time (MST).
Soilsystems 03 00015 g002
Figure 3. Meteorological conditions observed during the campaign period from 24 July to 12 August 2018. Ensembled averages of (a) RH and (b) T. (c) Time series of daily precipitation amounts and accumulation in mm from NTN.
Soilsystems 03 00015 g003aSoilsystems 03 00015 g003b
Figure 4. Soil temperature and water content in the top 5 cm of the soil from 26 July to 13 August 2015.
Soilsystems 03 00015 g004
Figure 5. Change in soil and stomatal compensation points with respect to atmospheric NH3 concentrations measured by the AIM-IC from 31 July to 13 August 2015.
Soilsystems 03 00015 g005
Figure 6. Inferred soil NH3 fluxes based on χg of both soil types and the Ponderosa pine flux (sum of stomatal and cuticular pathways) from 31 July to 12 August 2015 in µg m−2 s−1 and µg m−2 h−1. Both ±0.0025 µg m−2 s−1 or 9 µg m−2 h−1 are marked with grey dotted line for reference.
Soilsystems 03 00015 g006
Figure 7. Comparison of measured NHx pools on a logarithmic scale in two distinct soil sampling areas (dense and open canopy soils), the Ponderosa pine (assuming specific leaf area = 43.8 cm2 g−1, [42]) and LAI = 3 [33], and the atmosphere (assuming 1000 m boundary layer depth). Whiskers represent 10 and 90 quartiles, with the box within the 25 to 75 quartiles and the mean marked with a solid line.
Soilsystems 03 00015 g007
Figure 8. Lifetime of NHx in h with respect to soil-atmosphere exchange as a function of NHx concentration and flux in µg m−2 h−1 on logarithmic scales. The ranges of measured [NHx] content and inferred fluxes for the atmosphere, Ponderosa pine, dense and open canopy soils are highlighted.
Soilsystems 03 00015 g008
Table 1. Extracted [NH4+], soil pH and resulting Γg in open and dense canopy areas of MEFO.
Sampling DateDense Canopy SoilOpen Canopy Soil
[NH4+]
µg g−1 wet soil
pH Γg[NH4+]
µg g−1 wet soil
pHΓg
July 3144.8 ± 13.56.02122 ± 6420.72 ± 0.366.261 ± 22
Aug 251.5 ± 14.65.4708 ± 2001.44 ± 1.085.962 ± 46
Aug 101.08 ± 1.445.45 ± 42.7 ± 0.546.2220 ± 39
Aug 17 10.725.483.66.4466
1 Values from 17 August are based on a single sample extract.
Table 2. Averaged [NH4+]bulk from a single mature Ponderosa pine on 16-18 August 2018.
Sampling Time of DayTree Base (1 m)Middle (3.6 m)Near Top (7 m)
[NH4+]
µg g−1 needle
Γst[NH4+]
µg g−1 needle
Γst[NH4+]
µg g−1 needle
Γst
Morning (5:00–7:00)12.9 ± 0.2 (2)3711.3 ± 1.4 (2)548.3 ± 0.7 (2)30
Midday (10:00–16:00)7.9 ± 1.3 (2)2912.6 ± 5.6 (11)3813.7 ± 7.6 (2)40
Evening (17:00–19:00)12.8 13712.1 13510.8 133
Sample number is denoted in parentheses. 1 Values based on single sample extract.