Abstract
Peatlands provide essential ecological services but are highly vulnerable to degradation from drainage, leading to greenhouse gas emissions, land subsidence, and increased fire susceptibility. This study investigates peat hydrology and its relationship to fire risk in a fire-prone area in South Sumatra, Indonesia. Groundwater levels and soil moisture were continuously monitored using automated loggers, and recession analysis quantified their rates of decline. Multispectral drone imagery (NDVI, NDWI) over a 44.1-ha area assessed vegetation and surface wetness, while fire occurrences (2019–2024) were analyzed using the Fire Information for Resource Management System (FIRMS). During a 58-day dry period, groundwater depth reached 78.5 cm with a recession rate of 9.68 mm day−1, while soil moisture decreased by 0.00291 m3 m−3 per day over 27 consecutive dry days. Drone imagery revealed that unhealthy and dead grass covered nearly 90% of the site, although wetness remained moderate (NDWI = 0.02–0.58). FIRMS data indicated that rainfall below 2000 mm year−1 and prolonged dry spells (>30 days) strongly trigger peat fires. These findings correspond with early-warning model outputs based on soil moisture recession and ignition thresholds. Maintaining a high groundwater level is, therefore, crucial for reducing peat fire vulnerability under extended dry conditions.
1. Introduction
Indonesia, with a tropical peatland area of 13.4 million hectares (Mha), has the largest extent of tropical peatlands in the world. Sumatra contains the largest share, approximately 43 percent (%) of the total, followed by Kalimantan (34%) and Papua (23%). Peat thickness ranges from 0.5 meter (m) to over 7 m [1]. The conversion of peatlands into plantations disrupts natural peat hydrology and degrades the original ecosystem [2,3]. Establishing plantations on peat, in general, requires drainage to lower the groundwater table, typically through the construction of ditches or canals. Drainage exposes the peat to oxygen, initiating drying and shrinkage of the peat matrix, which accelerates the decomposition of organic matter and results in water loss and surface subsidence [4,5]. These oxidative conditions alter the soil environment from a reducing to an oxidizing state, causing long-term changes in peat characteristics and morphology, often leading to subsidence and irreversible drying. As the peat continues to dry, air infiltrates the soil pores, and capillary suction above the water table causes further shrinkage and surface subsidence [6,7]. Beyond subsidence, lowering the groundwater table also increases greenhouse gas emissions, reduces biodiversity, and raises fire risk [8,9,10]. Peatland and forest fires are among Indonesia’s most pressing environmental challenges during prolonged dry seasons. These fires not only damage ecosystems and biodiversity but also pose serious threats to public health, the economy, and political stability. Fires result in the loss of natural resources such as timber, flora, and fauna, and disrupt agricultural production, trade, transportation, industry, and tourism. The economic losses from peatland fires in Indonesia in 2019 were estimated at US $5.2 billion, which is equivalent to 0.5% of the national gross domestic product (GDP) [11]. The total burned peatland area from 2015 to 2022 reached 2.20 Mha, with 18% categorized as recurrent fire-prone areas [12]. Peatland fires are driven by both natural and anthropogenic factors. Natural factors include climatic anomalies such as El Niño, which cause prolonged droughts and elevated temperatures, thereby increasing fire susceptibility. The El Niño event in 2015, classified as a very strong episode, triggered the largest extent of peatland fires within the 2015–2022 period, burning 857,056 hectares. In contrast, during the La Niña phase in 2022, which brought wetter-than-usual dry season conditions, only 7772 hectares were affected by fires [12]. Human-induced factors encompass land clearing, forest encroachment, the use of fire for land preparation, careless fire management, and socio-economic conflicts [13]. There is a strong interaction between peatland fire risk and both soil moisture and groundwater levels. Groundwater content is influenced by the depth of the water table, while soil capillarity plays a critical role in maintaining peat moisture, particularly during dry periods [14]. The link between groundwater levels, soil moisture, and fire risk enables anticipatory measures through the development of early-warning systems (EWSs). EWSs have become an essential strategy for mitigating peat fire risks effectively, as they can predict the likelihood of fire occurrence in a given area and support timely mitigation planning [15]. While previous studies, such as those by [15,16], have successfully established the link between large-scale hydrometeorological factors and peat fire dynamics, most of their analyses were conducted at regional scales using relatively coarse spatial and temporal data. In contrast, this study advances peat fire hydrology by employing a fine-scale, integrated approach that combines continuous soil moisture logger records, daily rainfall data, peat fire threshold analysis, and fire occurrence data derived from the Fire Information for Resource Management System (FIRMS). This multi-source integration enables detailed observation of short-term hydrological fluctuations leading to peat desiccation and ignition. Consequently, the proposed EWS model offers a more locally calibrated and dynamic representation of fire susceptibility in tropical peatlands. Hydrological analysis of the Normalized Difference Vegetation Index (NDVI) and Normalized Difference Wetness Index (NDWI) using multispectral drone aerial imagery is a new approach for tropical peatlands. In this study, FIRMS spatial and temporal data were utilized to document the distribution, frequency, and intensity of past peatland fires to represent a novel approach for effectively assessing the relationship between hydroclimatic variables and fire events.
This study aimed to evaluate the dynamics of peatland hydrology in relation to fire vulnerability. The soil moisture was assessed using two different approaches (i.e., measurements using soil moisture loggers and drone multispectral image analysis). The methodological novelty of this work lies in integrating the observed decline in soil moisture during rainless periods with the maximum consecutive dry days associated with historical fire events obtained from the FIRMS spatio-temporal fire archive. This linkage provides an empirical basis for estimating drought conditions under which peat becomes fire-prone. Based on this relationship, we propose a simple early-warning model that relies on two easily monitored parameters: the timing of the last rainfall event and the accumulation of consecutive dry days to anticipate increased fire susceptibility. The resulting information offers practical value for concession managers and policymakers in reducing the incidence and impacts of peatland fires
2. Materials and Methods
2.1. Study Area
This study was conducted in a 1704-hectare fire-prone peat area within a 7470-hectare oil palm concession in Kedaton Village, Kota Agung District, Ogan Komering Ulu Regency, South Sumatra Province, Indonesia (Figure 1). The block represents an unplanted and poorly managed part of the concession, where inadequate land and water management lead to waterlogging during the rainy season and recurrent fires in the dry season. Groundwater levels were not regulated, and no canal-blocking structures existed, allowing natural peat-drying dynamics to be observed.
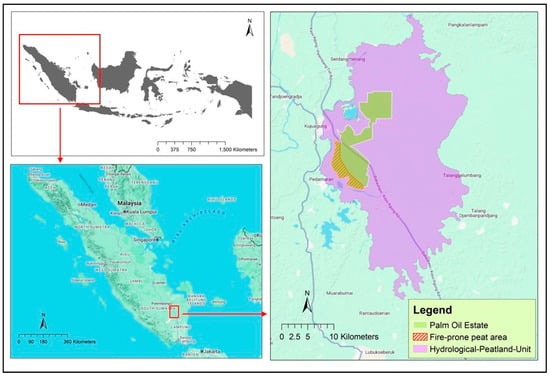
Figure 1.
Geographic location of the study area in Kedaton Village, Kayu Agung District, Ogan Komering Ilir, South Sumatra Province, Indonesia.
The site is located at 104°50′11.1′′–104°55′0.31′′ E and 3°25′0.79′′–3°30′8.2′′ S, at an elevation of 8.6 m above sea level, within the Burnai–Sibumbung Hydrological Peatland Unit. Fieldwork was carried out during the dry season (May–October 2024).
The soil at the research location is Typic Haplohemists [17], with a moderate level of decomposition (hemic) and very deep peat depth (above 3 m). The dominant vegetation is marsh grass (Hymenachne acutigluma), which naturally grows in the swamps of South Sumatra. This plant can adapt to a pH of 4–4.8, can grow at an altitude of up to 100 m above sea level, and grows better in inundated areas [18].
2.2. Groundwater Level and Soil Moisture Monitoring
The hydrological dynamics at the research location were observed using one water level logger and one soil moisture logger. Both instruments were installed on a bare plot within an area characterized by recurrent burning, making it suitable for monitoring the hydrological response of degraded peat ecosystems. Groundwater levels were recorded at 30 min intervals, while soil moisture was measured every 10 min. Since only one logger was deployed for groundwater and another for soil moisture, the reported values represent direct point measurements rather than spatially averaged conditions. The rate of groundwater level (GWL) and soil moisture content (SMC) decline during periods without rainfall was analyzed using the recession curve, as shown in Equation (1) [19]:
where Ht is the GWL or SMC at time t, H0 is the initial GWL or SMC, k is the recession constant, and t is the time interval.
The GWL–SMC recession characteristics obtained from logger measurements were subsequently integrated with NDVI/NDWI dynamics and FIRMS fire records to evaluate hydrology–vegetation–fire interactions. The selected logger site represented the driest and most fire-prone unmanaged peat block, allowing recession behavior to reflect high-risk hydrological conditions.
2.3. NDVI and NDWI Monitoring
The dynamics of land-surface greenness and wetness were analyzed using two complementary data sources. At the broader scale, satellite imagery from Landsat 8–9 was used to assess vegetation and moisture conditions across a 1704.1 ha fire-prone peat area. Meanwhile, fine-scale observations were conducted over a 44.1 ha site using a multispectral Real-Time Kinematic (RTK) drone. The drone was flown on 5 September and 25 September at an altitude of 150 m above the research area to capture detailed spatial variations in NDVI and NDWI. This combined approach enabled both regional assessment and localized verification of surface greenness and wetness dynamics.
NDVI was calculated using Equation (2) [20], and the correlation between NDVI value and plant conditions was given in Table 1 [21]:
where NIR is the near infra-red spectral band and R is the Red spectral band.

Table 1.
Normalized Difference Vegetation Index (NDVI) classes for delineating plant condition [21].
NDWI was calculated using Equation (3) [22], and its correlation with wetness condition is given in Table 2:
Table 2.
Normalized Difference Wetness Index (NDWI) classes for detecting soil wetness condition [22].
Drone-derived NDVI/NDWI data were used to validate the spatial patterns observed in Landsat imagery. Consistent trends between fine- and moderate-resolution datasets strengthened the reliability of remote-sensing indicators used to complement field measurements.
2.4. Spatial and Temporal Analysis of Peat Fires
The intensity and distribution of peatland fire incidents at the study site during the 2019–2024 period were inventoried using data obtained from the Fire Information for Resource Management System (FIRMS). FIRMS provides near real-time (NRT) active fire data derived from the Moderate Resolution Imaging Spectroradiometer (MODIS) sensors onboard the Aqua and Terra satellites, as well as from the Visible Infra-red Imaging Radiometer Suite (VIIRS) sensors onboard the Suomi National Polar-orbiting Partnership (S-NPP), NOAA-20, and NOAA-21 satellites.
The analysis focused on the fire-prone peat area of approximately 1704.1 ha, characterized by recurring dry-season fires and intensive drainage networks. Active fire points within the study boundary were filtered based on a confidence level of greater than 80% to minimize false detections. The frequency of fire occurrences was analyzed on a daily interval to capture short-term fire dynamics and their relation to groundwater fluctuations and surface moisture conditions. This approach allowed for the identification of periods of elevated fire risk and the assessment of spatial clustering of fire events within the peat landscape.
Temporal alignment between recession-based drying periods and FIRMS-detected fires (notably in 2019 and 2023) was used as an internal validation step to confirm that peak consecutive dry days and minimum GWL/SMC levels coincided with fire occurrences.
2.5. Development of a Peat Fire Risk Early-Warning System
The peat fire risk early-warning system was developed based on simulations of soil moisture decline curves during rainless periods, until the soil moisture level reaches the threshold at which peat becomes highly flammable. The soil moisture threshold for peat flammability was determined using the following equation:
where SMCThreshold represents the soil moisture threshold of flammability, SMC0 is the soil moisture level one day after rainfall, k is the recession constant, and CDD is the number of consecutive dry days.
2.6. Data Integration and Internal Validation
To ensure methodological coherence, all field and remote-sensing datasets were integrated within a unified temporal framework. Groundwater and soil-moisture recession curves were synchronized with vegetation indices and fire-occurrence timelines, allowing hydrological behavior to be evaluated directly against surface conditions and confirmed fire events. Cross-resolution consistency checks between drone and Landsat imagery were used to verify spatial patterns of greenness and wetness. Together, these procedures provided internal validation for the drought-based early-warning framework proposed in this study.
3. Results
3.1. Groundwater Level and Soil Moisture Dynamics
Figure 2 depicts rainfall and GWL fluctuations at the research site from 6 May until 31 October 2024. During the period, the mean GWL elevation was 8.443 m a.s.l., corresponding to a depth of 42.1 cm (cm) below the surface. The highest GWL elevation was 8.836 m a.s.l (equivalent to a depth of 2.8 cm), while the lowest GWL elevation was 8.079 m a.s.l. (equivalent to a depth of 78.5 cm). The maximum depth of 78.5 cm occurred 58 days after the last recorded rainfall, which took place on 7 July and measured 141 mm. The recession curve of GWL during the period of no rainfall (from 11 July to 5 September 2024) indicates a decline in GWL of 54 cm over 56 days, equivalent to a recession rate of 9.68 mm day−1.
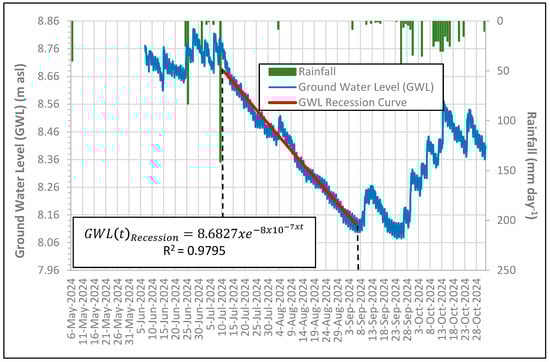
Figure 2.
Rainfall and groundwater level at the research area during the period of 6 May to 31 October 2024 at 30-min intervals.
Figure 3 presents the SMC fluctuations for the period from 26 July to 31 October 2024, following the installation of the soil moisture logger one day earlier. Soil moisture decreased linearly from August 13 until the early rainy season on 9 September 2024. Moderate rainfall between 9 and 22 September, followed by heavier rainfall starting 25 September, caused pulses of SMC increase, interrupting the previous linear decline. During the 27-day dry period from 13 August to 9 September, SMC decreased by 0.0788 m3 m−3, averaging a daily reduction of 0.00291 m3 m−3.
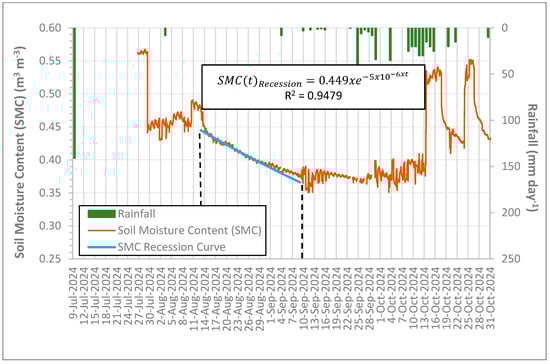
Figure 3.
Rainfall and soil moisture content at the fire-prone peat area during the period of 9 July to 31 October 2024 at 10-minute intervals.
3.2. Relationship of NDVI and NDWI with Peat Fire Vulnerability
The results of the NDVI analysis based on multispectral imagery covering 44.1 ha of a fire-prone peatland area, obtained from drone photo surveys conducted on 5 September and 25 September 2024, are presented in Figure 4. Corresponding changes in vegetation condition across NDVI intervals during this period are summarized in Table 3. The table shows an increase in the area classified as NDVI values ranging from −1.00 to 0.00 (dead vegetation) from 17.7 ha to 18.8 ha, an increase of 1.1 ha or 2.46%. Similarly, the area with the NDVI range of 0.00 to 0.33 (unhealthy vegetation) increased from 21.9 ha to 22.4 ha, representing an increase of 0.5 ha or 1.16% in the unhealthy vegetation area. In contrast, the area with NDVI values between 0.33 and 0.66 (moderately healthy vegetation) declined from 4.4 ha to 2.9 ha, a decrease of 1.6 ha or 3.61%.
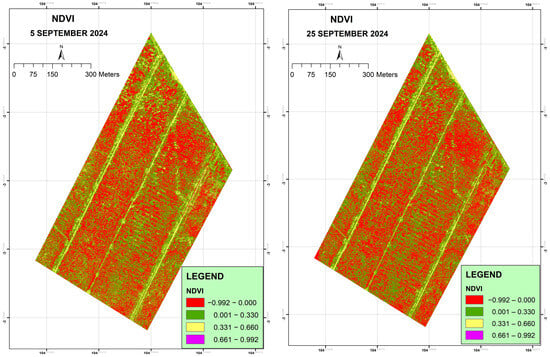
Figure 4.
Normalized Difference Vegetation Index (NDVI) of the research area on 5 September and 25 September 2024.
Table 3.
Comparison of the area under several Normalized Difference Vegetation Index (NDVI) and the corresponding plant condition between 5 September and 25 September 2024.
The results of the NDWI analysis based on multispectral imagery captured on 5 September and 25 September 2024 are shown in Figure 5. Changes in surface area across different wetness index intervals during this 20-day period are detailed in Table 4. The table indicates an increase in the area classified as having low wetness, from 3.7 ha to 4.7 ha, an increase of 1.1 ha or 2.41%. Additionally, the area categorized as dry surface increased significantly, from 1.1 ha to 3.6 ha, representing a rise of 2.5 ha or 5.6%.
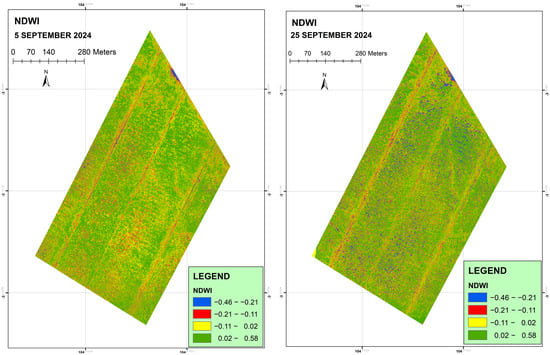
Figure 5.
Normalized Difference Wetness Index (NDWI) of the research area on 5 September and 25 September 2024.
Table 4.
Comparison of areas under several Normalized Difference Wetness Index (NDWI) in the study area between 5 September and 25 September 2024.
To assess vegetation greenness and surface wetness in the 1704.1 ha fire-prone peatland area, NDVI and NDWI were analyzed using LANDSAT 8 satellite imagery dated 14 September 2024 (Figure 6). The NDVI results indicate that most of the area falls within the 0.00 to 0.33 range, which corresponds to unhealthy vegetation. Meanwhile, the NDWI values range from −0.21 to −0.11, indicating a low level of surface wetness across the area.
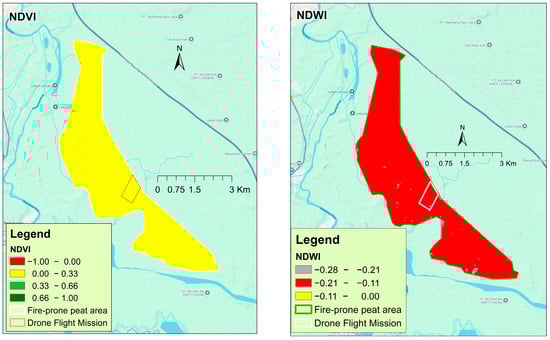
Figure 6.
Normalized Difference Vegetation Index (NDVI) and Normalized Difference Wetness Index (NDWI) at the studied fire-prone peat area on 14 September 2024 based on Landsat 8 imagery.
According to SMC data recorded on 5 September 2024, the peat SMC was 0.3838 m3 m−3. By 25 September, the moisture level had declined to 0.3671 m3 m−3. However, the SMC increased after the afternoon rain on 25 September, with 34 mm on 30 September and 35 mm on 4 October. These rainfall events marked the onset of the rainy season at the research site.
The reading of SMC 0.3671 m3 m−3 on the morning of 25 September, prior to the afternoon rain, represented the lowest soil moisture level observed during the 2024 dry season. When converted to gravimetric moisture content, this value equals 204% on an oven-dry basis. This figure remains well above the peat fire risk threshold identified in previous studies. Reference [23] reported that peat fires are likely to occur when soil moisture drops below 120–160% on an oven-dry basis.
3.3. Hydrological Condition During 2019 and 2023 Peat Fires
Based on the inventory of fire events stored in NASA’s FIRMS database, during the period of 2019 to 2024 in the fire-prone peat area, there have been several series of fires in 2019 and 2023. The distribution, intensity, and duration of fire events were analyzed based on land surface temperature recording data by the MODIS satellite temperature sensor in the range of 325–509.29 °K (51.85–126.85 °C) with a fire pixel size of 1 km2.
Although FIRMS provides only coarse-resolution active fire detections, its role in this study is limited to reconstructing the regional-scale spatial and temporal chronology of fire events throughout 2019–2024. Accordingly, FIRMS functions as a contextual dataset that complements the high-resolution drone imagery used to characterize fine-scale peat surface conditions. The differing spatial resolutions, therefore, represent complementary rather than comparable information sources.
During 2019, there were 5 fire episodes, namely 25 August, 3 November, 8–11 November, 17 November, and 9 December (Figure 7). Meanwhile, during 2023, there were 4 fire episodes, namely on 30 August, while fires with long duration and wide distribution occurred from 1 to 26 September, 28–31 October, and 2–10 November (Figure 8).
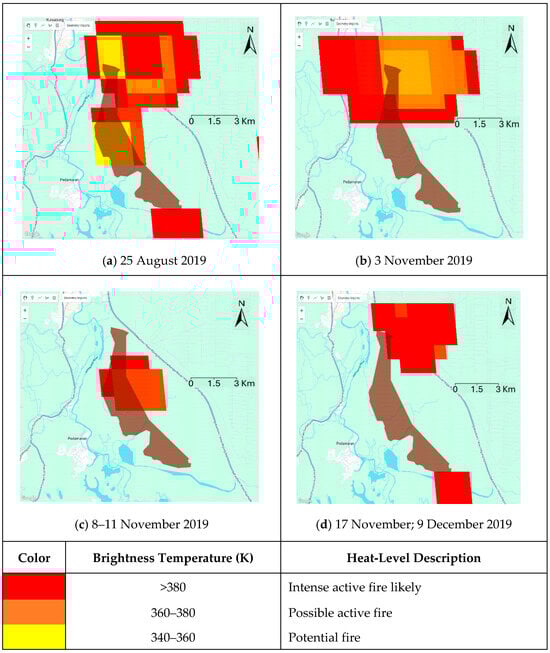
Figure 7.
Spatial distribution of peat fire incidence at fire-prone peat areas in 2019 according to the Fire Information for Resource Management System (FIRMS) data inventory.
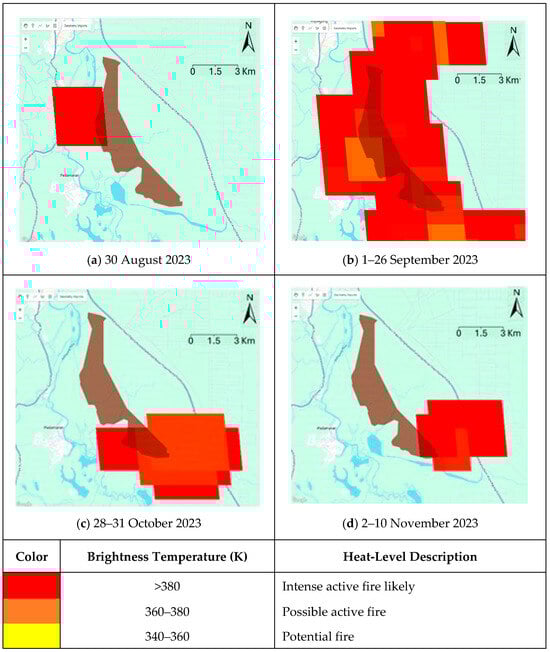
Figure 8.
Spatial distribution of peat fire incidence at fire-prone peat areas in 2023 according to Fire Information for the Resource Management System (FIRMS) data inventory.
Based on the results of the correlation analysis between fire incidents and several hydrological parameters, there is a close relationship between annual rainfall and the maximum consecutive number of days without rain, with the distribution, intensity, and duration of fires as shown in Table 5.
Table 5.
Hydrological condition and peat fire incidence during 2019–2024.
Fire incidents in 2019 and 2023 correlate with annual rainfall of less than 2000 mm, namely 1932 mm in 2019 and 1739 mm in 2023. Meanwhile, measurements of annual rainfall during the period without fire incidents in 2020, 2021, 2022 and 2024 were, respectively, 2331, 2076, 2545, and 2277 mm.
In addition to annual rainfall, the maximum consecutive number of days without rain is also highly related to fires. In 2019, this parameter was 36 days, while in 2023 it was 57 days. During the period of no rain between 2020 and 2022, the maximum consecutive number of days without rain was 21, 26 and 9 days, respectively. A slight anomaly occurred in 2024, where there was no fire even though the maximum consecutive number of days without rain was 48 days, which was 12 days longer than the maximum consecutive number of days without rain in 2019. This anomaly occurred because the start of the day without rain in 2024 was earlier, namely from 7 May 2024 to 23 June 2024, when the GWL depth was still relatively shallow, namely 19.2 cm (Figure 9).
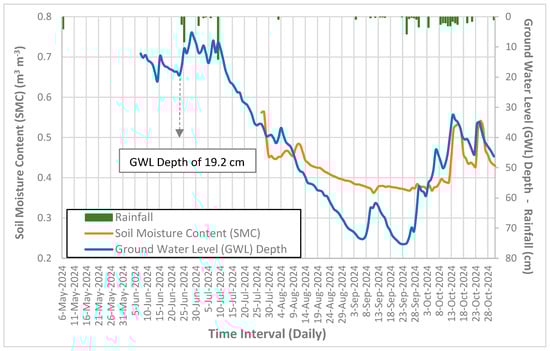
Figure 9.
Relationship between rainfall, groundwater level, and soil moisture content from 6 May to 31 October 2024. Note: The maximum consecutive number of days without rain was 48 days between 7 May and 23 June 2024.
3.4. Peat Fire Risk Early-Warning System
The peatland fire risk early-warning system in this study was developed based on three key components: the date of the last rainfall event at the end of the rainy season, a soil moisture recession model, and a soil moisture threshold value associated with fire risk. This early-warning method enables the estimation of the time window available for implementing preventive measures before soil moisture reaches a critical level conducive to ignition.
The last rainfall at the study site during the end of the rainy season occurred on 3 August 2024, with a total of 8 mm. The soil moisture recession model was derived through exponential trend analysis of daily soil moisture data collected between 13 August and 9 September 2024. The fire risk threshold was determined through graphical analysis, identifying the point where the recession curve intersects the threshold line. This analysis also considered the maximum number of consecutive dry days associated with peatland fire occurrences in 2019 and 2023.
Figure 10 presents the peat fire risk early-warning simulation based on parameters derived from field soil moisture measurements. The simulation period spans from the last rainfall before the dry season to the onset of the following rainy season. The intersection points between the soil moisture recession curve and the low-risk and high-risk threshold lines indicate the predicted time limits for initiating fire prevention and control measures.
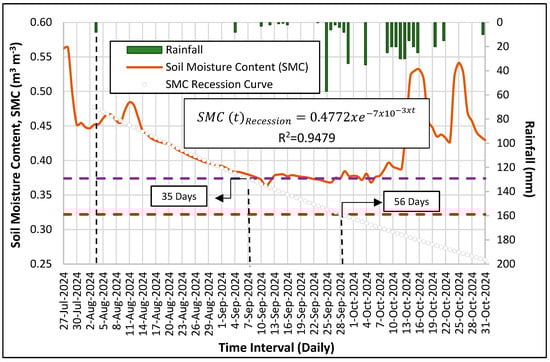
Figure 10.
Low (purple dashed line) and high (red dashed line)-risk thresholds of peat fire based on soil moisture recession as affected by rainfall events.
The upper limit of soil moisture representing the low-risk threshold is 0.374 m3 m−3, equivalent to 208% gravimetric soil moisture, while the lower limit representing the high-risk threshold is 0.322 m3 m−3, equivalent to 179% gravimetric soil moisture. The time required to reach the low-risk threshold since the last rain day is 35 days, while it takes 56 days to reach the high-risk threshold.
These thresholds were determined by intersecting the 2024 field-measured soil moisture recession curve with the maximum consecutive dry-day sequences observed during past fire events (36 days in 2019 and 57 days in 2023), providing site-specific values that align with observed fire occurrences and support the early-warning assessment.
4. Discussion
The observed rate of GWL decline at the study site, 9.8 mm day−1, is comparable to values reported in oil palm peatlands in Siak, Riau (10.6 mm day−1; [24]), this falls within the lower range of other regional observations, such as those from Padang Island where more intensive drainage has resulted in GWL declines up to 35 mm day−1 [25]. The observed rate at our site, approximately three times the local average evapotranspiration, suggests that evapotranspiration alone cannot account for the water loss. Subsurface lateral flow likely plays a major role, as also indicated in studies from Quebec and Sumatra, where subsurface and surface flows account for up to 75% of water redistribution following rainfall [26,27].
Soil moisture decline during the dry spell from 13 August to 9 November 2024 was measured at 0.00291 m3 m−3 per day, equivalent to a 1.62% decrease in gravimetric moisture content (GMC). These rates are within the range reported for tropical peatlands, where post-rainfall declines of 2–3% per day are typical in drained systems [28], while undisturbed forests exhibit slower moisture loss rates (<1% per day) [29].
Vegetation health assessment using NDVI derived from drone multispectral imagery (5 September 2024) revealed widespread stress: 40% of the marsh grass (Hymenachne acutigluma) cover was dead, and 50% in poor condition. This degradation occurred roughly two months after the last significant rainfall (141 mm on 9 July), suggesting the vulnerability of herbaceous peat vegetation to drought. Dead and desiccated vegetation increases surface fuel load and ignition potential [30]. A follow-up NDVI comparison over a 21-day dry period revealed a further 2.46% increase in dead plant cover and 1.16% increase in unhealthy vegetation, demonstrating the sensitivity of drone-based NDVI monitoring for small-leaf area vegetation [31].
Water availability assessment through NDWI indicated that 61% of the area remained in very wet conditions despite visible vegetation stress, suggesting a disconnect between vegetation greenness and surface moisture. This aligns with [32], who found that NDWI can respond more rapidly than NDVI under drought conditions. The decoupling between NDVI and NDWI highlights the need to interpret these indices jointly for a more robust understanding of peatland drought dynamics.
When comparing drone-derived and Landsat 8 imagery (September 2024), marked differences emerged. Drone-based NDVI classified vegetation into four health categories, while Landsat-derived NDVI identified only one (unhealthy). Similarly, NDWI from drones captured four moisture classes, while Landsat imagery reflected only a single, low-wetness category. These discrepancies are attributable to spatial resolution, spectral sensitivity, temporal differences, and image acquisition geometry [33,34,35,36,37]. The drone’s finer resolution enables detection of micro-variability in small-stature vegetation not visible in coarse-resolution satellite imagery.
Fire susceptibility in tropical peatlands is closely linked to hydrological variables. Empirical thresholds identified in Sumatra and Kalimantan suggest that fire risk escalates when water tables fall below 40 cm, with all observed fire events occurring below 60 cm [16,38]. In terms of soil moisture, experimental data indicate that combustion potential increases significantly when peat GMC drops below 100–125% (oven dry basis), or when volumetric moisture content declines to 0.25–0.35 m3 m−3 [39,40,41].
We evaluated historical fire events between 2019 and 2024 within the 1704 ha fire-prone zone, which were analyzed using NASA FIRMS (MODIS/VIIRS) data, a reliable source widely used in fire monitoring [42,43]. Our analysis revealed that fire occurrences correlated strongly with two climate variables: annual rainfall and the maximum number of consecutive dry days (CDDmax). Fires occurred in years with rainfall below 2000 mm (e.g., 2019 and 2023) and extended dry periods (CDDmax of 36 and 57 days, respectively). These findings echo previous reports linking El Niño-induced rainfall anomalies to increased peat fire frequency in Sumatra and Kalimantan [44,45].
Interestingly, no fire was recorded in 2024 despite a CDDmax of 48 days, which is longer than that in 2019. This anomaly is explained by the timing of the dry period that occurred from May to late June, when soil moisture was still high, and GWL remained relatively shallow (19.2 cm on 23 June). This highlights that in addition to the length of the dry spell, its timing relative to seasonal hydrological dynamics is critical in determining fire risk [46].
The soil moisture thresholds identified in this study (0.374 and 0.322 m3 m−3) are higher than the physicochemical ignition thresholds reported in earlier literature (120–160% gravimetric water content). This discrepancy is expected because the thresholds used here were derived from site-specific hydrological behavior rather than from laboratory-based ignition experiments. By correlating the 2024 soil moisture recession curve with the maximum consecutive dry-day sequences associated with confirmed fire events in 2019 (36 days) and 2023 (57 days), the thresholds reflect the actual field conditions under which peat combustion was initiated at the study site. These empirically constrained values therefore incorporate the combined effects of local peat characteristics, surface–subsurface moisture interactions, and atmospheric drying processes, which may not be fully captured in generalized physicochemical thresholds. As a result, the thresholds used in this study are more appropriate for representing local fire susceptibility and for operational early-warning applications.
The methodological framework based on this case site is broadly transferable to tropical peatland in other regions. However, several factors may influence its performance. Differences in peat properties, vegetation structure, and hydrological characteristics can alter the sensitivity of soil-moisture and remote-sensing indicators, requiring region-specific recalibration. In areas with limited ground observations or inconsistent fire records, parameter uncertainty may also increase.
5. Conclusions
This study demonstrates that peatland fire vulnerability is strongly governed by two critical hydrological factors: groundwater level drawdown and the reduction in soil moisture content, which together drive desiccation and increase surface flammability. Our findings further reveal that subsurface flow contributes more significantly to water loss than evapotranspiration. Consequently, maintaining high groundwater levels in peat soils, such as through canal blocking, is essential to reducing subsurface drainage.
Multispectral drone imagery proved highly effective for the early detection of vegetation stress and hydrological changes, offering finer-scale insights that surpass the capabilities of satellite sensors. In particular, the decoupling of vegetation greenness (NDVI) and surface wetness (NDWI) indices provides a more accurate basis for assessing drought and fire risks.
From a policy perspective, these results underscore the importance of integrated water management strategies in peatland restoration programs. Hydrological interventions, including canal blocking to maintain high ground water levels, rewetting, and long-term groundwater monitoring, should be prioritized. Moreover, incorporating advanced remote sensing technologies such as drones into national fire prevention frameworks can enhance early-warning systems and reduce reliance on coarse-resolution satellite data. Finally, the observed divergence between vegetation greenness and surface wetness highlights the necessity of multi-indicator monitoring in peatland management initiatives.
Author Contributions
Conceptualization, B.K. and F.A.; methodology, B.K., S.H.A. and H.S.; data analysis, B.K. and S.H.A.; investigation, B.K., S.H.A., S.M., M., S., B. and F.A.; data curation, B.K. and S.H.A.; writing—original draft, B.K., S.H.A. and F.A.; review and editing, H.S., S.M., M., S., B., A.E. and W.W.; visualization, B.K., and S.H.A.; supervision, A.E., and F.A.; funding acquisition, A.E. and F.A. All authors served equally as the main contributors of this article. All authors have read and agreed to the published version of the manuscript.
Funding
This research was funded by BMU-IKI, Germany, under Project Number BMUZ-1441.
Institutional Review Board Statement
Not applicable.
Informed Consent Statement
Not applicable.
Data Availability Statement
Data are not publicly available.
Acknowledgments
This research was part of Peat IMPACTS-Indonesia Project, a collaborative initiative between CIFOR-ICRAF and the former Indonesia Soil Research Institute (ISRI) under the Ministry of Agriculture. We extend our gratitude to Kartiwa, Ridho Seperintis Tooraa, Muhammad Wahyu Hidayat Wichaksono, Diki Purnama, and Zairi Reling Utomo for their assistance in fieldwork. We also sincerely thank the entire Peat IMPACTS-Indonesia team from the Ministry of Agriculture, CIFOR-ICRAF, and the National Research and Innovation Agency (BRIN) for their valuable contributions.
Conflicts of Interest
The authors declare no conflicts of interest.
Abbreviations
The following abbreviations are used in this manuscript:
| % | Percent |
| °C | Degree Celsius |
| CDD | Consecutive dry days |
| EWS | Early-warning system |
| FIRMS | Fire information for resource management system |
| GDP | Gross domestic product |
| GMC | Gravimetric moisture content |
| GWL | Groundwater level |
| ha | Hectare |
| m | Meter |
| mm | Millimeter |
| m3 m−3 | Cubic meter per cubic meter |
| m a.s.l. | Meters above sea level |
| Mha | Million hectare |
| mm day−1 | Mllimeter per day |
| kg | Kilogram |
| kg m−3 | Kilogram per cubic meter |
| km2 | Square kilometer |
| MODIS | Moderate resolution imaging spectroradiometer |
| NASA | National Aeronautics and Space Administration |
| NDVI | Normalized difference vegetation index |
| NDWI | Normalized difference wetness index |
| NIR | Near infra-red |
| NRT | Near real-time |
| RTK | Real time kinematic |
| SMC | Soil moisture content |
| VIIRS | Visible infra-red imaging radiometer suite |
References
- Anda, M.; Ritung, S.; Suryani, E.; Sukarman; Hikmat, M.; Yatno, E.; Mulyani, A.; Subandiono, R.E.; Suratman; Husnain. Revisiting Tropical Peatlands in Indonesia: Semi-Detailed Mapping, Extent and Depth Distribution Assessment. Geoderma 2021, 402, 115235. [Google Scholar] [CrossRef]
- Adji, T.N.; Agniy, R.F.; Cahyadi, A.; Haryono, E.; Nurkholis, A. Karakteristik Sistem Aliran Sungai Bawah Tanah di Kawasan Karst Jonggrangan Dengan Tracer Test; Center for Open Science: Charlottesville, VA, USA, 2019. [Google Scholar]
- Ratai, J.; Teh, C.B.S.; Tan, N.P.; Mohidin, H.; Goh, K.J.; Sangok, F.E.; Melling, L. Tropical Peat Soil Changes across Successive Oil Palm Generations in Sarawak, Malaysia. Heliyon 2024, 10, e37754. [Google Scholar] [CrossRef] [PubMed]
- Adesiji, R.A.; Adeoye, P.A.; Gbadebo, A.O. Effects of Water Table Fluctuations on Peatland—A Review. Sch. J. Eng. Technol. 2014, 2, 482–487. [Google Scholar]
- Novita, N.; Asyhari, A.; Ritonga, R.P.; Gangga, A.; Anshari, G.Z.; Jupesta, J.; Bowen, J.C.; Lestari, N.S.; Kauffman, J.B.; Hoyt, A.M.; et al. Strong Climate Mitigation Potential of Rewetting Oil Palm Plantations on Tropical Peatlands. Sci. Total Environ. 2024, 952, 175829. [Google Scholar] [CrossRef]
- Wardani, I.K.; Suwardi; Darmawan; Sumawinata, B. A Critical Contribution on Understanding the Mechanism and Implication of Peat Irreversible Drying. IOP Conf. Ser. Earth Environ. Sci. 2019, 393, 012055. [Google Scholar] [CrossRef]
- Zhao, H.F.; Jommi, C. Consequences of Drying on the Hydro-Mechanical Response of Fibrous Peats upon Compression. Can. Geotech. J. 2022, 59, 1712–1727. [Google Scholar] [CrossRef]
- Sangok, F.E.; Maie, N.; Melling, L.; Watanabe, A. Evaluation on the Decomposability of Tropical Forest Peat Soils after Conversion to an Oil Palm Plantation. Sci. Total Environ. 2017, 587–588, 381–388. [Google Scholar] [CrossRef]
- Tikkasalo, O.-P.; Peltola, O.; Alekseychik, P.; Heikkinen, J.; Launiainen, S.; Lehtonen, A.; Li, Q.; Martínez-García, E.; Peltoniemi, M.; Salovaara, P.; et al. Eddy-Covariance Fluxes of CO2, CH4 and N2O in a Drained Peatland Forest after Clear-Cutting. Biogeosciences 2025, 22, 1277–1300. [Google Scholar] [CrossRef]
- Tonks, A.J.; Aplin, P.; Beriro, D.J.; Cooper, H.; Evers, S.; Vane, C.H.; Sjögersten, S. Impacts of Conversion of Tropical Peat Swamp Forest to Oil Palm Plantation on Peat Organic Chemistry, Physical Properties and Carbon Stocks. Geoderma 2017, 289, 36–45. [Google Scholar] [CrossRef]
- Gautama, D.A.W.; Perkasa, P.; Tuah. Analisis Pemadaman Kebakaran Hutan dan Lahan di Indonesia Yang Dipengaruhi Oleh Fenomena El Nino Dengan Metode Water Bombing. BALANGA J. Pendidik. Teknol. Kejuru. 2023, 11, 74–85. [Google Scholar] [CrossRef]
- Susetyo, E.S.H. Buku Statistik Kementerian Lingkungan Hidup dan Kehutanan; Pusat Data dan Informasi: South Tangerang, Indonesia, 2023; Volume IX, ISBN 3063-8399. [Google Scholar]
- Anhar, I.P.; Mardiana, R.; Sita, R. Dampak Kebakaran Hutan dan Lahan Gambut Terhadap Manusia dan Lingkungan Hidup (Studi Kasus: Desa Bunsur, Kecamatan Sungai Apit, Kabupaten Siak, Provinsi Riau). J. Sains Komun. Pengemb. Masy. JSKPM 2022, 6, 75–85. [Google Scholar] [CrossRef]
- Apers, S.; De Lannoy, G.J.M.; Baird, A.J.; Cobb, A.R.; Dargie, G.C.; del Aguila Pasquel, J.; Gruber, A.; Hastie, A.; Hidayat, H.; Hirano, T.; et al. Tropical Peatland Hydrology Simulated with a Global Land Surface Model. J. Adv. Model. Earth Syst. 2022, 14, e2021MS002784. [Google Scholar] [CrossRef] [PubMed]
- Mortelmans, J.; Felsberg, A.; De Lannoy, G.J.M.; Veraverbeke, S.; Field, R.D.; Andela, N.; Bechtold, M. Improving the Fire Weather Index System for Peatlands Using Peat-Specific Hydrological Input Data. Nat. Hazards Earth Syst. Sci. 2024, 24, 445–464. [Google Scholar] [CrossRef]
- Taufik, M.; Widyastuti, M.T.; Sulaiman, A.; Murdiyarso, D.; Santikayasa, I.P.; Minasny, B. An Improved Drought-Fire Assessment for Managing Fire Risks in Tropical Peatlands. Agric. For. Meteorol. 2022, 312, 108738. [Google Scholar] [CrossRef]
- Soil Survey Staff. Soil Taxonomy: A Basic System of Soil Classification for Making and Interpreting Soil Surveys, 2nd ed.; Agricultural Handbook No. 436; USDA, Natural Resources Conservation Service: Washington, DC, USA, 1999; ISBN 0160608295.
- Dulal, D. Hymenachne Acutigluma (Steud.) Gilliland in GBS 20:314—An Exceptionally Important Perennial Grass for Anatomy and Indigenous Practice. Int. J. Bioassays 2016, 5, 4958–4960. [Google Scholar] [CrossRef]
- Toebes, C.; Morrissey, W.B.; Shorter, R.; Hendy, M. Base Flow Recession Curves. In Handbook of Hydrological Procedures: Procedure No. 8; A.R. Shearer: Wellington, New Zealand, 1969. [Google Scholar]
- Kriegler, F.J.; Malila, W.A.; Nalepka, R.F.; Richardson, W. Preprocessing Transformations and Their Effects on Multispectral Recognition. In Proceedings of the Sixth International Symposium on Remote Sensing of Environment, Ann Arbor, MI, USA, 19–21 October 2026. [Google Scholar]
- Rouse, J.W.; Haas, R.H.; Schell, J.A.; Deering, D.W.; Harlan, J.C. Monitoring the Vernal Advancement and Retrogradation (Greenwave Effect) of Natural Vegetation; NASA: Washington, DC, USA, 1974.
- McFeeters, S.K. Using the Normalized Difference Water Index (NDWI) within a Geographic Information System to Detect Swimming Pools for Mosquito Abatement: A Practical Approach. Remote Sens. 2013, 5, 3544–3561. [Google Scholar] [CrossRef]
- Cui, W.; Hu, Y.; Rein, G. Experimental Study of the Ignition Conditions for Self-Sustained Smouldering in Peat. Proc. Combust. Inst. 2023, 39, 4125–4133. [Google Scholar] [CrossRef]
- Kartiwa, B.; Maswar; Dariah, A.; Suratman; Nurida, N.L.; Heryani, N.; Rejekiningrum, P.; Sosiawan, H.; Adi, S.H.; Lenin, I.; et al. Modeling of Peatland Fire Risk Early Warning Based on Water Dynamics. Glob. J. Environ. Sci. Manag. 2023, 9, 233–250. [Google Scholar] [CrossRef]
- Ismail, I.; Haghighi, A.T.; Marttila, H.; Kurniawan, U.; Karyanto, O.; Kløve, B. Water Table Variations on Different Land Use Units in a Drained Tropical Peatland Island of Indonesia. Hydrol. Res. 2021, 52, 1372–1388. [Google Scholar] [CrossRef]
- Lambert, C.; Larocque, M.; Gagné, S.; Garneau, M. Aquifer-Peatland Hydrological Connectivity and Controlling Factors in Boreal Peatlands. Front. Earth Sci. 2022, 10, 835817. [Google Scholar] [CrossRef]
- Suryatmojo, H.; Ali Imron, M.; Ahmad Arfri, R.; Maryani, M. Neraca Air Ekosistem Hutan Alam Gambut di Kawasan Taman Nasional (TN) Zamrud, Semenanjung Kampar Riau. J. Penelit. Hutan Konserv. Alam 2022, 19, 85–100. [Google Scholar] [CrossRef]
- Page, S.; Rieley, J.O.; Banks, C. Global and Regional Importance of the Tropical Peatland Carbon Pool. Glob. Change Biol. 2010, 17, 798–818. [Google Scholar] [CrossRef]
- Hirano, T.; Jauhiainen, J.; Inoue, T.; Takahashi, H. Controls on the Carbon Balance of Tropical Peatlands. Ecosystems 2009, 12, 873–887. [Google Scholar] [CrossRef]
- Usup, A.; Hashimoto, Y.; Takahashi, H.; Hayasaka, H. Combustion and Thermal Characteristics of Peat Fire in Tropical Peatland in Central Kalimantan, Indonesia. Tropics 2004, 14, 1–19. [Google Scholar] [CrossRef]
- Zhang, L.; Zhang, H.; Niu, Y.; Han, W. Mapping Maizewater Stress Based on UAV Multispectral Remote Sensing. Remote Sens. 2019, 11, 605. [Google Scholar] [CrossRef]
- Gu, Y.; Brown, J.F.; Verdin, J.P.; Wardlow, B. A Five-year Analysis of MODIS NDVI and NDWI for Grassland Drought Assessment over the Central Great Plains of the United States. Geophys. Res. Lett. 2007, 34, L06407. [Google Scholar] [CrossRef]
- Gao, B.-C. NDWI—A Normalized Difference Water for Remote Sensing of Vegetation Water from Space. Remote Sens. Environ. 1996, 7212, 257–266. [Google Scholar] [CrossRef]
- Nebiker, S.; Annen, A.; Scherrer, M.; Oesch, D. Light-Weight Multispectral Sensor for Micro UAV-Opportunities for Very High Resolution Airborne Remote Sensing. In Proceedings of the International Archives of the Photogrammetry, Remote Sensing and Spatial Information Sciences, Beijing, China, 3–11 July 2008. [Google Scholar]
- Lelong, C.C.D.; Burger, P.; Jubelin, G.; Roux, B.; Labbé, S.; Baret, F. Assessment of Unmanned Aerial Vehicles Imagery for Quantitative Monitoring of Wheat Crop in Small Plots. Sensors 2008, 8, 3557–3585. [Google Scholar] [CrossRef] [PubMed]
- Roy, D.P.; Wulder, M.A.; Loveland, T.R.; Woodcock, C.E.; Allen, R.G.; Anderson, M.C.; Helder, D.; Irons, J.R.; Johnson, D.M.; Kennedy, R.; et al. Landsat-8: Science and Product Vision for Terrestrial Global Change Research. Remote Sens. Environ. 2014, 145, 154–172. [Google Scholar] [CrossRef]
- Morales-Barquero, L.; Lyons, M.B.; Phinn, S.R.; Roelfsema, C.M. Trends in Remote Sensing Accuracy Assessment Approaches in the Context of Natural Resources. Remote Sens. 2019, 11, 2305. [Google Scholar] [CrossRef]
- Junedi, H.; Mastur, A.K.; dan Arsyad, A. Study of the Critical Limits of the Ground Water for Peatland Fire Prevention. In Proceedings of the 3rd Green Development International Conference (GDIC 2020), Jambi, Indonesia, 2–3 October 2020. [Google Scholar]
- Frandsen, W.H. Ignition Probability of Organic Soils. Can. J. For. Res. 1997, 27, 1471–1477. [Google Scholar] [CrossRef]
- Rein, G.; Cleaver, N.; Ashton, C.; Pironi, P.; Torero, J.L. The Severity of Smouldering Peat Fires and Damage to the Forest Soil. Catena 2008, 74, 304–309. [Google Scholar] [CrossRef]
- Prior, L.D.; French, B.J.; Storey, K.; Williamson, G.J.; Bowman, D.M.J.S. Soil Moisture Thresholds for Combustion of Organic Soils in Western Tasmania. Int. J. Wildland Fire 2020, 29, 637–647. [Google Scholar] [CrossRef]
- Tan, I.; Oreopoulos, L.; Cho, N. The Role of Thermodynamic Phase Shifts in Cloud Optical Depth Variations with Temperature. Geophys. Res. Lett. 2019, 46, 4502–4511. [Google Scholar] [CrossRef]
- Karurung, W.S.; Lee, K.; Lee, W. Assessment of Forest Fire Vulnerability Prediction in Indonesia: Seasonal Variability Analysis Using Machine Learning Techniques. Int. J. Appl. Earth Obs. Geoinf 2025, 138, 104435. [Google Scholar] [CrossRef]
- Page, S.E.; Siegert, F.; Rieley, J.O.; Boehm, H.-D.V.; Jaya, A.; Limin, S. The Amount of Carbon Released from Peat and Forest Fires in Indonesia during 1997. Nature 2002, 420, 61–65. [Google Scholar] [CrossRef] [PubMed]
- Wooster, M.J.; Perry, G.L.W.; Zoumas, A. Fire, Drought and El Niño Relationships on Borneo (Southeast Asia) in the Pre-MODIS Era (1980–2000). Biogeosciences 2012, 9, 317–340. [Google Scholar] [CrossRef]
- Field, R.D.; Van Der Werf, G.R.; Fanin, T.; Fetzer, E.J.; Fuller, R.; Jethva, H.; Levy, R.; Livesey, N.J.; Luo, M.; Torres, O.; et al. Indonesian Fire Activity and Smoke Pollution in 2015 Show Persistent Nonlinear Sensitivity to El Niño-Induced Drought. Proc. Natl. Acad. Sci. USA 2016, 113, 9204–9209. [Google Scholar] [CrossRef] [PubMed]
Disclaimer/Publisher’s Note: The statements, opinions and data contained in all publications are solely those of the individual author(s) and contributor(s) and not of MDPI and/or the editor(s). MDPI and/or the editor(s) disclaim responsibility for any injury to people or property resulting from any ideas, methods, instructions or products referred to in the content. |
© 2025 by the authors. Licensee MDPI, Basel, Switzerland. This article is an open access article distributed under the terms and conditions of the Creative Commons Attribution (CC BY) license.