Abstract
Background: Recent studies have highlighted the significant impact of combined thermal and lighting conditions on human comfort. However, there is limited understanding of how these factors influence cognitive performance in older adults. This study explored the effects of complex thermal and lighting conditions on various cognitive functions and physiological responses in older adults. Additionally, a predictive cognitive model was developed using physiological indicators as well as demographic factors. Methods: Twenty-two older adults participated in a within-subject design experiment under different thermal and lighting combinations. The study focused on two temperature conditions, 18 °C and 28 °C, and two lighting conditions, 480 nm with 5500 K and 644 nm with 3200 K. Conclusions: The finding showed that males significantly performed better at 18 °C under 480 nm lighting, while females excelled at 28 °C under 644 nm lighting. Electrodermal activity (EDA) increased in warmer conditions with warmer lighting, and pupil size expanded similarly but decreased under cooler conditions. Males’ EDA was negatively correlated with cognitive performance, while females’ pupil size and BMI were positively correlated. Using the classification and regression tree (CART) algorithm, predictive model demonstrated 89.7% accuracy. These findings emphasize the potential of optimizing thermal and lighting conditions to enhance cognitive functions and predict performance in older adults
1. Introduction
Preserving cognitive health in older adults is emerging as one of the defining challenges of this century. The urgency of this challenge is underscored by the reality that every 3.2 s, someone is newly diagnosed with dementia [1]. Currently, over 55 million people worldwide are living with dementia, a number expected to rise to 139 million by 2050. Approximately 1 in 9 individuals aged 65 and older (10.9%) are affected by Alzheimer’s disease, with an additional 22% experiencing mild cognitive impairment [2]. Although a pharmacological solution for age-related cognitive decline remains out of reach, there is growing optimism around non-pharmacological interventions, particularly those focused on the built environment [3]. Consequently, the role of built environment features have become a crucial area of research aimed at preserving cognitive health in older adults to foster healthy aging and support aging-in-place [4]. Given that older adults spend up to 90% of their time indoors [5], understanding how indoor environments affect cognitive function is vital for developing effective interventions.
Among various environmental influences, indoor temperature and lighting conditions stand out as especially significant. Temperature is essential not only for physical well-being Indoor temperature plays a crucial role in creating an environment that supports both physical well-being [6,7,8,9,10,11,12] but also for managing and enhancing cognitive performance [12,13,14,15,16]. Prior studies indicate that cooler indoor temperatures and thermal sensations are associated with enhanced cognitive outcomes [17]. For example, Wolkoff et al. [18] suggested that both cognitive and work performance, treated as interrelated outcomes influenced by the same cognitive mechanisms, were optimal within the 22 °C to 24 °C range for temperate or cold climates, while deviations from this range impaired learning efficiency. Another study also confirmed that unfavorable air temperatures significantly impacted physiological responses and cognitive functions among indoor workers [19]. Even within the thermally comfortable range, higher air temperatures (26 °C and 28 °C) led to poorer cognitive performance compared to cooler conditions like 24 °C [14]. Furthermore, predictive models using skin temperature have been developed to estimate cognitive performance under different thermal conditions [16,17], highlighting the influence of demographic factors such as gender and BMI in these predictions.
Similarly, the role of light is increasingly recognized for its substantial influence on both psychological and physiological health, especially through non-visual pathways [20,21,22]. Non-visual pathways refer to light signals transmitted via intrinsically photosensitive retinal ganglion cells (ipRGCs), which regulate the rhythmic functions of the suprachiasmatic nuclei (SCN) [23,24,25], enhance alertness and productivity [26,27,28,29], and influence specific brain functions [30,31,32,33]. Studies have identified optimal lighting for cognitive efficiency, with high illuminance (700 lux) and neutral white light (4000 K CCT) outperforming cooler light conditions (6500 K CCT) [34]. Another study by Lu et al. [35] showed that neutral color temperatures significantly enhanced reading efficiency across different illuminance and CCT combinations. Additionally, Kim et al. [8] introduced a productivity predictive model based on pupil size and gender data, considering various lighting conditions using the LightGBM algorithm. They achieved an accuracy of 94.7% by optimizing the combination of input factors and improving the model’s performance.
Older adults, compared to younger populations, exhibit distinct responses to thermal and lighting environments, making it critical to focus research specifically on them. Notably, studies have found a significant relationship between higher ambient temperature exposure and cognitive impairment in older adults, with risks increasing with prolonged exposure [36,37]. Each 1 °C rise in high monthly temperatures correlated with a 0.48 point decline in global cognitive function scores, while a 1 °C drop in low temperatures led to a 0.14 point decline [37]. For lighting conditions, Son et al. [30] revealed that higher nighttime indoor lighting intensity positively correlated with cognitive measures, while nighttime CCT exposure had negative effects. In addition, Wang et al. [38] found that increasing CCT improved task performance, while higher illuminance did not, with 750 lux performing worst for visual tasks. Compared to younger adults, older adults also prefer warmer temperatures and exhibit greater thermal sensitivity [39], with a 2.4 °C higher neutral temperature [40]. Notably, while younger adults adapted better under warm lighting, older adults performed better under cool lighting conditions [41].
Growing evidence indicates that indoor environmental factors may not only affect daily cognition but also contribute to long-term dementia risk and symptom management. People living with dementia often perceive their physical surroundings differently from people who do not live with dementia [42]. Biodynamic lighting interventions have been found to stabilize sleep–wake cycles and reduce agitation among people with dementia [43,44]. This suggests that carefully designed lighting environments could play a role in cognitive and behavioral well-being in older adults. Tartarini et al. [45] found that cumulative exposure to temperatures above 26 °C and below 20 °C was linearly correlated with increased agitation in nursing home residents with dementia, suggesting that deviations from the thermal comfort zone exacerbate behavioral symptoms. Additionally, Childs et al. [46] found that residents with dementia were more likely to feel cold and showed lower extremity skin temperatures and signs of peripheral vasoconstriction, highlighting their vulnerability to indoor temperature changes.
Despite these important insights, a comprehensive understanding of how combined thermal and lighting environments affect physiological responses and cognitive performance in older adults remains limited. Although some studies have explored the combined or cross-effects of these conditions [30,47,48,49,50,51], the majority of this research has focused primarily on young adults and their comfort levels. Meanwhile, existing evidence shows that older adults respond differently to environmental factors compared to younger individuals [36,52], underscoring the urgent need for focused studies on older adults’ cognitive performance under diverse indoor conditions.
To address this research gap, the purpose of this study is to examine the combined impact of thermal and lighting conditions on various cognitive performance and physiological signals in older adults. This research incorporates demographic factors, such as gender and BMI, to enable a more personalized analysis of how indoor environments may differentially affect cognitive outcomes. Ultimately, this study aims to develop predictive models that utilize physiological signals and demographic factors to optimize indoor thermal and lighting environments for enhancing cognitive health and overall well-being in older adults.
2. Materials and Methods
2.1. Experiment Setting
To examine the impact of thermal and lighting conditions on older adults’ cognitive performance, 22 participants each completed four within-participant experimental sessions in a controlled environment at Arizona State University (ASU). The experimental room, measuring 5 m in depth, 4 m in width, and 3 m in height, included a window facing a corridor, which was covered to minimize external light interference. The building’s central HVAC system was deactivated, and portable HVAC units were employed to maintain two stable room temperatures: 18 °C and 28 °C. These temperatures were selected to represent a deviation of ±5 °C from ASHRAE’s recommended comfort range for typical office settings (23 °C). Indoor temperatures were continuously monitored using sensors and data acquisition devices from Vernier Software & Technology (Beaverton, OR, USA).
Lighting conditions were controlled with standing lights that provided peak wavelengths of 480 nm (5500 K) and 644 nm (3200 K), as illustrated in Figure 1. Illuminance levels were set at 300 lux, measured at sitting eye height. An SECONIC C-7000 spectrometer (Sekonic Corporation, Tokyo, Japan) ensured consistent lighting throughout the experiments. Electrodermal activity (EDA) and pupil size were measured using the EmbracePlus smartwatch (Empatica Inc., Milan, Italy) and the Tobii Pro Glasses 3 (Tobii AB, Stockholm, Sweden), respectively. Participants completed a demographic survey, which included questions about age, gender, and BMI, and then watched a documentary presented on an iPad. The survey, created on the secure online platform REDCap, was completed using the same device.
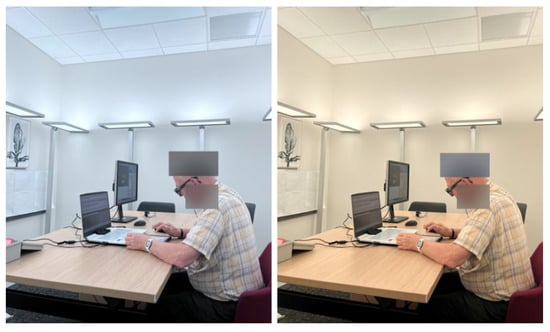
Figure 1.
A participant wearing devices while performing cognitive tasks in each different indoor thermal and lighting conditions (480 nm, 5500 K; 644 nm, 3200 K).
2.2. Experiment Procedure
Figure 2 illustrates the experiment procedure. Participants were randomly assigned to experimental conditions and completed all conditions over four laboratory visits, following a within-subjects design. The lighting and temperature conditions were pre-set before the participants’ arrival. Upon entering the room, participants were provided with instructions, and they were asked to complete an initial survey on an iPad to provide demographic information, which took 10 min. Participants were then kept in the assigned combined thermal and lighting conditions for 30 min to acclimate. During this period, a documentary series was played to aid in adaptation. Next, cognitive performance assessments were administered, requiring 20 min to complete while their physiological signals were recorded. All experimental activities, including a demographic survey, adjusting to the environment, cognitive tasks, and physiological monitoring, were completed in one session. Participants were exposed to each experimental condition for a total of 50 min, and physiological data were recorded every minute while they were performing cognitive tasks. The collected data were securely stored on a cloud server managed by ASU.
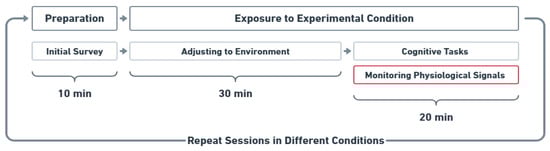
Figure 2.
Experimental procedure: Participants completed four experimental conditions in a within-subjects design, each involving a 50 min session with acclimation and cognitive tasks. After 30 min of acclimation, participants performed eight tasks for 20 min, during which EDA and pupil size were recorded.
2.3. Cognitive Performance Measurement
Cognitive performance was measured through a brief, tablet-based cognitive battery (Joggle Research) that participants completed. During the initial meeting, participants received thorough instructions and ample time to practice with the tablet and cognitive tasks, ensuring they were comfortable with the device and familiar with the tasks before starting the sessions. This battery, consisting of eight tasks, required around 20 min to complete and covered various cognitive domains. These included working memory (fractal 2-back, NBack) [53], visual learning and spatial working memory (Visual Object Learning Task, VOLT) [54], abstraction (Abstract Matching, AM) [55], spatial orientation (Line Orientation Task, LOT) [56], complex scanning and visual tracking (Digit Symbol Substitution Task, DSST) [57], vigilant attention (Psychomotor Vigilance Test, PVT) [58,59], sensory motor speed (Motor Praxis Task, MPT) [60], and risk decision-making (Balloon Analog Risk Task, BART) [58,61]. While each of these tests has been extensively individually validated, this specific battery of tests has also been used in a variety of circumstances to assess cognition, such as space flight, shift work) [62,63]. These tasks have been widely adopted in prior studies investigating cognitive performance in various populations [30,64,65]. While direct psychometric comparisons with MoCA [66] or MMSE [67] are limited, its tasks assess core cognitive domains such as processing speed, attention, and motor praxis, which overlap substantially with standard tools. The digital platform allows for precise, repeatable measurement and scalability, making it suitable for both lab-based and remote assessment. According to Fan et al. [68], the cognitive test batteries were categorized into five major cognitive domains. The memory domain incorporated both the NBACK and the VOLT, while the visual and spatial perception domain included the AM and LOT. The attention and concentration domain classified the PVT and the DSST together. Meanwhile, the motor skills and construction domain consisted of the MPT. Lastly, the executive function domain included the BART.
2.4. Participants
A total of 22 participants (n = 22), all older adults aged 65 years or older, were recruited for the study. The participants had a mean age of 75.15 years (SD = 5.25), ranging from 66 to 85 years, and included 9 males and 13 females. The BMI statistics for the participants showed a mean of 26.28 (SD = 5.10), with values ranging from 18.84 to 35.98. Eligibility required participants to be in good health, as reported in their medical history. Individuals using or intending to use light therapy or light-altering devices, such as blue-blocking glasses, tinted glasses, or contact lenses, were excluded. Additionally, those with planned travel during the study period were not eligible to participate. Recruitment began in January 2024 and continued until June 2024 through presentations and flyer distribution. All experimental sessions were also conducted during the same period as participant recruitment to ensure temporal consistency. Prospective participants underwent an initial 60 min screening process to determine eligibility. Those deemed eligible were provided with detailed information about the study, and written consent was obtained by the research team. The study was approved by the Institutional Review Board (IRB) at ASU (STUDY00018069). All procedures were conducted in accordance with the university’s ethical guidelines for research involving human participants.
2.5. Data Analysis
In this study, a Mixed-Effects Model was used to analyze how various outcome variables, such as physiological signals and cognitive performance, differed across experimental conditions. Each participant was exposed to multiple conditions, with participant ID treated as a random effect to account for individual variability. The experimental condition was included as a fixed effect, while age was incorporated as a covariate to control for its influence on the outcomes. The statistical software R (version 4) was used to implement the model and perform the analyses. To assess the significance of the fixed effects, Type III Analysis of Variance (ANOVA) was conducted, with F-tests used to determine whether the predictors contributed significantly to the variation in the dependent variables. Restricted Maximum Likelihood (REML) estimation was used to estimate model parameters [69,70], and Satterthwaite’s approximation was applied to calculate the degrees of freedom for the fixed effects [71]. This approach enabled a detailed analysis of how the outcome variables varied across conditions, accounting for both random effects (participant differences) and fixed effects (experimental conditions). In cases where significant effects were found, post hoc pairwise comparisons of estimated marginal means were conducted using the emmeans package in R, applying the Tukey adjustment for multiple comparisons. A correlation analysis was also conducted to examine the relationships between physiological signals, BMI, and cognitive task scores across different genders. This analysis provided an overall understanding of the relationships between factors before developing the predictive model. Additionally, it helped identify potential multicollinearity among input factors prior to proceeding with the model development.
2.6. Predictive Model Development
The classification and regression tree (CART) algorithm is used to develop a predictive cognitive performance model for older adults. The CART algorithm is a widely used machine learning method for tasks such as classification, regression, and prediction [72,73,74,75]. The algorithm builds a tree-like structure by recursively splitting the dataset or nodes based on questions about the values of independent variables [76]. At the top of the structure is the root node, containing all dataset observations. Nodes that split are parent nodes, their divisions are child nodes, and nodes that cannot split further are terminal nodes. The Gini index is used as a criterion for splitting nodes by calculating the total squared probabilities of all classes at a given node [77]. It classifies decision points in the dataset and applies splitting rules that enhance the performance of the CART algorithm, resulting in an optimal decision tree. It is also used to determine the Gini coefficient, a variation in the index, which measures the likelihood of a variable being misclassified when selected randomly. The Gini index is defined as Gini = 1 − ∑(Pi)2, where Pi represents the probability of an object being classified into a particular class. In this analysis, pre-pruning was applied to control the growth of the decision tree using specific criteria. The maximum tree depth was limited to 8, and terminal nodes were required to have a minimum of 3 observations, with a maximum of 1024 considered during experimentation. Additionally, the minimum number of observations required to split an internal node was set to 10. For validation, 10-fold cross-validation was performed using a random seed of 12345 to ensure reproducibility. The standard error of the minimum misclassification cost was determined to be 1, and the optimal tree was selected based on the criterion of minimizing misclassification cost. The modeling and validation processes were conducted in Minitab (version 22), leveraging its tools for structured data analysis. The input factors for the predictive model included two physiological signals (EDA and pupil size), two demographic factors (gender and BMI), and indoor conditions, which combined thermal and lighting conditions. Age was excluded from the model due to its high collinearity with other variables, which could have introduced instability. Since the study specifically targeted older adults, this exclusion also allowed the model to focus on other demographics, such as gender and BMI, and physiological factors. To evaluate the impact of different variable combinations, the model’s performance was assessed by comparing accuracy across various combinations of input variables. A receiver operating characteristic (ROC) curve was used to display the model’s ability to distinguish between classes at various thresholds, offering a visual evaluation of its performance in terms of sensitivity and specificity [78]. It plots sensitivity (true positive rate) against 1-specificity (false positive rate) at various classification thresholds, providing a visual representation of the trade-off between correctly identifying positive cases and avoiding false positives [79]. The area under the ROC curve (AUC) quantifies the model’s overall discriminatory ability, with values closer to 1 indicating better performance. AUC was calculated separately for the training and test datasets to assess the model’s generalization capability [80].
3. Results
3.1. The Effect of Thermal and Lighting Conditions on Cognitive Performance
The mean values for each cognitive performance task under different thermal and lighting conditions and by gender are presented in Figure 3. Scores from eight different tasks, including Nback, VOLT, AM, LOT, PVT, DSST, MPT, and BART, were each influenced differently by the combined temperature and lighting condition. For detailed analysis, these tasks were divided into five cognitive domains to explore how these environmental factors influenced each cognitive domain, and the pairwise comparisons and groupings based on Tukey post hoc analysis are provided in Appendix A.
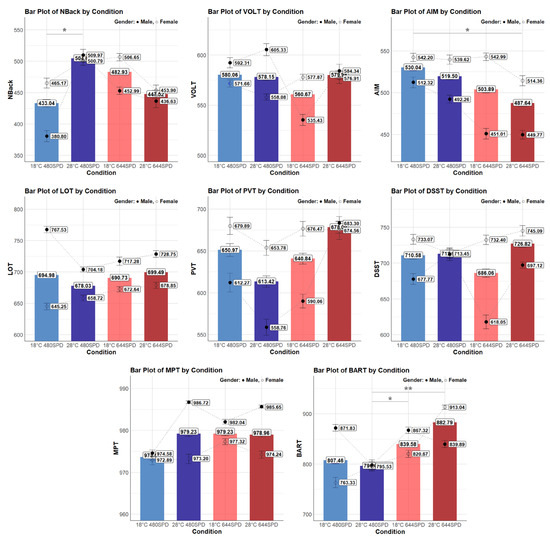
Figure 3.
Individual cognitive performance task by condition and gender. Asterisks denote statistical significance derived from the combined-gender analysis only (* p < 0.05; ** p < 0.01). Bars represent overall means, while markers indicate male (●) and female (○) group means.
3.1.1. Individual Cognitive Domains
Memory
The mean NBack score differed significantly across different conditions (F(3, 129.91) = 2.90, p = 0.037). Specifically, the NBack score was significantly higher at 28 °C 480 nm compared to 18 °C 480 nm (p = 0.049), with a difference of 60.4 points. These results indicate that the NBack score was significantly higher under the warmer temperature (28 °C) compared to the cooler temperature (18 °C) in the same lighting condition. However, other pairwise comparisons did not show significant differences between conditions. Female participants did not exhibit a significant difference in NBack scores (F(3, 76.31) = 0.45, p = 0.718). However, male participants demonstrated a significant difference in NBack scores (F(3, 50.43) = 4.44, p = 0.008). In the male group, the NBack score was significantly higher at 28 °C 480 nm than 18 °C 480 nm (p < 0.001) with a difference of 129.3 points. These findings indicate that within the same lighting condition (480 nm), a warmer temperature (28 °C) resulted in a higher NBack score, especially in the male group. On the other hand, the mean VOLT score did not differ significantly across different conditions (F(3, 149.09) = 1.33, p = 0.266). Similarly, in the female group, the VOLT score did not show significant differences across conditions (F(3, 86.11) = 0.37, p = 0.775). However, in the male group, the VOLT score differed significantly across conditions (F(3, 60.00) = 4.96, p = 0.004). Specifically, the 18 °C 644 nm condition showed the lowest score of 535.43 points and was significantly different from all other conditions, including 28 °C 644 nm (p = 0.043) with a difference of −48.8 points, 28 °C 480 nm (p = 0.005) with a difference of −62.6 points, and 18 °C 480 nm (p = 0.016) with a difference of −55.8 points. These results indicate that in the male group, the VOLT score was significantly lower under cooler ambient temperatures (18 °C) and warmer lighting conditions (644 nm).
Visual and Spatial Perception
The mean AM score differed significantly across different conditions (F(3, 147.12) = 3.92, p = 0.010). Specifically, the AM score was significantly higher at 18 °C 480 nm compared to 28 °C 644 nm (p = 0.012), with a difference of 40.4 points. These results indicate that AM score was significantly higher under the cooler ambient temperature (18 °C) and cooler lighting condition (480 nm) compared to the warmer temperature (28 °C) and warmer lighting condition (664 nm). However, other pairwise comparisons did not show significant differences between conditions. Overall, the female group showed higher AM scores than the male group across different conditions. Female participants did not exhibit a significant difference in AM scores (F(3, 84.09) = 1.04, p = 0.378). However, male participants demonstrated a significant difference in AM scores (F(3, 60.00) = 3.87, p = 0.013). In the male group, the AM score was significantly higher at 18 °C 480 nm compared to 18 °C 644 nm (p = 0.042) with a difference of 57.7 points, and higher at 18 °C 480 nm compared to 28 °C 644 nm with a difference of 60.6 points. These findings indicate that within the same temperature (18 °C), a cooler lighting (480 nm) condition resulted in a higher AM score. Furthermore, a cooler temperature (18 °C) and a cooler lighting condition (480 nm) contributed to a higher AM score. On the other hand, the mean LOT score did not differ significantly across conditions (F(3, 149.05) = 2.59, p = 0.055), but it was marginally significant. Overall, the male group showed higher LOT scores than the female group across different conditions. In the female group, the LOT score did not show significant differences across conditions (F(3, 86.05) = 2.50, p = 0.065). However, in the male group, the LOT score differed significantly across conditions (F(3, 60.00) = 9.67, p < 0.001). Specifically, the 18 °C 480 nm condition was significantly higher than all other conditions, including 28 °C 644 nm (p = 0.027) with a difference of 36.2 points, 18 °C 644 nm (p = 0.003) with a difference of 46.2 points, and 28 °C 644 nm (p = 0.027) with a difference of 36.2 points. These results indicate that, in the male group, the LOT score was significantly higher under cooler temperatures (18 °C) and cooler lighting conditions (480 nm).
Attention and Concentration
The mean PVT score showed significant differences across conditions (F(3, 137.96) = 3.05, p = 0.031); however, no significant pairwise comparisons were found between conditions. Overall, PVT scores were higher in females than in males, except in the 28 °C 644 nm. In the female group, the PVT score did not differ significantly across conditions (F(3, 79.02) = 0.63, p = 0.596). In contrast, the male group showed significant differences in PVT scores across conditions (F(3, 55.89) = 3.54, p = 0.020). Specifically, the score under 28 °C 644 nm condition was significantly higher than 18 °C 644 nm (p = 0.036) with a difference of 103.5 points. These results indicate that in the male group, the PVT score was significantly higher under warmer temperature (28 °C) compared to cooler temperature (18 °C) at the same lighting condition (644 nm). On the other hand, the mean DSST score did not differ significantly across different conditions (F(3, 146.97) = 0.27, p = 0.845). Overall, the female group showed higher DSST scores than the male group across the different conditions. However, in the female group, the DSST score differed significantly across conditions (F(3, 86.02) = 3.94, p = 0.011). Specifically, the score under the 18 °C 644 nm was significantly higher than the 28 °C 480 nm (p = 0.015) with a difference of 54.6 points, and the score under the 28 °C 644 nm was also significantly higher than the 28 °C 480 nm (p = 0.028) with a difference of 49.4 points. These results indicate that in the female group, the DSST score was significantly higher under cooler temperature (18 °C) and warmer lighting conditions (644 nm). In the male group, the DSST score also showed significant differences across conditions (F(3, 57.97) = 6.02, p = 0.001). Specifically, the score under the 28 °C 480 nm was significantly higher than 28 °C 644 nm (p = 0.025) with a difference of 65.9 points, and 18 °C 644 nm (p = 0.001) with a difference of 84.9 points. These results indicate that in the male group, the DSST score was significantly higher under warmer temperatures (28 °C) and cooler lighting conditions (480 nm).
Motor Skills and Construction
The mean MPT score did not differ significantly across different conditions (F(3, 147.11) = 2.04, p = 0.111). Overall, the male group showed higher MPT scores than the female group across the different conditions. Female participants did not exhibit a significant difference in MPT scores (F(3, 84.17) = 0.90, p = 0.445). However, male participants demonstrated a significant difference in MPT scores (F(3, 60.00) = 55.42, p = 0.002). In the male group, the MPT score was significantly higher at 28 °C 480 nm compared to 18 °C 480 nm (p = 0.003) with a difference of 9.78 points, and higher at 28 °C 644 nm compared to 18 °C 480 nm (p = 0.009) with a difference of 8.89 points. These findings indicate that within the same lighting condition (480 nm), a warmer temperature resulted in a higher MPT score. Furthermore, both warmer lighting condition (644 nm) and a warmer temperature (28 °C) contributed to a higher MPT score.
Execution Function
The mean BART score showed significant differences across different conditions (F(3, 149.20) = 4.74, p = 0.003). Specifically, the score under 28 °C 644 nm was significantly higher than 28 °C 480 nm (p = 0.005), with a difference of 104.5 points, and the score under 18 °C 644 nm was significantly higher than 28 °C 480 nm (p = 0.039), with a difference of 83.8 points. These results indicate that the BART score was significantly higher under the warmer lighting condition (644 nm) compared to the cooler lighting condition (480 nm) at the same temperature (28 °C). Moreover, the BART score under the cooler temperature (18 °C) and warmer lighting condition (644 nm) was significantly higher than the warmer temperature (28 °C) and cooler lighting conditions (480 nm). In the female group, the BART score differed significantly across conditions (F(3, 86.22) = 6.00, p = 0.001). Specifically, the score under 28 °C 644 nm was significantly higher than 18 °C 480 nm (p = 0.006) with a difference of 142.8 points, and 28 °C 480 nm (p = 0.002) with a difference of 155.4 points. These results indicate that in the female group, the BART score was significantly higher under warmer temperature (28 °C) and warmer lighting condition (644 nm). However, in the male group, the BART score did not show significant differences across conditions (F(3, 60.00) = 1.22, p = 0.310).
The specific indoor conditions, including the combination of temperature and lighting, that demonstrated the most significant impact on achieving higher scores across different cognitive functions are summarized in Table 1. The table indicates how environmental factors influenced the outcomes for different cognitive domains, emphasizing the conditions most conducive to optimal cognitive performance and the differences observed between genders.

Table 1.
Indoor conditions with significantly higher contributions to cognitive functions.
3.1.2. Overall Cognitive Performance
The analysis indicated that the combined thermal and lighting condition did not significantly affect the overall cognitive performance score of older adults, which represents the mean score across eight different tasks (F(3, 149.03) = 1.56, p = 0.201). However, it indicates that under the 18 °C 644 nm condition, the mean cognitive score was the lowest and showed a pattern where the score was higher in 480 nm compared to 644 nm in both temperatures, as shown in Figure 4. The cognitive scores of older female and male participants exhibited different tendencies under the tested conditions. For male participants, the analysis revealed a significant effect of the condition on their cognitive score (F(3, 60.00) = 4.19, p = 0.009). It shows more clearly that the cognitive score in 480 nm was higher than in 644 nm under both temperatures, 18 °C and 28 °C. According to the Tukey method, the score in the 18 °C 480 nm condition was significantly higher than in the 18 °C 644 nm condition (p = 0.012), with a difference of 29.81 points, while other pairwise comparisons did not show any significant differences.
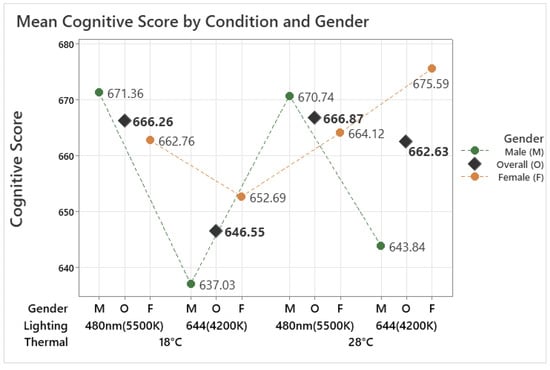
Figure 4.
Mean cognitive score by different thermal and lighting conditions and gender.
For female participants, on the other hand, the analysis revealed a significant effect of the condition on their cognitive score (F(3, 86.02) = 3.60, p = 0.017). According to the Tukey method, the score in the 28 °C 644 nm condition was significantly higher than in the 28 °C 480 nm condition (p = 0.009), with a difference of 30.88 points, while other pairwise comparisons did not show any significant differences. This indicates that both male and female cognitive scores were affected by different lighting conditions rather than temperature. However, the effects varied noticeably between genders, with males and females showing distinct patterns in their cognitive responses to the tested lighting conditions under different temperatures. Male cognitive scores were significantly higher under 480 nm than 644 nm at 18 °C, whereas female cognitive scores were significantly higher under 644 nm than 480 nm at 28 °C.
3.2. The Effect of Thermal and Lighting Conditions on Physiological Signals During Cognitive Tasks
3.2.1. Electrodermal Activity (EDA)
The analysis revealed a significant effect of the conditions on EDA (F(3, 131.79) = 8.53, p < 0.001). The 18 °C 480 nm condition recorded the lowest EDA at 0.31, followed by the 18 °C 644 nm condition at 0.39. In contrast, the 28 °C 644 nm condition showed the highest EDA at 1.87, followed by the 28 °C 480 nm condition at 1.58, as shown in Figure 5. These results confirm that lower temperatures (18 °C) significantly reduced EDA, while higher temperatures (28 °C) increased it. Post hoc analysis further revealed significant differences between the 28 °C and 18 °C conditions under both lighting settings (p < 0.05). For the male group, the conditions had a significant effect on EDA (F(3, 53.00) = 5.57, p = 0.002). The highest EDA of 1.10 was observed under the 28 °C 644 nm condition, while the lowest EDA of 0.38 occurred under the 18 °C 480 nm condition. Post hoc analysis revealed significant differences between the 28 °C 480 nm and 18 °C 480 nm conditions (p = 0.011) and between the 28 °C 644 nm and 18 °C 480 nm conditions (p = 0.010).
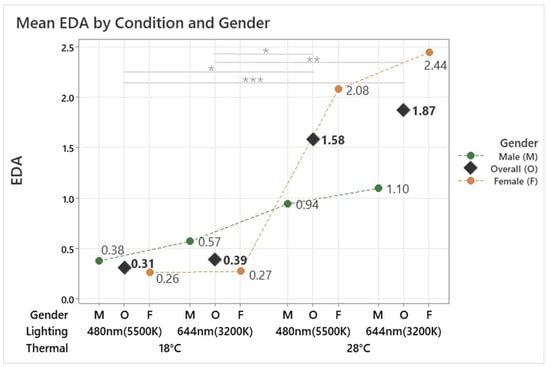
Figure 5.
Mean EDA by different thermal and lighting conditions and gender. Asterisks denote statistical significance derived from the combined-gender analysis only (* p < 0.05; ** p < 0.01; *** p < 0.001).
Similarly, in the female group, a significant effect of the conditions on EDA was observed (F(3, 75.77) = 6.82, p < 0.001). The highest EDA of 2.44 was observed under the 28 °C 644 nm condition, while the lowest EDA of 0.26 occurred under the 18 °C 480 nm condition. Post hoc analysis revealed significant differences between the 28 °C 644 nm and 18 °C 644 nm conditions (p = 0.002) as well as between the 28 °C 644 m and 18 °C 480 nm conditions (p = 0.002). These findings indicate that both temperature and lighting conditions influence EDA. While both genders showed significant differences in EDA across the tested conditions, their response patterns differed. Males exhibited smaller changes in EDA, with significant differences observed between specific temperature and lighting combinations. In contrast, females showed greater sensitivity to changes in both temperature and lighting, particularly at higher temperatures. This suggests that the combined effects of temperature, lighting, and gender-specific patterns shape EDA responses.
3.2.2. Pupil Size
The analysis demonstrated a significant effect of the conditions on pupil size (F(3, 134.35) = 3.62, p = 0.015). The smallest pupil size, 2.55 mm, was observed under the 18 °C 480 nm condition, while the largest pupil size, 2.64 mm, occurred under the 28 °C 644 nm condition, as shown in Figure 6. These findings indicate that cooler temperatures (18 °C) and cooler lighting significantly decreased pupil size, whereas warmer temperatures (28 °C) and warmer lighting increased it. Post hoc analysis further identified a significant difference between the 18 °C 644 nm and 18 °C 480 nm conditions (p = 0.012). In the male group, pupil size was not significantly affected by the conditions (F(3, 56.20) = 0.92, p = 0.438). Conversely, a significant effect of the conditions on pupil size was found in the female group (F(3, 75.10) = 3.94, p = 0.011), with post hoc analysis showing a significant difference between the 18 °C 644 nm and 18 °C 480 nm conditions (p = 0.011). These findings indicate that pupil size is influenced by both temperature and lighting conditions, particularly in females, where cooler lighting and lower temperatures result in reduced pupil size. The lack of significant effects in males suggests a potential gender difference in physiological responses to environmental conditions.
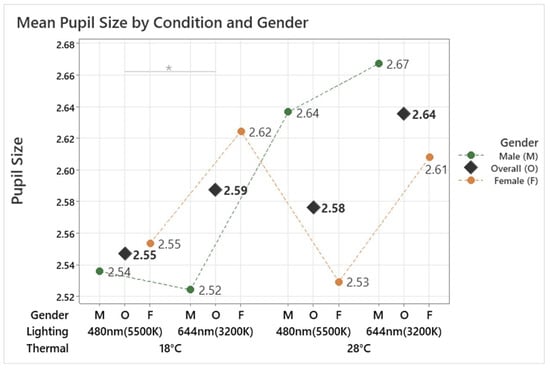
Figure 6.
Mean pupil size by different thermal and lighting conditions and gender. Asterisks denote statistical significance derived from the combined-gender analysis only (* p < 0.05).
3.3. The Relationship Between Indoor Environment, Physiological Signal, BMI, and Cognitive Task
The analysis revealed significant relationships between cognitive performance, physiological signals, BMI, and indoor environmental conditions, with notable differences across genders. Across genders, a weak but significant positive correlation was observed between overall cognitive scores and pupil size (r = 0.198, p = 0.013), suggesting that larger pupil size may reflect greater cognitive engagement. Furthermore, a moderate positive correlation was found between temperature and EDA (r = 0.290, p < 0.001), suggesting that higher ambient temperatures are associated with increased EDA. Additionally, the correlations between factors are shown separately for males and females, as illustrated in Figure 7. In the male group, the results revealed a moderate negative correlation between overall cognitive scores and EDA (r = −0.390, p = 0.001), indicating that higher EDA is associated with poorer cognitive performance in males, suggesting a potential detrimental effect of arousal on cognitive processes. A weak positive correlation between age and EDA (r = 0.267, p = 0.033) was found.
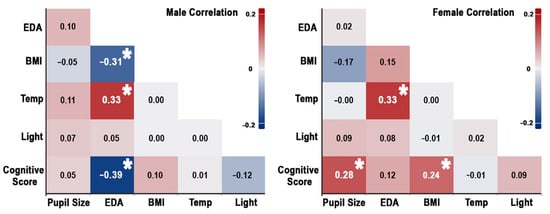
Figure 7.
Correlation between indoor environment, physiological signal, BMI, and cognitive score in males (left) and females (right). Asterisks indicate statistically significant correlations.
Additionally, temperature and EDA showed a moderate positive correlation (r = 0.331, p = 0.008), indicating that warmer environments heighten EDA. BMI and EDA were negatively correlated (r = −0.307, p = 0.014), implying that males with higher BMIs have lower EDA levels, possibly due to differences in metabolic activity. In contrast, the female group displayed a moderate positive correlation between overall cognitive scores and pupil size (r = 0.284, p = 0.007), suggesting that cognitive engagement is more strongly linked to pupil dilation in females than in the overall group. A weak positive correlation between cognitive scores and BMI (r = 0.242, p = 0.014) suggests that females with higher BMIs tend to perform better cognitively, a pattern not observed in males. A negative correlation between age and EDA (r = −0.280, p = 0.007) was observed. A moderate positive correlation between temperature and EDA (r = 0.330, p = 0.002) aligns with the overall results, showing that warmer temperatures increase physiological responses. These results highlight the importance of considering gender-specific dynamics when investigating the relationship between indoor environments, physiological signals, demographic factors, and cognitive tasks.
3.4. Predictive Model
3.4.1. Individual Cognitive Task Predictive Model
The input features for older adults’ cognitive predictive models were selected into three categories: physiological signals (EDA, pupil size), demographic factors (gender, BMI), and indoor condition, which is the combination of thermal and lighting conditions. Each cognitive task was categorized into two groups, low (class 1) and high (class 2), based on the average scores. Using the CART algorithm, the relative importance of variables for each task’s predictive model, number of nodes, along with the model’s accuracy and AUC, is presented in Table 2 when all input variables are used. The results indicated that the relative variable importance of the five input variables varied across the eight cognitive task predictive models. Additionally, the performance of the models, including the number of nodes, accuracy, and AUC, showed differences depending on the specific cognitive task being predicted, highlighting the variability in performance metrics and the unique contribution of each variable to the predictive outcomes for different tasks.
Table 2.
Relative importance of input variables in each cognitive task prediction.
3.4.2. Overall Cognitive Performance Predictive Model
The overall cognitive performance, calculated as the average score across eight different functions, was categorized into two groups, low (class 1) and high (class 2), by the average cognitive score of the entire participants, 665.13 points. Using the CART algorithm, the relative importance of variables in the cognitive performance predictive model, as shown in Figure 8, highlights their contributions to model improvement when splits are made.
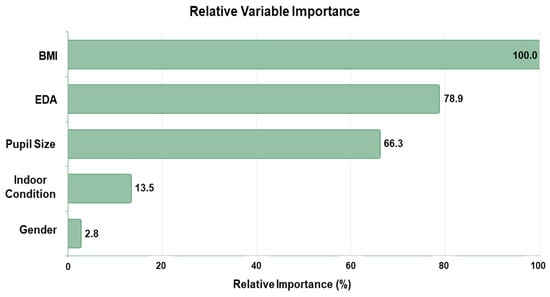
Figure 8.
Relative importance of input variables in overall cognitive performance prediction.
BMI is identified as the most influential variable, with a relative importance of 100%, serving as the reference point for all other variables. This underscores BMI’s significant impact on the model’s performance. EDA emerges as the second-most important variable, with a relative importance of 78.9%, indicating its strong contribution to prediction. Similarly, pupil size demonstrates notable importance at 66.3%, marking it as another key contributor to the model. In comparison, environmental conditions and gender show much lower relative importance, at 13.5% and 2.8%, respectively. While the condition offers some predictive value, gender’s contribution is negligible. Overall, these findings suggest that condition and gender have limited utility in enhancing prediction accuracy compared to BMI, EDA, and pupil size.
The results highlight the performance variations based on different combinations of variables, particularly emphasizing the role of a condition as a baseline factor (54.0%, condition + gender), as shown in Table 3. Adding BMI to condition (condition + BMI) instead of gender significantly improved accuracy to 86.2% (+32.2%), underscoring BMI’s strong predictive capability when combined with the condition. Comparatively, other combinations involving condition and additional variables, such as pupil size + condition (67.2%, +13.2%) and EDA + condition (66.1%, +12.1%), showed limited improvements, indicating the relatively weaker contributions of these variables. Further combinations demonstrated enhanced predictive performance of BMI and pupil size. The combination BMI + pupil size (89.7%, +35.7%) achieved the highest accuracy, suggesting that these two variables form the strongest predictors. Adding other variables, such as EDA, condition, or gender, to this combination (e.g., BMI + pupil size + EDA, BMI + pupil size + condition + gender) did not consistently improve performance and, in some cases, slightly reduced accuracy (e.g., BMI + pupil size + EDA + condition + gender, 87.9%, +33.9%). Overall, the findings suggest that condition plays a foundational role in performance improvement but is most effective when combined with BMI. Further, BMI and pupil size remain the most influential variables for maximizing accuracy, while additional variables may introduce redundancy or noise, limiting their contribution to predictive performance.
Table 3.
Input variable combinations and model accuracy for cognitive performance prediction.
The ROC curve in Figure 9 illustrates the performance of the model for the variable combination condition + BMI + pupil size + EDA + gender, which achieved an accuracy of 87.9%. Although this combination does not yield the highest accuracy, it provides valuable insights into how the inclusion of additional variables affects the model’s classification ability. The AUC values for the training (0.9812) and test datasets (0.9285) indicate strong classification performance and generalizability, as confirmed by the confidence intervals (training: 0.9147–1, test: 0.8885–0.9685). While the training curve (blue) slightly outperforms the test curve (black), the minimal difference suggests no significant overfitting. The steep rise in both curves at low false positive rates further highlights the model’s ability to achieve high sensitivity with low error rates. The model included all five predictors, structured with 12 terminal nodes and a minimum terminal node size of 4. While the inclusion of EDA and gender does not significantly improve accuracy, the model maintains robust discriminatory performance, highlighting its ability to effectively incorporate multiple predictors without overfitting. The established optimal tree diagram is attached in Appendix B.
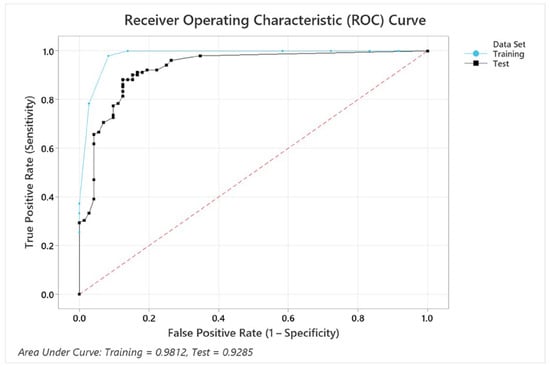
Figure 9.
ROC curves for training and test datasets in overall cognitive performance prediction.
4. Discussion
This study investigated how variations in temperature, lighting, and gender influence the cognitive performance of older adults across eight cognitive domains. By including physiological indicators such as EDA, BMI, and pupil size, this study contributes to an emerging understanding of personalized environmental design for aging populations. The findings suggest the potential for tailored environmental control strategies, accounting for physiological and gender-specific differences to enhance cognitive functioning in later life.
The findings highlighted how distinct cognitive tasks were significantly influenced by specific combinations of thermal and lighting conditions across genders. Under cooler temperature (18 °C) and cooler light (480 nm), abstraction function improved overall, with particularly strong effects in male participants, who also demonstrated enhanced spatial orientation. In contrast, under cooler temperature (18 °C) and warmer light (644 nm), female participants exhibited stronger performance in complex scanning and visual tracking. At warmer temperature (28 °C) and under cooler lighting (480 nm), males again performed better in visual learning, spatial working memory, complex scanning, and visual tracking. When warmer lighting (644 nm) was paired with the same warmer temperature (28 °C), sensory–motor speed function was elevated in males, while risk decision-making improved for both genders, with a stronger effect among females. Warmer temperatures in general enhanced working memory and vigilant attention, especially among male participants. These detailed findings expand upon prior research by Lo et al. [36] and Hou and Xu [37], which associated higher temperatures with overall cognitive decline. Our study provides a more differentiated picture by identifying how environmental variables interact with specific cognitive functions and genders, contributing to a more nuanced understanding of how indoor environments affect cognition in older adults. Not all cognitive tasks demonstrated significant effects under the same environmental conditions, which is consistent with prior studies [30,34,35]. Each task may be sensitive to different environmental cues, and it is therefore expected that only certain tasks reveal significant differences, while others, like VOLT and MPT, do not [30].
A key finding is the stronger impact of lighting conditions compared to temperature on overall cognitive performance in older adults. Cognitive scores were consistently higher under cool lighting (480 nm, 5500 K) than warm lighting (644 nm, 3200 K), at both 18 °C and 28 °C. This contrasts with younger adult studies, such as Hu et al. [34] and Lu et al. [35], who found optimal cognitive performance under neutral white light (4000 K) or reported reduced performance under bluish lighting (6500 K). However, our results align more closely with studies on older populations, such as Shishegar and Boubekri [29], who reported cognitive gains under blue-rich lighting in participants with a mean age of 76.81. Additionally, Wang et al. [38] observed that increasing CCT improved older adults’ task performance. The divergence between age groups may be rooted in physiological aging of the visual system: the human lens becomes yellowed and less transmissive with age [81], reducing the effectiveness of warmer lighting. Chromatic sensitivity also declines significantly [82], and overall sensory perception changes [83,84], all of which likely contribute to altered light-induced cognitive responses in older adults compared to younger ones.
Gender-specific responses further reveal nuanced lighting preferences. Male participants performed better under cool lighting (480 nm) across both temperatures, particularly at 18 °C, reinforcing the overall trend. In contrast, female participants showed higher performance under warm lighting at 28 °C. Notably, these older females’ responses at warmer temperatures at 28 °C aligned with the trends observed in younger adults in Hu et al. [34] and Lu et al. [35], but not at cooler temperatures (18 °C). Prior work indicates that males generally prefer high-CCT environments while females favor lower-CCT lighting [85,86]. This gender difference may be explained in evolutionary adaptations proposed by the hunter–gatherer theory, suggesting that males evolved to function in bright, outdoor environments (daylight) while females adapted to lower-light indoor environments (e.g., firelight). Similarly, differences in thermal preference are shaped by biological factors including hormonal regulation, body composition, metabolic rate, and skin temperature [87], with females generally preferring warmer environments. Taken together, these findings reinforce the importance of individualized environmental design for cognitive support in older adults, especially when accounting for gender-based physiological differences.
Beyond environmental variables, this study emphasizes the role of physiological signals and BMI in predicting cognitive performance. EDA was significantly higher under warmer temperature and warm lighting (28 °C, 644 nm), while pupil size decreased under cooler conditions (18 °C, 480 nm) and increased under warmer conditions. Elevated EDA reflects increased sympathetic nervous system activity, which may be linked to heightened alertness and arousal [88], both of which can facilitate cognitive processing under certain environmental stimuli.
Notably, a higher BMI was associated with better cognitive performance in female participants and emerged as the most influential predictor in our machine learning model. This aligns with the findings in Kuo et al. [89] and Kiesswetter et al. [90], who reported superior cognitive outcomes among overweight older adults. Similarly, Kim et al. [91] and Noh et al. [92] identified higher fat mass, especially in non-abdominal areas like the legs, as beneficial for glucose metabolism and protective against cognitive declines. This may be because peripheral fat supports better metabolism and helps protect cognitive function. Additionally, serum urate levels linked to higher BMI may act as antioxidants that prevent neurodegenerative diseases [91]. These findings also suggest that underweight older adults may be more vulnerable to cognitive impairment due to hormonal imbalances, depression, or dementia, while obesity-associated factors like increased white matter, leptin, or sex hormones could play a neuroprotective role [92]. The relatively low importance of temperature and lighting reflects that physiological signals such as EDA [88,93] and pupil size [8], along with BMI [89,90], are more directly linked to cognitive performance. Because these variables capture key mechanisms influencing cognition, they provide stronger predictive power in the model, whereas environmental conditions, while still relevant, contributed less to prediction accuracy in comparison.
EDA, a marker of sympathetic nervous system activation [93], was negatively associated with cognitive performance in males, supporting evidence that stress can impair cognition. Pupil size correlated more strongly with cognitive performance in females, indicating its potential as a marker of cognitive demand in older adults. This finding contrasts with Kim et al. [8], who reported a negative correlation in younger adults, suggesting that the link between arousal and task efficiency may change with age. Our results highlight the need to include physiological variables in studies on older populations, offering a richer understanding of the body–environment–cognition connection.
Machine learning results demonstrated that combinations of two or three variables, such as BMI and pupil size or indoor condition, BMI, and pupil size, could predict cognitive performance with high accuracy (up to 89.7%). This aligns with previous findings [16], using LightGBM algorithms, where three to five physiological and demographic features achieved accuracies of 92.87–99.63%. Similarly, Kim et al. [8] developed a predictive model with two to three variables, such as pupil size, gender, and lighting conditions and achieved 66.8–89.6% accuracy. While our variable differ, the comparable predictive power suggests that robust models for cognitive performance can be built with a minimal set of well-chosen inputs. Our approach goes beyond existing models that focus on either lighting or thermal conditions and often target younger adults. Instead, we offer an integrative framework based on older adults’ cognitive responses to complex indoor environments, validated through physiological and demographic data.
While the within-subject design helped reduce individual differences, the small sample size (n = 22) poses limitations for the stability and generalizability of predictive modeling. Given the small sample size, the predictive results reported here should be considered preliminary, and further external validation using independent datasets is essential to assess model generalizability. Future studies with larger and more diverse samples are needed to confirm and refine the model’s predictive accuracy. Additionally, the study was conducted in Arizona, a region characterized by hot and dry weather. This may have influenced participants’ baseline thermal adaptation. Therefore, replication in diverse climatic regions would help determine the broader applicability of the results. Two key directions for future research are evident. First, directly comparing the effects of indoor environmental conditions on both younger and older adults could clarify how cognitive responses evolve with age. Rather than relying on indirect contrasts with previous studies, age-stratified designs would reveal developmental trends and inflection points. Second, including additional environmental variables, such as noise levels or air quality, could offer a more holistic perspective on how built environments shape human cognition and well-being. Furthermore, future studies should account for individual-level variables such as comorbidities or medication use that may influence cognitive outcomes, especially in aging populations. Exploring cognitive responses in long-term care residents, with or without consistent access to air conditioning or other indoor climate controls, may also yield practical implications for senior care environments. This study, in conjunction with previous work [42,43,44,45,46] that emphasizes the importance of environmental factors for individuals living with dementia, underscores the role of lighting and thermal comfort in shaping cognitive outcomes. However, further research is needed to comprehensively explore these effects in older adults across diverse environments and care settings. Addressing these questions will support the creation of indoor spaces that are more responsive to the needs of aging populations.
5. Conclusions
This study explored how complex combination of indoor thermal and lighting conditions influence older adults’ cognitive performances and physiological responses. It also developed a predictive model of cognitive performance using physiological signals (EDA and pupil size) and demographic factors (gender and BMI). Results revealed that male participants demonstrated significantly better at 18 °C under cool lighting (480 nm), whereas female participants performed better at 28 °C under warm lighting (644 nm). Performance across eight distinct cognitive tasks varied according to specific thermal–lighting combinations and participant gender. EDA increased significantly under warmer conditions with warm lighting, while pupil size contracted in cooler environments and expanded in warmer ones. A negative correlation was observed between EDA and cognitive performance in males, while pupil size and BMI were positively associated with performance in females. Using the CART algorithm, we identified that combinations, such as BMI and pupil size, or the inclusion of indoor environmental conditions, could predict cognitive performance with up to 89.7% accuracy. These findings highlight the potential for personalized environmental strategies that account for gender and physiological differences to support cognitive health in aging populations. Furthermore, the identified predictors offer a promising basis for real-time, adaptive systems capable of forecasting and enhancing cognitive function in older adults.
Author Contributions
Conceptualization, S.S., N.S., and D.Y.; methodology, S.S., N.S., and D.Y.; software, S.S.; formal analysis, S.S.; investigation, S.S.; resources, N.S., and D.Y.; data curation, S.S.; writing—original draft preparation, S.S.; writing—review and editing, N.S., and D.Y.; visualization, S.S.; supervision, N.S., and D.Y.; project administration, D.Y.; funding acquisition, N.S., and D.Y. All authors have read and agreed to the published version of the manuscript.
Funding
This research was funded ‘Edson Initiative for Dementia Care and Solutions’ and ‘Herberger Institute Research-Building Investment’ at Arizona State University.
Institutional Review Board Statement
The study was approved by the Institutional Review Board (IRB) at ASU (STUDY00018069).
Informed Consent Statement
Informed consent was obtained from all subjects involved in the study.
Data Availability Statement
Data will be made available on request.
Acknowledgments
The authors extend their sincere appreciation to all the participants who made this study possible.
Conflicts of Interest
The authors declare that they have no known competing financial interests or personal relationships that could have appeared to influence the work reported in this paper.
Abbreviations
The following abbreviations are used in this manuscript:
| AM | Abstract Matching |
| AUC | Area Under ROC Curve |
| BART | Balloon Analog Risk Task |
| BMI | Body Mass Index |
| CART | Classification And Regression Tree |
| CCT | Correlated Color Temperature |
| DSST | Digit Symbol Substitution Task |
| EDA | Electrodermal Activity |
| ipRGCs | Intrinsically Photosensitive Retinal Ganglion Cells |
| LOT | Line Orientation Task |
| MPT | Motor Praxis Task |
| NBack | Fractal 2-back |
| PVT | Psychomotor Vigilance Test |
| REML | Restricted Maximum Likelihood |
| ROC | Receiver Operating Characteristic |
| SCN | Suprachiasmatic Nuclei |
| VOLT | Visual Object Learning Task |
Appendix A
Appendix A.1
Table A1.
Pairwise comparison and grouping based on Tukey post hoc analysis for each cognitive task. Asterisks indicate statistical significance.
Table A1.
Pairwise comparison and grouping based on Tukey post hoc analysis for each cognitive task. Asterisks indicate statistical significance.
| Task | Gender | ANOVA | Grouping Using Tukey Post Hoc | Mean Values | Significant Differences | ||||
|---|---|---|---|---|---|---|---|---|---|
| p-Value | 18 °C 480 nm | 28 °C 480 nm | 18 °C 644 nm | 28 °C 644 nm | Order | Differ | Adj p-Value | ||
| MPT | Overall | 0.111 | A | A | A | A | (4), (3), (2), (1) | N/A | |
| Female | 0.445 | A | A | A | A | (3), (4), (1), (2) | N/A | ||
| Male | 0.002 * | A | B | A B | B | (2), (4), (3), (1) | (2)–(1) | 0.003 | |
| (4)–(1) | 0.009 | ||||||||
| VOLT | Overall | 0.266 | A | A | A | A | (4), (1), (2), (3) | N/A | |
| Female | 0.775 | A | A | A | A | (4), (3), (1), (2) | N/A | ||
| Male | 0.004 * | A | A | B | A | (2), (1), (4), (3) | (2)–(3) | 0.005 | |
| (1)–(3) | 0.016 | ||||||||
| (4)–(3) | 0.043 | ||||||||
| NBack | Overall | 0.037 * | A | B | A B | A B | (2), (3), (4), (1) | (2)–(1) | 0.049 |
| Female | 0.718 | A | A | A | A | (2), (1), (3), (4) | N/A | ||
| Male | 0.008 * | A | B | A B | A B | (2), (3), (4), (1) | (2)–(1) | 0.005 | |
| AM | Overall | 0.010 * | A | A B | A B | B | (1), (2), (3), (4) | (1)–(4) | 0.012 |
| Female | 0.378 | A | A | A | A | (1), (2), (3), (4) | N/A | ||
| Male | 0.013 * | A | A B | B | B | (1), (2), (3), (4) | (1)–(3) | 0.042 | |
| (1)–(4) | 0.030 | ||||||||
| LOT | Overall | 0.055 | A | A | A | A | (4), (1), (3), (2) | N/A | |
| Female | 0.065 | A | A | A | A | (4), (2), (3), (1) | N/A | ||
| Male | <0.001 * | A | B | B | B | (1), (4), (2), (3) | (1)–(3) | <0.001 | |
| (1)–(2) | 0.003 | ||||||||
| (1)–(4) | 0.027 | ||||||||
| DSST | Overall | 0.845 | A | A | A | A | (1), (4), (2), (3) | N/A | |
| Female | 0.011 * | A B | B | A | A | (3), (4), (1), (2) | (3)–(2) | 0.015 | |
| (4)–(2) | 0.028 | ||||||||
| Male | 0.001 * | A B | A | B | B | (2), (1), (4), (3) | (2)–(3) | 0.001 | |
| (2)–(4) | 0.025 | ||||||||
| BART | Overall | 0.003 * | A B | B | A | A | (4), (3), (1), (2) | (4)–(2) | 0.005 |
| (3)–(2) | 0.039 | ||||||||
| Female | 0.001 * | A | A | A B | B | (4), (3), (1), (2) | (4)–(2) | 0.002 | |
| (4)–(1) | 0.006 | ||||||||
| Male | 0.310 | A | A | A | A | (2), (1), (4), (3) | N/A | ||
| PVT | Overall | 0.031 * | A | A | A | A | (4), (1), (2), (3) | N/A | |
| Female | 0.596 | A | A | A | A | (1), (4), (3), (2) | N/A | ||
| Male | 0.020 * | A B | A B | A | B | (4), (1), (2), (3) | (4)–(3) | 0.036 | |
Appendix B

Figure A1.
Optimal tree diagram of overall cognitive performance predictive model.
Figure A1.
Optimal tree diagram of overall cognitive performance predictive model.

References
- Prince, M.; Wimo, A.; Guerchet, M.; Ali, G.-C.; Wu, Y.-T.; Prina, M. World Alzheimer Report 2015. The Global Impact of Dementia: An Analysis of Prevalence, Incidence, Cost and Trends; hal-03495438; [Research Report]; Alzheimer’s Disease International: London, UK, 2015. [Google Scholar]
- Alzheimer’s & Dementia: The Journal of the Alzheimer’s Association. 2024 Alzheimer’s Disease Facts and Figures. Alzheimer’s Dement. 2024, 20, 3708–3821.
- Falck, R.S.; Best, J.R.; Davis, J.C.; Liu-Ambrose, T. The Independent Associations of Physical Activity and Sleep with Cognitive Function in Older Adults. J. Alzheimer’s Dis. 2018, 63, 1469–1484. [Google Scholar] [CrossRef]
- Landry, G.J.; Liu-Ambrose, T. Buying Time: A Rationale for Examining the Use of Circadian Rhythm and Sleep Interventions to Delay Progression of Mild Cognitive Impairment to Alzheimer’s Disease. Front. Aging Neurosci. 2014, 6, 325. [Google Scholar] [CrossRef]
- Klepeis, N.E.; Nelson, W.C.; Ott, W.R.; Robinson, J.P.; Tsang, A.M.; Switzer, P.; Behar, J.V.; Hern, S.C.; Engelmann, W.H. The National Human Activity Pattern Survey (NHAPS): A Resource for Assessing Exposure to Environmental Pollutants. J. Expo. Sci. Environ. Epidemiol. 2001, 11, 231–252. [Google Scholar] [CrossRef]
- Choi, J.-H.; Yeom, D. Study of Data-Driven Thermal Sensation Prediction Model as a Function of Local Body Skin Temperatures in a Built Environment. Build. Environ. 2017, 121, 130–147. [Google Scholar] [CrossRef]
- Choi, J.-H.; Loftness, V.; Aziz, A. Post-Occupancy Evaluation of 20 Office Buildings as Basis for Future IEQ Standards and Guidelines. Energy Build. 2012, 46, 167–175. [Google Scholar] [CrossRef]
- Kim, T.; Lim, S.; Yoon, S.-G.; Yeom, D. (Jason) Pupil Size and Gender-Driven Occupant’s Productivity Predictive Model for Diverse Indoor Lighting Conditions in the Office Environment. Build. Environ. 2022, 226, 109673. [Google Scholar] [CrossRef]
- Yuan, F.; Yao, R.; Sadrizadeh, S.; Li, B.; Cao, G.; Zhang, S.; Zhou, S.; Liu, H.; Bogdan, A.; Croitoru, C.; et al. Thermal Comfort in Hospital Buildings—A Literature Review. J. Build. Eng. 2022, 45, 103463. [Google Scholar] [CrossRef]
- Havenith, G.; Griggs, K.; Qiu, Y.; Dorman, L.; Kulasekaran, V.; Hodder, S. Higher Comfort Temperature Preferences for Anthropometrically Matched Chinese and Japanese versus White-Western-Middle-European Individuals Using a Personal Comfort/Cooling System. Build. Environ. 2020, 183, 107162. [Google Scholar] [CrossRef]
- Choi, J.H.; Yeom, D. Development of the Data-Driven Thermal Satisfaction Prediction Model as a Function of Human Physiological Responses in a Built Environment. Build. Environ. 2019, 150, 206–218. [Google Scholar] [CrossRef]
- Cen, C.; Cheng, S.; Wong, N.H. Effect of Elevated Air Temperature and Air Velocity on Thermal Comfort and Cognitive Performance in the Tropics. Build. Environ. 2023, 234, 110203. [Google Scholar] [CrossRef]
- Yeom, D.J.; Delogu, F. Thermal Preferences and Cognitive Performance Estimation via User’s Physiological Responses. In Proceedings of the 2019 ARCC International Conference: The Future of Praxis: Applied Research as a Bridge Between Theory and Practice, Toronto, ON, Canada, 29 May–1 June 2019. [Google Scholar]
- Lan, L.; Tang, J.; Wargocki, P.; Wyon, D.P.; Lian, Z. Cognitive Performance Was Reduced by Higher Air Temperature Even When Thermal Comfort Was Maintained over the 24–28 °C Range. Indoor Air 2022, 32, e12916. [Google Scholar] [CrossRef]
- Son, S.; Sharp, N.; Yeom, D.; Lamp, S. 0357 Older Adults’ Sleep Quality: Navigating the Impact of Daily Lighting and Thermal Conditions in Living Environments. Sleep 2024, 47, A153–A154. [Google Scholar] [CrossRef]
- Yeom, D.; Kim, T.; Yoon, S.-G. Productivity Prediction via Human Physiological Signals for an Optimum Thermal Environment. In Proceedings of the CLIMA 2022 Conference, Rotterdam, The Netherlands, 22–25 May 2022. [Google Scholar] [CrossRef]
- Yeom, D.J.; Delogu, F. Local Body Skin Temperature-Driven Thermal Sensation Predictive Model for the Occupant’s Optimum Productivity. Build. Environ. 2021, 204, 108196. [Google Scholar] [CrossRef]
- Wolkoff, P.; Azuma, K.; Carrer, P. Health, Work Performance, and Risk of Infection in Office-like Environments: The Role of Indoor Temperature, Air Humidity, and Ventilation. Int. J. Hyg. Environ. Health 2021, 233, 113709. [Google Scholar] [CrossRef]
- Abbasi, A.M.; Motamedzadeh, M.; Aliabadi, M.; Golmohammadi, R.; Tapak, L. The Impact of Indoor Air Temperature on the Executive Functions of Human Brain and the Physiological Responses of Body. Health Promot. Perspect. 2019, 9, 55–64. [Google Scholar] [CrossRef]
- Shishegar, N.; Boubekri, M.; Stine-Morrow, E.A.L.; Rogers, W.A. Tuning Environmental Lighting Improves Objective and Subjective Sleep Quality in Older Adults. Build. Environ. 2021, 204, 108096. [Google Scholar] [CrossRef]
- Figueiro, M.G. An Overview of the Effects of Light on Human Circadian Rhythms: Implications for New Light Sources and Lighting Systems Design. J. Light Vis. Environ. 2013, 37, 51–61. [Google Scholar] [CrossRef]
- Figueiro, M.G. A Proposed 24 h Lighting Scheme for Older Adults. Light. Res. Technol. 2008, 40, 153–160. [Google Scholar] [CrossRef]
- Rea, M.S.; Figueiro, M.G. Light as a Circadian Stimulus for Architectural Lighting. Light. Res. Technol. 2018, 50, 497–510. [Google Scholar] [CrossRef]
- Gooley, J.J.; Lu, J.; Chou, T.C.; Scammell, T.E.; Saper, C.B. Melanopsin in Cells of Origin of the Retinohypothalamic Tract. Nat. Neurosci. 2001, 4, 1165. [Google Scholar] [CrossRef]
- Hannibal, J.; Jamen, F.; Nielsen, H.S.; Journot, L.; Brabet, P.; Fahrenkrug, J. Dissociation between Light-Induced Phase Shift of the Circadian Rhythm and Clock Gene Expression in Mice Lacking the Pituitary Adenylate Cyclase Activating Polypeptide Type 1 Receptor. J. Neurosci. 2001, 21, 4883–4890. [Google Scholar] [CrossRef]
- Von Schantz, M.; Provencio, I.; Foster, R.G. Recent Developments in Circadian Photoreception: More than Meets the Eye. Investig. Ophthalmol. Vis. Sci. 2000, 41, 1605–1607. [Google Scholar]
- Chellappa, S.L.; Gordijn, M.C.M.; Cajochen, C. Can Light Make Us Bright? Effects of Light on Cognition and Sleep. In Progress in Brain Research; Elsevier B.V.: Amsterdam, The Netherlands, 2011; Volume 190, pp. 119–133. [Google Scholar]
- Sahin, L.; Figueiro, M.G. Alerting Effects of Short-Wavelength (Blue) and Long-Wavelength (Red) Lights in the Afternoon. Physiol. Behav. 2013, 116–117, 1–7. [Google Scholar] [CrossRef]
- Shishegar, N.; Boubekri, M. Lighting up Living Spaces to Improve Mood and Cognitive Performance in Older Adults. J. Environ. Psychol. 2022, 82, 101845. [Google Scholar] [CrossRef]
- Son, S.; Lamp, S.; Yeom, D.J.; Sharp, N. The Influence of Lighting and Thermal Environments on Sleep and Cognitive Function in Older Adults. Build. Environ. 2024, 265, 112028. [Google Scholar] [CrossRef]
- Vandewalle, G.; Balteau, E.; Phillips, C.; Degueldre, C.; Moreau, V.; Sterpenich, V.; Albouy, G.; Darsaud, A.; Desseilles, M.; Dang-Vu, T.T.; et al. Daytime Light Exposure Dynamically Enhances Brain Responses. Curr. Biol. 2006, 16, 1616–1621. [Google Scholar] [CrossRef] [PubMed]
- Perrin, F.; Peigneux, P.; Fuchs, S.; Phane Verhaeghe, S.; Laureys, S.; Middleton, B.; Degueldre, C.; Fiore, G.D.; Vandewalle, G.; Balteau, E.; et al. Nonvisual Responses to Light Exposure in the Human Brain during the Circadian Night. Curr. Biol. 2004, 14, 1842–1846. [Google Scholar] [CrossRef] [PubMed]
- Vandewalle, G.; Gais, S.; Schabus, M.; Balteau, E.; Carrier, J.; Darsaud, A.; Sterpenich, V.; Albouy, G.; Dijk, D.J.; Maquet, P. Wavelength-Dependent Modulation of Brain Responses to a Working Memory Task by Daytime Light Exposure. Cereb. Cortex 2007, 17, 2788–2795. [Google Scholar] [CrossRef]
- Hu, Z.; Yi, C.; Hao, J.; Qiao, X.; Guo, X. Comparative Study on the Effects of Lighting on Cognitive Ergonomics in Single and Multi-Working Modes. Neuroquantology 2018, 16, 341–349. [Google Scholar] [CrossRef]
- Lu, M.; Hu, S.; Mao, Z.; Liang, P.; Xin, S.; Guan, H. Research on Work Efficiency and Light Comfort Based on EEG Evaluation Method. Build. Environ. 2020, 183, 107122. [Google Scholar] [CrossRef]
- Lo, Y.T.C.; Su, W.P.; Mei, S.H.; Jou, Y.Y.; Huang, H.B. Association between Ambient Temperature and Cognitive Function in a Community-Dwelling Elderly Population: A Repeated Measurement Study. BMJ Open 2021, 11, e049160. [Google Scholar] [CrossRef]
- Hou, K.; Xu, X. Ambient Temperatures Associated with Reduced Cognitive Function in Older Adults in China. Sci. Rep. 2023, 13, 17414. [Google Scholar] [CrossRef]
- Wang, Y.; Huang, H.; Chen, G. Effects of Lighting on ECG, Visual Performance and Psychology of the Elderly. Optik 2020, 203, 164063. [Google Scholar] [CrossRef]
- Hoof, J.V.; Hensen, J.L.M. Thermal Comfort and Older Adults. Gerontechnology 2006, 4, 223–228. [Google Scholar] [CrossRef]
- Baquero, M.T.; Forcada, N. Thermal Comfort of Older People during Summer in the Continental Mediterranean Climate. J. Build. Eng. 2022, 54, 104680. [Google Scholar] [CrossRef]
- Knez, I.; Kers, C. Effects of Indoor Lighting, Gender, and Age on Mood and Cognitive Performance. Environ. Behav. 2000, 32, 817–831. [Google Scholar] [CrossRef]
- Quirke, M.; Bennett, K.; Chau, H.-W.; Preece, T.; Jamei, E. Environmental Design for People Living with Dementia. Encyclopedia 2023, 3, 1038–1057. [Google Scholar] [CrossRef]
- Barrick, A.L.; Sloane, P.D.; Williams, C.S.; Mitchell, C.M.; Connell, B.R.; Wood, W.; Hickman, S.E.; Preisser, J.S.; Zimmerman, S. Impact of Ambient Bright Light on Agitation in Dementia. Int. J. Geriat Psychiatry 2010, 25, 1013–1021. [Google Scholar] [CrossRef]
- van Hoof, J.; Kort, H.S.M.; Hensen, J.L.M.; Duijnstee, M.S.H.; Rutten, P.G.S. Thermal Comfort and the Integrated Design of Homes for Older People with Dementia. Build. Environ. 2010, 45, 358–370. [Google Scholar] [CrossRef]
- Tartarini, F.; Cooper, P.; Fleming, R.; Batterham, M. Indoor Air Temperature and Agitation of Nursing Home Residents With Dementia. Am. J. Alzheimers Dis. Other Dement. 2017, 32, 272–281. [Google Scholar] [CrossRef]
- Childs, C.; Elliott, J.; Khatab, K.; Hampshaw, S.; Fowler-Davis, S.; Willmott, J.R.; Ali, A. Thermal Sensation in Older People with and without Dementia Living in Residential Care: New Assessment Approaches to Thermal Comfort Using Infrared Thermography. Int. J. Environ. Res. Public Health 2020, 17, 6932. [Google Scholar] [CrossRef]
- Bellia, L.; d’Ambrosio Alfano, F.R.; Fragliasso, F.; Palella, B.I.; Riccio, G. On the Interaction between Lighting and Thermal Comfort: An Integrated Approach to IEQ. Energy Build. 2021, 231, 110570. [Google Scholar] [CrossRef]
- te Kulve, M.; Schlangen, L.; van Marken Lichtenbelt, W. Interactions between the Perception of Light and Temperature. Indoor Air 2018, 28, 881–891. [Google Scholar] [CrossRef]
- Toftum, J.; Thorseth, A.; Markvart, J.; Logadóttir, Á. Occupant Response to Different Correlated Colour Temperatures of White LED Lighting. Build. Environ. 2018, 143, 258–268. [Google Scholar] [CrossRef]
- Baniya, R.R.; Tetri, E.; Virtanen, J.; Halonen, L. The Effect of Correlated Colour Temperature of Lighting on Thermal Sensation and Thermal Comfort in a Simulated Indoor Workplace. Indoor Built Environ. 2018, 27, 308–316. [Google Scholar] [CrossRef]
- Laura, B.; Claudio, Z.C.; Massimiliano, Z.; Riccardo, P. Investigating the Validity of the Hue-Heat Effect on Thermal Sensitivity. Sci. Rep. 2024, 14, 21413. [Google Scholar] [CrossRef] [PubMed]
- Schellen, L.; Van Marken Lichtenbelt, W.D.; Loomans, M.G.L.C.; Toftum, J.; De Wit, M.H. Differences between Young Adults and Elderly in Thermal Comfort, Productivity, and Thermal Physiology in Response to a Moderate Temperature Drift and a Steady-State Condition: Differences between Young Adults and Elderly in Thermal Comfort, Productivity, and Thermal Physiology. Indoor Air 2010, 20, 273–283. [Google Scholar] [CrossRef]
- Ragland, J.D.; Turetsky, B.I.; Gur, R.C.; Gunning-Dixon, F.; Turner, T.; Schroeder, L.; Chan, R.; Gur, R.E. Working Memory for Complex Figures: An fMRI Comparison of Letter and Fractal n-Back Tasks. Neuropsychology 2002, 16, 370–379. [Google Scholar] [CrossRef] [PubMed]
- Glahn, D.C.; Gur, R.C.; Ragland, J.D.; Censits, D.M.; Gur, R.E. Reliability, Performance Characteristics, Construct Validity, and an Initial Clinical Application of a Visual Object Learning Test (VOLT). Neuropsychology 1997, 11, 602–612. [Google Scholar] [CrossRef]
- Glahn, D.C.; Cannon, T.D.; Gur, R.E.; Ragland, J.D.; Gur, R.C. Working Memory Constrains Abstraction in Schizophrenia. Biol. Psychiatry 2000, 47, 34–42. [Google Scholar] [CrossRef]
- Benton, A.L. Visuospatial Judgment. Arch. Neurol. 1978, 35, 364–367. [Google Scholar] [CrossRef]
- Usui, N.; Haji, T.; Maruyama, M.; Katsuyama, N.; Uchida, S.; Hozawa, A.; Omori, K.; Tsuji, I.; Kawashima, R.; Taira, M. Cortical Areas Related to Performance of WAIS Digit Symbol Test: A Functional Imaging Study. Neurosci. Lett. 2009, 463, 1–5. [Google Scholar] [CrossRef]
- Dinges, D.F.; Powell, J.W. Microcomputer Analyses of Performance on a Portable, Simple Visual RT Task during Sustained Operations. Behav. Res. Methods Instrum. Comput. 1985, 17, 652–655. [Google Scholar] [CrossRef]
- Basner, M.; Mollicone, D.; Dinges, D.F. Validity and Sensitivity of a Brief Psychomotor Vigilance Test (PVT-B) to Total and Partial Sleep Deprivation. Acta Astronaut. 2011, 69, 949–959. [Google Scholar] [CrossRef]
- Gur, R. Computerized Neurocognitive Scanning: I. Methodology and Validation in Healthy People. Neuropsychopharmacology 2001, 25, 766–776. [Google Scholar] [CrossRef] [PubMed]
- Lejuez, C.W.; Read, J.P.; Kahler, C.W.; Richards, J.B.; Ramsey, S.E.; Stuart, G.L.; Strong, D.R.; Brown, R.A. Evaluation of a Behavioral Measure of Risk Taking: The Balloon Analogue Risk Task (BART). J. Exp. Psychol. Appl. 2002, 8, 75–84. [Google Scholar] [CrossRef]
- Basner, M.; Savitt, A.; Moore, T.M.; Port, A.M.; McGuire, S.; Ecker, A.J.; Nasrini, J.; Mollicone, D.J.; Mott, C.M.; McCann, T.; et al. Development and Validation of the Cognition Test Battery for Spaceflight. Aerosp. Med. Hum. Perform. 2015, 86, 942–952. [Google Scholar] [CrossRef] [PubMed]
- Taylor, Y.; Merat, N.; Jamson, S. The Effects of Fatigue on Cognitive Performance in Police Officers and Staff During a Forward Rotating Shift Pattern. Saf. Health Work 2019, 10, 67–74. [Google Scholar] [CrossRef] [PubMed]
- Gamaldo, A.A.; Tan, S.C.; Sardina, A.L.; Henzi, C.; Guest, R.; Ross, L.A.; Willingham, K.; Zonderman, A.B.; Andel, R.A. Older Black Adults’ Satisfaction and Anxiety Levels After Completing Alternative Versus Traditional Cognitive Batteries. J. Gerontol. Ser. B 2020, 75, 1462–1474. [Google Scholar] [CrossRef]
- Mulvaney, S.W.; Lynch, J.H.; De Leeuw, J.; Schroeder, M.; Kane, S. Neurocognitive Performance Is Not Degraded After Stellate Ganglion Block Treatment for Post-Traumatic Stress Disorder: A Case Series. Mil. Med. 2015, 180, e601–e604. [Google Scholar] [CrossRef]
- Nasreddine, Z.S.; Phillips, N.A.; Bédirian, V.; Charbonneau, S.; Whitehead, V.; Collin, I.; Cummings, J.L.; Chertkow, H. The Montreal Cognitive Assessment, MoCA: A Brief Screening Tool for Mild Cognitive Impairment. J. Am. Geriatr. Soc. 2005, 53, 695–699. [Google Scholar] [CrossRef]
- Folstein, M.F.; Folstein, S.E.; McHugh, P.R. Mini-Mental State. J. Psychiatr. Res. 1975, 12, 189–198. [Google Scholar] [CrossRef] [PubMed]
- Fan, H.; Meng, Y.; Zhu, L.; Fan, M.; Wang, D.-M.; Zhao, Y.-Q. A Review of Methods for Assessment of Cognitive Function in High-Altitude Hypoxic Environments. Brain Behav. 2024, 14, e3418. [Google Scholar] [CrossRef]
- McNeish, D.; Harring, J. Covariance Pattern Mixture Models: Eliminating Random Effects to Improve Convergence and Performance. Behav. Res. Methods 2020, 52, 947–979. [Google Scholar] [CrossRef] [PubMed]
- McNeish, D.M.; Stapleton, L.M. The Effect of Small Sample Size on Two-Level Model Estimates: A Review and Illustration. Educ. Psychol. Rev. 2016, 28, 295–314. [Google Scholar] [CrossRef]
- Rotz, W.; Joshee, A.; Yang, J. Degrees of Freedom and Confidence Interval Coverage in Complex Model Based Sampling and Estimation. In Proceedings of the Survey Research Methods Section. American Statistical Association 2006, Seattle, WA, USA, 6–10 August 2006; pp. 3610–3614. [Google Scholar]
- De Ville, B. Decision Trees. WIREs Comput. Stats 2013, 5, 448–455. [Google Scholar] [CrossRef]
- Timofeev, R. Classification and Regression Trees (CART) Theory and Applications; Humboldt University: Berlin, Germany, 2004; Volume 54, p. 48. [Google Scholar]
- Powar, J.D.; Dase, R.; Bhosle, D. Prediction of Diabetes Using Logistic Regression, Classification, and Regression Tree. J. Res. Med. Interpathy Sci. 2024, 2, 17–21. [Google Scholar]
- Jung, S.; Lee, J. Exploring a Conceptual Framework of Koreans’ Residential Satisfaction Based on Maslow’s Human Needs: A Qualitative and Quantitative Integrated Study. Sustainability 2023, 15, 14312. [Google Scholar] [CrossRef]
- Rutkowski, L.; Jaworski, M.; Pietruczuk, L.; Duda, P. The CART Decision Tree for Mining Data Streams. Inf. Sci. 2014, 266, 1–15. [Google Scholar] [CrossRef]
- Daniya, T.; Geetha, M.; Suresh Kumar, K. Classification and Regression Trees with Gini Index. Adv. Math. Sci. J. 2020, 9, 8237–8247. [Google Scholar] [CrossRef]
- Zou, K.H.; O’Malley, A.J.; Mauri, L. Receiver-Operating Characteristic Analysis for Evaluating Diagnostic Tests and Predictive Models. Circulation 2007, 115, 654–657. [Google Scholar] [CrossRef] [PubMed]
- Fan, J.; Upadhye, S.; Worster, A. Understanding Receiver Operating Characteristic (ROC) Curves. Can. J. Emerg. Med. 2006, 8, 19–20. [Google Scholar] [CrossRef]
- Hoo, Z.H.; Candlish, J.; Teare, D. What Is an ROC Curve? Emerg. Med. J. 2017, 34, 357–359. [Google Scholar] [CrossRef]
- Artigas, J.M.; Felipe, A.; Navea, A.; Fandiño, A.; Artigas, C. Spectral Transmission of the Human Crystalline Lens in Adult and Elderly Persons: Color and Total Transmission of Visible Light. Investig. Ophthalmol. Vis. Sci. 2012, 53, 4076–4084. [Google Scholar] [CrossRef]
- Fu, C.; Xiao, K.; Karatzas, D.; Wuerger, S. Investigation of Unique Hue Setting Changes with Ageing. Chin. Opt. Lett. 2011, 9, 053301. [Google Scholar] [CrossRef]
- Delcampo-Carda, A.; Torres-Barchino, A.; Serra-Lluch, J. Chromatic Interior Environments for the Elderly: A Literature Review. Color Res. Appl. 2019, 44, 381–395. [Google Scholar] [CrossRef]
- Wang, Z.-Y.; Cho, J.Y. Older Adults’ Response to Color Visibility in Indoor Residential Environment Using Eye-Tracking Technology. Sensors 2022, 22, 8766. [Google Scholar] [CrossRef]
- Mostafavi, A.; Xu, T.B.; Kalantari, S. Effects of Illuminance and Correlated Color Temperature on Emotional Responses and Lighting Adjustment Behaviors. J. Build. Eng. 2024, 86, 108833. [Google Scholar] [CrossRef]
- Wang, Y.; Liu, Q.; Gao, W.; Pointer, M.R.; Huang, Z.; Chen, W.; Wu, J. Interactive Effect of Illuminance and Correlated Colour Temperature on Colour Preference and Degree of White Light Sensation for Chinese Observers. Optik 2020, 224, 165675. [Google Scholar] [CrossRef]
- Maykot, J.K.; Rupp, R.F.; Ghisi, E. A Field Study about Gender and Thermal Comfort Temperatures in Office Buildings. Energy Build. 2018, 178, 254–264. [Google Scholar] [CrossRef]
- Cai, H.; Lin, Q.; Liu, H.; Yu, S.; Li, X.; Xiao, H. The Effects of Indoor Light Environment on Mood and Alertness Through Physiological Measurements. In Proceedings of the 2021 International Conference on Sensing, Measurement & Data Analytics in the era of Artificial Intelligence (ICSMD), Nanjing, China, 21–23 October 2021; pp. 1–4. [Google Scholar]
- Kuo, H.-K.; Jones, R.N.; Milberg, W.P.; Tennstedt, S.; Talbot, L.; Morris, J.N.; Lipsitz, L.A. Cognitive Function in Normal-Weight, Overweight, and Obese Older Adults: An Analysis of the Advanced Cognitive Training for Independent and Vital Elderly Cohort. J. Am. Geriatr. Soc. 2006, 54, 97–103. [Google Scholar] [CrossRef] [PubMed]
- Kiesswetter, E.; Schrader, E.; Diekmann, R.; Sieber, C.C.; Volkert, D. Varying Associations Between Body Mass Index and Physical and Cognitive Function in Three Samples of Older Adults Living in Different Settings. J. Gerontol. Ser. A 2015, 70, 1255–1261. [Google Scholar] [CrossRef] [PubMed]
- Kim, S.; Kim, Y.; Park, S.M. Body Mass Index and Decline of Cognitive Function. PLoS ONE 2016, 11, e0148908. [Google Scholar] [CrossRef]
- Noh, H.-M.; Oh, S.; Song, H.J.; Lee, E.Y.; Jeong, J.-Y.; Ryu, O.-H.; Hong, K.-S.; Kim, D.-H. Relationships between Cognitive Function and Body Composition among Community-Dwelling Older Adults: A Cross-Sectional Study. BMC Geriatr. 2017, 17, 259. [Google Scholar] [CrossRef] [PubMed]
- Visnovcova, Z.; Mestanik, M.; Gala, M.; Mestanikova, A.; Tonhajzerova, I. The Complexity of Electrodermal Activity Is Altered in Mental Cognitive Stressors. Comput. Biol. Med. 2016, 79, 123–129. [Google Scholar] [CrossRef]


Disclaimer/Publisher’s Note: The statements, opinions and data contained in all publications are solely those of the individual author(s) and contributor(s) and not of MDPI and/or the editor(s). MDPI and/or the editor(s) disclaim responsibility for any injury to people or property resulting from any ideas, methods, instructions or products referred to in the content. |
© 2026 by the authors. Published by MDPI on behalf of the Swiss Federation of Clinical Neuro-Societies. Licensee MDPI, Basel, Switzerland. This article is an open access article distributed under the terms and conditions of the Creative Commons Attribution (CC BY) license.