1. Introduction
The liquid flow behavior in nanoscale pores is of interest in the fields of oil and gas recovery, energy storage [
1], water purification [
2] and nano-filtration [
3]. The results reported in the literature, including both experimental and theoretical research, have shown that the flow of water in hydrophobic nanopores is enhanced compared to that predicted by the no-slip boundary condition of the Hagen-Poiseuille (HP) law [
4,
5,
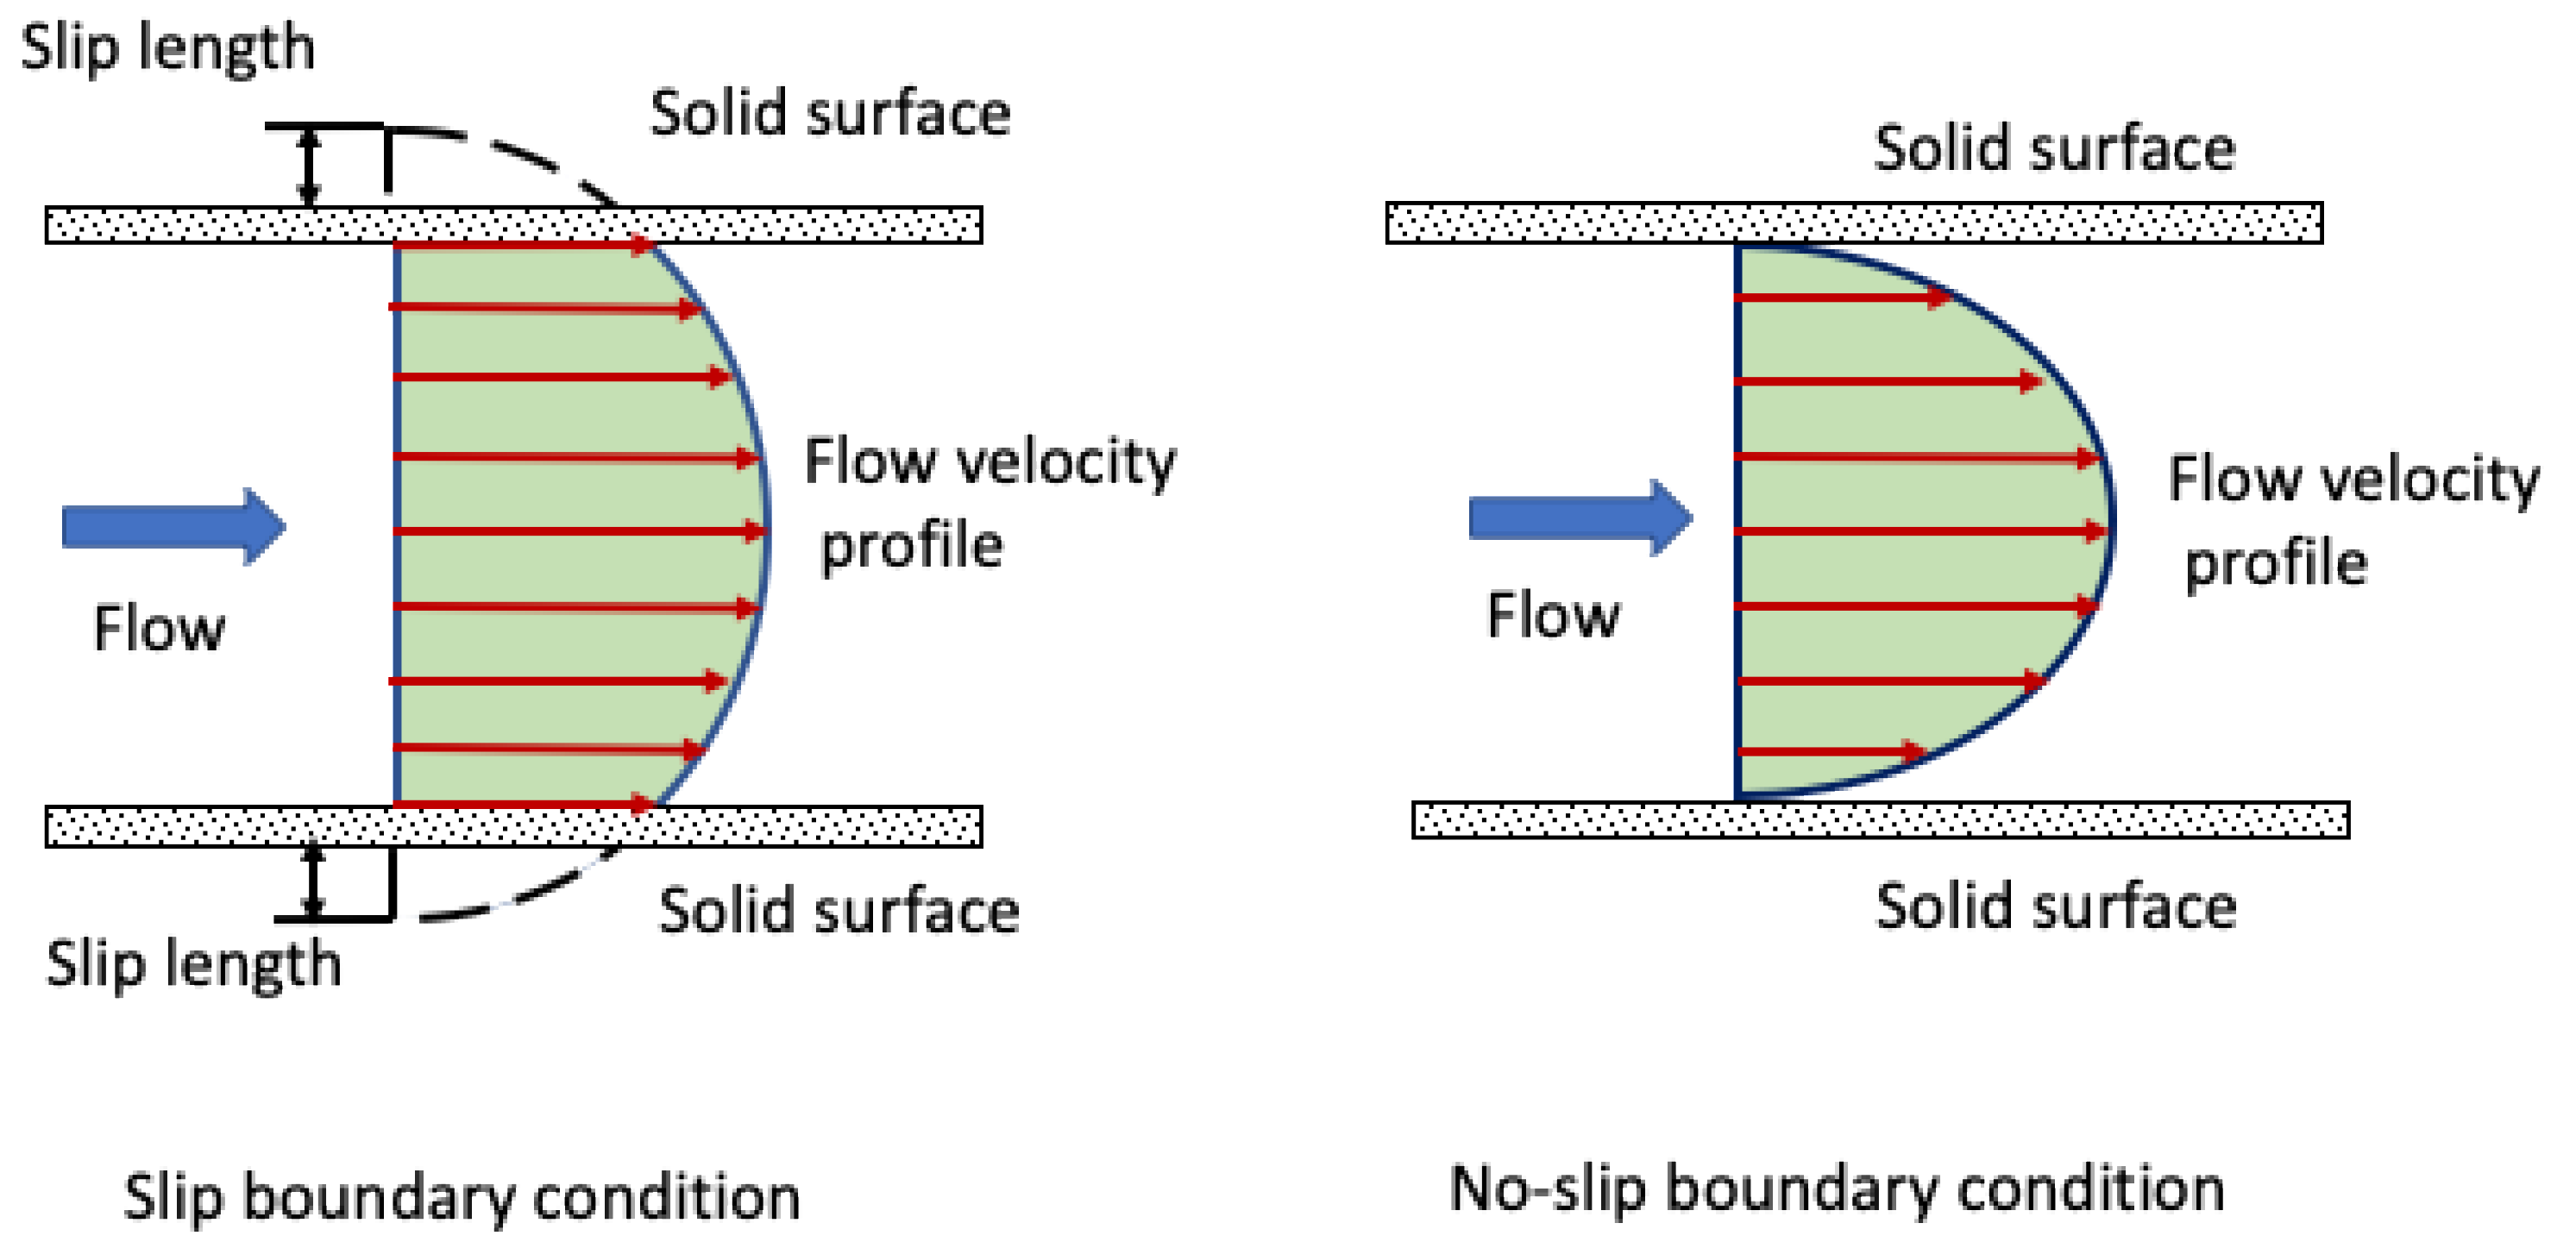
6]. The velocity profile of the flow in a nanotube is illustrated in
Figure 1, with and without slip. The enhanced water flow is described by the boundary slip condition, which is determined by many physical characteristics of the system, including pore wall interactions with water molecules (which can be described by wettability and/or contact angle measurements at the wall surface), pore wall surface roughness, shear rate, gas films or nanobubbles, viscosity, temperature, pore dimensions, and pressure gradient.
The boundary condition is one of the most critical factors that determines the mechanics of water flow. For decades, the no-slip condition has been discussed in most of the literature on classical fluid mechanics. The relative flow velocity of water in contact with a solid surface is zero due to immobilized water molecules. However, the study of micro/nanoelectromechanical systems and micro/nanoscale fluidic systems has rapidly developed in recent years and the no-slip condition has not been able to explain flow in these micro/nanoscale fluid systems. The slip length and flow enhancement factors have been determined experimentally and from theory [
4,
5,
6,
7].
However, the structural characteristics and rheological properties of the nanoconfined water layer at hydrophobic and hydrophilic surfaces continue to be the subject of discussion and debate. This unsatisfactory situation is due mainly to the lack of direct, high-resolution measurements of water structure at nanoconfined conditions. Direct experimental and simulation measurements of the normal, lateral force [
8] and viscosity of interfacial water [
9] have been reported. Molecular dynamics simulations (MDS) point out additional factors contributing to the slip length, which include the wetting characteristics (contact angle) and surface morphology (roughness and texture) [
10]. Atomic force microscopy (AFM) has been used to measure slip length at the surface of highly oriented pyrolytic graphite (HOPG) [
11], mica surfaces with various surfactants (such as octadecyltrichlorosilane, OTS) to modify surface wettability [
12], and synthetic materials [
13], which manifest the effect of surface wettability on slip length. In addition, the flow boundary condition is also dependent on surface modification which can become more complex, for example, with modification by OTS. Ye’s study [
14] of interfacial water structure at a fused quartz surface modified by OTS indicated that both the terminal amino group of the OTS and the silanol group on the quartz substrate had significant effects on the interfacial water molecules. However, for natural hydrophobic minerals, the influences of surface modifications are avoided, and the influence of wettability on slip flow can be considered for such natural hydrophobic mineral surfaces. Hydrophilic surfaces bear electric charges or polar groups that coordinate water molecules. In contrast, non-polar surfaces are generally hydrophobic. Thus the polarity of the surface state leads to differences in interfacial water structure, and in the case of hydrophobic surfaces, may lead to the stabilization of surface nanobubbles of various sizes and shapes as reported in the literature [
15].
Experimental study is needed to determine the slip length and should be explained by considering the complexity of the interfacial water structure. Here, direct high-resolution atomic force microscopy measurements of slip length were made for different phyllosilicate surfaces, including the hydrophobic talc surface and the hydrophilic mica surface. An AFM colloidal probe technique was used to measure the effective slip length for water at these silica surfaces of different wettability. According to the hydrodynamic force measured by the AFM colloidal probe at different velocities, the effect of wettability on slip length was investigated. The results from experiments and simulations are integrated to give an explanation of the variation in slip length for selected natural phyllosilicate surfaces. The important role of gas nanobubbles at the natural talc surface is suggested to explain the slip lengths observed.
2. Materials and Methods
2.1. Preparation of Sample Surface
The hydrophilic and hydrophobic silica surfaces used in this study were muscovite mica (V-1 grade, SPI Supplies, West Chester, PA, USA) and talc (Argonaut Mine, Ludlow, VT, USA). To prepare atomically smooth and pure surfaces prior to the AFM experiments, the talc and mica samples were cleaved before use by removing the top layers with scotch tape. The talc surface rms roughness was found to be 1.6 nm, and the mica surface roughness was about 0.2–0.3 nm.
Millipore DI water (18 MΩ·cm) was used for all of the experiments.
2.2. AFM Colloidal Probe Preparation
A tipless cantilever with a glass sphere attached was used for the AFM experiments. Specifically, a borosilicate glass microsphere (GL0179B6/45, Mo-sci Corporation, Rolla, MO, USA) 45 μm ± 7% in diameter (rms roughness was found to be about 3.8 nm at 2 × 2 um
2 in this study), was glued to a silicon nitride V-shaped tipless cantilever (NP-O10, Bruker, Watsonville, CA, USA) using resin which has a low melting temperature (Epon Resin, 1004F, Shell Chemical Company, Sylmar, CA, USA). The marked spring constant values of the cantilevers were in the range of 0.06–0.24 N/m. In this research, the spring constants of the cantilevers were calibrated after the colloidal sphere was attached. Calibration of the spring constants was accomplished using the thermal tune method based on measuring thermal noise, which provides a quick and accurate determination of the cantilever spring constant under 1N/m. An SEM image of the colloidal probe is shown in
Figure 2.
2.3. Calculation of Boundary Slip Length from AFM Measurements
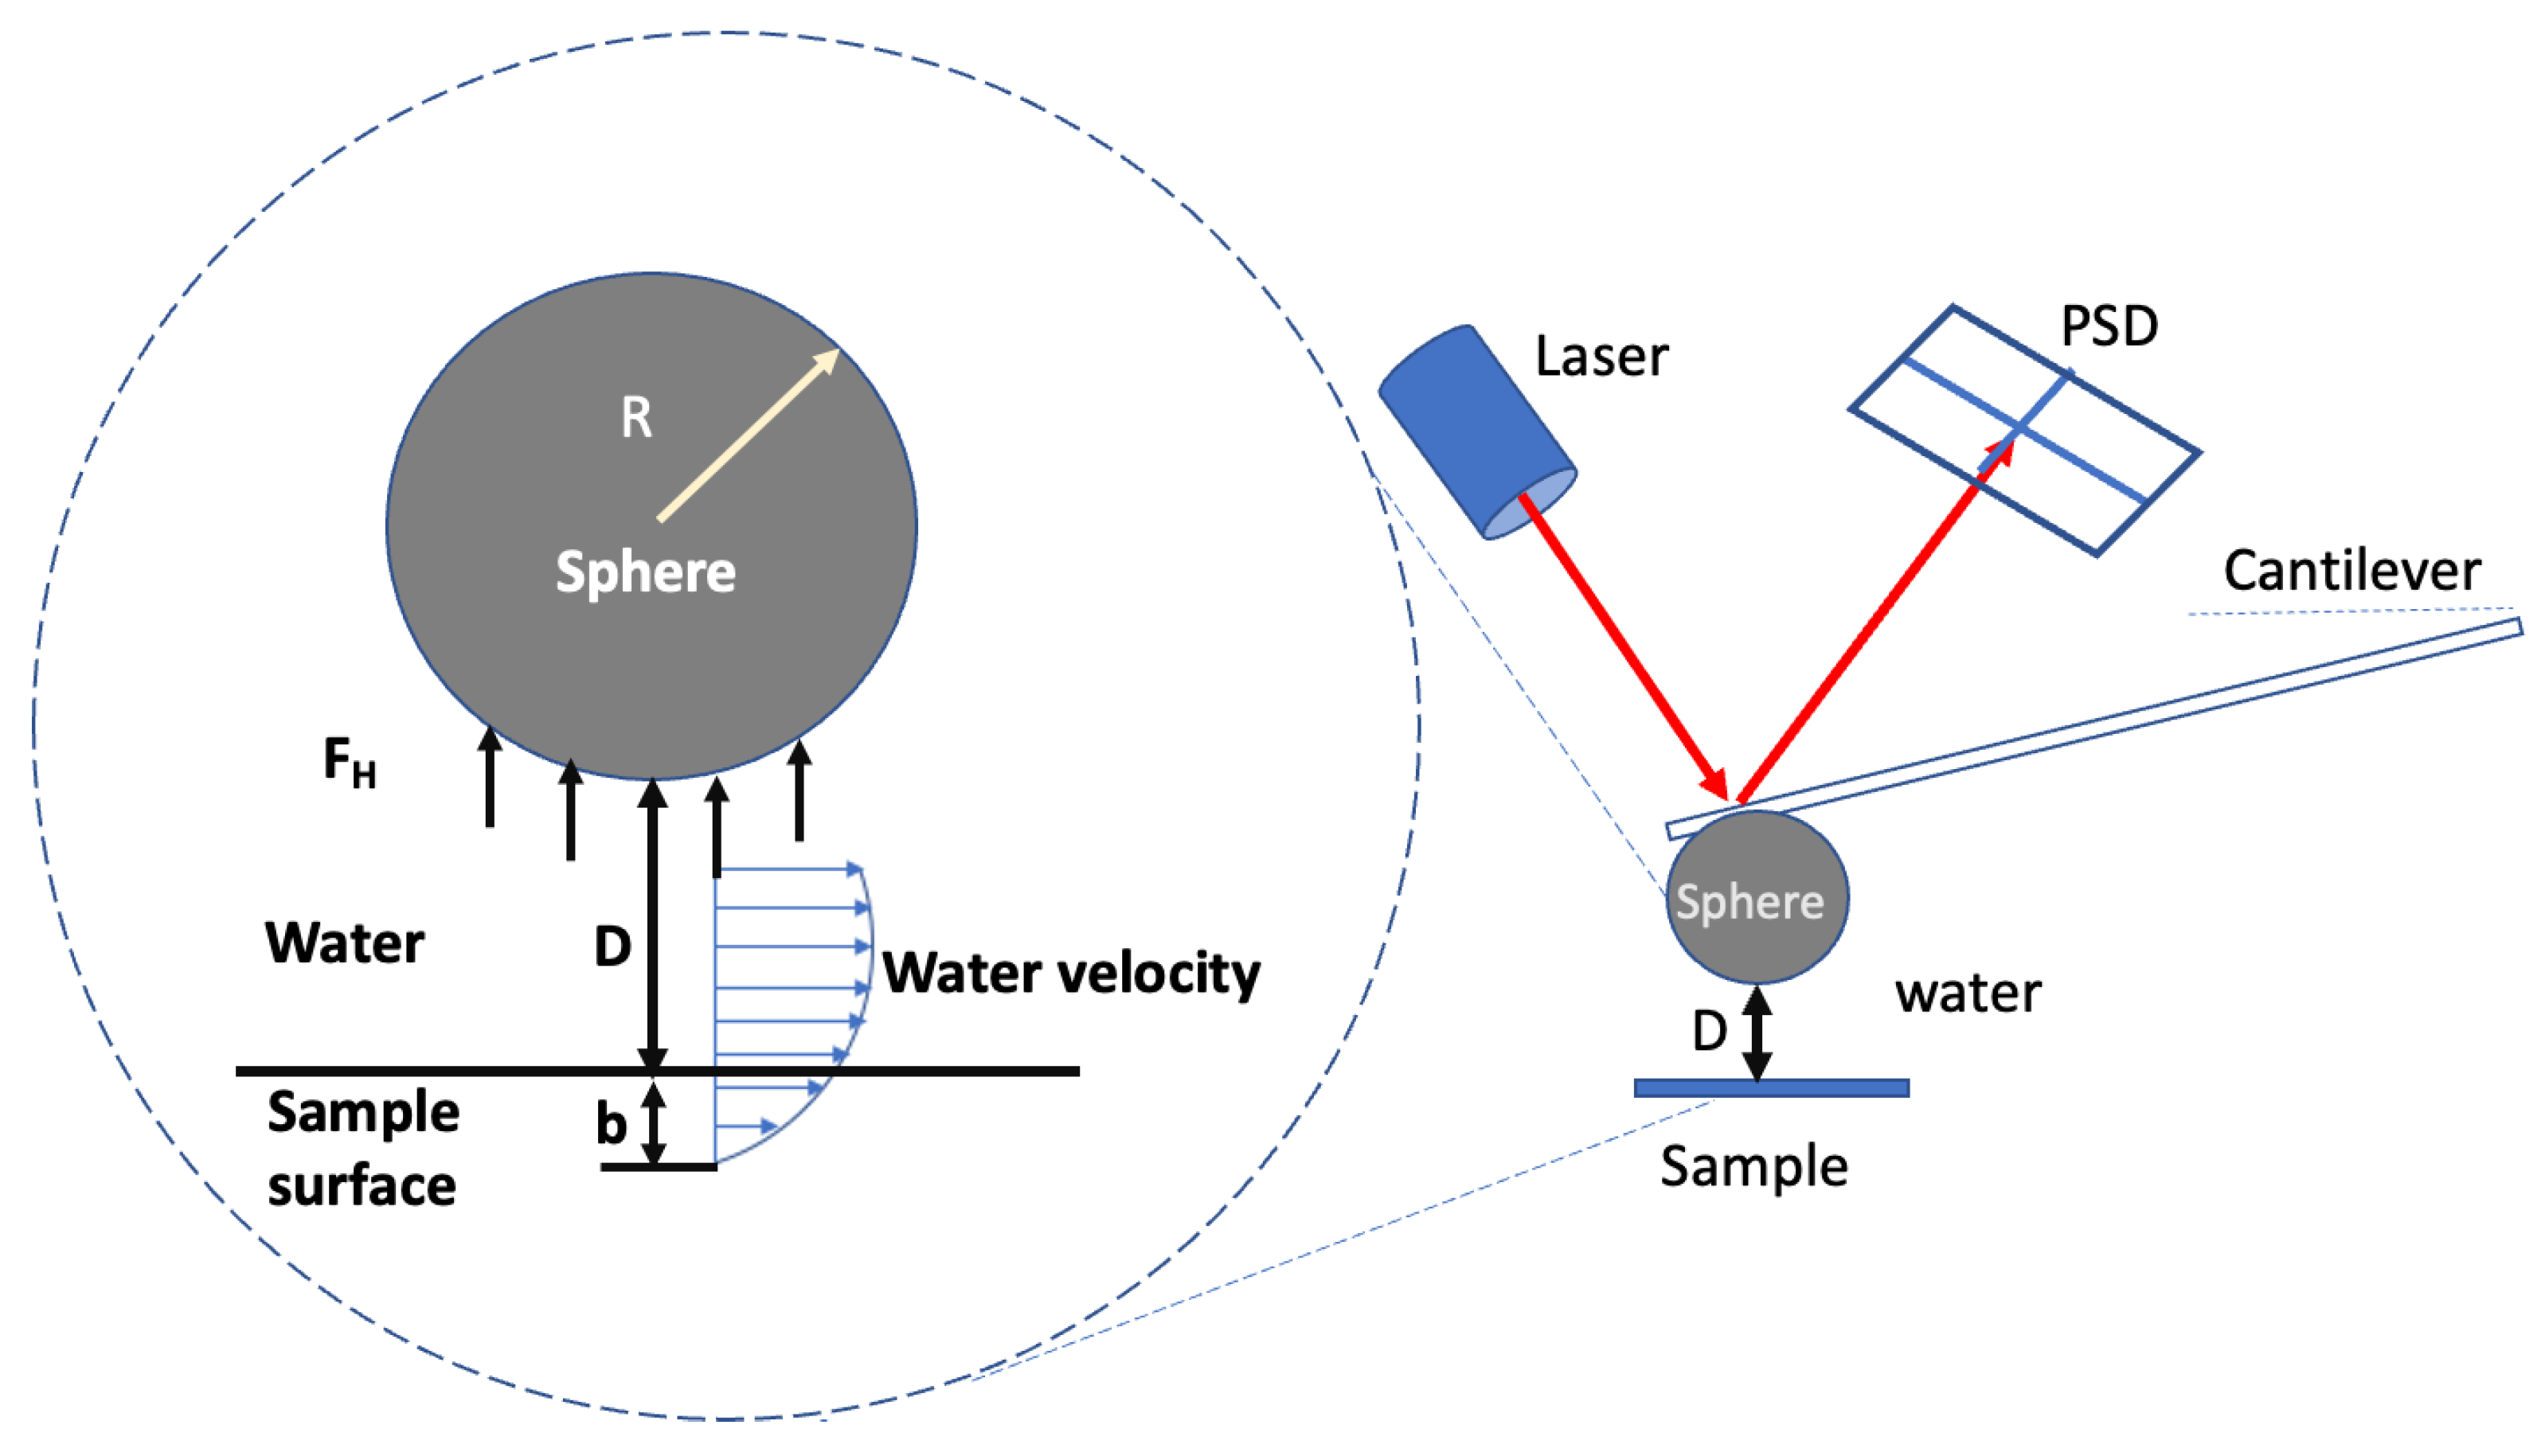
The AFM used was a MultiMode instrument with NanoScope 7.20 software (Bruker, Watsonville, CA, USA). The hydrodynamic force was measured to determine the slip length by driving the probe at a certain velocity towards the silica surface while it was immersed in water. By analyzing the force acting on the microsphere probe, which includes mainly the hydrodynamic force and the total colloid force (including the electrostatic force, van der Waals force, and other forces), the slip length can be calculated. Shown in
Figure 3 is a schematic illustration of the AFM slip length measurement at a surface.
Figure 3 shows that as the colloidal sphere approaches the surface, water is driven, and flow is created. The spherical borosilicate glass probe has a hydrophilic surface which is expected to exhibit a no-slip condition. Above the water/solid interface, the arrows represent the waterflow velocity profile and the flow direction with a slip flow boundary condition.
In this setup, when the microsphere approaches the sample surface, based on the Navier–Stokes equation and a no-slip boundary assumption, the hydrodynamic drainage force can be determined by the following equation [
16,
17]:
where
FH is the hydrodynamic drainage force, 𝜂 is the bulk dynamic viscosity,
V is the approach velocity of the colloidal microsphere,
R is the radius of the microsphere, and
D is the distance between the microsphere and the substrate. When boundary slip has occurred, the hydrodynamic drainage force, Equation (1), can be rewritten as [
16,
17]:
where
f* is the slip effect factor with a slip length of
b:
Thus, with known experimental parameters, including the microsphere radius, liquid viscosity, microsphere approach velocity, and distance between the probe and solid surface, measurement of the hydrodynamic drainage force can be used to calculate the slip length b, if slip occurs.
In the case of a large separation distance (
D >
b) as discussed by Cottin-Bizonne et al. (2008) [
12], the data can be presented in the form
V/FH:
where
beff is the effective slip length.
The benefit of presenting the data in terms of V/FH is that for V/FH, the separation distance plot exhibits a linear relationship based on Equation (4), and the effective slip length is determined by the intercept of the extended linear line on the distance axis in the V/FH—separation distance plot.
AFM can give a precise measurement of the hydrodynamic force. Major forces, the hydrodynamic force and the total colloidal force, will act on the probe when the probe approaches the solid surface at a high velocity. The total colloidal force can be determined at a low approach velocity. Then, the hydrodynamic force can be determined by subtraction of the total colloidal force from the force data obtained at a high approach velocity [
18].
In the current study, a low approach velocity was used to determine the total colloidal force. When the velocity of the colloidal microsphere is sufficiently small, the hydrodynamic force, which is proportional to the velocity, is sufficiently small and is negligible when compared to the total colloidal force. Thus, the force acting on the colloidal microsphere at a low velocity is primarily from the total colloidal force.
2.4. AFM Scanning
Choosing a suitable AFM scan mode for different conditions is important to achieve the prospective results. In this research, the experiments were conducted in DI water at pH 6.00. The ionic strength was not adjusted. Therefore, the AFM contact mode was selected for the boundary slip measurements rather than the tapping mode. Before measuring the hydrodynamic force, two calibrations were necessary. First, the contact force between the tip and the sample, the deflection sensitivity calibration, which converts the raw photodiode signal (in volts) to deflection of the cantilever (in nm), was calculated. The sensitivity is equal to the inverse of the force curve slope while the cantilever is in contact with a hard sample surface. Second, it was confirmed that the probe was adequately withdrawn from the sample surface and that the cantilever spring constant was accurately determined using the thermal tune method. As described in
Section 2.3, the colloidal probe approach velocity was the regulated parameter for the hydrodynamic force measurements. A high velocity of 78.1 μm/s was used to reflect the resultant hydrodynamic force. The total colloidal force was determined at a low velocity of 0.22 μm/s. A pause time of 1s between the approach and retraction of the AFM probe was set to make sure that the microsphere of the AFM tip had contacted the sample surface. The force curves with different velocities were tested repeatedly, and the final data were captured after the force curve stabilized. NanoScope analysis 1.8 was employed for the offline data analysis.
3. Results
The original force curve data included both the approach and retraction curves, which represent data for the Z direction when the piezotube of the AFM scanner approached to (increased Z displacement), and retracted from (decreased Z displacement), the sample surface, resulting in the colloidal probe approaching and moving away from the surface. This research focused on the hydrodynamic drainage force associated with the approach curve when the microsphere approached the surface. The original cantilever deflection as a function of piezotube displacement (Z displacement) can be obtained during ramp approach to the sample surface, as shown in
Figure 4. The deflection-Z displacement curve represents the comprehensive forces with different regions reflecting different interactions. When the probe was farther away from the surface, the probe did not experience the hydrodynamic force. Thus, the deflection-Z displacement curve is almost a linear relationship, as shown by the horizontal line region on the left side of
Figure 4 (note that increased Z displacement represents the probe being closer to the sample surface). As the probe moved close to the surface, the hydrodynamic force and the total colloidal force appeared, and the displacement curves were no longer linear. As the microsphere probe contacted the surface, the deflection changed linearly with the displacement, as shown on the right side of the curves in
Figure 4, indicating larger displacement.
The deflection-Z displacement curves in
Figure 4 are important for data calibration, which significantly affects the slip length estimates. Different parts of the force curves represent different interactions such as the adhesion force, electrostatic force and hydrodynamic force. In this research, to determine the forces in the region close to the surface, two straight lines were drawn through the linear portions of the deflection-Z displacement curves. The data in the zone between the intersection of the two straight lines was used to construct the resultant force curve. The procedure is illustrated in
Figure 5. The ordinate is the resultant force which at a velocity of 78.1 μm/s is defined as the total force (
FT), which includes the hydrodynamic force and the total colloidal force; whereas the resultant force at a low velocity (0.22 μm/s) is defined as total colloid force (
Fcoll). The total force is calculated from Hooke’s Law in which the spring constants of the cantilevers, obtained by the thermal tune method, were found to be 0.35 N/m and 0.25 N/m for the mica and talc experiments, respectively. The abscissa is the separation distance, which means the distance between the microsphere and the surface. The original abscissa was shifted and the origin for the abscissa was located at the position for contact between the probe and the surface.
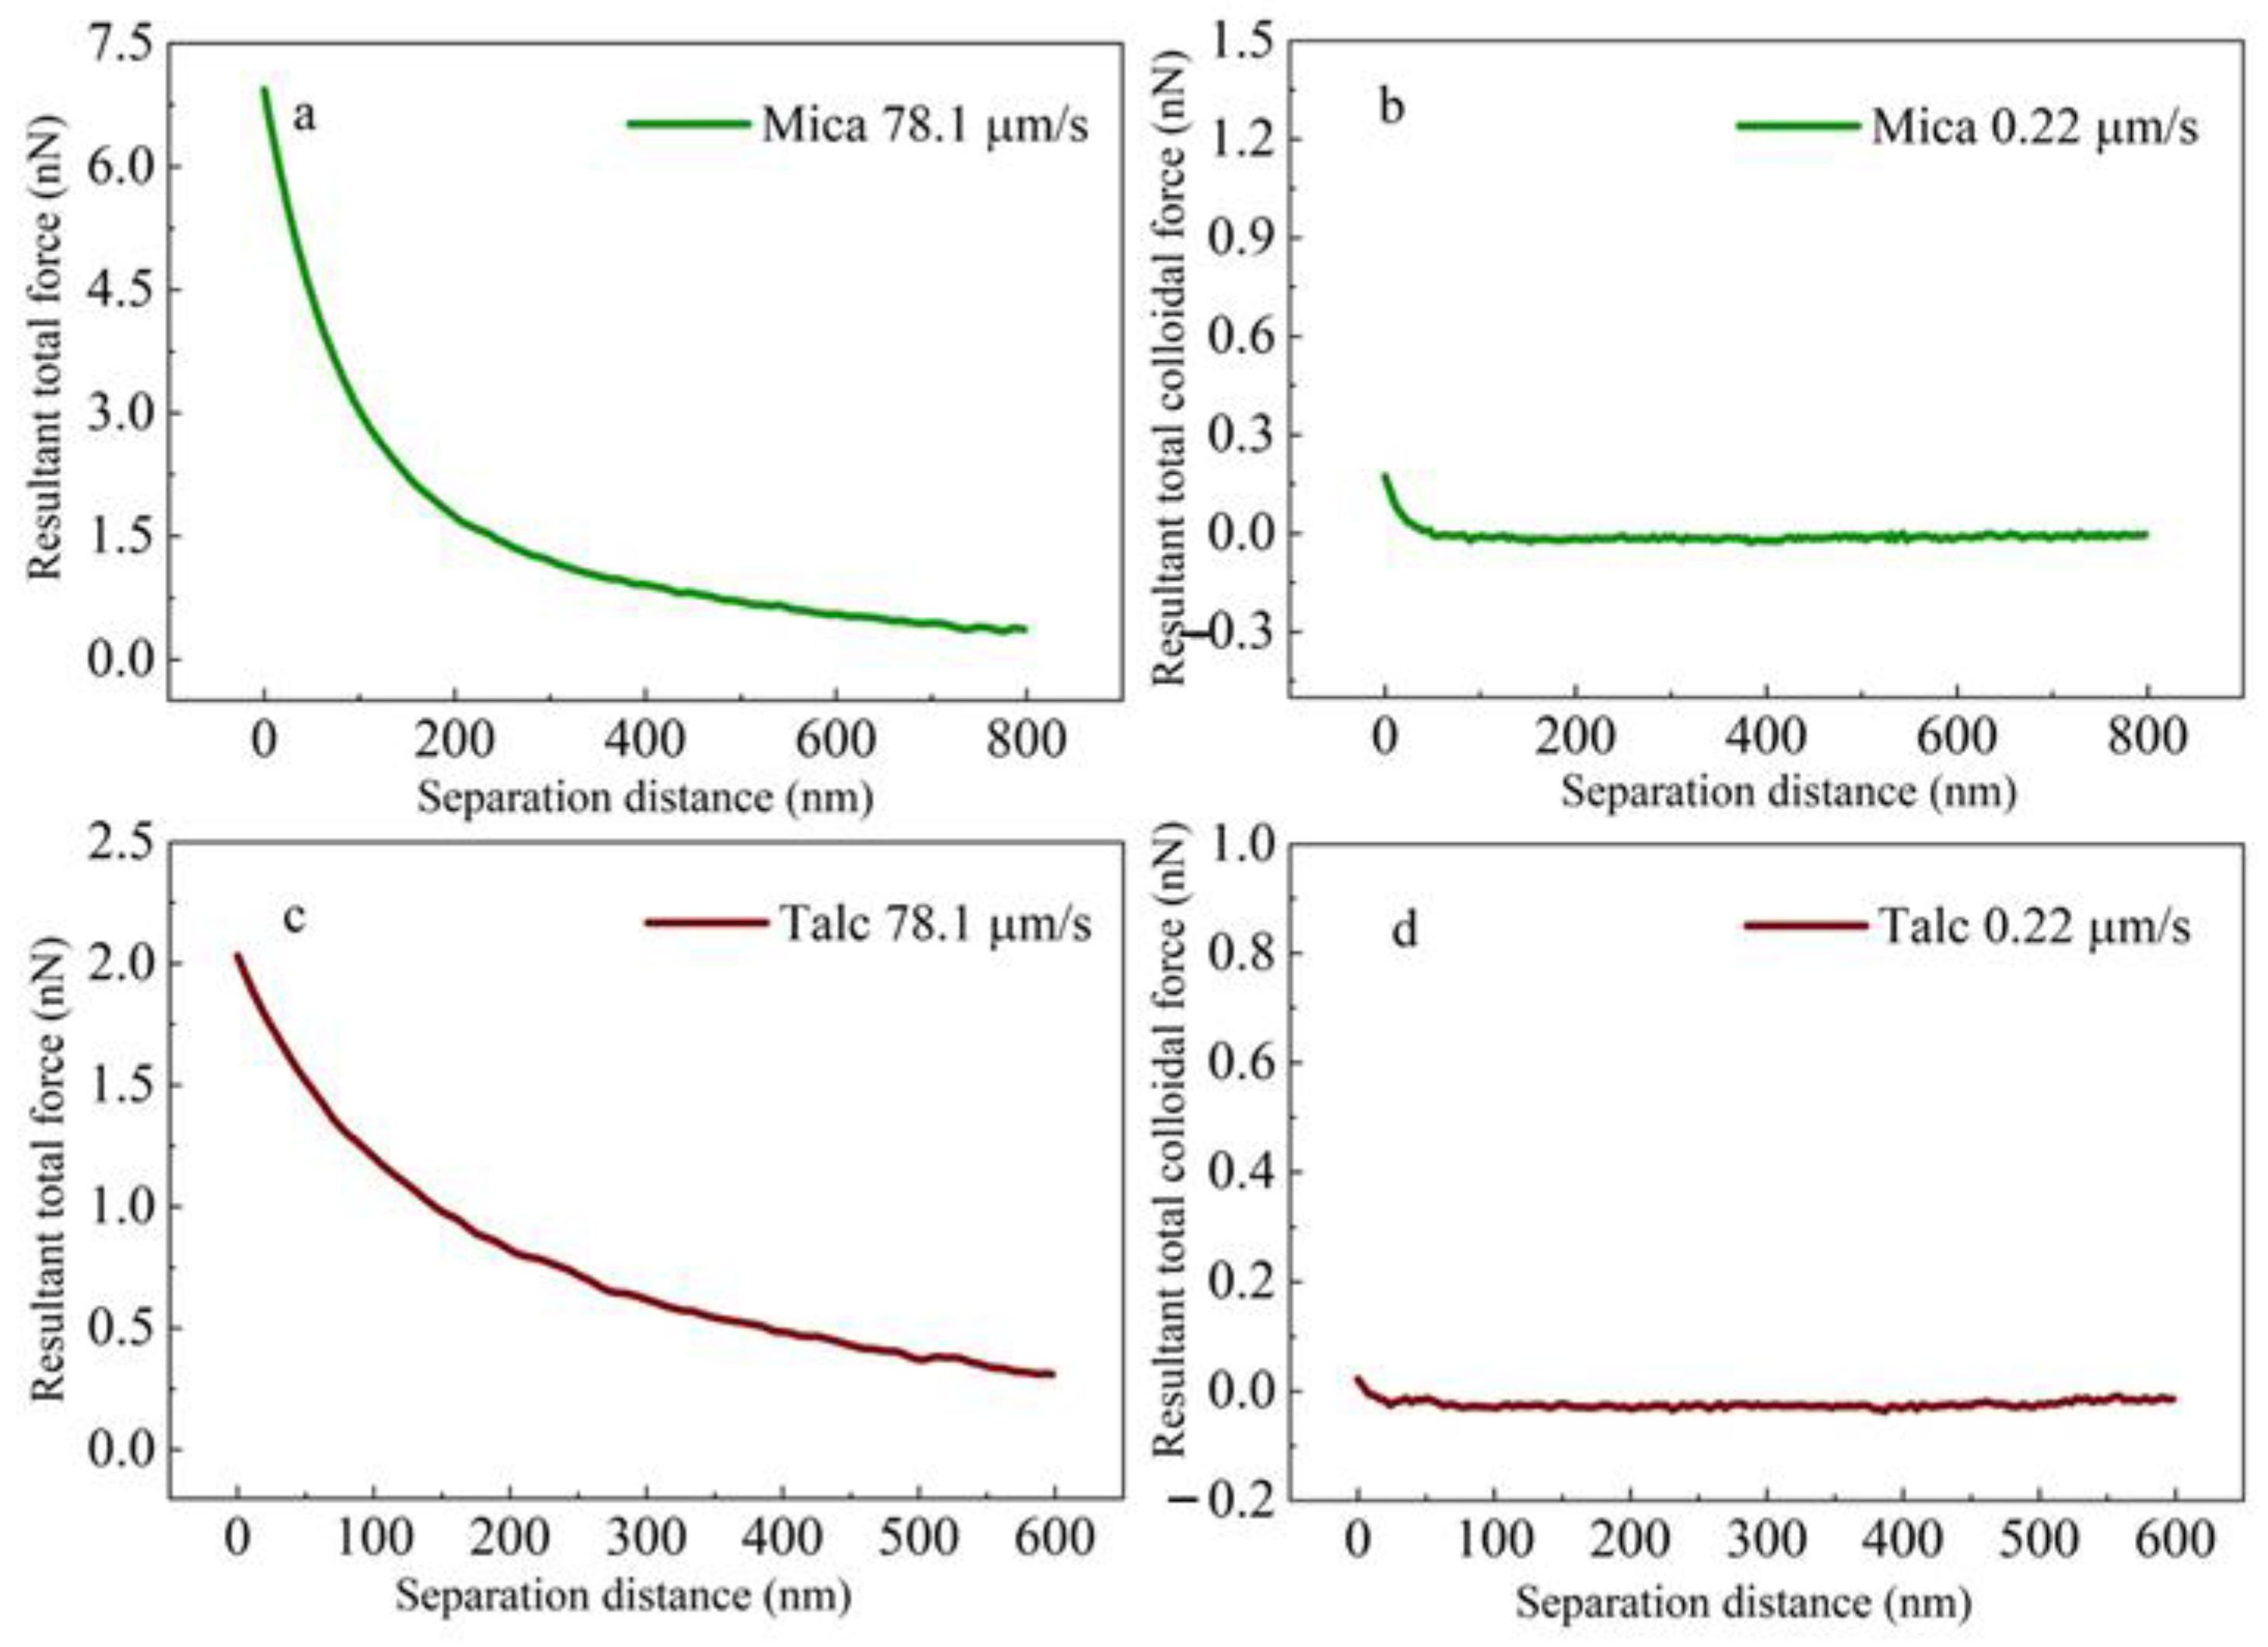
Figure 6a, and c were obtained from
Figure 4 for the velocity of 78.1 μm/s, and this resultant force is the total force (
FT) including the hydrodynamic force (
FH) and the total colloidal force (
Fcoll). The resultant force of mica was greater than that of talc, which indicates the existence of the boundary slip on the surface of talc.
Figure 6b, and d show the total colloidal force obtained at a ramp velocity of 0.22 μm/s.
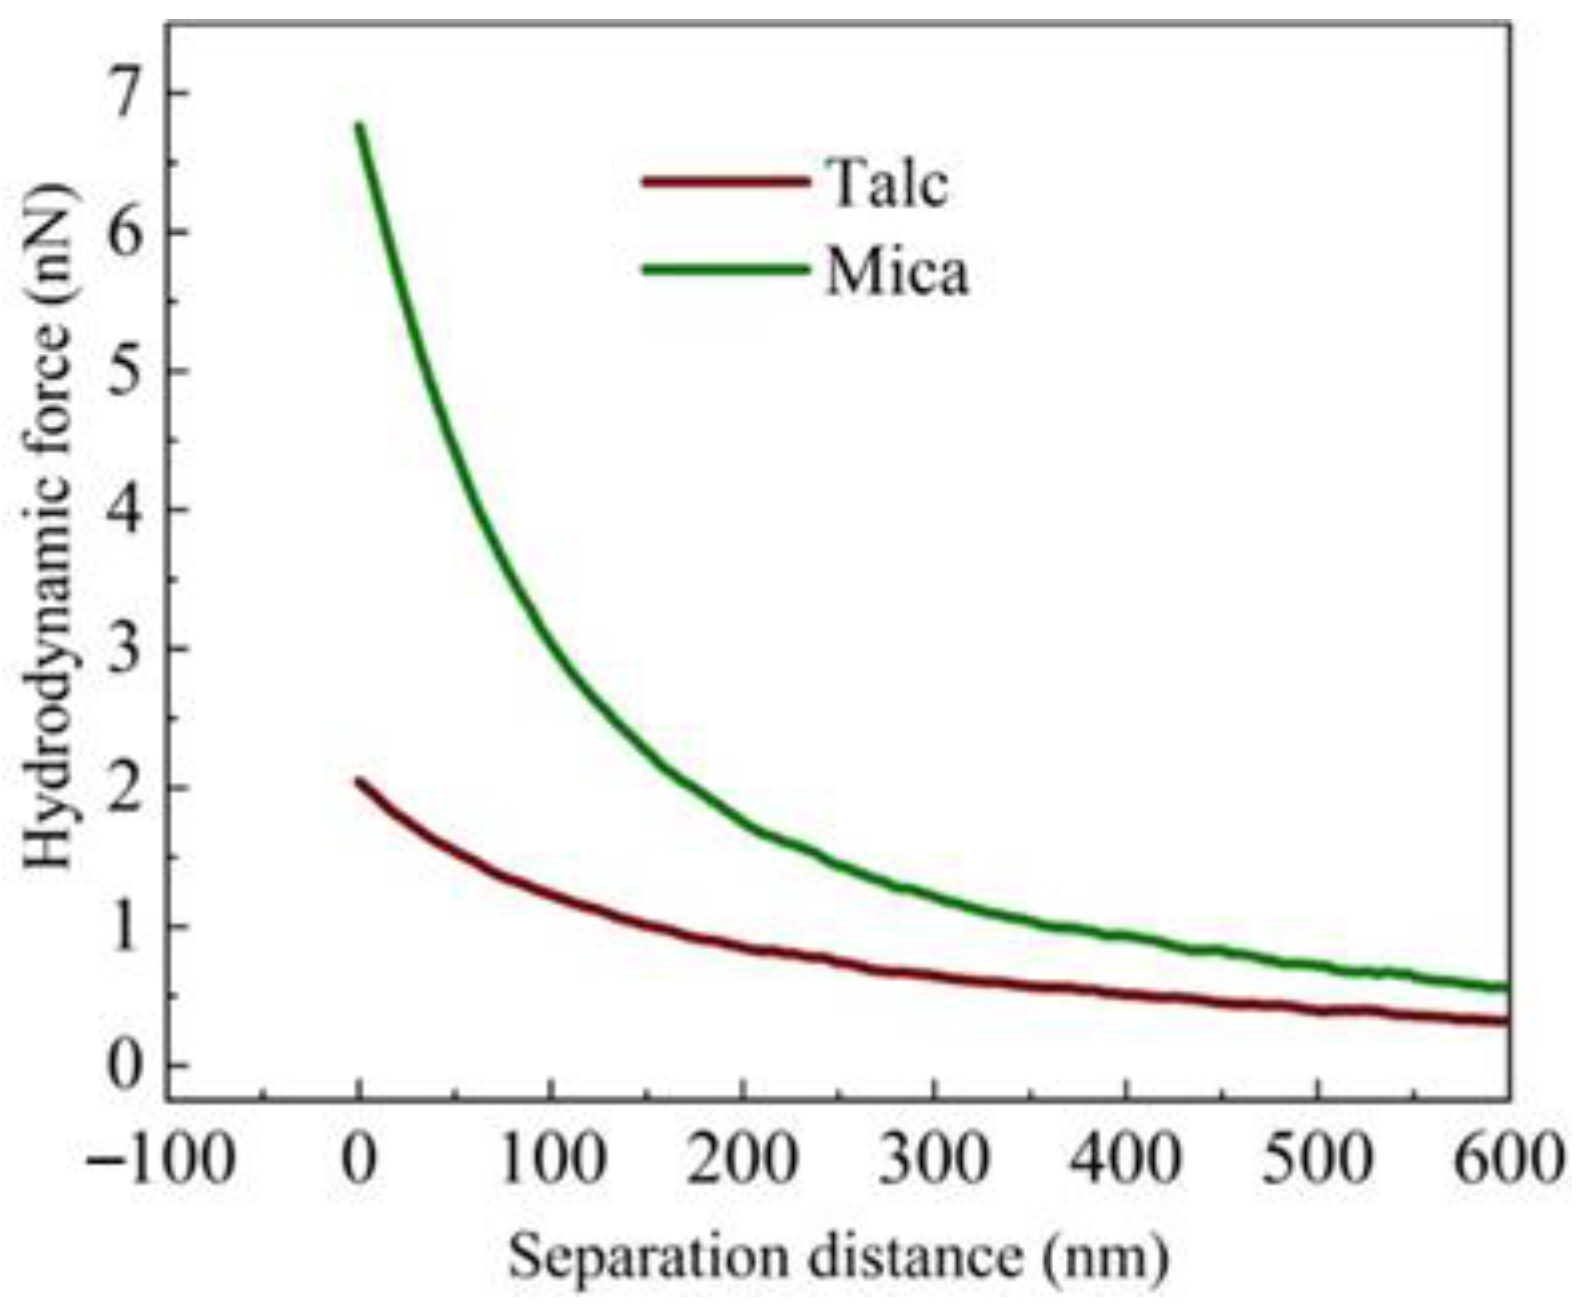
To obtain the hydrodynamic force experienced by the AFM microsphere probe, the total colloidal force should be excluded from the total force. Based on the equation,
, the influence of the total colloidal force can be subtracted from the total force curve. The hydrodynamic forces for the mica and talc surfaces are shown in
Figure 7. Finally, using the data in
Figure 7, the curve for the
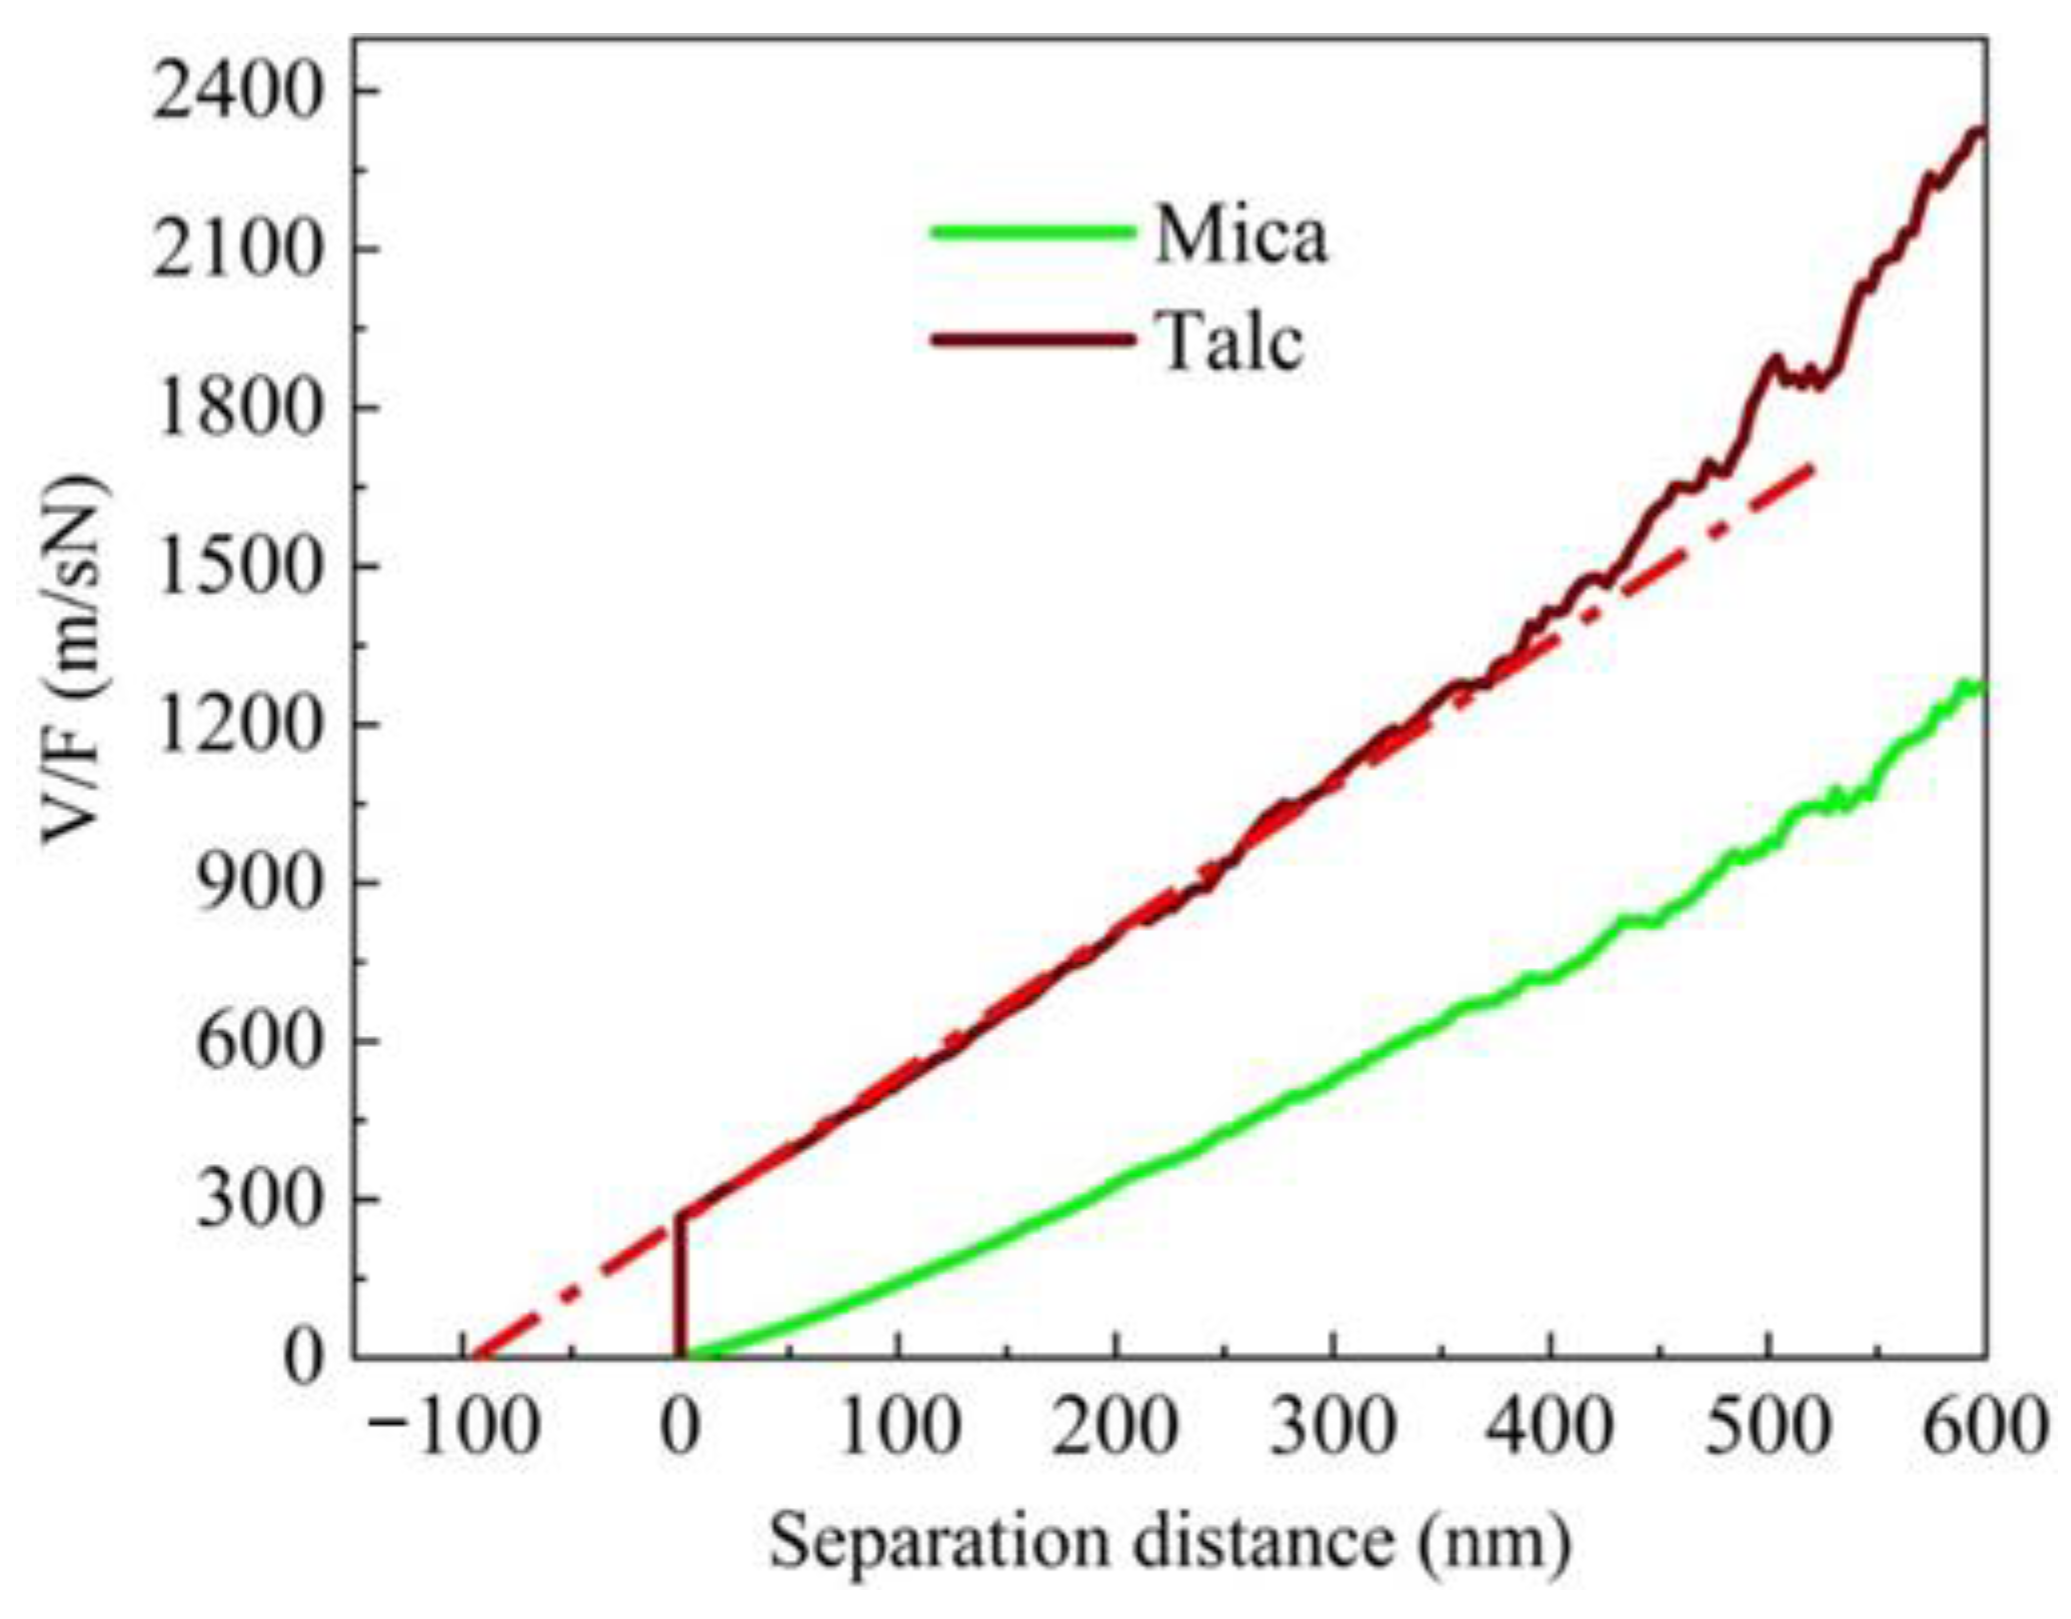
-distance plot was made and is shown in
Figure 8.
It can be seen that the
-separation distance plot in
Figure 8 exhibits a linear relationship. By extending the linear line to the separation distance axis, the slip length is determined at the intersection on the separation distance axis. From the data in
Figure 8, it can be seen that a slip length of zero is consistent with a no-slip boundary condition at the hydrophilic mica surface. In contrast, slip was observed for the hydrophobic talc surface in DI water with a slip length of about 95 nm.
It is clear that the slip length is significantly affected by the surface wettability, which can be described by contact angle measurements. The sessile drop water contact angle at the mica surface was found to be about 10 degrees, whereas at the talc surface the contact angle was about 75 degrees. It can be concluded that at the hydrophilic mica surface, there is a no-slip boundary condition. On the other hand, there is a slip boundary condition for water at the hydrophobic talc surface. Thus, water flow enhancement would be expected in porous structures having siloxane surfaces similar to talc.
4. Discussion
Talc is a clay mineral with the chemical formula Mg
3(Si
4O
10)(OH)
2, and is composed of three layers, with the magnesium-oxygen/hydroxyl octahedral layer sandwiched between two silicon-oxygen tetrahedral outer layers (basal planes), which on cleavage form a siloxane surface structure. The absence of active sites (without hydroxyl groups) on this basal plane surface accounts for its natural hydrophobicity. In previous studies [
19,
20], the interfacial water structure at talc surfaces was examined using molecular dynamics simulation (MDS). The MDS snapshots of water molecules near the basal plane of the talc crystal are shown in
Figure 9. It can be seen that there is a gap between the water phase and the talc basal plane surface (
Figure 9), indicating the presence of the “excluded volume” or “hard wall” effect at the water-talc interface [
21]. This water exclusion zone is about 3.2 Å thick at the talc surface. The results from MDS indicate weak interactions between the water molecules and the basal plane of talc due to the lack of specific hydrogen interaction donors and/or acceptor sites on the basal plane. Interfacial water density analysis indicates that water molecules are not accommodated at the talc basal plane surface; this water exclusion zone explains the natural hydrophobicity of the talc surface.
In contrast to the trilayer talc structure, the trilayer mica structure has aluminum substituted for silicon in the silica tetrahedral layer. This substitution in the tetrahedral layer increases the polarity of the mica face surface and accounts for the hydrophilic surface state of mica [
19]. Previous MDS research has indicated strong interaction between the water molecules and the silica tetrahedral layer of the mica surface. The water exclusion zone was not observed in MD simulations of mica surfaces [
22].
Based on the above discussion, it is expected that surface wettability has a significant effect on the boundary slip length. The different results obtained from water structure analysis for hydrophobic and hydrophilic surfaces explain a more stable interaction between water molecules and hydrophilic surfaces; thus accounting for the no-slip boundary conditions at hydrophilic surfaces.
In contrast, the water exclusion zone accounts for a decrease of interfacial viscosity and slip at hydrophobic surfaces. The slip flow velocity on the wall is related to the bulk shear stress by the following equation [
23]:
where
νb is the liquid bulk flow rate,
Z is the axis perpendicular to the wall, and
b is the slip length. If the interfacial viscosity is defined as the average value,
μs, the order of magnitude,
b, can be expressed as [
23]:
where
δ is the thickness of the boundary layer, and
μb is the bulk viscosity. According to equations 1 and 2, in the case of the no-slip boundary condition, the slip length
b → 0 and
νs = 0. At
b→∞, ∂
νb/∂
z = 0 which corresponds to the condition for a complete slip at the liquid/gas interface. Even though it is an idealized case, it is reasonable to assume that slip, in principle, is due to the water exclusion zone at hydrophobic solid interfaces.
The water exclusion zone of about 3.2 Å existing at hydrophobic surfaces such as talc, reveals a decreased interaction of water molecules with hydrophobic surfaces, so that boundary slip is expected to exist at such hydrophobic surfaces. In this regard, the water exclusion zone at hydrophobic surfaces seems to be important to account for the slip boundary condition.
It is important to notice that the difference in slip length between the theoretical calculations (including molecular simulations) and the experimental measurements is very large. For example, our recent molecular simulation for water flow in a 3 nm slit pore shows that the slip length is about 0.5 nm [
24] which is much smaller than that from AFM slip length measurements (in this study, about 95 nm at the talc surface). The 0.5 nm slip length from flow simulation at a talc surface seems to correspond to the water exclusion zone thickness (~0.32 nm). The large slip length as measured experimentally may be caused by surface nanobubbles at the water/talc interface [
25,
26,
27]. In this current study, nanobubbles were observed at the talc surface, as shown by the tapping mode AFM image in
Figure 10. An AFM image of the mica surface under the corresponding conditions is also included in
Figure 10 to compare with nanobubbles present at the talc surface. According to the AFM image the pancake nanobubbles are 100–500 nm in diameter and 10–30 nm in height. The slip length of 95 nm from the AFM measurements roughly corresponds to the height of the pancake nanobubbles. Some theoretical models have been proposed which relate slip length to average bubble height [
28,
29]. Such small bubbles have been found on methylated quartz capillaries in a nitrogen gas-saturated solution [
30]. These results suggest that the height of the surface nanobubbles is one of the important features that accounts for the increased slip length. Both experimental results and theoretical calculations indicate that the presence of surface nanobubbles increases the slip length. The variation of slip length measurements reported by different laboratories may be due to differences in surface nanobubble size, shape, height, and coverage.


