Abstract
Hyperbilirubinemia, commonly known as jaundice, is a prevalent condition in newborns, primarily arising from alterations in red blood cell metabolism during the first week of life. While conventional diagnostic methods, such as serum analysis and transcutaneous bilirubinometry, are effective, there remains a critical need for robust, non-invasive, image-based diagnostic tools. In this study, we propose a custom-designed convolutional neural network for classifying jaundice in neonatal images. Image preprocessing and segmentation techniques were systematically evaluated. The optimal workflow, which incorporated contrast enhancement and the extraction of regular skin patches of 144 × 144 pixels from regions of interest segmented using the Segment Anything Model, achieved a testing F1-score of 0.80. Beyond performance, this study addresses numerous shortcomings in the existing literature in this area relating to trust, replicability, and transparency. To this end, we employ fair performance metrics that are more robust to class imbalance, a transparent workflow, share source code, and use Gradient-weighted Class Activation Mapping to visualise and quantify the image regions that influence the classifier’s predictions in pursuit of epistemic justification.
1. Introduction
Neonatal jaundice is a common condition marked by the yellowing of a newborn’s skin and eyes that occurs in the initial days of life. It is caused by the accumulation of bilirubin, a yellow-green pigment produced by the breakdown of red blood cells []. Jaundice that appears within the first 24 h of life is usually pathological and may be indicative of underlying conditions such as blood group incompatibilities, infections, or liver disease []. Around six out of every ten babies and eight out of ten premature neonates develop some degree of jaundice [,]. Severe neonatal hyperbilirubinemia affects hundreds of thousands of newborns each year, with the highest burden in South Asia and sub-Saharan Africa. It was ranked as the seventh leading cause of neonatal mortality in the first six days of life according to the Global Burden of Disease Study []. Physiological jaundice usually resolves within 10–14 days; persistence beyond two weeks requires further investigation and treatment to minimise the risk of neurological damage. In 2010, an estimated 481,000 late-preterm and term newborns worldwide were affected by severe neonatal jaundice, resulting in approximately 114,000 deaths and 63,000 cases of long-term disability among survivors [,].
The gold standard for assessing neonatal jaundice is a blood test measuring Total Serum Bilirubin (TSB; []). Recent innovations, such as BiliDx and BiliCheck (Philips), provide relatively low-cost, portable, point-of-care devices that estimate TSB from just a few drops of blood. For example, BiliDx measures absorbance at three wavelengths and can deliver results within minutes without requiring complex equipment or specialised training []. Nevertheless, because these devices still depend on blood sampling and dedicated hardware, their adoption may be restricted in resource-limited settings such as small clinics or neonatal units in low- and middle-income countries.
Transcutaneous bilirubinometry (TcB) provides a non-invasive alternative for estimating bilirubin levels by analysing light reflected through an infant’s skin. It is fast and convenient but less accurate than TSB, particularly at higher bilirubin concentrations or in certain patient populations []. A Cochrane review of 23 studies including more than 5000 infants reported variable sensitivity (0.74–1.00) and specificity (0.18–0.89) compared with TSB []. These findings indicate that TcB is useful for initial screening but often requires confirmatory blood testing to ensure diagnostic accuracy. In addition, like blood-based methods, TcB devices require specialised equipment and expertise, presenting a barrier to use in low-resource settings.
Given that mortality and morbidity from neonatal jaundice remain high, a low-cost, widely accessible screening tool would be valuable. One possibility is to use skin images, e.g., ones captured with a smartphone, in the initial screening method, reducing reliance on TcB or TSB tests that may be unavailable in low- and middle-income countries or outside specialised neonatal facilities. In this study, we present a bespoke 2D Convolutional Neural Network (CNN) and examine the effect of different image pre-processing steps on classification performance for normal versus jaundiced neonatal skin images in a large dataset. Our pipeline incorporates segmentation of irregular regions of interest (ROIs) using the Segment Anything Model (SAM; []), contrast enhancement, image resizing, and patch extraction. The CNN is trained to distinguish normal from jaundiced neonates, and explainable AI (XAI), specifically Gradient-weighted Class Activation Mapping (Grad-CAM; []), is used to evaluate if model decisions align with clinically meaningful image features. This work directly addresses concerns around model reliability and trustworthiness in this sensitive area of medical practice.
2. Critical Review of Existing Work
Several methods have been proposed to detect neonatal jaundice from skin images, often validated against direct (TSB) or indirect (TcB) bilirubin measurements. While many studies report seemingly high classification performance, methodological limitations, including small or imbalanced datasets, lack of independent validation, and incomplete reporting, make it difficult to assess the generalisability and reproducibility of these approaches. This section critically reviews existing work, highlighting both contributions and limitations, providing context for the present study.
In [], Aune et al. used images captured from a smartphone camera with a colour calibration card to estimate bilirubin levels from 302 newborns, of whom 76 had severe jaundice (>250 µmol/L, determined through TSB). The use of a colour calibration card here and in subsequent studies has the advantage of enabling the system to adapt to diverse lighting conditions, which should in principle support more accurate classification. Large linear correlations with TcB (r = 0.81) and TSB (r = 0.84) were found. For a threshold of 250 µmol/L, a sensitivity of 1.0 and specificity of 0.69 are reported, with no significant difference between TSB and TcB measurements. Importantly, no difference in performance was found between data collection sites in which lighting was standardised or not, demonstrating that image-based analysis may be robust to different illumination conditions. However, methods described as physics-based estimation were not fully described, limiting reproducibility. It is unclear what specific image features contributed to the final detection process. Classification performance also appears to have been tested only on severe vs. other concentrations, limiting the degree to which we can evaluate its clinical usefulness.
In [], Munkholm et al. used 51 neonatal images of the skin region between the eyebrows and nose (glabella) captured using a smartphone connected to a dermatoscope, in some conditions with a yellow-green gelatine filter, also applying a small degree of pressure to the skin surface to remove interference from surface haemoglobin. RGB channels were correlated against TSB separately, giving r = 0.21 (red), r = 0.59 (green), and r = 0.46 (blue). For detecting TSB > 205 µmol/L, sensitivity and specificity were reported to be 0.90 and 0.60 for the blue channel, with 1.0 and 0.63 for green. Whilst highlighting the potentially greater diagnostic value of the green channel, 51 is a small number of images and the dataset is imbalanced, with only 11 of the 51 images having confirmed jaundice (defined as >205 µmol/L). A limit is identified that discriminates between normal and jaundice infants, but it is unclear if it generalises since no independent test set appears to have been used, raising the possibility of overfitting.
In [], Outlaw et al. used 37 jaundiced neonatal sclera images (white of the eye), again using a smartphone camera, with and without flash. Ambient light subtraction was used to compensate for ambient illumination. A large correlation between image-derived scleral bilirubin estimates and TSB is reported (r = 0.75). Using chromaticity features, they report a sensitivity of 1.0 and specificity up to 0.61 at TSB > 250 µmol/L, with AUCs of 0.85–0.86. However, despite using leave-one-out cross validation (LOOCV), the sample size was small and there was no control group (all neonates had been referred for TSB testing). Furthermore, classification is between severe and other bilirubin concentrations, which is the most readily detectable, and the use of the best-performing threshold (maximising AUC) does not guarantee generalisability.
In [], Hardalac et al. analysed 196 neonatal images featuring an 8-point colour calibration chart to estimate bilirubin levels, classifying jaundice cases into mild (<10 mg/dL, n = 95 images) and severe (≥10 mg/dL, n = 61 images). TSB was also measured for each neonate. A subset was also said to be reserved for testing (n = 40), although it is not entirely clear how these test cases are classified (normal, mild, or severe). Furthermore, in constructing a binary classifier, it is suggested that the first class includes TSB levels from 0 to 10 mg/dL, which appears to conflate “no jaundice” and “mild jaundice”, since >5 mg/dL and <10 mg/dL is typically considered “mild jaundice” []. The study may therefore lack normal (non-jaundiced) control images, or the ability to discriminate between normal and jaundice neonates. Details include that RGB values from 30 body points (five points each for face, arms, feet, etc.) were extracted and served as predictors, along with an additional 8 values from the colour calibration chart, and that multiple linear regression was applied to predict bilirubin levels, producing a reported classification accuracy of 0.92. Colour channel weights for different body points are also given in a regression equation. However, the unclear division of source images makes the results difficult to fully interpret.
De Greef et al. proposed a smartphone-based system to estimate TSB called Bilicam [] using skin images from 100 neonates (each with paired flash and no-flash images), again with colour calibration cards. Although the exact number of jaundiced cases was unspecified, classification can be inferred from TSB thresholds. The model used 21 features, including mean values from RGB, LAB, and YCbCr colourspaces (with/without flash) along with linear colour gradients derived from a Sobel edge detection filter []. However, multicollinearity among colourspace features may violate independence assumptions. While large correlations with TSB were reported (r = 0.85 for rank order, r = 0.84 for linear, MAE = 2.0 mg/dL), and despite the use of LOOCV, no independent test set appears to have been used, raising the possibility of overfitting. In [], Taylor et al. used machine learning techniques to further develop Bilicam in a study involving a good-sized cohort of 530 newborns, in which k-fold validation is used. Though a large correlation was reported between the estimated and measured TSB levels (r = 0.91), the report lacks details that would support replication.
In [], Aune reported the results of a Chinese-language study [] that evaluated a smartphone app called Biliscan (Shenzhen Beishen Healthcare Technology Co., Shenzhen, China), in which it was said to give a correlation of r = 0.79 with TSB. In a subsequent study [], again examining the validity of Biliscan-derived estimates of TSB, only moderate classification agreement and a lower correlation of r = 0.6 were found. In a more recent attempt to evaluate Biliscan in a clinical setting, further performance issues were found, in that agreement with real data was said to be mediocre and the correlation between image-derived bilirubin and that obtained from TSB was only r = 0.54 []. It was suggested that this discrepancy may be due to superior performance for skin tones more commonly found in Chinese populations.
Aydin et al. proposed a smartphone-based method for neonatal jaundice detection, also using a colour calibration card, reporting an accuracy of 0.85 on a small but balanced dataset (n = 80 images) []. Images were segmented and white-balanced and then features were extracted and compared to the card. Bilirubin was estimated using k-NN and SVR (Support Vector Regression). However, the study appears not to include an independent test set, raising concerns of overfitting, uses a relatively small sample size, and does not provide sufficient methodological detail for replication. For instance, feature extraction and skin segmentation steps are not described in detail, and some results also appear to lack consistency. The approach also closely parallels [].
Juliastuti et al. developed a model to estimate newborn jaundice using 120 skin images collected from 40 neonates []. They applied image filtering, colour correction, and k-means-based skin segmentation, processing images in RGB, HSV, and YCbCr colourspaces. From 9 intensity histograms, 36 statistical features were extracted and used in multivariate linear regression model to most closely estimate measured bilirubin levels. An overall multiple-R of 0.71 is reported for the model, and testing on a small set of 18 additional images yielded a multiple-R of 0.95. However, the use of three images per infant may violate the assumption of independence and may have led to inflated performance metrics. The 36 features (the majority of which are not disclosed, preventing replication) are also likely to have varying degrees of multicollinearity.
In [], Hakimi et al. proposed a method for estimating bilirubin levels using a colour card and silicon photodiode sensor to simulate neonatal skin tones. A linear regression model achieved an R2 = 0.98 across 42 simulated samples. However, the study’s reliance on simulated data and the absence of real infant skin images limits the generalisability of the findings to clinical settings. Additionally, the use of the Fitzpatrick scale [] has been criticised for its limited representation of diverse skin tones, particularly those of individuals with darker skin. Therefore, while the model demonstrates high accuracy in a controlled environment, its applicability to real-world clinical practice remains uncertain.
Hashim et al. proposed a computer vision system for neonatal jaundice detection using the B and Cb colour channels extracted from the RGB and YCbCr colourspaces []. The study used a combination of heterogeneous data sources, including unverified internet images and mannequin photos, alongside a very limited clinical sample of 2 infants with multiple exposures. Methodological choices, such as the application of Otsu’s thresholding and interpretations of colourspace relevance, were employed but not fully justified. The absence of standard evaluation metrics limits the interpretability and comparability of the reported results. In a related study [], an Arduino-based system for jaundice detection is proposed. However, this study also had a very small sample size (n = 2 infants) and included unverified internet images. The focus on the blue channel in jaundice detection is unconventional, as jaundice is typically associated with increased yellowing, which would be more visible in the red and green channels. The reported 100% classification accuracy is not supported by sufficient evidence, and methodological details required to support replication are not provided.
In [], Dissaneevate et al. propose a mobile diagnostic system for neonatal hyperbilirubinemia (mCADx) using image processing and machine learning, based on data from 178 Thai newborns. However, some methodological issues exist. The reported TcB stratifications are said to be severe (n = 57) with TcB ≤ 10, medium (n = 78) with 15 ≤ TcB < 10, and low (n = 43) with 20 ≤ TcB < 15). In addition to using invalid interval notation, these also appear to be factually incorrect since lower TcB readings are normal not indicative of increasingly severe jaundice. TcB is also incorrectly referred to as a blood-based gold standard (it is in fact an indirect measure). Reported performance metrics, such as F1-scores, are mathematically inconsistent with precision and recall values provided, raising concerns about the reliability of the reported results. Furthermore, the lack of variability measures in k-fold validation limits the degree to which model stability/overfitting can be evaluated.
Similarly, Mansor et al. present a PCA-based feature extraction approach combined with a k-NN classifier for early jaundice detection []. While the study reports a detection accuracy of 0.90 across 120 multi-ethnic subjects, key methodological details are absent. The dataset is no longer available, and the number of images, or how labels were obtained, is not reported. The use of 10 images per subject may violate the assumption of independence, and the role of PCA is not fully explained. Furthermore, the structure of the reported results is unclear, lacking a full explanation of what the table rows represent or how metrics were averaged. These omissions limit the study’s reproducibility and undermines confidence in its findings.
In [], Nihila et al. developed a neonatal jaundice detection model using Support Vector Machines (SVM), tested on 37 neonatal skin images (22 jaundice, 15 normal). Their approach involved face and skin detection, colour transformation and white balancing to isolate the ROI. Eight statistical features were extracted, and PCA identified skewness, entropy, standard deviation, and mean as the most informative. These features were used with SVM and ensemble regression models, achieving an accuracy of 0.81. However, the image sample was very small and imbalanced, which may have biased the detection accuracy.
In a subsequent study, Mansor et al. present an image-based method for neonatal jaundice detection, combining pre-processing, colour analysis techniques followed by k-NN classification []. The dataset is relatively small (n = 120 images) and imbalanced (normal = 40, jaundiced = 80), with only accuracy reported, a metric that can be misleading in such contexts. Key methodological details, such as how images were labelled, how facial regions were identified, and how features were extracted, are not fully described, limiting reproducibility. Some reported results appear to lack consistency, and the absence of a full validation strategy raises concerns about overfitting. While the paper highlights the potential of image-based approaches, particularly for darker skin tones, the references cited do not strongly support this point.
Several studies have proposed neonatal jaundice detection schemes using CNN models. In [], Nayagi and Angel proposed a method that integrates feature fusion, a colour calibration card and a CNN-based model, reporting an accuracy of 0.98 for both normal and jaundiced image classes. While the image segmentation process effectively removes the background, the complexity of this procedure raises concerns about the potential loss of critical information and contributes to increased computational overhead, which may limit the method’s practicality in real-world settings. Moreover, aside from reporting the mean and standard deviation of RGB values, the study does not clearly specify which skin features were ultimately used in the CNN pipeline, leaving the model’s decision-making criteria unclear and limiting reproducibility.
In [], Kalbande et al. proposed a deep learning-based approach for early jaundice diagnosis using scleral images, evaluating ResNet-50 [] and Mask R-CNN [] models. The dataset comprised 148 eye images (98 jaundiced, 50 normal), with testing conducted on 42 images. Mask R-CNN outperformed ResNet-50 in segmentation and classification tasks. However, the dataset consisted of adult eye images, not neonatal sclerae, and the small sample size and balance may limit the generalisability of the findings. In [], Althnian et al. also use skin and eye images captured with a smartphone, along with CNN transfer learning. The study reports an initial dataset of 100 images, later reduced to only 68 images after excluding 32, with a class imbalance of 65% healthy and 35% jaundiced cases, giving an imbalance ratio (IR) of 1.83 []. Inconsistencies arise in data reporting, as eye images are analysed without clarifying their source. The use of data augmentation is mentioned, but the number of augmented samples and final class balance are not provided, limiting reproducibility. Reported accuracies include 0.87 for skin, 0.79 for eyes, and 0.80 for the fused model, with additional metrics like F1-score given. However, the facial region was extracted using a complex landmark-based method that excluded the forehead, one of the most diagnostically relevant areas, raising concerns about the appropriateness of feature selection.
Chowdhary et al. proposed a colour detection method for neonatal jaundice assessment []; however, the study has limitations that may restrict its clinical validity. Firstly, the justification for using blue light as a diagnostic aid appears to stem from a single image sample, lacking clear scientific and clinical rationale. Despite this, their methodology has been cited by subsequent studies, such as [], potentially propagating some unreliable assumptions. Additionally, the dataset used comprised images sourced from Google Images, which not only raises concerns about the absence of TSB and/or clinical label data but also eliminates any possibility of clinical verification or patient-level ground truth. These factors collectively cast doubt on the reliability and generalisability of the study’s conclusions, particularly for medical decision-making. Similarly, Chakraborty et al. claim high accuracy (0.93) in neonatal jaundice detection using CNN and SVM models []. However, the study fails to disclose any information about the dataset used, making it impossible to validate or reproduce the results. Without data transparency or clinical ground truth (e.g., TSB levels), the reported outcomes lack meaningful context and raise concerns about the model’s reliability and applicability. In [], Singla and Singh proposed a framework for detecting jaundice in newborns using homomorphic filtering and image processing. However, the approach is based on paper strips with varying shades of yellow rather than actual clinical images of infants. This limits the clinical relevance and real-world applicability of the method, as it lacks validation against physiological data or real patient images.
In [], ALdabbagh and Aziz developed two transfer learning models, using VGG16 [] and ResNet-50 [], and evaluated them using a newly curated neonatal skin dataset designed specifically for neonatal jaundice classification. Classification accuracies of 0.92–0.96 are reported, with higher performance noted with ResNet-50. However, to inflate the dataset of 386 jaundice and normal images (or which 344 were used) to 2563 images, the authors augmented the dataset, including by cropping multiple skin samples from each image. While this technique increased the overall volume of data by seven times, it potentially introduced redundancy and an overrepresentation of particular features, thereby risking the generation of biased model decisions that will not generalise to new data. It also appears to be subject to data leakage, having been performed before rather than after the division of the dataset to training and testing sets (i.e., test metrics may have been artificially inflated through the use of test images that are slightly modified versions of those used during training), undermining the reported findings.
A recent study investigated the application of four machine learning algorithms SVM, k-NN, Random Forest, and Extreme Gradient Boosting (XGBoost) [] using a dataset consisting of 767 infant images []. The study reported a remarkably high classification accuracy of >0.99. However, the dataset contained duplicate images from the same infants (100 normal and 30 jaundiced cases), as well as images featuring multiple infants, potentially undermining data independence. Although images with poor visibility (n = 58) and blurriness (n = 45) were excluded, the methods used to address these inconsistencies were not clearly described, raising concerns about the robustness and generalisability of the findings. Images are grouped into normal and jaundiced, but TSB or other diagnostic information is not provided. The dataset is also imbalanced, making the reporting of accuracy misleading. The study also lacks sufficient detail for meaningful replication. A final point, but an important one, is that it appears that raw images were fed to the model, enabling the exploitation of incidental image features, such as medical apparatus, nappies and wristbands, that our analysis (see Section 4.2) shows are exploitable.
Gupta et al. used the NJN dataset to propose a neonatal jaundice detection method using a custom-designed CNN, achieving an accuracy of 0.93 []. While background elimination was used as a preprocessing step, the study did not provide details on comprehensive data cleaning, ROI selection, or preprocessing techniques, which limits reproducibility and undermines the reliability of the reported results. Like [], it also appears that incidental features were exploited, with the segmentation step clearly showing images that retain nappies, wristbands and other features that our later analysis shows have predictive power, despite being epistemically unjustified to use in such as a model. Additionally, the use of additional test images collected from online platforms without documented consultation with clinical experts, raises questions as to the methodological validity of the findings.
Another recent study used calibration cards with a window to isolate skin, eliminating the risk that non-diagnostic features from neonatal photographs might be exploited in classification []. Using a 1D CNN, jaundice was classified into three groups with an accuracy of 0.97 and included the division of images into non-overlapping training, validation and testing sets (70:10:20), along with k-fold validation. A total of 2235 images were used. However, these were not independent, with three images per infant, captured from different locations (head, face and chest). It is unclear from the report whether the three images may have been allocated to different groups (training, validation, testing), raising the possibility that data leakage was responsible for the high reported performance. The use of calibration cards is also a barrier to adoption, especially if empirical results can show that this aspect of the procedure is unnecessary.
Despite the high accuracy metrics, often exceeding 0.90, reported by some AI-driven approaches for image-based neonatal jaundice detection (for a recent review see []), critical aspects of existing studies, such as scientific rigour, method reproducibility, trustworthiness, performance metric informativeness, and data fairness are oftentimes not quite as one might hope. Coupled with the lack of available datasets and absence of code sharing, this leads to quite an unsatisfactory position for evaluating the true potential efficacy of neonatal jaundice classification from photographic images.
3. Materials and Methods
3.1. Dataset
The Normal and Jaundiced Neonatal dataset (NJN; []) contains 760 full-colour JPEG images of 600 neonates aged 2–8 days, divided into two classes: “normal” (560 images) and “jaundiced” (200 images). All images are 1000 × 1000 pixels in resolution and were captured using a 12 MP Apple iPhone 11 Pro Max under diverse lighting conditions and from various angles and distances.
Data collection took place at the Neonatal Intensive Care Unit (NICU) of Al-Elwiya Maternity Teaching Hospital in Al Rusafa, Baghdad, Iraq. Although skin tones common to that region may be more prevalent, it is stated that the dataset contains images of babies with a range of skin tones. No camera calibration was performed, and no colour calibration cards were included, presenting a realistic but challenging dataset. Many images include clothing, bedding, cannulas, umbilical clips, and other clinical equipment, reflecting typical bedside conditions and image capture that is not unduly burdensome.
The dataset includes multiple images of the same infant in some cases: 100 of the “normal” and 30 of the “jaundiced” images appear to be duplicates of the same subject. To avoid violating the assumption of independence and potential data leakage, these were removed. A further 10 images were removed that contained more than one infant. Most images prominently feature visible skin regions, particularly the abdomen, though some depict the face only. A total of 58 images lacking a clear visible skin region and 45 very blurry images were excluded. This left 517 images for model development (365 normal, 152 jaundiced), resulting in an IR of 2.40 []. This necessitates caution in interpreting accuracy and greater emphasis on more imbalance-robust metrics such as F1-score (see Performance Metrics, Section 3.7).
As the dataset is distributed in a lossy JPEG format, compression artefacts, such as 8 × 8 blocking, ringing, blurring, mosquito noise, and colour degradation, are expected. These artefacts were not corrected for in this study. Sample images are shown in Figure 1. Figure 1A displays “normal” neonates (with no apparent yellowing of skin or eyes), while Figure 1B shows “jaundiced” neonates, identified by hospital staff based on visual yellowing. Although the dataset and associated publications do not specify whether diagnoses were confirmed using TSB, TcB, or other clinical measures, given that the data were collected in a NICU by medical personnel, we assume the labels are clinically valid.
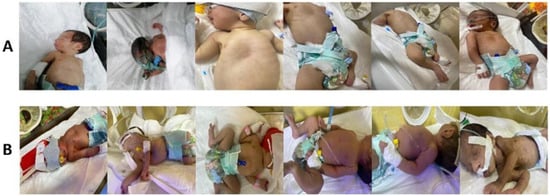
Figure 1.
Example images from NJN dataset: (A) normal; (B) jaundiced.
3.2. Segmentation of Irregular Region of Interest
The Segment Anything Model (SAM; []) was used to isolate irregular ROIs containing large, contiguous areas of skin. This process involved the manual placement of positive (foreground) points on substantial skin regions (typically the abdomen), and negative (background) points on adjacent areas to be excluded from the ROI. An example of this segmentation is shown in Figure 2.
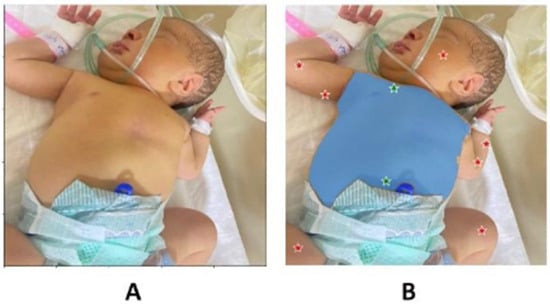
Figure 2.
(A) Example image undergoing SAM segmentation; (B) image with positive points (green) and negative points (red), with the identified region of interest (blue area).
3.3. Contrast Enhancement
Contrast Limited Adaptive Histogram Equalisation (CLAHE; []) was applied to images after SAM segmentation to compensate for inconsistent lighting and, in some cases, poor initial contrast. CLAHE was applied independently to each colour channel using a clip limit of 2.0, which provided moderate contrast enhancement while suppressing the excessive amplification of noise. A tile size of 8 × 8 pixels was used. An example ROI, before and after CLAHE enhancement, is shown in Figure 3A,B. Model configurations both with and without CLAHE were tested to evaluate the efficacy of this process.
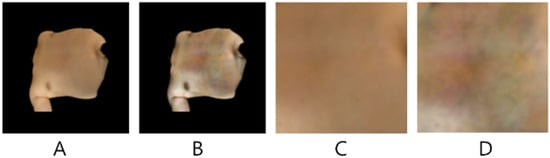
Figure 3.
Example SAM segmented ROI (A) without CLAHE; (B) with CLAHE; (C) extracted 144 × 144 patch without CLAHE; (D) extracted 144 × 144 patch with CLAHE.
3.4. Image Resizing and Patch Extraction
In addition to using irregular patches of 512 × 512 pixels and the original 512 × 512 unprocessed images as inputs to the model, contiguous square patches of 144 × 144 pixels were also extracted following segmentation of the ROI using SAM (shown in Figure 3C,D, corresponding to before and after CLAHE). The optimal positioning for these skin patches was determined as follows: for each segmented (irregular) image, connected component labelling was used to identify distinct segmented regions. The largest detected skin region was selected, and its centroid computed. If the centroid did not fall on a skin pixel, a search was performed to locate the nearest valid skin pixel. Once a valid centroid was established, a skin patch was extracted by expanding a square region around it until it reached a non-skin pixel boundary.
3.5. Binary Classifier 2D CNN Model
A novel 2D CNN architecture was designed to classify neonatal jaundice images into two categories: normal and jaundiced. The proposed model is a custom binary classification 2D CNN, optimised for effective feature extraction and robust generalisation. It processes variable-sized image inputs (see above) through a sequence of three convolutional layers with 16, 32, and 64 filters, respectively. Each convolution uses a 3 × 3 kernel and ReLU [] activation to capture increasingly complex visual features. Following each convolution, a 2 × 2 max-pooling layer reduces spatial dimensions and emphasises key features, while Dropout (rate = 0.1) is applied to mitigate overfitting. The resulting feature maps are flattened and passed through two fully connected (dense) layers with 128 and 64 neurons, both activated using ReLU. The final output layer consists of a single neuron with sigmoid activation, providing a probability score for binary classification. The model is compiled using the binary cross-entropy loss function and optimised with the Adam optimiser (learning rate = 0.00001), enabling gradual and stable convergence. The CNN architecture and input pre-processing pathways are illustrated in Figure 4.
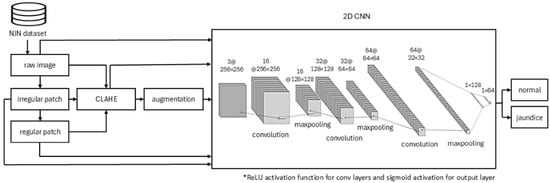
Figure 4.
Bespoke 2D CNN architecture and pre-processing pathways.
Prior to training, the dataset underwent standard pre-processing. It was partitioned using the train_test_split function from the Python scikit-learn library v1.7, with 80% allocated to training and 20% to testing. From the test subset, 10% of images were further set aside for validation, yielding 414 training images, 92 test images, and 11 validation images from a total of 517 (after exclusions). A fixed random seed (random_state = 42) was used to ensure reproducibility.
All model parameters and hyperparameters were selected based on systematic experimentation, including variations in: the number of convolutional and pooling layers; presence and rate of dropout; number and size of filters; activation functions; batch sizes; learning rates; and the strength of L2 regularisation.
3.6. Data Augmentation
Data augmentation was applied to increase the number of examples in the training set only, thereby avoiding data leakage. Augmentation was not class-aware; that is, it did not compensate for class imbalance by preferentially augmenting the underrepresented class. However, performance metrics relatively robust to imbalance were used (see Section 3.7, Performance Metrics). Augmentation was implemented using the Python 3 ImageDataGenerator function from the Keras library (v3). For normal images, we applied a rotation range of ±20 degrees, width and height shifts of up to 10%, and horizontal flipping. An augmentation factor of 2 was used, generating two additional samples per original image. For jaundiced images, we applied a rotation range of ±40 degrees, width and height shifts of up to 20%, horizontal flipping, and an augmentation factor of 5.
3.7. Performance Metrics
Test results were allocated to the cells of a confusion matrix, yielding TP (True Positive; wherein a Jaundice image was correctly identified), TN (True Negative; where a Normal image was correctly identified), FP (False Positive; where a Normal image was incorrectly identified as Jaundice) and FN (False Negative; where an Jaundice image was incorrectly identified as Normal). Using the counts recorded in the confusion matrix cells, performance was evaluated using accuracy (Equation (1)), recall (Equation (2)), specificity (Equation (3)), precision (Equation (4)), and F1-score (Equation (5)). Accuracy is the ratio of correctly predicted instances (both positive and negative) to the total number of instances. It measures how often the model makes any correct prediction, regardless of class. Recall (also known as sensitivity or true positive rate) is the ratio of correctly predicted positive instances to the total number of actual positive instances. Specificity (also known as true negative rate) is the ratio of correctly predicted negative instances to the total number of negative instances. Precision is the ratio of correctly predicted positive instances to the total number of instances predicted as positive. It tells us, out of all the positive predictions made by the model, how many were actually correct, i.e., high precision indicates a low false positive rate. It tells us, out of all the actual positives, how many were correctly identified, i.e., high recall indicates a low false negative rate. F1-score is the harmonic mean of precision and recall. It provides a single score that balances both, especially useful when classes are imbalanced, i.e., a high F1-score suggests the model performs well in terms of both low false positives and low false negatives.
Given the epistemological limitations of the confusion matrix, and metrics derived from it [], we also interrogate the model using explainable AI via the Grad-CAM method [].
3.8. Code Availability
The code for training, validating and testing all models is shared through the Open Science Framework (see Supplementary Materials).
4. Results
4.1. Classification Performance
The results for the test (held out) set for the binary classifier developed to discriminate between Normal and Jaundice classes are shown in Table 1. In all but one case, CLAHE improved classification accuracy and other metrics, showing that this contrast enhancement method was advantageous in this case. Data augmentation was found not to improve model performance in many cases. The best performing configuration overall, despite the smaller input image size, was found to be SAM patches of size 144 × 144 pixels, with CLAHE, and without data augmentation, yielding accuracy of 0.78, recall 0.75, precision 0.85 and F1-score 0.80. Without augmentation, the same CLAHE and patch type yielded the highest performance, which was only lower in accuracy and F1-score, relative to the without augmentation configuration, by 0.01.

Table 1.
Binary classification confusion matrix cells and performance metrics for test set. (A). Without augmentation, (B). With Augmentation. Row with best performing configuration shown in bold.
4.2. Grad-CAM Analysis
Grad-CAM (Gradient-weighted Class Activation Mapping) is a technique for visualising and interpreting decisions made by CNNs. It works by using the gradients of a target class flowing into the final convolutional layer to weight the importance of the feature maps at that layer. These weighted maps are then combined to produce a heatmap that highlights the regions of the input image most relevant to the model’s prediction, allowing us to see which parts of the image the network focused on when making a decision. Grad-CAM activation maps were calculated for all input image types (raw image, irregular ROI from SAM segmentation, and regular SAM patches). Despite observing, in some cases, similar performance between irregular ROI images and regular patches (Table 1), the Grad-CAM activation maps have a story to tell, as do the Grad-CAM maps calculated on raw input images. Additional Grad-CAM map examples are provided in the shared source code/data download, along with code for their production, but representative examples for each input image type are shown in Figure 5.
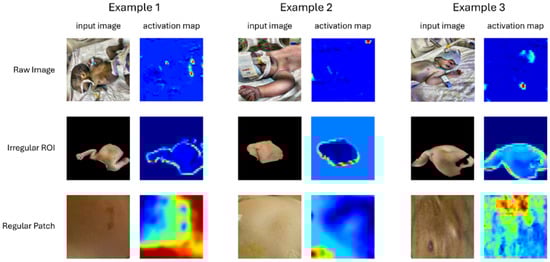
Figure 5.
Example Input Images and Corresponding Grad-CAM Activation Maps for each Input Type. The colour temperature scale indicates relative importance, with warmer colours (red/yellow) representing greater relevance and cooler colours (green/blue) indicating lower relevance.
Our interpretations are the same irrespective of the use of CLAHE, so we focus on the three input image types only. For raw images, we see quite unsatisfactory image features contributing to the classifier decision, such as umbilical clips, nappies, and wrist identification tags. These clearly violate the expectation that skin should be the primary determinant of the classification outcome and suggest that these other image cues may have incidental explanatory power that nonetheless give rise to misleading true positive and true negative classification outcomes []. Specifically, name tags or nappies may differ in some systematic way between classes, perhaps due to having been added after initial clinical assessment.
Irregular patches produce similarly unsatisfactory activation maps, suggesting that the boundary between the identified irregular skin ROI and background has undue diagnostic power, due perhaps to jaundiced babies having skin areas of different size or shape exposed, on average, again indicative of the exploitation of potentially coincidental information that will impair model performance if deployed in even a slightly different physical environment.
Regular image patches did produce more meaningful activation maps, including showing reduced weightings for regions that one might reasonably propose to be less diagnostically valuable (blemishes, areola, etc.). It was these regular patches that elicited the highest performance (Table 1).
5. Discussion
The highest-performing configuration used CLAHE, small patches of extracted skin, and no data augmentation, yielding an accuracy of 0.78 and an F1-score of 0.80. In practical terms, approximately four out of five test images were correctly classified. The lack of improvement from data augmentation may reflect the limited flexibility of the ImageDataGenerator function, which could have introduced noise rather than useful variability, or it may indicate that performance had reached an asymptote. These results must also be interpreted in the context of the dataset limitations discussed earlier.
Lower performance compared to approaches using colour calibration cards is inevitable; however, the use of images without these features makes any application built upon it more accessible. When compared with published work using the same dataset (NJN), our results appear lower, with accuracy 0.78 compared with reported values of 0.99 [] and 0.93 []. However, accuracy alone is a misleading metric in the presence of class imbalance. In addition, these studies provide insufficient methodological detail for replication, and the dataset itself contains structural issues such as duplicate images from the same infant. Our Grad-CAM analysis also suggests that incidental features may have been exploited, raising further questions about the validity of reported performance. By contrast, we share our model and, with the dataset publicly available, enable third-party scrutiny, replication, and improvement.
Our Grad-CAM activation maps highlight the epistemic fragility of models trained on raw or irregularly segmented images. High apparent performance can result from epistemic luck; that is, models basing classification decisions on coincidental rather than diagnostically meaningful features. For irregular SAM ROIs, activation maps often emphasised region boundaries rather than skin texture. This may reflect incidental differences, such as the size or shape of exposed skin, which happen to correlate with jaundice status. Encouragingly, our best-performing model used square patches extracted from irregular SAM-segmented regions, which constrained the model to focus on the medically relevant feature: the skin itself. This finding underscores the importance of careful pre-processing to reduce the influence of artefactual cues.
Numerous prior studies have investigated image-based detection of neonatal jaundice using smartphone or digital camera images of skin or sclera [,,,,], typically reporting moderate to high correlations with reference bilirubin levels. However, most are limited by small or imbalanced samples, repeated use of the same source images, lack of independent validation, lack of shared data, and insufficient methodological detail for replication. Related work using scleral imaging and deep learning [,,] and machine learning approaches [,,,,,] shows promise but faces similar challenges. Additional studies using simulated or non-clinical images [,,,,,] contribute technically but have limited clinical relevance. Overall, while prior research demonstrates potential, most studies are constrained by methodological shortcomings and highlight the need for larger, well-validated clinical datasets.
One important point is that several existing studies have concentrated on correlating the RGB values of skin pixels with measured TSB, e.g., [,]. Whilst some good correlations have been reported, indicating that skin pixel colour alone might directly serve as a proxy for TSB, our pilot work with SVMs and Random Forest approaches did not find good classification performance between groups (normal and jaundiced) either in RGB or YCbCr space. These results are provided in Appendix A. These pilot models were found to perform significantly less well than the current CNN, which suggests that other information in addition to the average skin patch colour is being exploited. Since we used isolated skin patches for this pilot work, this suggests that epistemically unjustified features were not responsible for this different, but texture may have been. For instance, examining the patches in Figure 3C,D show considerable variability (texture/blotchiness) which may contribute to the decision of the CNN.
6. Conclusions
This study presents a robust and transparent approach to neonatal jaundice detection using a custom-designed lightweight CNN, advanced image segmentation via the Segment Anything Model (SAM), and a carefully validated preprocessing pipeline that examined the impact of Contrast Limited Adaptive Histogram Equalisation (CLAHE). Our workflow achieved good classification performance (accuracy 0.78, F1-score 0.80) and, importantly, prioritised model transparency and reproducibility, addressing key limitations observed in previous studies. Unlike much of the prior literature, which is often hampered by small, imbalanced datasets and a lack of methodological clarity, our approach incorporates fair metrics resilient to imbalance and openly shared code, enabling others to replicate and build upon our results. In particular, we report F1-score, which unlike accuracy (the most commonly reported metric) is not artificially inflated in the presence of class imbalance, and report metrics indicating both good sensitivity (true positive rate) and specificity (true negative rate).
Seeking and reporting inflated accuracy metrics may suppress research in this important area and should be tempered with epistemic justification. The integration of Grad-CAM for model interpretability allowed us to visualise and verify which image regions influenced the classifier’s decisions, supporting clinical trust in the model’s predictions. By systematically evaluating different segmentation and preprocessing strategies, our work also establishes a foundation for optimising image-based screening workflows in resource-limited settings.
The novelty of this work lies in the use of SAM for segmentation, the systematic comparison of image types (raw, irregular, and full images, with and without contrast enhancement), the construction of a bespoke CNN tailored to the problem rather than reliance on transfer learning, the use of fairer metrics such as the F1-score under class imbalance, and the integration of XAI. It is also important to note that smartphone camera characteristics and illumination can significantly affect image properties in neonatal jaundice classification. Future work should therefore draw on datasets collected from a wider range of devices and lighting conditions to confirm robustness [] and to rule out potential confounds, such as differences in ward lighting between normal and jaundiced infants.
While our results are promising, further research with larger and more diverse datasets is essential to validate the model’s generalisability and clinical readiness. Overall, this study represents a significant step toward reliable, non-invasive AI tools for neonatal jaundice screening, with a focus on trustworthiness, explainability, and accessibility. Future work will involve evaluating the model on a new, clinically sourced dataset to further enhance confidence in its practical potential.
Supplementary Materials
The dataset and source code supporting the conclusions of this study are openly available in the Open Science Framework (OSF) at https://doi.org/10.17605/OSF.IO/6R4EG (accessed on 17 September 2025).
Author Contributions
A.C.: Supervision, Conceptualisation, Project Administration, Methodology, Formal analysis, Writing—original draft, Writing—review and editing, Funding acquisition. Y.T.: Methodology, Software, Formal analysis, Validation, Writing—original draft. C.L.: Supervision, Methodology, Writing—original draft, Writing—review and editing, Funding acquisition. I.v.d.L.: Supervision, Conceptualisation, Project Administration, Methodology, Formal analysis, Writing—original draft, Writing—review and editing, Funding acquisition. All authors have read and agreed to the published version of the manuscript.
Funding
This project was supported by the Health and Performance Wellbeing Fund and the QR Pump Priming Fund at Anglia Ruskin University.
Data Availability Statement
The NJN dataset is currently available here: https://zenodo.org/records/7825810#.ZDgONrpBy3A (accessed on 29 October 2025) and is also provided (unaltered) with our source code (see Supplementary Materials).
Acknowledgments
We extend our gratitude to resPNse Medical Limited and Arunava Dhar FRCPCH, consultant paediatrician and neonatologist.
Conflicts of Interest
The authors declare no conflicts of interest. The funding sponsors had no role in the design of the study; in the collection, analyses, or interpretation of data; in the writing of the manuscript, and in the decision to publish the results.
Abbreviations
The following abbreviations are used in this manuscript:
| AUC | Area Under Curve |
| CLAHE | Contrast Limited Adaptive Histogram Equalization |
| CNN | Convolutional Neural Network |
| FN | False Negative |
| FP | False Positive |
| Grad-CAM | Gradient-weighted Class Activation Mapping |
| IR | Imbalance Ratio |
| k-NN | K Nearest Neighbours |
| LOOCV | Leave One Out Cross Validation |
| MAE | Mean Absolute Error |
| NJN | Normal and Jaundice Newborn (Dataset) |
| NICU | Neonatal Intensive Care Unit |
| PCA | Principal Components Analysis |
| ReLU | Rectified Linear Unit |
| ROI | Region of Interest |
| SAM | Segment Anything Model |
| SVM | Support Vector Machine |
| SVR | Support Vector Regression |
| TcB | Transcutaneous Bilirubin |
| TN | True Negative |
| TP | True Positive |
| TSB | Total Serum Bilirubin |
| XAI | Explainable AI |
Appendix A
In preliminary work, Support Vector Machines (SVM) were constructed that used raw patch colour (using the same SAM 144 × 144 patches used in the CNN, above) rather than using the more complex CNN approach. The results of these classifiers, following 5-fold cross validation, are shown in Table A1. The four rows reflect variants in which mean vs. median and RGB vs. YCbCr colourspace were used.
Table A1.
Classification results using Support Vector Machine approach.
Table A1.
Classification results using Support Vector Machine approach.
| SVM Models | #Vectors | TP | TN | FP | FN | Accuracy | Recall | Specificity | Precision | F1 Score |
|---|---|---|---|---|---|---|---|---|---|---|
| Mean RGB | 294 | 49 | 329 | 36 | 103 | 0.73 | 0.32 | 0.90 | 0.58 | 0.41 |
| Median RGB | 292 | 50 | 329 | 36 | 102 | 0.73 | 0.33 | 0.90 | 0.58 | 0.42 |
| Mean YCbCr | 292 | 54 | 329 | 36 | 98 | 0.74 | 0.36 | 0.90 | 0.60 | 0.45 |
| Median YCbCr | 292 | 46 | 331 | 34 | 106 | 0.73 | 0.30 | 0.91 | 0.57 | 0.40 |
In the SVM approach, recall was 0.3–0.36, with specificity 0.9–0.91, indicating heavy bias towards the negative class. Conversely, with the best proposed CNN, recall was 0.85, with specificity 0.83 indicating good balance, and that it was no longer over-fitting the majority class. The SVM models had moderate precision 0.57–0.60, indicating a non-negligible number of FPs. The best performing CNN with SAM Patches had precision 0.75, indicating far fewer FPs for each TP
Similar preliminary work was carried out using random forest (RF) approach. A RF classifier was trained on the same features as the SVM models above (viz., mean and median in RGB and YCbCr colourspaces) using the MATLAB (The Mathworks, Inc., Natick, MA, USA) 2025b TreeBagger function from the Statistics and Machine Learning Toolbox with 100 trees. Out-of-bag (OOB) predictions were used to estimate generalisation performance, providing an unbiased assessment without requiring a separate test set. Using OOB predictions, the classifier produced the results shown in Table A2 which, like the SVM results, were inferior to those obtained by the CNN models.
Table A2.
Classification results using random forest approach.
Table A2.
Classification results using random forest approach.
| RF Models | #Trees | TP | TN | FP | FN | Accuracy | Recall | Specificity | Precision | F1 Score |
|---|---|---|---|---|---|---|---|---|---|---|
| Mean RGB | 100 | 69 | 317 | 48 | 83 | 0.75 | 0.45 | 0.87 | 0.59 | 0.51 |
| Median RGB | 100 | 73 | 307 | 58 | 79 | 0.74 | 0.48 | 0.84 | 0.56 | 0.52 |
| Mean YCbCr | 100 | 77 | 306 | 59 | 75 | 0.74 | 0.51 | 0.84 | 0.57 | 0.53 |
| Median YCbCr | 100 | 75 | 310 | 55 | 77 | 0.74 | 0.49 | 0.85 | 0.58 | 0.53 |
The Random Forest models show moderate overall accuracy (0.74–0.75), good specificity (0.84–0.87), but relatively low recall (0.45–0.51), indicating that while the models effectively classify the negative class, they miss a substantial proportion of positive samples. F1 scores were 0.51–0.53, reflecting poor balance between recall and precision compared to the best performing CNN with F1 score 0.8. These results, derived from OOB predictions (which are analogous to internal cross-validation), provide a reliable estimate of model generalisation and allow direct comparison with the SVM models evaluated via 5-fold cross-validation, and the (superior) CNN model presented in this article. The application of CLAHE to the image patches did not improve performance for either SVM or RF models. All SVM models collapsed into predicting the negative class only, and the RF models produced accuracies from 0.71 to 0.75 (with F1 scores from 0.46 to 0.56).
The apparently poorer exploitability of single aggregate colour values derived from each image in both SVM and RF models may derive from their considerable overlap (see Figure A1 for a plot in Cartesian RGB and YCbCr colourspaces). The CNN model using SAM Patches was found to be both more accurate and offer better balanced compared to the SVM and RF approaches, likely because it exploits textural information in skin patches, rather than relying solely on colour. An F1 of 0.8 for the best performing CNN model using SAM patches indicates strong precision and recall simultaneously. This may inform future approaches, since it implies that devices sampling skin colour may produce higher classification performance if a area of skin is analysed, rather than an aggregate colour statistic calculated over the sampled area of skin.

Figure A1.
Three-dimensional plot of SAM Patches (A) RGB mean, (B) RGB median, (C) YCbCr mean, (D) YCbCr median. Red points are derived from images in the normal class and green points from images in the normal class.
References
- Hazarika, C.J.; Borah, A.; Gogoi, P.; Ramchiary, S.S.; Daurai, B.; Gogoi, M.; Saikia, M.J. Development of non-invasive biosensors for neonatal jaundice detection: A review. Biosensors 2024, 14, 254. [Google Scholar] [CrossRef]
- Ansong-Assoku, B.; Shah, S.; Adnan, M.; Ankola, P. Neonatal jaundice. In StatPearls; StatPearls Publishing: Treasure Island, FL, USA, 2024. [Google Scholar]
- NHS Jaundice in Newborns, NHS, 2023. Available online: https://www.nhs.uk/conditions/jaundice-newborn/ (accessed on 2 July 2025).
- Mitra, S.; Rennie, J. Neonatal jaundice: Aetiology, diagnosis and treatment. Br. J. Hosp. Med. 2017, 78, 699–704. [Google Scholar] [CrossRef]
- Naghavi, M.; Abajobir, A.A.; Abbafati, C.; Abbas, K.M.; Abd-Allah, F.; Abera, S.F.; Aboyans, V.; Adetokunboh, O.; Afshin, A.; Agrawal, A.; et al. Global, regional, and national age-sex specific mortality for 264 causes of death, 1980–2016: A systematic analysis for the Global Burden of Disease Study 2016. Lancet 2017, 390, 1151–1210. [Google Scholar] [CrossRef]
- Olusanya, B.O.; Kaplan, M.; Hansen, T.W. Neonatal hyperbilirubinaemia: A global perspective. Lancet Child Adolesc. Health 2018, 2, 610–620. [Google Scholar] [CrossRef]
- Olusanya, B.O.; Teeple, S.; Kassebaum, N.J. The contribution of neonatal jaundice to global child mortality: Findings from the GBD 2016 Study. Pediatrics 2018, 141, e20171471. [Google Scholar] [CrossRef] [PubMed]
- Ayalew, T.; Molla, A.; Kefale, B.; Alene, T.D.; Abebe, G.K.; Ngusie, H.S.; Zemariam, A.B. Factors associated with neonatal jaundice among neonates admitted at referral hospitals in northeast Ethiopia: A facility-based unmatched case-control study. BMC Pregnancy Childbirth 2024, 24, 150. [Google Scholar] [CrossRef] [PubMed]
- Shapiro, A.; Anderson, J.; Bond, M.; Schwarz, R.; Carns, J.; Mtenthaonga, P.; Kumwenda, W.; Johnston, R.; Miros, R.; Dube, Q.; et al. A low-cost bilirubin measurement tool for neonatal jaundice monitoring at the point-of-care: A comparison of BiliDx with a standard laboratory bilirubinometer and transcutaneous bilirubinometer. Lancet Glob. Health 2021, 9, S23. [Google Scholar] [CrossRef]
- Ercan, Ş.; Özgün, G. The accuracy of transcutaneous bilirubinometer measurements to identify hyperbilirubinemia in an outpatient newborn population. Clin. Biochem. 2018, 55, 69–74. [Google Scholar] [CrossRef]
- Okwundu, C.I.; Olowoyeye, A.; Uthman, O.A.; Smith, J.; Wiysonge, C.S.; Bhutani, V.K.; Fiander, M.; Gautham, K.S. Transcutaneous bilirubinometry versus total serum bilirubin measurement for newborns. Cochrane Database Syst. Rev. 2023, 5, CD012660. [Google Scholar] [CrossRef]
- Kirillov, A.; Mintun, E.; Ravi, N.; Mao, H.; Silvester, C.; Dollár, P.; He, K. Segment Anything. In Proceedings of the IEEE/CVF International Conference on Computer Vision (ICCV), Paris, France, 2–3 October 2023; pp. 4015–4026. [Google Scholar] [CrossRef]
- Selvaraju, R.R.; Cogswell, M.; Das, A.; Vedantam, R.; Parikh, D.; Batra, D. Grad-cam: Visual explanations from deep networks via gradient-based localization. In Proceedings of the IEEE International Conference on Computer Vision, Venice, Italy, 22–29 October 2017; pp. 618–626. [Google Scholar] [CrossRef]
- Aune, A.; Vartdal, G.; Bergseng, H.; Randeberg, L.L.; Darj, E. Bilirubin estimates from smartphone images of newborn infants’ skin correlated highly to serum bilirubin levels. Acta Paediatr. 2020, 109, 2532–2538. [Google Scholar] [CrossRef]
- Munkholm, S.B.; Krøgholt, T.; Ebbesen, F.; Szecsi, P.B.; Kristensen, S.R. The smartphone camera as a potential method for transcutaneous bilirubin measurement. PLoS ONE 2018, 13, e0197938. [Google Scholar] [CrossRef]
- Outlaw, F.; Nixon, M.; Odeyemi, O.; MacDonald, L.W.; Meek, J.; Leung, T.S. Smartphone screening for neonatal jaundice via ambient-subtracted sclera chromaticity. PLoS ONE 2020, 15, e0216970. [Google Scholar] [CrossRef]
- Hardalaç, F.; Aydin, M.; Kutbay, U.; Ayturan, K.; AKYEL, A.; Çağlar, A.; Hai, B.; Mert, F. Classification of neonatal jaundice in mobile application with noninvasive imageprocessing methods. Turk. J. Electr. Eng. Comput. Sci. 2021, 29, 2116–2126. [Google Scholar] [CrossRef]
- Porter, M.L.; Dennis, B.L. Hyperbilirubinemia in the term newborn. Am. Fam. Physician 2002, 65, 599–606. [Google Scholar]
- De Greef, L.; Goel, M.; Seo, M.J.; Larson, E.C.; Stout, J.W.; Taylor, J.A.; Patel, S.N. BiliCam: Using mobile phones to monitor newborn jaundice. In Proceedings of the 2014 ACM International Joint Conference on Pervasive and Ubiquitous Computing, Washington, DC, USA, 13–17 September 2014; ACM: New York, NY, USA, 2014; pp. 331–342. [Google Scholar] [CrossRef]
- Sobel, I.; Feldman, G. A 3 × 3 isotropic gradient operator for image processing. Talk Stanf. Artif. Proj. 1968, 1968, 271–272. [Google Scholar]
- Taylor, J.A.; Stout, J.W.; de Greef, L.; Goel, M.; Patel, S.; Chung, E.K.; Koduri, A.; McMahon, S.; Dickerson, J.; Simpson, E.A.; et al. Use of a smartphone app to assess neonatal jaundice. Pediatrics 2017, 140, e20170312. [Google Scholar] [CrossRef] [PubMed]
- Rong, Z.H.; Luo, F.; Ma, L.Y.; Chen, L.; Wu, L.; Liu, W.; Du, L.Z.; Luo, X.P. Evaluation of an automatic image-based screening technique for neonatal hyperbilirubinemia. Chin. J. Pediatr. 2016, 54, 597–600. [Google Scholar] [CrossRef]
- Lingaldinna, S.; Konda, K.C.; Bapanpally, N.; Alimelu, M.; Singh, H.; Ramaraju, M. Validity of bilirubin measured by Biliscan (smartphone application) in neonatal jaundice: An observational study. J. Nepal Paediatr. Soc. 2021, 41, 93–98. [Google Scholar] [CrossRef]
- Ngeow, A.J.H.; Moosa, A.S.; Tan, M.G.; Zou, L.; Goh, M.M.R.; Lim, G.H.; Tagamolila, V.; Ereno, I.; Durnford, J.R.; Cheung, S.K.H.; et al. Development and Validation of a Smartphone Application for Neonatal Jaundice Screening. JAMA Netw. Open 2024, 7, e2450260. [Google Scholar] [CrossRef]
- Aydın, M.; Hardalaç, F.; Ural, B.; Karap, S. Neonatal jaundice detection system. J. Med. Syst. 2016, 40, 166. [Google Scholar] [CrossRef]
- Juliastuti, E.; Nadhira, V.; Satwika, Y.W.; Aziz, N.A.; Zahra, N. Risk zone estimation of newborn jaundice based on skin color image analysis. In Proceedings of the 6th International Conference on Instrumentation, Control, and Automation (ICA), Bandung, Indonesia, 31 July–2 August 2019; pp. 176–181. [Google Scholar] [CrossRef]
- Hakimi Abu Bakar, A.; Hassan, N.M.; Zakaria, A.; Halim, K.A.A.; Halim, A.A.A. Jaundice (hyperbilirubinemia) detection and prediction system using color card technique. In Proceedings of the IEEE 13th International Colloquium on Signal Processing & Its Applications (CSPA), Penang, Malaysia, 10–12 March 2017; pp. 208–213. [Google Scholar] [CrossRef]
- Fitzpatrick, T.B. The validity and practicality of sun-reactive skin types I through VI. Arch. Dermatol. 1988, 124, 869–871. [Google Scholar] [CrossRef] [PubMed]
- Hashim, W.; Al-Naji, A.; Al-Rayahi, I.A.; Oudah, M. Computer vision for jaundice detection in neonates using graphic user interface. IOP Conf. Ser. Mater. Sci. Eng. 2021, 1105, 012076. [Google Scholar] [CrossRef]
- Hashim, W.; Al-Naji, A.; Al-Rayahi, I.A.; Alkhaled, M.; Chahl, J. Neonatal jaundice detection using a computer vision system. Designs 2021, 5, 63. [Google Scholar] [CrossRef]
- Dissaneevate, S.; Wongsirichot, T.; Siriwat, P.; Jintanapanya, N.; Boonyakarn, U.; Janjindamai, W.; Thatrimontrichai, A.; Maneenil, G. A mobile computer-aided diagnosis of neonatal hyperbilirubinemia using digital image processing and machine learning techniques. Int. J. Innov. Res. Sci. Stud. 2022, 5, 10–17. [Google Scholar] [CrossRef]
- Mansor, M.N.; Yaacob, S.; Muthusamy, H.; Nisha, S. PCA-based feature extraction and k-NN algorithm for early jaundice detection. Int. J. Soft Comput. Softw. Eng. 2011, 1, 25–29. [Google Scholar]
- Nihila, S.; Rajalakshmi, T.; Panda, S.S.; Lhazay, N.; Giri, G.D. Detection of jaundice in neonates using artificial intelligence. In Soft Computing: Theories and Applications: Proceedings of SoCTA 2020; Springer Nature: Singapore, 2021; Volume 2, pp. 431–443. [Google Scholar] [CrossRef]
- Mansor, M.; Hariharan, M.; Basah, S.; Yaacob, S. New newborn jaundice monitoring scheme based on combination of pre-processing and color detection method. Neurocomputing 2013, 120, 258–261. [Google Scholar] [CrossRef]
- Nayagi, B.S.; Angel, S.T. Diagnosis of neonatal hyperbilirubinemia using CNN model along with color card techniques. Biomed. Signal Process. Control 2023, 85, 104746. [Google Scholar] [CrossRef]
- Kalbande, D.; Majumdar, A.; Dorik, P.; Prajapati, P.; Deshpande, S. Deep learning approach for early diagnosis of jaundice. In International Conference on Innovative Computing and Communications; Lecture Notes in Networks and Systems; Gupta, D., Khanna, A., Hassanien, A.E., Anand, S., Jaiswal, A., Eds.; Springer Nature: Singapore, 2023; Volume 492, pp. 387–395. [Google Scholar] [CrossRef]
- He, K.; Zhang, X.; Ren, S.; Sun, J. Deep residual learning for image recognition. In Proceedings of the IEEE Conference on Computer Vision and Pattern Recognition, Las Vegas, NV, USA, 27–30 June 2016; pp. 770–778. [Google Scholar] [CrossRef]
- He, K.; Gkioxari, G.; Dollár, P.; Girshick, R. Mask R-CNN. In Proceedings of the IEEE International Conference on Computer Vision, Venice, Italy, 22–29 October 2017; pp. 2961–2969. [Google Scholar] [CrossRef]
- Althnian, A.; Almanea, N.; Aloboud, N. Neonatal jaundice diagnosis using a smartphone camera based on eye, skin, and fused features with transfer learning. Sensors 2021, 21, 7038. [Google Scholar] [CrossRef]
- Zhu, R.; Guo, Y.; Xue, J.H. Adjusting the imbalance ratio by the dimensionality of imbalanced data. Pattern Recognit. Lett. 2020, 133, 217–223. [Google Scholar] [CrossRef]
- Chowdhary, A.; Dutta, S.; Ghosh, R. Neonatal jaundice detection using colour detection method. Int. Adv. Res. J. Sci. Eng. Technol. 2017, 4, 197–203. Available online: https://iarjset.com/upload/2017/july-17/IARJSET%2033.pdf (accessed on 22 October 2025).
- Chakraborty, A.; Goud, S.; Shetty, V.; Bhattacharyya, B. Neonatal jaundice detection system using CNN algorithm and image processing. Int. J. Electr. Eng. Technol. 2020, 11, 248–264. Available online: https://ssrn.com/abstract=3636169 (accessed on 22 October 2025).
- Singla, R.; Singh, S. A framework for detection of jaundice in newborn babies using homomorphic filtering-based image processing. In Proceedings of the 2016 IEEE International Conference on Inventive Computation Technologies (ICICT), Coimbatore, India, 26–27 August 2016; Volume 3, pp. 1–5. [Google Scholar] [CrossRef]
- Aldabbagh, B.; Aziz, M.H. Neonatal jaundice severity detection from skin images using deep transfer learning techniques. J. Electron. Electromed. Eng. Med. Inform. 2024, 7, 92–104. [Google Scholar] [CrossRef]
- Simonyan, K.; Zisserman, A. Very deep convolutional networks for large-scale image recognition. In Proceedings of the 3rd International Conference on Learning Representations (ICLR 2015), San Diego, CA, USA, 7–9 May 2015. [Google Scholar] [CrossRef]
- Abdulrazzak, A.Y.; Mohammed, S.L.; Al-Naji, A.; Chahl, J. Real-time jaundice detection in neonates based on machine learning models. BioMedInformatics 2024, 4, 623–637. [Google Scholar] [CrossRef]
- Abdulrazzak, A.Y.; Mohammed, S.L.; Al-Naji, A. NJN: A Dataset for the Normal and Jaundiced Newborns. BioMedInformatics 2023, 3, 543–552. [Google Scholar] [CrossRef]
- Gupta, K.; Sharma, V.; Kathait, S.S. Smart screening: Non-invasive detection of severe neonatal jaundice using computer vision and deep learning. Int. J. Comput. Appl. 2024, 186, 35–43. [Google Scholar] [CrossRef]
- Makhloughi, F. Artificial intelligence-based non-invasive bilirubin prediction for neonatal jaundice using 1D convolutional neural network. Sci. Rep. 2025, 15, 11571. [Google Scholar] [CrossRef]
- Salami, F.O.; Muzammel, M.; Mourchid, Y.; Othmani, A. Artificial intelligence non-invasive methods for neonatal jaundice detection: A review. Artif. Intell. Med. 2025, 162, 103088. [Google Scholar] [CrossRef]
- Zuiderveld, K. Contrast limited adaptive histogram equalization. In Graphics Gems IV; Academic Press: Cambridge, MA, USA, 1994; pp. 474–485. [Google Scholar] [CrossRef]
- Glorot, X.; Bordes, A.; Bengio, Y. Deep sparse rectifier neural networks. In Proceedings of the 14th International Conference on Artificial Intelligence and Statistics (AISTATS), Fort Lauderdale, FL, USA, 11–13 April 2011; Volume 15. [Google Scholar]
- van der Linde, I. Why the confusion matrix fails as a model of knowledge. AI Soc. 2025. [Google Scholar] [CrossRef]
- Abebe, M.A.; Hardeberg, J.Y.; Vartdal, G. Smartphones’ skin colour reproduction analysis for neonatal jaundice detection. J. Imaging Sci. Technol. 2021, 34, 060407-1–060407-15. [Google Scholar] [CrossRef]
Disclaimer/Publisher’s Note: The statements, opinions and data contained in all publications are solely those of the individual author(s) and contributor(s) and not of MDPI and/or the editor(s). MDPI and/or the editor(s) disclaim responsibility for any injury to people or property resulting from any ideas, methods, instructions or products referred to in the content. |
© 2025 by the authors. Licensee MDPI, Basel, Switzerland. This article is an open access article distributed under the terms and conditions of the Creative Commons Attribution (CC BY) license (https://creativecommons.org/licenses/by/4.0/).