1. Introduction
At delivery, the transition from embryo to newborn (also known as neonate) is a complex process that must occur quickly for successful survival [
1]. Every day, nearly 800 women die from conditions related to pregnancy and childbirth that could have been avoided [
2]. Every year, more than 20 million low birth weight (LBW) babies are born [
3]. LBW babies are more prone to complications that can lead to death. In Saudi Arabia, infant mortality rates have increased to where the prevalence is around 5.497 deaths per 1000 live births [
4]. A few high-risk births have been reported in the early stages of pregnancy, so optimal obstetric care may not be provided in Saudi Arabia. Early intervention and timely medical attention can help mitigate the long-term risks associated with birth weight. Prenatal fetal weight classification can play a significant role in saving the lives of both mothers and newborns. Hence, developing new technologies to accurately predict the classification of newborns’ weight ranges is crucial. Accurate prediction of a newborn infant’s weight is of great importance for the safety and well-being of both the mother and baby. Knowledge of the expected weight range of newborns can help healthcare professionals quickly identify any potential issues that may arise during labor and delivery. According to the World Health Organization (WHO) [
5], neonates with a birth weight between 2500 g (about 5.51 lb) and 4000 g (about 8.82 lb) are typically considered to be of average healthy weight. In comparison, a baby weight of less than 2500 g (about 5.51 lb) is classified as LBW, and those above 4000 g (about 8.82 lb) are overweight. So, it is crucial to identify the factors that affect the baby’s birth weight. Based on previous research, those factors are commonly identified as genetics, parents’ age, weight gains during pregnancy, length of gestation, gender, and the number of babies.
Low birth weight (LBW) babies are at an increased risk of a variety of complications, including infant mortality, labor complications, neonatal survival, and multiple birth complications [
1]. Additionally, LBW babies are more likely to die within the first 28 days (about four weeks) of life due to a variety of illnesses and other medical problems. As such, LBW babies must receive proper care and attention to ensure their health and well-being. On the other hand, overweight infants are associated with a variety of adverse outcomes such as dystocia, increased risk for neonatal hypoglycemia, and higher rates of cesarean section deliveries due to fetal distress or other labor-related difficulties. Also, there are many risks associated with their health later in life, including obesity, diabetes, and heart defects, to name a few; all of which have long-term implications for child and mother alike if not appropriately addressed early on in the development stages. When it comes to pregnant women with abnormal infant weight, they are at risk for several complications, including an increased risk of infection, preterm labor, and postpartum depression. Additionally, the mother may be at risk for hemorrhaging, blood clots, and other health problems.
As evidenced by the challenges identified above, there is a need for a reliable prediction technique that can accurately determine the birth weight range of each child. Machine learning (ML) algorithms are well-suited for this task, as they can learn and improve with experience and data [
6]. ML models can be employed to create forecasts without requiring explicit programming and are commonly used in various fields, such as health, education, and agriculture. This research aims to utilize ML technologies to develop a model for predicting a baby’s birth weight class with minimal errors and cost-effectiveness. Understanding the features of both mother and baby that contribute to birth weight prediction is essential for improving prenatal care and reducing complications during labor and delivery. Features such as maternal age, weight, height, blood pressure, blood sugar levels, and hemoglobin levels provide crucial insights into maternal health and potential risk factors for low or high birth weight. Additionally, factors related to the newborn, such as gender, height, and weight, play a significant role in determining birth weight ranges. By leveraging machine learning (ML) algorithms, healthcare professionals can analyze these features to develop predictive models that assist in identifying potential issues early on, thereby enabling timely interventions and mitigating adverse outcomes. Integrating such predictive tools into clinical practice holds promise for enhancing maternal and neonatal care by facilitating personalized and proactive healthcare strategies. Through the utilization of comprehensive datasets containing these diverse features, ML algorithms can effectively learn patterns and relationships to accurately predict birth weight ranges, ultimately leading to improved outcomes for both mothers and babies.
The proposed model is intended to provide a reliable and efficient tool for predicting a baby’s birth weight range using ML, which potentially benefits healthcare and mitigating the negative consequences of false birthweight estimation. This study utilizes and compares two datasets of pregnant mothers’ clinical data. First, the Saudi private dataset provided by King Fahd University Hospital (KFUH) consists of 639 pregnant women and 15 attributes of the mother’s features. Second, a purchased public dataset is available from the Institute of Electrical and Electronics Engineers (IEEE) [
7]. The dataset consists of 1801 records combined with 18 features of the mother and baby. Various ML algorithms were utilized to identify the best performance technique for the research purpose, including Support Vector Machine (SVM), Decision Tree (DT), Random Forest (RF), Extra Trees (ET), Gaussian Naive Bayes (GaussianNB), Extreme Gradient Boosting (XGBoost), Adaptive Boosting (AdaBoost), and Light Gradient Boosting Machine (LGBM). The results show that the Extra Trees model outperformed the other algorithms with an accuracy, precision, and recall score of 98% and a specificity of 99% on the KFUH dataset. In contrast, using the Random Forest classifier, the IEEE dataset attained an accuracy, precision, recall, and F1-score of 96%, respectively, with a specificity of 98%. These models would greatly benefit the medical community, providing an accurate and reliable means of predicting a baby’s birth weight.
This paper is structured as follows:
Section 2 presents the related works and studies.
Section 3 presents the materials and methods used, including the dataset description, statistical analysis, a description of the employed ML algorithms, the performance measures used to assess the developed models, and, finally, the optimization strategy chosen. The findings of this paper are explained in
Section 4, and the results of the models are described in
Section 5. Finally, conclusions and future work are discussed in
Section 6.
2. Related Work
Over the past few years, machine learning has become increasingly popular in healthcare. Also, researchers have examined the utilization of machine learning algorithms for fetal weight estimation. For this purpose, multiple studies implemented various ML and DL techniques to create classifier models using clinical data, besides other genetic and environmental factors. Below are some literature reviews that identify potential areas for improvement in this research.
The work presented in [
8] proposed a method to predict the weight range of infants using a machine learning approach. Their motivation for this study was to reduce the mortality risk in the first year, since it is directly related to the infant’s weight. The dataset contained around 500 records for pregnant women in the first six months. They defined 16 attributes that affect an infant’s birth weight, such as blood group, the pregnant woman’s age, a history of abortion, and blood sugar. The researchers applied five machine learning models: artificial neural networks (ANNs), Naïve Bayes (NB), Support Vector Machine (SVM), Logistic Regression, and Decision Tree (DT). The obtained accuracy with ANNs and NB is 70%, and it is 60% for SVM and Logistic Regression. In contrast, DT was below 60%. Moreover, the authors in [
9] intended to estimate infant birth weight and low birth weight in the United Arab Emirates using machine learning algorithms. The predictions were performed with and without feature selection techniques by combining multiple subsets of features. Moreover, the SMOTE technique was employed to oversample the minority class. Thirty ML algorithms were used for infant BW estimation and LBW classification. The experiments were conducted on a self-created dataset with 88 features.
Furthermore, the dataset was obtained from 821 women from three hospitals in the United Arab Emirates (UAE). The best weight estimation was obtained using the Random Forest algorithm, with a mean absolute error of 294.53 g using five-fold cross-validation. In contrast, the best classification performance was obtained using Logistic Regression with SMOTE oversampling techniques, which achieved an accuracy, precision, recall, and F1-score of 90.24%, 87.6%, 90.2%, and 0.89, respectively.
The research in [
10] provided a classification model to group infants born to mothers with hypertension according to their estimated weights. The Weka platform was used to implement the Naive Bayes NB classification model by three testing techniques: supplied test, cross-validation, and split percentage. The researchers collected a dataset of 219 pregnant women from Muhammadiyah Palembang Hospital. The outcomes demonstrated that NB and cross-validation achieved the best results, with accuracy, recall, and precision reaching 82.45%, 69.5%, and 79.67%, respectively.
Moreover, the authors in [
11] aimed to estimate fetal birth weight in high-risk pregnancies through machine learning techniques. This paper compared several ML techniques: Tree, Support Vector Machine (SVM), k-Nearest Neighbor (kNN), Boosted Trees, Bagged Trees, and Subspace KNN. Data were acquired by supplying a form to pregnant women who suffered from some hypertensive disorder during pregnancy at the Maternity School Assis Chateaubriand of the municipality of Fortaleza, Ceara, Brazil, from May to September 2017. The results show that hybrid methods based on ensemble learning can efficiently predict the fetus’s expected weight at birth. The accuracy achieved for Tree, K-NN, Boosted Trees, and Subspace KNN was 83%, while it was 79% for SVM and 84% for Bagged Trees. Likewise, the study in [
12] investigates machine learning for estimating fetal weight at varying gestational ages. For this purpose, the researchers used ensemble methods in machine learning that create multiple models for a robust prediction, since these models can increase the diversity of algorithms and reduce generalization errors to improve the accuracy of the results. The dataset was from Shenzhen Bao’an Maternity and Child Healthcare Hospital. A total number of 5000 samples were randomly selected, with no gynecology and other general medical histories regarding prenatal care screened out. The implemented algorithms were Random Forest, XGBoost, and LightGBM. The accuracy results were 69%, 62%, and 61%, respectively. Furthermore, for the ensemble model, it was 65%. The authors in [
13] also aimed to design a model to predict early fetal weight using Support Vector Regression (SVR). The dataset was obtained in the first trimester of pregnancy, and birth weight was taken after delivery, for a total of 250 pregnant women. To test various prediction algorithms, the study used four different SVR variants: Linear, Polynomial (Poly), Radial Basis Function (RBF), and Nu. In addition, a 10–fold cross-validation was carried out during the training and validation. Compared to other study methods, the results of this study showed that the obtained errors were competitive, achieving relative errors of less than 3% with SVR-RBF.
Apart from that, the author in [
14] proposed a model to estimate newborn babies’ low birth weight (LBW). The dataset was gathered from the Ethiopia Demographic and Health Survey (EDHS) 2016, consisting of 10,641 instances. The implemented classification model classes are LBW and normal, the SMOTE technique is applied to the resampling of imbalanced data, and randomized search cross-validation is employed; the dataset was 2110 records and 25 features on preprocessing; the data was split 80:20 for training and testing sets; the training models used in the study were Logistic Regression (LR), Decision Tree (DT), Naive Bayes (NB), K-Nearest Neighbor (K-NN), Random Forest (RF), Support Vector Machine (SVM), Gradient Boosting (GB), and Extreme Gradient Boosting (XGB). The experiments indicated that RF offered the best results, with 91.6% for all (accuracy, recall, and F1-score) and 96.8% for the ROC-AUC.
Similarly, the authors of [
15] aimed to estimate and classify the low birth weight of newborns using prediction and classification machine learning models. Several machine learning techniques were utilized to build this model: Binary Logistic Regression and Random Forest (RF). The authors used data from 45,607 women from the Indonesian Demographic and Health Survey (IDH) 2012. The results revealed that the Binary Logistic Regression accuracy was 0.937 for prediction and classification; it was weakly supported by the AUC value = 0.505; however, Random Forest had an accuracy of 93%. The work in [
16] aimed to develop a mathematical model for predicting infant weight using unmedical variables: ethnicity, education level, smoking habit, baby weight, and duration of gestation. The dataset contained data on 1113 pregnant women. Researchers determined which factors are essential for prediction using Multivariate Linear Regression. The model predicts birth weight based on the factors determined. The results showed that the regression could explain 65% of the variation in the newborn weights. Nevertheless, there has been increasing attention to developing methods of fetal weight classification using ultrasound data.
In [
17], the researchers used hybrid data from electronic medical records with the B-ultrasonic examination of pregnant women to build a predicting birth weight classifier model based on long short-term memory (LSTM) networks. The data have been collected from a clinical dataset at a hospital in Eastern China. As a result, they used the accuracy rate of the prediction model by using a Back Propagation Neural Network (BPNN), Random Forest (RF), Convolutional Neuron Networks (CNNs), Linear Regression (LR), Support Vector Regression (SVR), and the proposed hybrid LSTM. According to a comparison between the machine learning models, the hybrid LSTM model obtained the mean relative error (MRE) and the best accuracy of 0.933. Using the same techniques, in [
18], the authors used the data for 80 women collected from a Chinese hospital. Therefore, this study aims to create a prediction model for fetal weight using the genetic algorithm to improve the Back Propagation Neural Network (GA-BPNN) to deal with the continuous change in the signs of pregnant women. The GA-BPNN model achieved a prediction rate of control error within 6%, and the accuracy was 76.3%, 14.5% higher than the traditional methods. According to the results, we can estimate that the GA-BPNN model can predict fetal weight effectively and with high accuracy.
Various ML approaches have been investigated in [
19] to predict LBW. In this regard, five ML techniques were used, including DT, RF, ANN, SVM, and LR, with five evaluation criteria applied to evaluate their performance. A dataset comprising 741 mother–newborn pairs and 13 potential features obtained from Fatemieh Hospital has been investigated. The outcome showed a 7% occurrence of LBW. The LR method provided a sensitivity, specificity, positive likelihood ratio, negative likelihood ratio, and accuracy of 74%, 89%, 7.04%, 29%, and 88%, respectively. Moreover, using LR, the gestational age, number of abortions, gravida, consanguinity, maternal age at delivery, and neonatal sex were observed as the six most essential features related to LBW. Similarly, in [
20], authors investigated around eight ML and DL algorithms, including LR, DT, RF, DL Feed Forward, Extreme Gradient Boost (XGBoost), Light Gradient Boost (LGBoost), SVM, and permutation feature classification with kNN. A real-life dataset named IMaN Net was considered, and a highest accuracy of 79%, a precision of 87%, recall of 69%, and F1-score of 77% was obtained using XGBoost. Likewise, a study in [
21] proposed an ML-based prediction of LBW and assessed the impact of data-balancing approaches and associated risks. The study investigates a huge dataset of 266,687 samples over six years, where 8.63% (23,019 of the records) were labeled as LBW. Seven ML algorithms with various balancing techniques were investigated, and XGBoost obtained the highest recall value of 70%.
Based on the literature reviews related to this study, it has been noted that most studies achieved their best outcomes with the RF algorithm. Likewise, most reviewed papers have confined their categorization to the low and normal weight range, while neglecting the high weight classification category. Similarly, no studies have used Extra Trees (ET) or Adaptive Boosting (AdaBoost) to forecast birth weight. However, only one study utilized the optimizer for tuning the hyperparameters with Gride search. Moreover, studies were only found in the literature on the Saudi Arabia dataset, namely the kingdom’s eastern province, considering the effect of demographical location on many features for women. Therefore, this research proposed a three-category classifier model using the local Saudi dataset and a public dataset, besides the grid search optimizer, to compare findings to determine the optimal direction for advancing fetal weight prognostication.
3. Materials and Methods
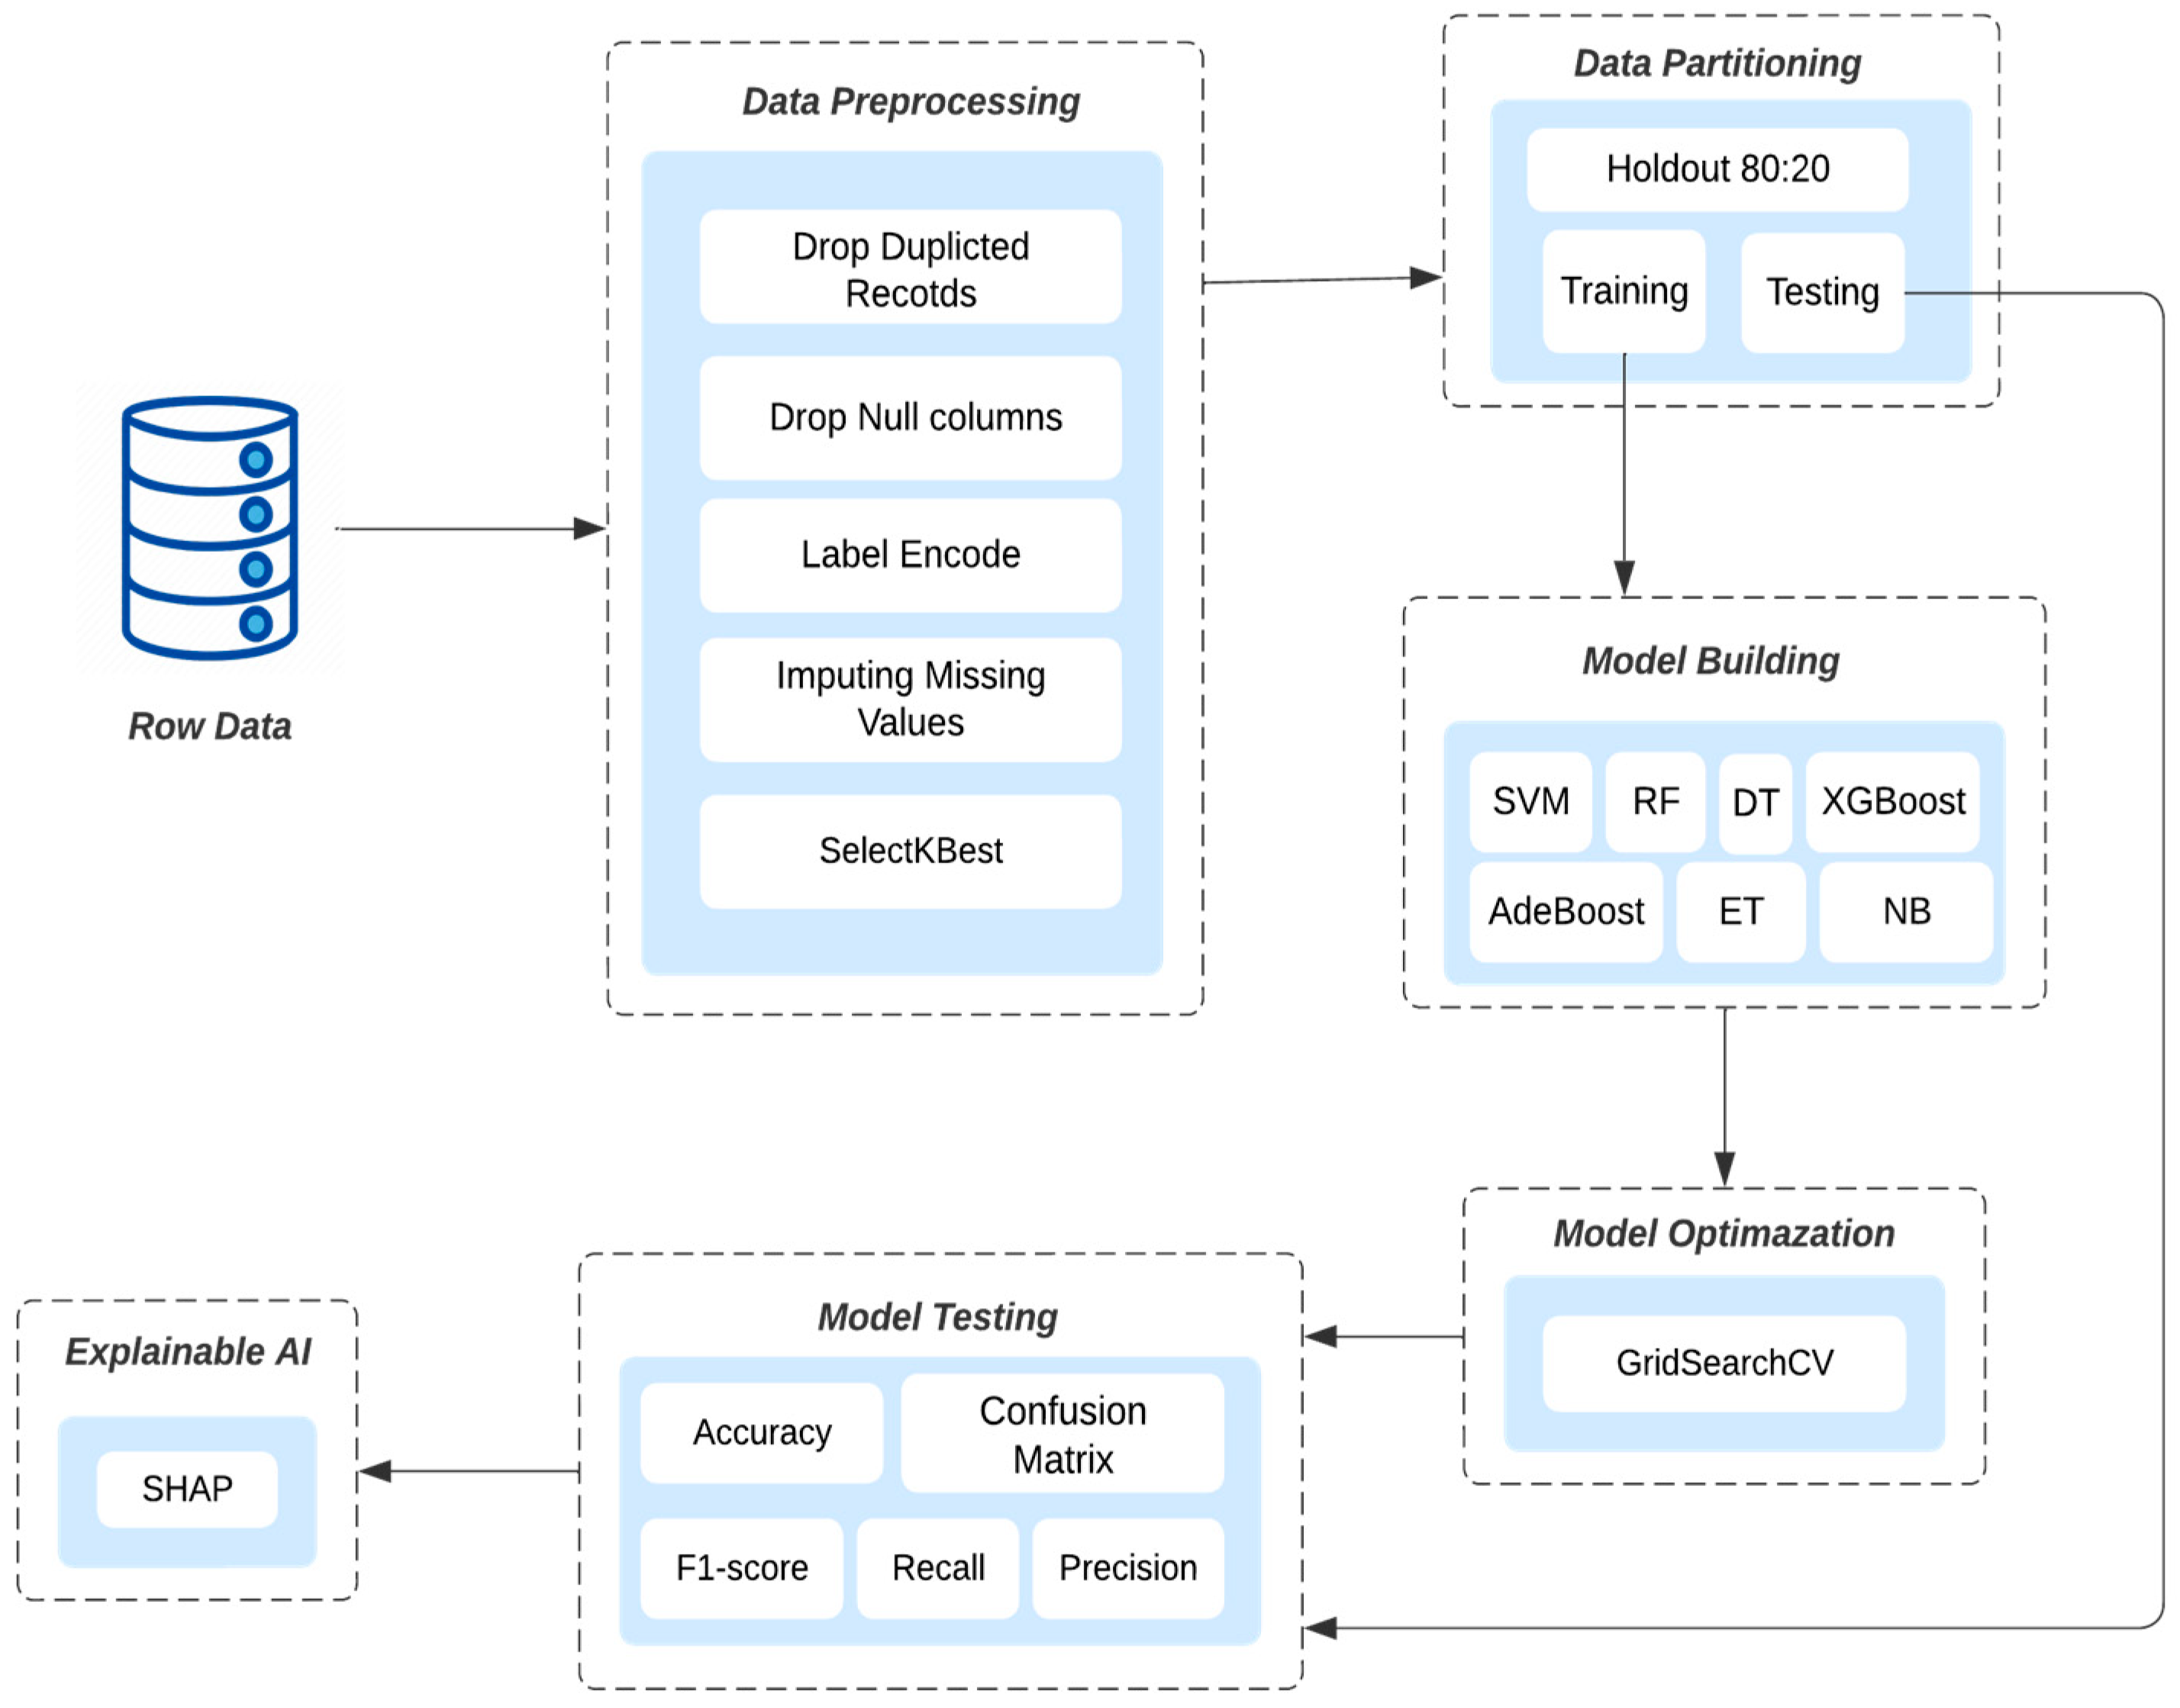
This work developed a model for classifying a birth weight range using Python programming through the Jupiter Notebook, Visual Studio Code, and Google Colab. The preprocessing methods used on both datasets are depicted in
Figure 1. The best features were selected utilizing the SelectKBest method for the KFUH dataset K = 4 and K = 12 in the IEEE dataset. Moreover, the datasets were divided into 80% for training and 20% for testing the proposed models. The Synthetic Minority Oversampling Technique SMOTE was applied to balance the classes. Additionally, the data features were scaled using the standard scaler technique. Furthermore, the chosen features were used to train eight ML algorithms: SVM, DT, RF, ET, GaussianNB, XGBoost, AdaBoost, and LGBM. GridSearchCV was then employed to find the optimal hyperparameters of the trained models. Various performance metrics were used to evaluate the models, including accuracy, precision, recall, F1-score, sensitivity, and confusion matrix. Finally, the best model was then interpreted by applying SHAP techniques.
Figure 1 summarizes the steps used in developing the prediction models.
3.1. Datasets Description
This study employed two datasets of pregnant mothers’ clinical data: genome and maternal. The first dataset was obtained from the King Fahd University Hospital (KFUH) in Dammam, Saudi Arabia. This dataset consisted of 4335 records from 639 pregnant women and 16 attributes of the mother’s features and details of several test results. After data preprocessing, the final dataset had 639 records and 23 attributes. The second is a public dataset obtained from IEEE [
7], consisting of 1801 records and 18 features of pregnant mothers’ clinical data.
Table 1 illustrates the features of each dataset. In both datasets utilized in this study, the feature sets were obtained through systematic collection processes overseen by medical professionals, ensuring that the variables analyzed were not arbitrarily chosen. The IEEE dataset is meticulously curated by medical professionals. This ensures the inclusion of clinically relevant features that are widely recognized in the medical community for their significance in health assessments. Furthermore, the feature set employed in this dataset is derived from established medical guidelines and protocols, thereby emphasizing its robustness and reliability. On the other hand, the KFUH dataset represents a valuable source of real-world data collected by medical staff with expertise in patient care in the specified triage rooms. The feature set utilized in this dataset is carefully selected based on the insights and recommendations of medical practitioners who possess firsthand knowledge of the clinical context and the variables most pertinent to patient health assessments. In this study, we meticulously compared our dataset with previously published works, ensuring its relevance and reliability. The primary goal was to closely examine the features between maternal and fetal data. This focused approach allowed us to employ a technique tailored specifically to meet the demands of our research objectives. By implementing this streamlined approach, we efficiently navigated through the extensive array of data points, pinpointing those most crucial to our investigation. This deliberate strategy empowered us to delve deeply into the fundamental aspects of our study, facilitating a more profound and insightful analysis of maternal–fetal features.
3.2. Statistical Analysis
Statistical analysis is the process of using mathematical techniques to analyze and interpret data. In machine learning, statistical analysis is commonly used to identify patterns, relationships, and trends in datasets for preprocessing the data according to the analysis results. The first step in preprocessing any dataset is to investigate its features. Thus,
Table 2 shows the statical characteristics of the numerical features for both the KFUH and IEEE datasets, including the count, mean, standard deviation (std), and the minimum, Q1, median, Q3, maximum values, and missing values count.
Table 3 presents the correlation coefficient of each feature with the target class on the two datasets used in this project. To explain the analysis more profoundly, the correlation will help to understand and measure the strength and the direction of the relationship between the features and the fetal weight.
3.3. Data Preprocessing
One of the critical and sensitive processes of transforming raw data and making it suitable in terms of quality is the derivation of information to influence the learning ability of the model, which is called the data preprocessing process [
22,
23]. The preprocessing techniques used in this study were from the Python Sklearn and Pandas packages. The KFUH dataset initially included 4335 records from 639 pregnant women and 16 features. In contrast, the dataset from Public IEEE contains 1801 records and 20 features. There were often null values in the two datasets. Therefore, features with 500 or more deficiencies in the KFUH dataset and Public IEEE were deleted using the drop () method, and the duplicated rows were removed using the duplicated () method. Accordingly, 639 instances and 23 features from the KFUH data and 1300 instances with 19 features from the IEEE data remained. Moreover, the Sklearn LabelEncoder() method was used to convert categorical data into a numerical format before the training and evaluating models.
Missing values are an unavailable entity, an incomplete feature, or a wrong entry in the data, so the results of the machine learning model may be affected by low statistical power, inaccurate parameter estimation, and difficulty in preprocessing the data. Thus, we may need to process these fields and convert them to use them in the analysis and modeling. As a result, the fillna() method is provided in the Python programming language to solve this problem; it replaces the new object in the DataFrame, while the in-place parameter is not set to True, in which case the fillna() method performs an overwrite into the original DataFrame instead. This study checks the skewed data to observe how the data are distributed to impute the numerical null values. Whenever the skewness is symmetrical, the data are nearly between −0.5 and 0.5; therefore, the null values are filled using the mean, as shown below in Equation (1), where
n represents the total number of values in a column.
xi represents a single data point [
24].
In contrast, if the skewness is slight, the data are nearly between −1 and −0.5 negatively skewed or between 0.5 and 1 positively skewed. The null data are filled with the median, as shown below in Equation (2). For a dataset
x of
n elements arranged in ascending order [
25]:
Moreover, when the skewness is extreme, the data lower than −1 are negatively skewed, or the data greater than one are positively skewed. The null data are filled with the mode, as shown below in Equation (3). If
is a discrete random variable, the mode is the value
x at which the probability mass function takes its maximum value. It is the most probable value to be sampled [
26].
Next, each dataset was split into two stratified sets: 80% for training and validation and 20% for testing. The first dataset, KFUH, comprised a total of 639 records. Within this dataset, 511 records were assigned for training and validation, with the remaining 128 earmarked for testing. The second dataset, IEEE, consisted of 1801 records. From these, 930 were designated for training and validation, leaving 360 for testing. This ensures that the model learns from a significant portion of the data, while retaining a separate portion to assess its generalization ability on unseen data.
The KFUH and public IEEE datasets values were scaled using StandardScaler to standardize a feature by subtracting the mean and then scaling to unit variance, which has been fitted to the training set and transformed into the testing set using Equation (4).
3.4. Description of Utilized Machine Learning Algorithms
This study utilized several machine learning algorithms to classify the weight of newborn babies into three categories: low, normal, and high. The algorithms used include Adaptive Boosting, Decision Tree, and Random Forest. These algorithms have been chosen due to their efficiency and accuracy in classification tasks for similar purposes. Due to the different nature of the two datasets used in terms of features, the number of records, and the nature and content of the data, the lazy classifier was applied, which provided the performance of more than 20 prediction models for the given datasets, in which the top-performing five models for each dataset were used.
3.4.1. Random Forest (RF)
RF is a supervised ensemble learning algorithm for classification and regression problems. It works by creating a set of decision trees on random subsets of the training data and then combining their outputs through a voting mechanism. It helps to reduce overfitting and improve accuracy. It can handle high-dimensional data with many features, missing data, and outliers. On the other hand, it can be computationally expensive, time-consuming, and not good with imbalanced data [
27].
3.4.2. Gaussian Naive Bayes (NB)
It is a probabilistic machine learning algorithm for binary or multi-classification tasks. It assumes that the features are independent of each other given the class label and that the probability distribution of each feature given the class label is Gaussian (i.e., normal distribution). During training, the algorithm estimates each feature’s mean and standard deviation for each class label. During prediction, it calculates the likelihood of each class label given the input features using Bayes’ theorem and selects the class label with the highest probability as the prediction. Gaussian Naive Bayes is simple, efficient, and often works well in practice, especially for high-dimensional datasets. Although the features are not always independent nor normally distributed, they can suffer from the zero probabilities problem [
28].
3.4.3. Extremely Randomized Trees (ET)
Extra Trees, or Extremely Randomized Trees, is an ensemble machine learning algorithm for classification and regression tasks. It is similar to Random Forest but with an additional randomization step. During training, Extra Trees randomly selects a subset of features and thresholds for each decision tree, making the trees more diverse and less correlated. It helps to reduce overfitting and improve accuracy. At prediction time, the outputs of all the trees are averaged or combined to produce the final prediction. Extra Trees is simple, efficient, and often works well in practice, especially for high-dimensional datasets. The main disadvantages of Extra Trees are a higher bias and more complex tuning [
29].
3.4.4. Support Vector Machines (SVMs)
SVMs are powerful machine learning algorithms for classification, regression, and outlier detection tasks. SVMs find the optimal hyperplane that separates two classes of data with a maximum margin, called the maximum margin hyperplane. During training, SVMs optimize a convex objective function, using the input features to find the hyperplane that maximizes the margin. If the classes are not linearly separable, SVMs use a kernel function to map the input features to a higher-dimensional space where the classes can be separated. SVMs are effective in high-dimensional spaces and often work well in practice. However, SVMs can be computationally expensive to train and sensitive to imbalance [
30].
3.4.5. Adaptive Boosting (AdaBoost)
AdaBoost is an ensemble machine learning algorithm used for classification and regression tasks. It works by iteratively training a series of weak models on weighted versions of the dataset, where the weights are adjusted to focus on misclassified instances. The weak models are then combined into a strong model by assigning weights to their predictions based on their performance during training. AdaBoost is particularly effective for boosting the performance of decision trees, and it can be used with various base models. AdaBoost is known for its ability to improve accuracy, reduce overfitting, and handle imbalanced datasets. AdaBoost is sensitive to noisy data [
31].
3.4.6. Extreme Gradient Boosting (XGBoost)
XGBoost is a gradient-boosting machine learning algorithm used for classification, regression, and ranking tasks. It works by iteratively training decision trees to minimize a loss function, using a gradient descent optimization approach. XGBoost also includes several regularization techniques, such as L1 and L2 regularization, to prevent overfitting. It also supports parallel processing and distributed computing to improve efficiency on large datasets. XGBoost is a popular and powerful algorithm that has won numerous machine learning competitions and is widely used in the industry for various applications. XGBoost requires significant computational resources [
32].
3.4.7. Light Gradient Boosting (LGBM)
LGBM is an ensemble machine learning algorithm used for classification and regression tasks. It is similar to XGBoost but uses a different approach to build decision trees, and it utilizes histogram-based algorithms to speed up the training process. LightGBM also includes techniques such as gradient-based one-side sampling (GOSS) and exclusive feature bundling (EFB) to further improve performance and reduce memory usage. It is known for its scalability, speed, and high accuracy, making it a popular choice in the industry for large-scale machine learning tasks. However, it requires careful tuning and validation to achieve the best performance, and its interpretability may be limited, especially for complex models [
33].
3.4.8. Decision Tree (DT)
Decision Tree is a machine learning algorithm used for classification and regression tasks. It works by constructing a tree-like model of decisions and their possible consequences, with each internal node representing a test on a feature and each leaf node representing a class or a value. During training, the algorithm selects the best feature to split the data based on a certain criterion, such as information gain or Gini impurity. During prediction, the input data traverse through the decision tree, and the prediction is based on the leaf node that the input data reach. Decision Trees are simple, interpretable, and can work well in practice, especially for small to medium-sized datasets. But it requires careful tuning and validation to prevent overfitting and instability, and its performance may be limited by its bias toward certain features [
34].
3.5. Performance Measure
The performance of the developed models will be assisted using a confusion matrix and several performance measures derived from it. The confusion matrix in
Table 4 summarizes the actual and predicted classifications of a model on a dataset for one class used to evaluate the performance of the ML’s model, which consists of True Positive (TP), False Positive (FP), True Negative (TN), and False Negative (FN), where (P) is Placed and (N) Not Placed.
The performance metrics that will mainly be used in this classification model are accuracy, precision, recall, specificity, and F1-score. Accuracy works to define the ratio between the correctly classified results and the total number of all results. As for precision and recall, both will measure the correctly predicted positives, but precision aims to show the number of weights that were positively placed, whereas recall helps to understand how many positively placed weights the model was able to detect. In addition, specificity is the percentage of true negative samples that were accurately predicted out of all real negative samples. The F1-score can be seen as the harmonic mean of both precision and recall. Using a variety of metrics will significantly help in defining the performance of this model [
35]. The equations of the previously mentioned measures are [
36,
37,
38]:
3.6. Optimization Strategy
3.6.1. Hyperparameters Tuning
Using a model hyperparameter, the model seeks to search for the best optimal values for the learning algorithm. Furthermore, it describes the external architecture of the model, which cannot be determined by the values from the data but must be selected before the learning process. To realize better results, the model is trained by integrating hyperparameters to maximize model performance and minimize the predetermined loss function [
39,
40].
3.6.2. GridSearchCV
GridSearchCV searches for optimal parameters based on a grid of parameters, and Sklearn’s model_selection package also utilizes it. Furthermore, the training data fit the estimator model based on a predefined set of hyperparameters. Thus, you can select the best hyperparameters from the list [
41,
42].
Table 5 and
Table 6 show the optimal values for each parameter in both datasets used.
4. Results
The models developed were evaluated based on various performance criteria, using the most suitable hyperparameters and feature subsets generated separately by the GridSearchCV and SelectKBest methods, and the results are presented in
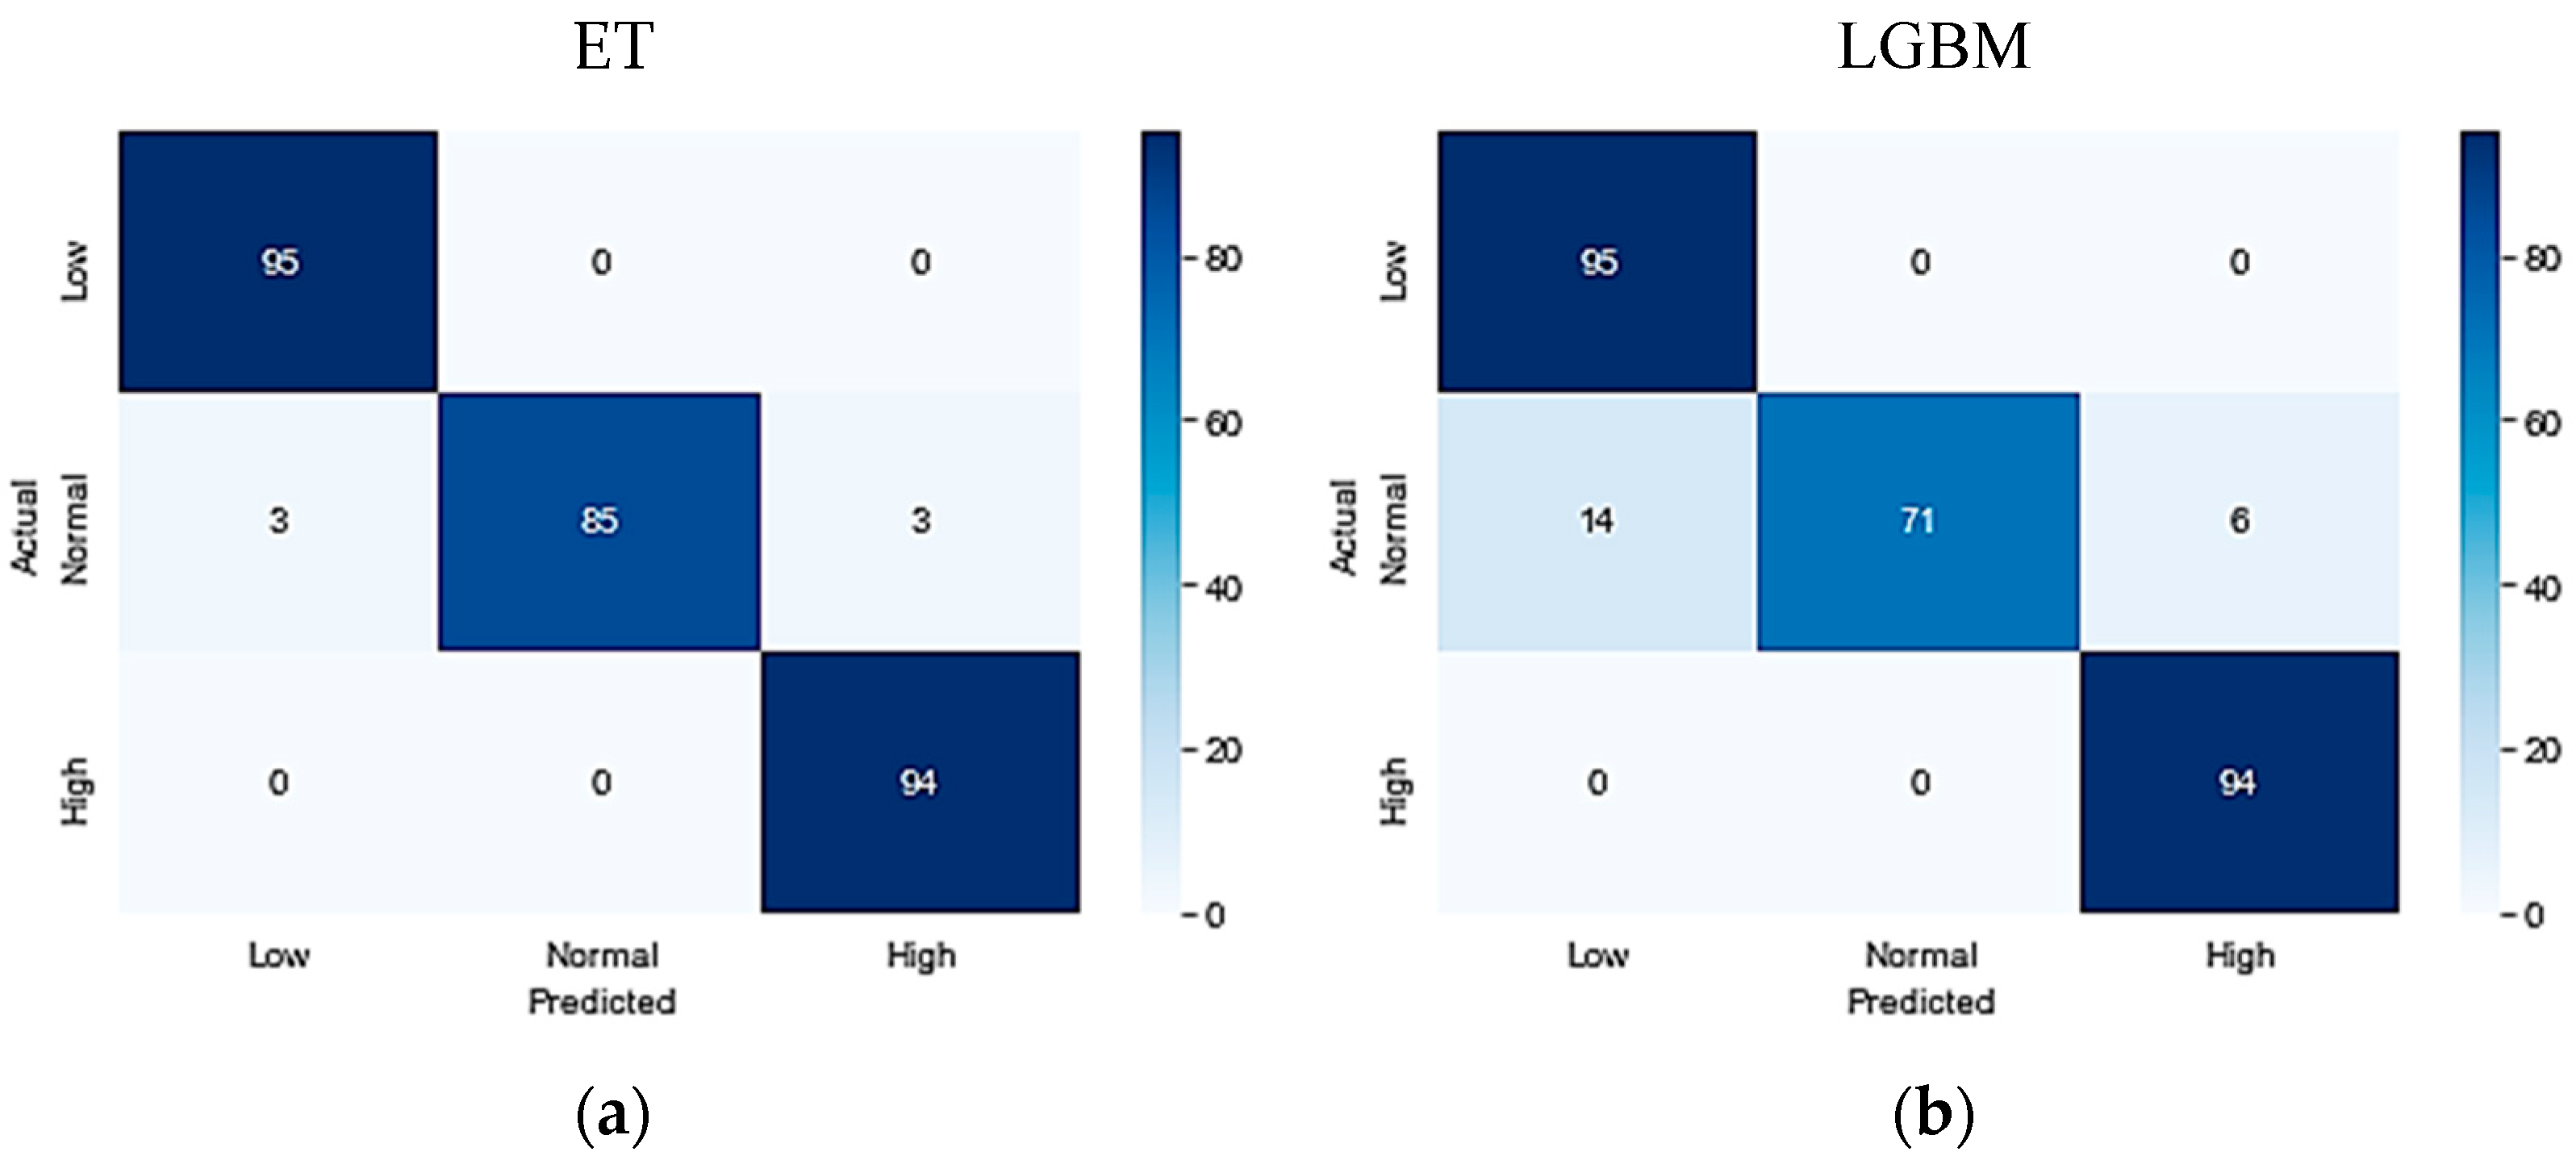
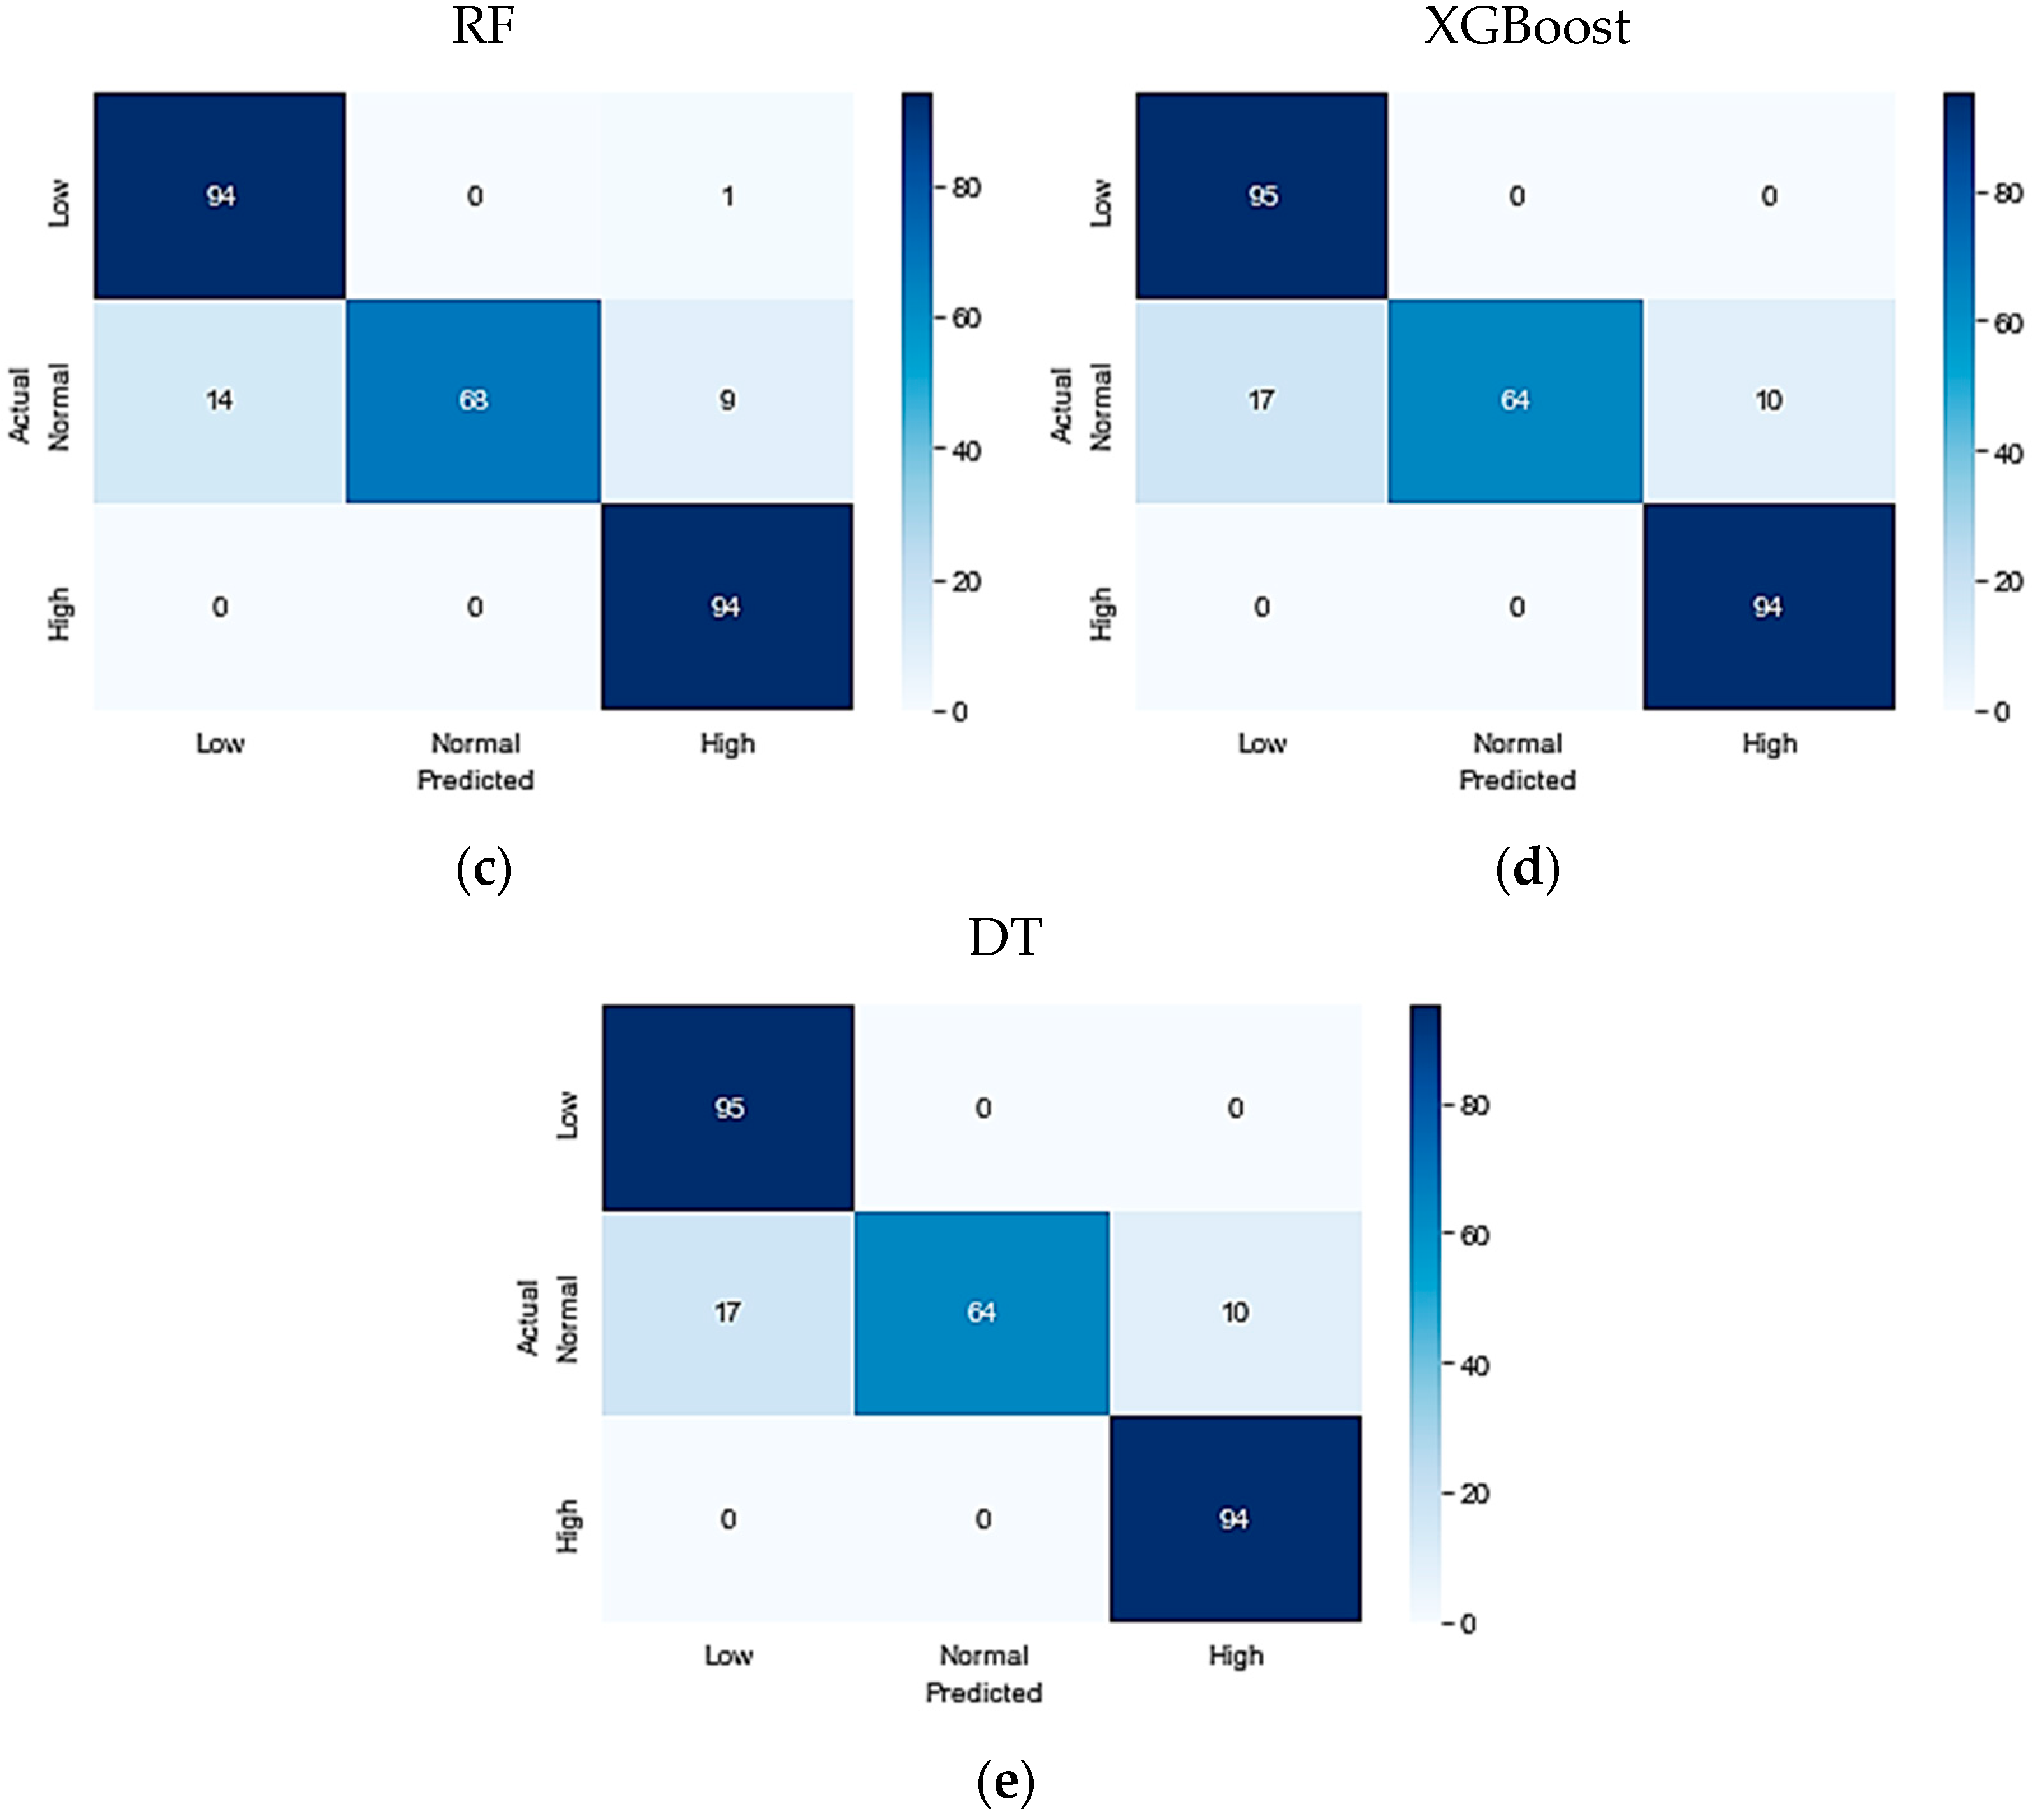
Table 7. On the KFUH dataset, the evaluation matrices revealed that the ET classifier outperformed the other four algorithms, achieving an accuracy, precision, recall, and F1-score of 98%. The LGBM classifier followed closely with an accuracy of 93%, precision of 94%, recall of 93%, and F1-score of 93%. Following that, the RF algorithm achieved an accuracy of 91%, a precision of 92%, recall of 91%, and F1-score of 91%. In contrast, the XGBoost model demonstrated a relatively lower performance, with an accuracy of 90%, precision of 92%, recall of 90%, and F1-score of 90%. Finally, the Decision Tree algorithm achieved the lowest performance, with an accuracy of 90.5%, precision of 91%, recall of 90%, and F1-score of 90%.
Figure 2 illustrates the confusion matrices for the optimized conducted models.
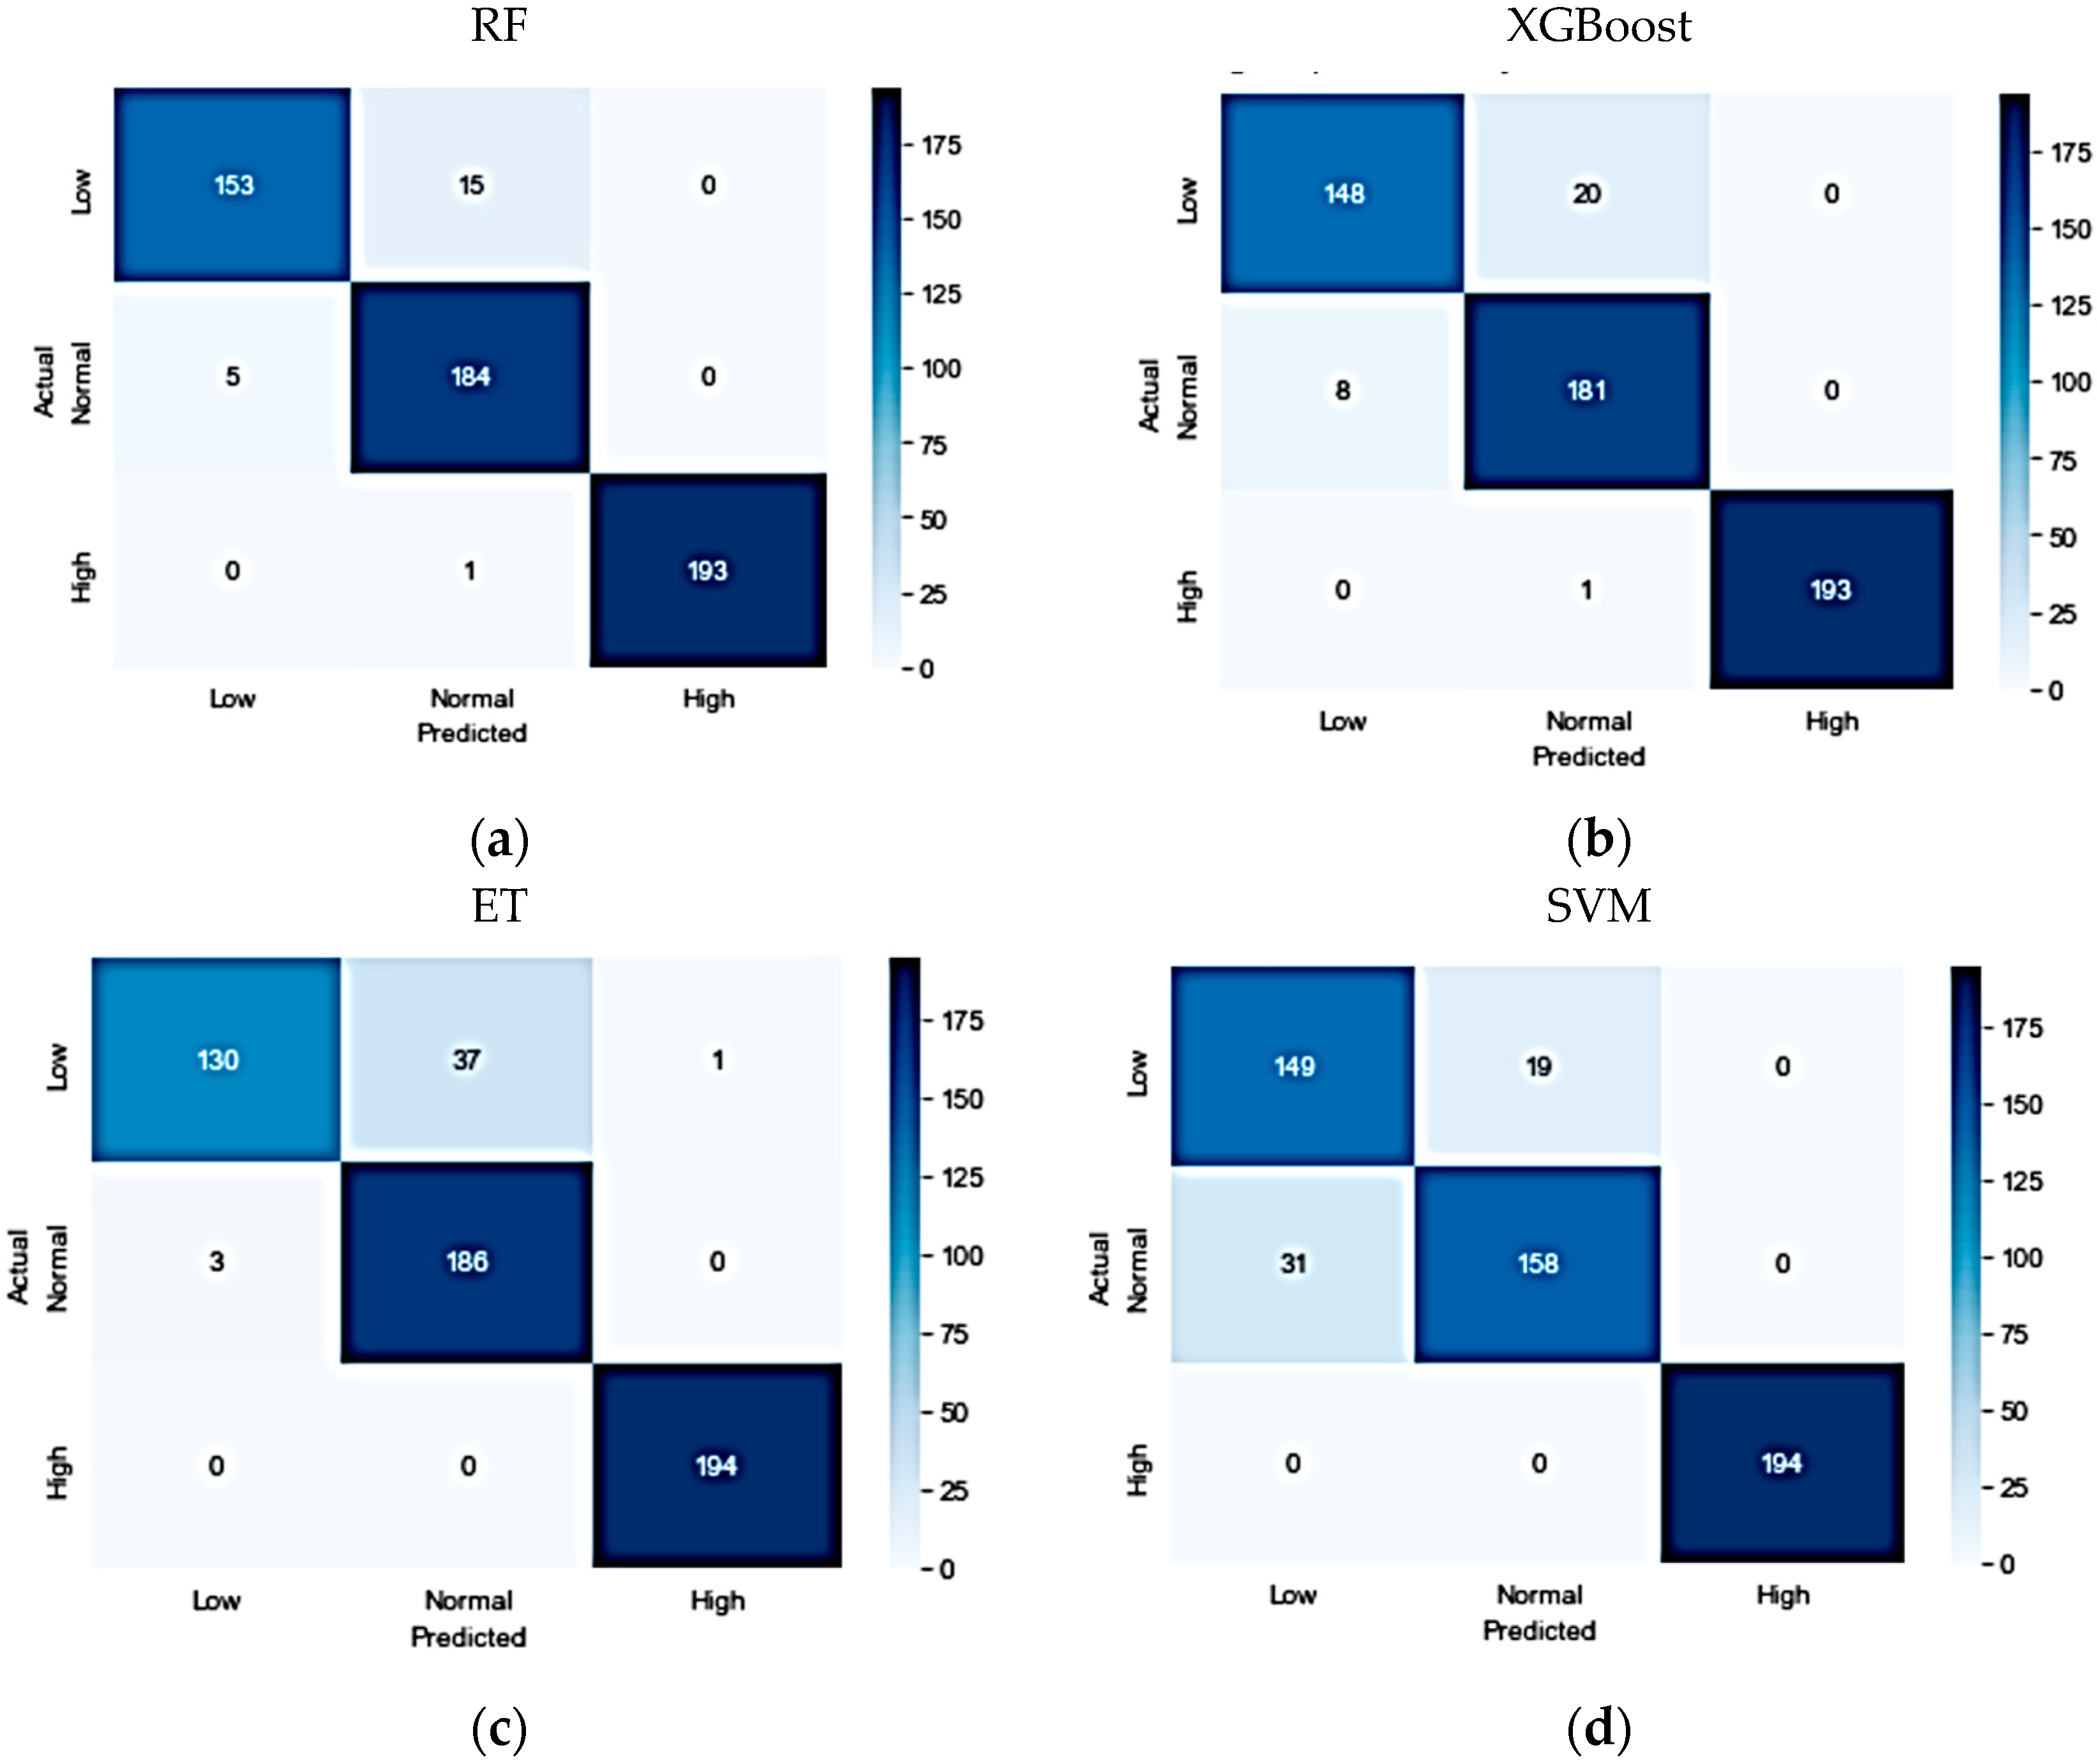
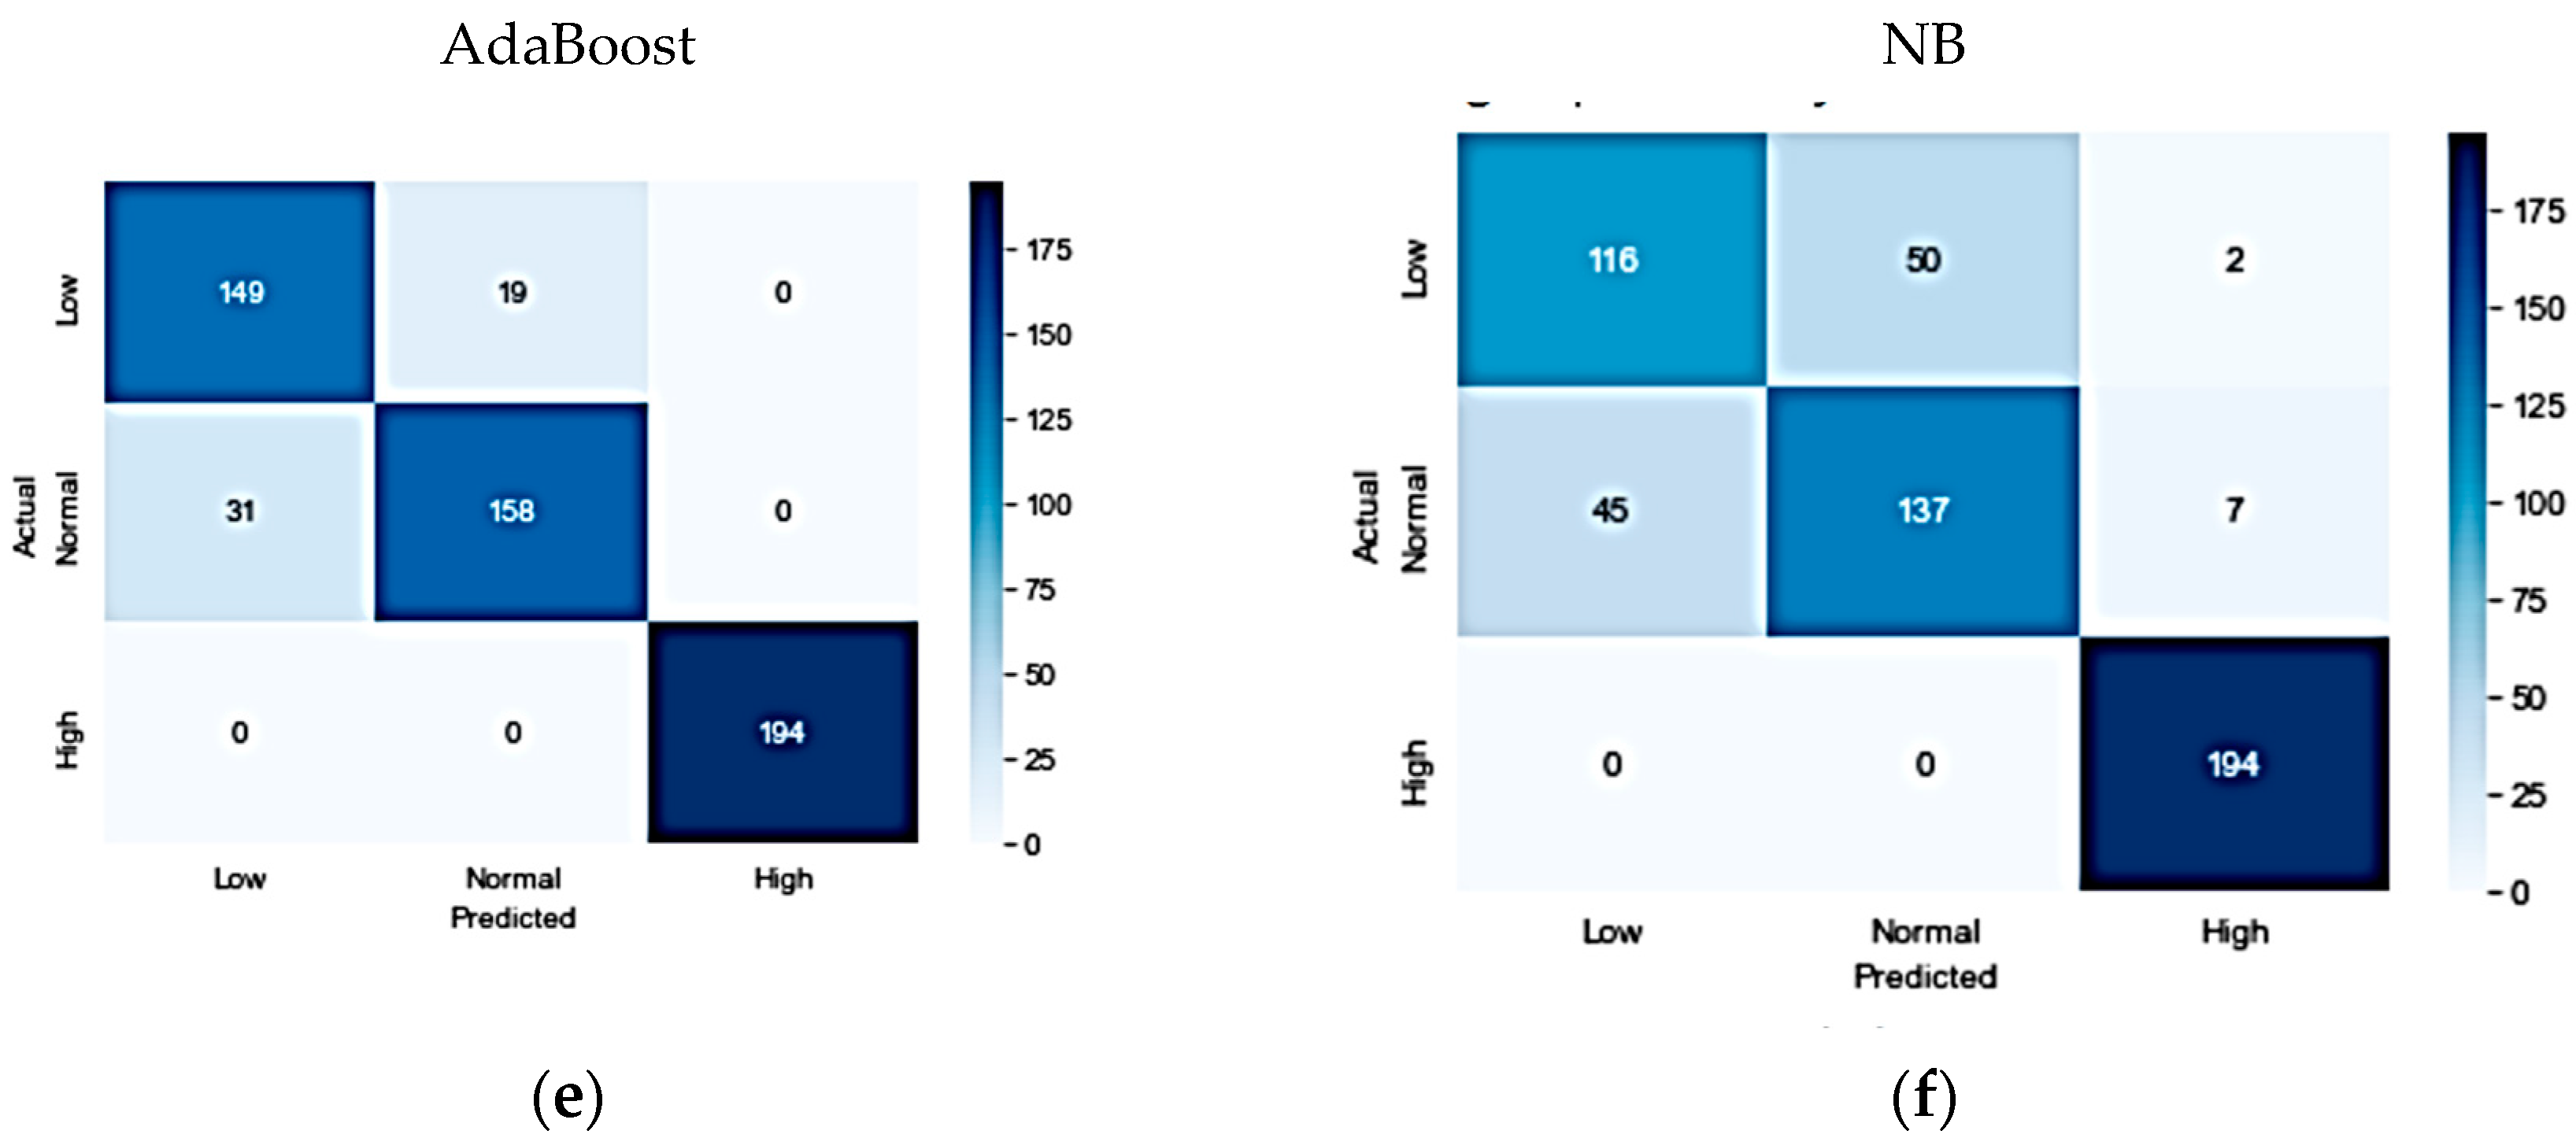
In experimenting with the IEEE dataset, six different algorithms were investigated. The results indicated that the RF classifier was the best-performing model, achieving an accuracy, precision, recall, and F1-score of 96%. The XGBoost model was a close second, achieving an accuracy, precision, recall, and F1-score of 95%. The ET classifier also demonstrated good performance, with an accuracy of 93%, precision of 93%, recall of 92%, and F1-score of 92%. However, the SVM, AdaBoost, and NB models had a lower performance compared to the other models. The confusion matrices for the optimized models are shown in
Figure 3.
Overall, the results showed that the ET classifier achieved the highest accuracy, precision, recall, and F1-score on the KFUH dataset, followed by the LGBM and RF algorithms. For the IEEE dataset, the RF classifier performed the best, followed closely by the XGBoost model and the ET classifier. The confusion matrices for the optimized models are presented for both datasets, providing a clear visualization of the models’ performance. Hence, this study showed promising results in using machine learning for fetal weight range classification, with potential applications in improving prenatal care and outcomes.
Explainable AI (XAI) and Shapley Additive Explanation (SHAP)
Explainable Artificial Intelligence (XAI) is a critical area of research in machine learning, aimed at providing insights into the inner workings of black box models. One of the most promising XAI techniques is the Shapley Additive Explanation (SHAP). SHAP is an approach that provides a unified explanation of the output of a model by attributing each feature’s importance to the final prediction [
43]. SHAP builds upon game theory concepts to provide explanations for individual predictions. By defining a “game” between a feature and a set of features, SHAP measures the contribution of each feature to the prediction. This approach allows for global and local feature importance measures, which can be used to understand how the model arrived at a particular decision. SHAP has been applied to a wide range of machine learning applications, from image classification to natural language processing. Its use has shown promising results in increasing the interpretability and trustworthiness of black box models. However, there are still challenges in applying SHAP to complex models, such as deep neural networks, due to the large number of features involved. Research in this area is ongoing to develop more efficient and scalable SHAP algorithms for such models [
44].
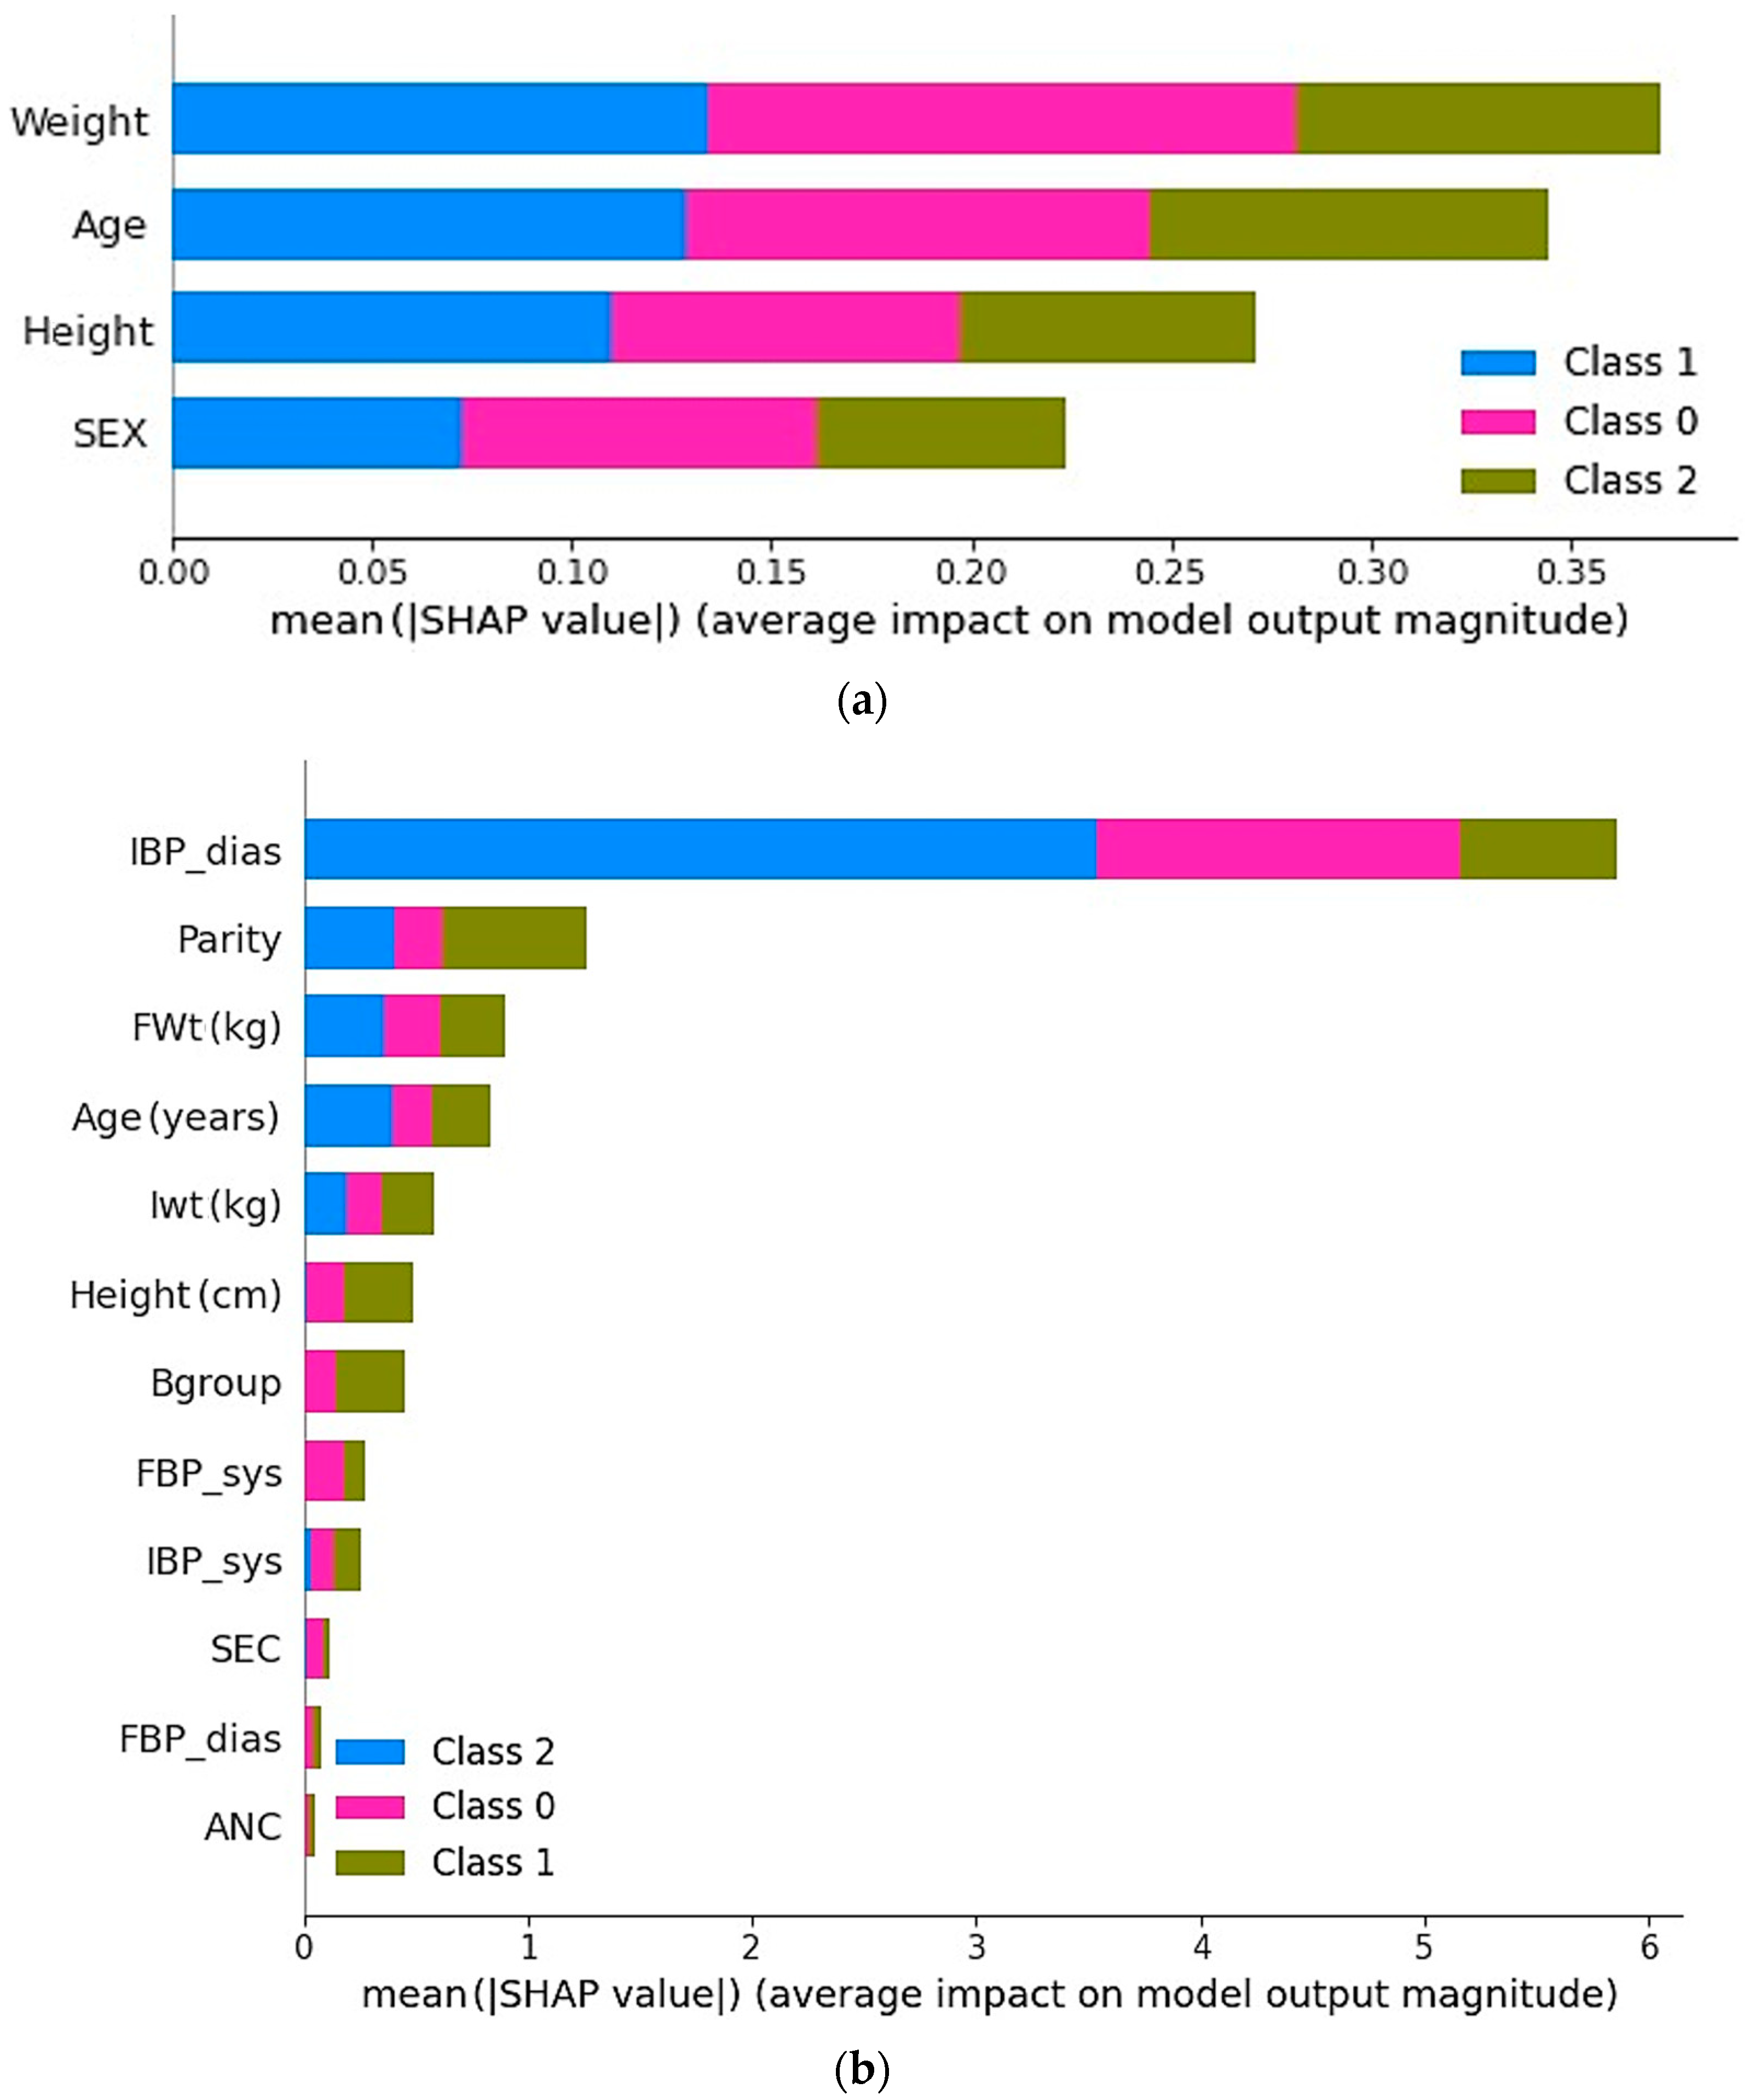
Figure 4 demonstrates the impact of selected features on the model performance for both the KFUH and IEEE datasets. As is evident from
Figure 4a, the selected features in the KFUH dataset have a significant impact on the model performance for all three classes when using the best-performing model, which is the Extra Trees algorithm, with mother weight as the most important feature that significantly affects the prediction. On the other hand,
Figure 4b presents feature impact in the IEEE dataset using the Random Forest classifier, and the most significant features in the model performance are the initial diastolic blood pressure (IBP-dia), number of previous pregnancies (Parity), and final weight of the mother (Fwt). Notably, Fwt is also the most important feature in the KFUH dataset, as the data were collected for women in their last month.
5. Discussion
Several studies have utilized ML methods to classify the weight of fetuses at birth, yielding promising results. However, these studies only differentiate between low and normal birth weights, while paying less attention to the potential risks associated with a high birth weight. Additionally, many of these successful studies have relied on ultrasound imaging, which necessitates a large sample size and a high cost, besides the expected errors associated with machine readings. The diagnostic imaging sector in Saudi Arabia was valued at USD 353.97 million in the base year and is expected to increase at a CAGR of 4.1% to reach USD 453.17 million by the end of the forecast period [
45]. As such, obtaining ultrasound images is both expensive and time-consuming. Therefore, it is necessary to develop an appropriate alternative model for classifying fetal weight at birth as an aid to ultrasound images, which would be less invasive and more cost-effective.
The main goal of this research was to develop an ML model capable of predicting fetal birth weight from clinical data collected from pregnant women. To achieve this, two datasets, the KFUH and IEEE datasets, were examined to identify the essential characteristics for effectively anticipating the weight range. Several ML algorithms were created and analyzed, and despite minor variations in their performance indicators, all the models exhibited similar levels of performance. However, the best model was the ET model, which obtained a 98% accuracy, precision, recall, and F1-score using 4 attributes on the KFUH dataset, while the IEEE dataset achieved a 96% accuracy, precision, recall, and F1-score using only 12 attributes with the RF model. The SHAP technique demonstrated that attributes such as age, weight, height, and sex had a significant influence on the model’s prediction.
The prediction of fetal weight at birth is based on the analysis of different characteristics of the fetus and mother. Some of the characteristics that are classified as the most important features include the sex of the fetus, the age of the mother, height, weight, and the length of the pregnancy [
46]. This research has shown that increasing the mother’s weight during pregnancy increases the weight of the fetus at birth. Besides, taller mothers tend to give birth to larger babies. Moreover, it turns out that the second most important feature is the age of the mother, because older mothers may give birth to heavier babies compared to younger mothers.
The consistency of the SHAP results with numerous other studies indicates the dependability of the proposed model. In addition, high weight was included in the classification of fetal weight along with low weight and normal weight, in contrast to previous studies. Moreover, unlike earlier literature studies, which relied on ultrasound imaging, this research centered on estimating fetal birth weight utilizing clinical data, thereby ensuring the model’s computational and budget-friendly aspects. Upcoming research will broaden the dataset’s scope by acquiring diverse maternal and fetal features and increasing the number of data points. This measure is intended to enhance the predictive capability of our proposed models for fetal birth weight classification.


 ,
, 
