Article

Overcoming Therapeutic Inertia in Type 2 Diabetes: Exploring Machine Learning-Based Scenario Simulation for Improving Short-Term Glycemic Control

1
AMD-AI National Group Coordinator Coordinator, UOS Integrating Primary and Specialist Care, ASST Nord Milano, Via Filippo Carcano 17, 20149 Milan, Italy
2
Mix-x Partner, Via Circonvallazione 5, 10015 Ivrea, Italy
3
Department of Experimental Medicine, Section of Medical Pathophysiology, Food Science and Endocrinology, Sapienza University of Rome, 00161 Rome, Italy
4
Diabetes and Endocrinology Unit, ASL Nord-West Tuscany, 54100 Massa Carrara, Italy
5
Diabetology Unit, Careggi Hospital, Largo G.A. Brambilla, 3, 50134 Florence, Italy
6
Diabetes and Endocrinology Unit, ASL TO5, 10023 Chieri, Italy
7
Diabetes and Endocrinology Unit, ASL SULCIS, 09016 Sulcis, Italy
8
Diabates and Nutrition UOC, S. Spirito Hospital—ASL Roma 1, 00913 Rome 00913, Italy
9
Rulex Innovation Labs, Rulex Inc., Via Felice Romani 9/2, 16122 Genoa, Italy
10
AMD Regional Past President, AI AMD National Group, 10090 Bruino, Italy
11
Diabetes and Metabolic Disease Unit ASL 4 Liguria, 16043 Chiavari, Italy
12
IRCCS Ospedale Galeazzi-Sant’Ambrogio, 20149 Milan, Italy
13
Department of Biomedical and Clinical Sciencies, University of Milan, 20157 Milan, Italy
14
Data Scientist Deimos, 33100 Udine, Italy
15
AMD Past President, Diabetes and Metabolic Diseases Unit, Nord-West Tuscany, Livorno Hospital, Viale Alfieri 36, 57124 Livorno, Italy
16
AMD New President, Azienda Sanitaria Universitaria Giuliano Isontina, 34128 Trieste, Italy
*
Author to whom correspondence should be addressed.
Mach. Learn. Knowl. Extr. 2024, 6(1), 420-434; https://doi.org/10.3390/make6010021
Submission received: 4 January 2024 / Revised: 7 February 2024 / Accepted: 10 February 2024 / Published: 14 February 2024

Abstract

:
Background: International guidelines for diabetes care emphasize the urgency of promptly achieving and sustaining adequate glycemic control to reduce the occurrence of micro/macrovascular complications in patients with type 2 diabetes mellitus (T2DM). However, data from the Italian Association of Medical Diabetologists (AMD) Annals reveal that only 47% of T2DM patients reach appropriate glycemic targets, with approximately 30% relying on insulin therapy, either solely or in combination. This artificial intelligence analysis seeks to assess the potential impact of timely insulin initiation in all eligible patients via a “what-if” scenario simulation, leveraging real-world data. Methods: This retrospective cohort study utilized the AMD Annals database, comprising 1,186,247 T2DM patients from 2005 to 2019. Employing the Logic Learning Machine (LLM), we simulated timely insulin use for all eligible patients, estimating its effect on glycemic control after 12 months within a cohort of 85,239 patients. Of these, 20,015 were employed for the machine learning phase and 65,224 for simulation. Results: Within the simulated scenario, the introduction of appropriate insulin therapy led to a noteworthy projected 17% increase in patients meeting the metabolic target after 12 months from therapy initiation within the cohort of 65,224 individuals. The LLM’s projection envisages 32,851 potential patients achieving the target (hemoglobin glycated < 7.5%) after 12 months, compared to 21,453 patients observed in real-world cases. The receiver operating characteristic (ROC) curve analysis for this model demonstrated modest performance, with an area under the curve (AUC) value of 70.4%. Conclusions: This study reaffirms the significance of combatting therapeutic inertia in managing T2DM patients. Early insulinization, when clinically appropriate, markedly enhances patients’ metabolic goals at the 12-month follow-up.

1. Introduction

The prevalence of type 2 diabetes mellitus (T2DM) is a mounting concern, placing significant strain on healthcare systems and providers [1,2]. Despite notable progress in T2DM management and the availability of novel and highly effective therapies, a considerable gap persists between guideline recommendations and the real-world outcomes observed in everyday clinical practice. The Association of Medical Diabetologists (AMD) Annals Study Group publishes annually the results of analyses providing insights into the diabetes landscape in Italy based on data collected from electronic medical records of all patients treated in 271 Italian diabetes clinics between 2005 and 2019.
A recent update from the AMD Annals Study Group reveals that approximately half of individuals with T2DM maintain glycosylated hemoglobin (HbA1c) values lower than 7.0%. Conversely, a noteworthy 17.8% of patients exhibit HbA1c levels exceeding 8.0%. Intriguingly, only 32.3% of these patients are currently undergoing insulin treatment, either as a sole intervention or in conjunction with oral agents and/or Glucagon-Like Peptide-1 Receptor Agonists (GLP1-RAs) [3]. A recent meta-analysis evaluated the overall achievement of the targets recommended by the American Diabetes Association (ADA), the European Association for the Study of Diabetes (EASD), and the National Institute for Health and Care Excellence (NICE) for T2DM. The authors reported that recommended glycemic control is achieved in 42.8% of patients and that despite the continuous updating, promotion, and dissemination of evidence-based guidelines, there has not been a concurrent improvement in reaching glycemic targets [4]. Therefore, it is crucial to prioritize timely, evidence-based, and safe management of hyperglycemia in addressing T2DM to reduce the prevalence of both immediate and long-term complications of this widespread and severe condition. Early therapeutic inertia diminishes the likelihood of achieving glycemic targets as the disease advances [5,6] and also deprives individuals of a well-documented legacy effect according to which the early attainment of glycemic goals has a positive impact on reducing the development and progression of complications even decades later [7]. In particular, the inadequate control of glycemia often stems from two key factors: patients’ inconsistent adherence to prescribed medications and clinicians’ reluctance to initiate or escalate glucose-lowering treatments, even when clinically warranted—commonly referred to as “therapeutic inertia” [8]. This inertia is widespread, impacting up to 50% of individuals diagnosed with T2DM [9]. Another recent study involving over 100,000 individuals diagnosed with T2DM reported that therapeutic inertia was present in 26% of the cases [10] and is influenced by various barriers at the levels of clinicians, patients, and healthcare systems. Addressing therapeutic inertia is a central priority to mitigate the impact of T2DM and its associated complications [11]. This inertia is observed in different healthcare settings, from primary care to specialized diabetes clinics. The complex interplay of factors contributing to therapeutic inertia involves aspects related to health care providers, patients, and the health care system in general. Numerous studies have delved into comprehending the underlying reasons and associated factors contributing to therapeutic inertia, as highlighted in a recent review and meta-analysis [12]. Factors contributing to health care providers’ therapeutic inertia include lack of awareness of or adherence to clinical guidelines, concerns about potential side effects of intensified treatments, and difficulties communicating with patients about treatment goals. In addition, time constraints, competing clinical priorities, and gaps in the implementation of evidence-based practices further exacerbate the problem. Attempts have also been made to estimate its impact in terms of economic consequences and its effect on individuals’ health [13]. However, to our knowledge, no scenario simulations based on real-world data have been conducted so far to estimate the potential impact on glycemic targets that would result from timely intervention in insulin therapy application, where clinically appropriate. Since 2005, AMD has diligently collected patient data via electronic medical records known as the AMD Annals. This initiative aims to monitor and improve the quality of care for patients with T2DM. As of today, this network encompasses 271 clinics, constituting about half of the diabetes treatment centers in Italy, and gathers clinical information collected over 12 years, as previously discussed [3].
Using this wealth of information, we sought to estimate the clinical benefit of overcoming therapeutic inertia. In particular, we aimed to assess via a machine learning-based “what-if” scenario simulation applied to real data from the AMD Annals what the potential improvement in glycemic target via the adoption of timely insulin therapy would be.
Simulation, particularly in the form of “what-if” scenarios or “counterfactual explanations”, is a powerful tool used across various fields to explore hypothetical situations and their potential outcomes. These tools consist of a specific approach used in the context of explaining machine learning models by highlighting alternative scenarios that could have led to different predictions. In essence, a “what-if” scenario simulation involves creating a virtual environment or model where key variables are manipulated to observe the resulting changes. This methodology is valuable in gaining insights into complex systems, testing hypotheses, and making informed decisions without real-world consequences. In healthcare, “what-if” scenario simulations are employed to model the potential impact of different interventions, treatment strategies, or public health measures, as recently reported in a work by Del Ser et al. [14]. Researchers and policymakers can use simulations to project the consequences of policy changes, the introduction of new medications, or the implementation of preventive measures on disease prevalence and healthcare outcomes.

2. Materials and Methods

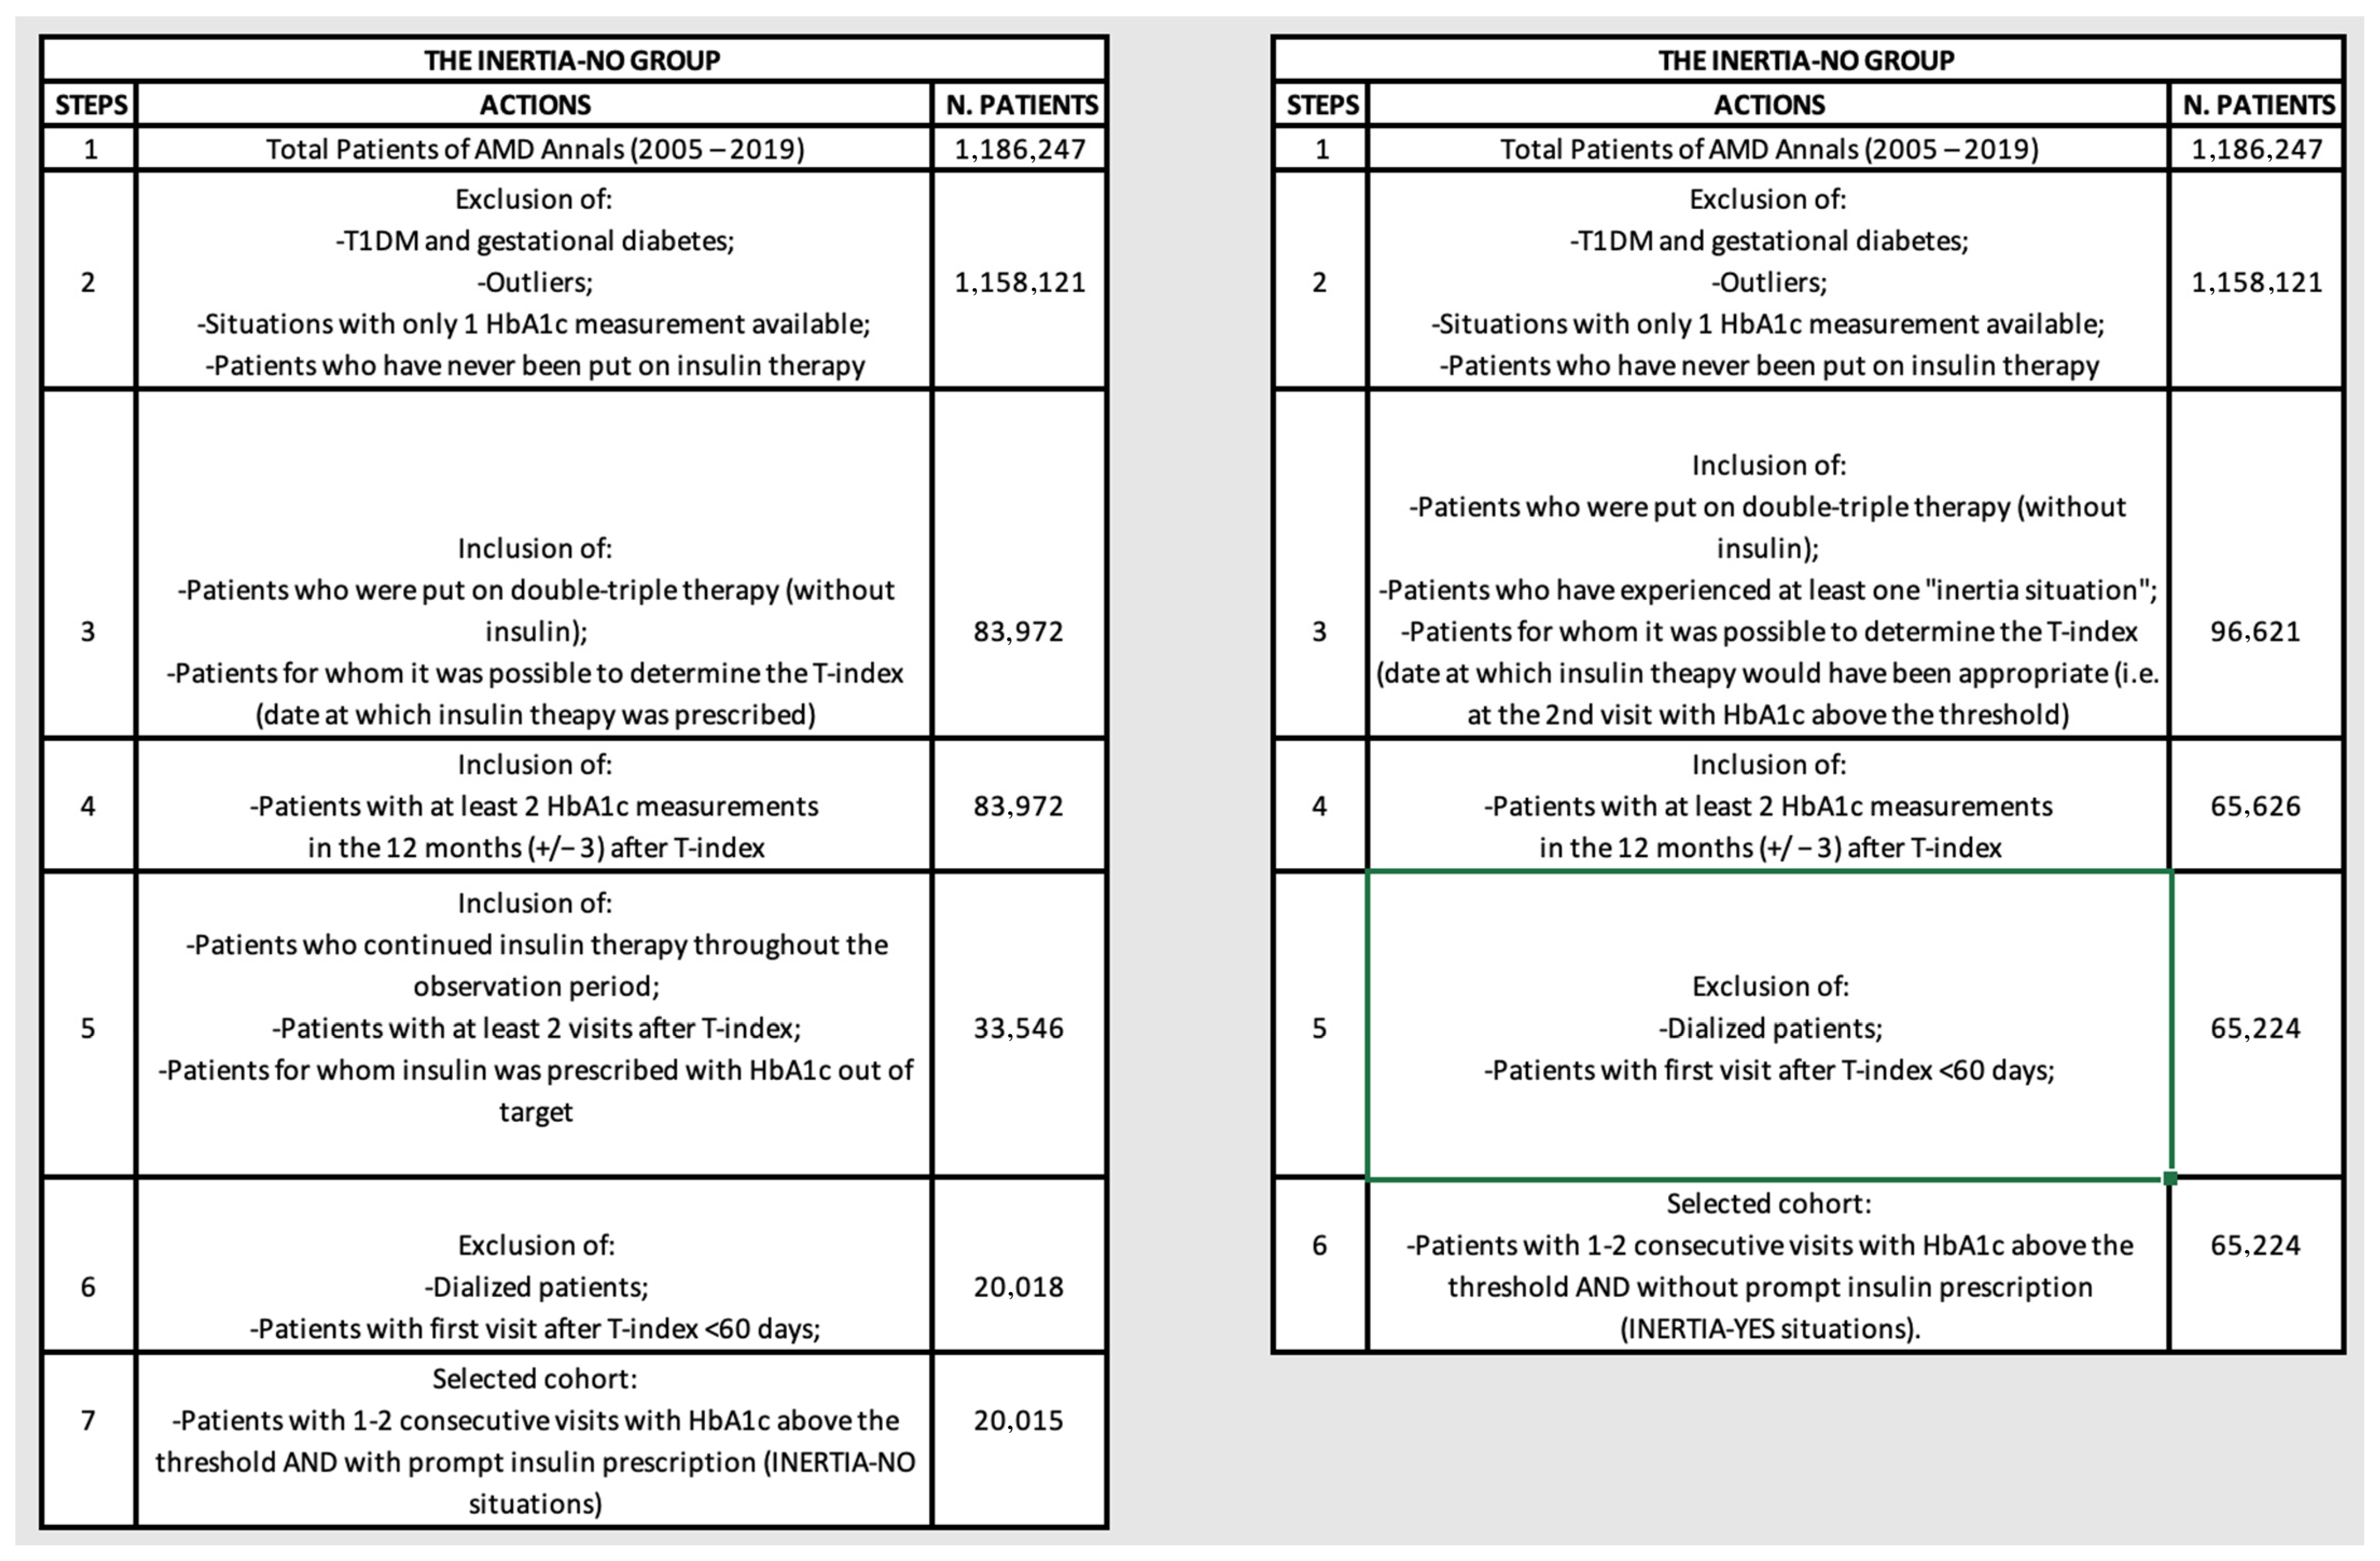
2.1. Study Design and Eligibility Criteria

This is an observational, longitudinal, retrospective study based on data contained in the AMD Annals database (2005–2019). Data were obtained from 9,954,976 consultations in 1,186,247 patients diagnosed with T2DM, corresponding to 1.3 billion data points. This constitutes pre-existing data that did not necessitate the direct involvement of patients. Patient data were anonymized and stored with coded identifiers. All participating diabetes centers obtained the authorization of local Ethics Committees.

2.1.1. Inclusion Criteria

In our machine learning analysis, we designated “inert behavior” as instances where patients were receiving dual or triple therapy (considered as the second or third line of intervention for T2DM) and exhibited an HbA1c level exceeding 7.5% (58.5 mmol/mol) for at least two consecutive visits, with no therapy modification at the second visit. This classification led us to create two patient subgroups: the “Inertia-NO” group, which included patients promptly prescribed insulin therapy, and the “Inertia-YES” group, comprising patients experiencing medical inert behavior concerning insulin prescription. Specifically, patients in the “Inertia-NO” group were all subjects in the AMD database with T2DM who met the following criteria: patients who were currently on dual or triple therapy had either one or two consecutive HbA1c measurements above the threshold of 7.5% (58.5 mmol/mol) [or above 8% (63.9 mmol/mol) if the patient was older than 75] and were subsequently prescribed insulin therapy (basal, basal–bolus, or rapid) after either the first or second measurement surpassing the threshold (defined as the T-index moment for the Inertia-NO group, i.e., the moment in which insulinization occurred).
Conversely, patients in the “Inertia-YES” group included all subjects with T2DM with the following inclusion criteria: being on dual or triple therapy, exhibiting two consecutive measurements surpassing the defined HbA1c threshold, and not being promptly prescribed insulin therapy (basal, basal–bolus, or rapid) after the second measurement exceeding the threshold, yet faced delays in its initiation, resulting in a prescription issued at a later stage [15] (defined as the T-index moment for the Inertia-YES group, i.e., the moment when it would have been appropriate to use insulin, but, having not been carried out, a situation of therapeutic inertia was established). Finally, for both groups, Inertia-NO and Inertia-YES, the included patients were those for whom there was a sufficient observation period of 12 months to assess the achievement of the desired therapeutic outcome, as detailed in the study flowchart (Figure 1).

2.1.2. Exclusion Criteria

The study did not include individuals who met any of the following criteria: patients with only one HbA1c measurement and/or outliers with abnormal HbA1c values (<4.5%, 26 mmol/mol OR >14%, 130 mmol/mol) and/or patients who were never insulinized and/or dialyzed patients and/or pregnant women.

2.2. Database Description

The AMD Annals database included records of 92 distinct variables (see Table S1 in Supplementary Materials), covering a wide range of aspects. These encompassed biochemical parameters linked to glucose and lipid metabolism, specifics regarding prescribed statin and antidiabetic treatments, as well as clinical, anthropometric, organizational, and therapeutic factors. The database also incorporates the Q-Score, an indirect indicator of the overall healthcare quality at each diabetic center. This score is derived from the achievement rate of specific targets (such as HbA1c, blood pressure, low-density lipoprotein cholesterol (LDL-C), and microalbuminuria), coupled with the appropriateness of prescription rates [16,17].

2.3. Machine Learning Analysis

2.3.1. General Criteria

Via a “what-if” scenario simulation, this analysis aims to assess the potential impact on glycemic compensation if insulinization consistently occurred promptly, indicating the absence of inert behaviors (Inertia-NO). The simulation employs the temporal marker “T-index”, corresponding to the baseline timepoint in which insulin-based therapeutic intervention occurs for “Inertia-NO” cases or the second consecutive HbA1c measurement surpassing the threshold without therapeutic intervention for “Inertia-YES” cases. It is crucial to note that, in addition to timely treatment for decompensated patients, various other factors, if managed appropriately, can contribute to achieving the metabolic target. Examples include physician factors such as patient education, proper titration, patient-centered care, and follow-up visits, as well as patient factors such as therapy adherence, self-monitoring, and adopting a healthy lifestyle [18,19,20,21,22].
Nevertheless, it is important to clarify that this analysis specifically aimed to assess the potential benefit achievable exclusively by focusing on treatment timing, i.e., clinical inertia, without taking into account these other factors.

2.3.2. Definition of the Outcomes

The objective of this analysis is to estimate the proportion of patients likely to achieve the glycemic target within one year following the T-index if no inert behavior is observed and insulin is promptly prescribed when clinically appropriate. This target, known as “1Y Target”, is considered achieved (“1Y–Target–YES”) when the average of the last two HbA1c values is equal or below 7.5% (58.5 mmol/mol) for patients aged 75 or younger and below 8% (63.9 mmol/mol) for those over 75. In fact, the American Diabetes Association (ADA) recommends different HbA1c targets for older adults. As of 2016, the ADA lowered HbA1c treatment goals to <7.5% for patients younger than 75 years and to <8.0% for patients older than 75 years [23]. In addition, estimates of insulin requirements are reduced by 39.4% when using HbA1c targets at 8% for people aged 75 years and older [24].
The decision to set the 12-month measurement timeframe was guided by the average frequency of patient visits to Italian diabetes centers, typically fewer than 2 visits per year. Despite guidelines recommending more frequent check-ups for many patients, limitations in the healthcare system’s organization restrict the average visit frequency [25].
Consequently, our assessment focused on measuring therapy change outcomes within these practical timeframes. Further details are provided in Figure 2.

2.3.3. Logic Learning Machine Characteristics

In this investigation, Rulex®, an exclusive artificial intelligence (AI) algorithm developed by Innovation Lab, Rulex Analytics, was employed. The Rulex® Logic Learning Machine (LLM) implements the Switching Neural Network method within supervised data mining, and previous analyses have consistently demonstrated LLM’s superior performance in accuracy compared to other ML algorithms [26]. However, it should be noted that in our prior publication, the support vector machine (SVM) achieved similar results in terms of performance compared to LLM. Nevertheless, the advantages of using LLM over an SVM include, among others, the possibility of better interpretability with decision rules expressed as logical expressions, more effective handling of nonlinear relationships between variables, intrinsic selection of rule-forming features, transparent model structure, robustness in handling missing data, and the possibility of incorporating prior knowledge or domain expertise. One of the distinct advantages of LLM over conventional tools for supervised data analysis is its capacity to unveil straightforward and easily understandable rules, even for individuals lacking specific statistical or mathematical expertise. In contrast to numerous “black-box” AI algorithms, Rulex® stands out for its transparent and explainable nature. It inherently generates variable rankings and explicit threshold values, obviating the necessity for supplementary software such as the Shapley additive explanations algorithm. Specifically, Rulex® addresses classification problems by formulating rules in the “if premise … then consequence …” structure, where “premise” comprises conditional clauses on input variables and “consequence” denotes the outcome of the target function. Leveraging “Shadow Clustering”, the algorithm aggregates patterns belonging to the same output class during iterations to construct the final model. Operating without prior knowledge, the LLM constructs models by selecting the most relevant variables to elucidate an initial premise.
From a methodological point of view, as described in one of our previous articles [26], we detail below the system used by our LLM for variable selection via rule construction. A defined set of quality measures governs each rule generated by Rulex®, encompassing metrics like the covering (proportion of correct classifications, denoted as C(r)) and false positive fraction (E(r)). For a binary classification task, C(r) corresponds to either sensitivity or specificity based on the identified class by the rule r. Let r’ denote the rule obtained from r by eliminating the condition c from its premise. The relevance of this condition is measured by R(c), where R c = Δ E c C r E ( r ) .
Here, Δ E   c = E r E ( r ) . Subsequently, the relevance Rv(xj) for each variable xj is determined by applying the following equation: R v ( x j ) = 1 k ( 1 R ( c k , j ) ) .
Here, k varies across the indices of rules rk that include a condition ckl on the variable xj. As a practical guideline, Rv(xj) ≤ 10% is employed to identify a predictor xj, offering a marginal contribution to the accuracy of LLM classifiers. Additionally, a rule with C(r)(1 − E(r)) ≤ 10% is often indicative of subjects with anomalous values, suggesting potential outliers.
The primary phases of the Rulex® data analysis encompass the following:
(1)
Training phase: starting from the input variables, LLM technology builds a model composed of a set of intelligible rules employing 70% of the available data.
(2)
Validation phase: assessment of the model’s performance using the remaining 30% of data, computing metrics including sensitivity, specificity, precision, accuracy, and the ROC-AUC are calculated.
(3)
Feature ranking creation: the LLM automatically identifies and transparently produces a ranking of the most pertinent variables explaining the initial premise.
(4)
Display of threshold values: the LLM explicitly indicates threshold values for the variables selected in the feature ranking.
(5)
Prediction: In addition to delivering outcome-related responses, the model elucidates the rationale behind predictions, considering specific variables characterizing the individual. For instance: For a given patient, the likelihood of achieving a certain target is influenced by a set of specific factors.

2.3.4. How LLM Has Been Used for the Scenario Simulation What-If Analysis

Using the Logic Learning Machine (LLM), we conducted a learning and modeling process to pinpoint, at T-Index, the distinctive combinations of characteristics associated with the absence of therapeutic inertia, which could either facilitate or hinder the achievement of the desired outcome (1Y Target).
Following this, in the scenario simulation, for patients belonging to the “Inertia-YES” group, insulin prescription was enforced at the second visit, where HbA1c surpassed the threshold. Subsequently, the previously developed model was applied to this dataset, simulating a scenario without inert behaviors. This process enabled the LLM to provide predictions, explicitly indicating which patients could have achieved the desired outcome if timely therapeutic measures had been taken. For a more detailed explanation of LLM’s role in the what-if analysis, please refer to Figure S1 in the Supplementary Materials.

3. Results

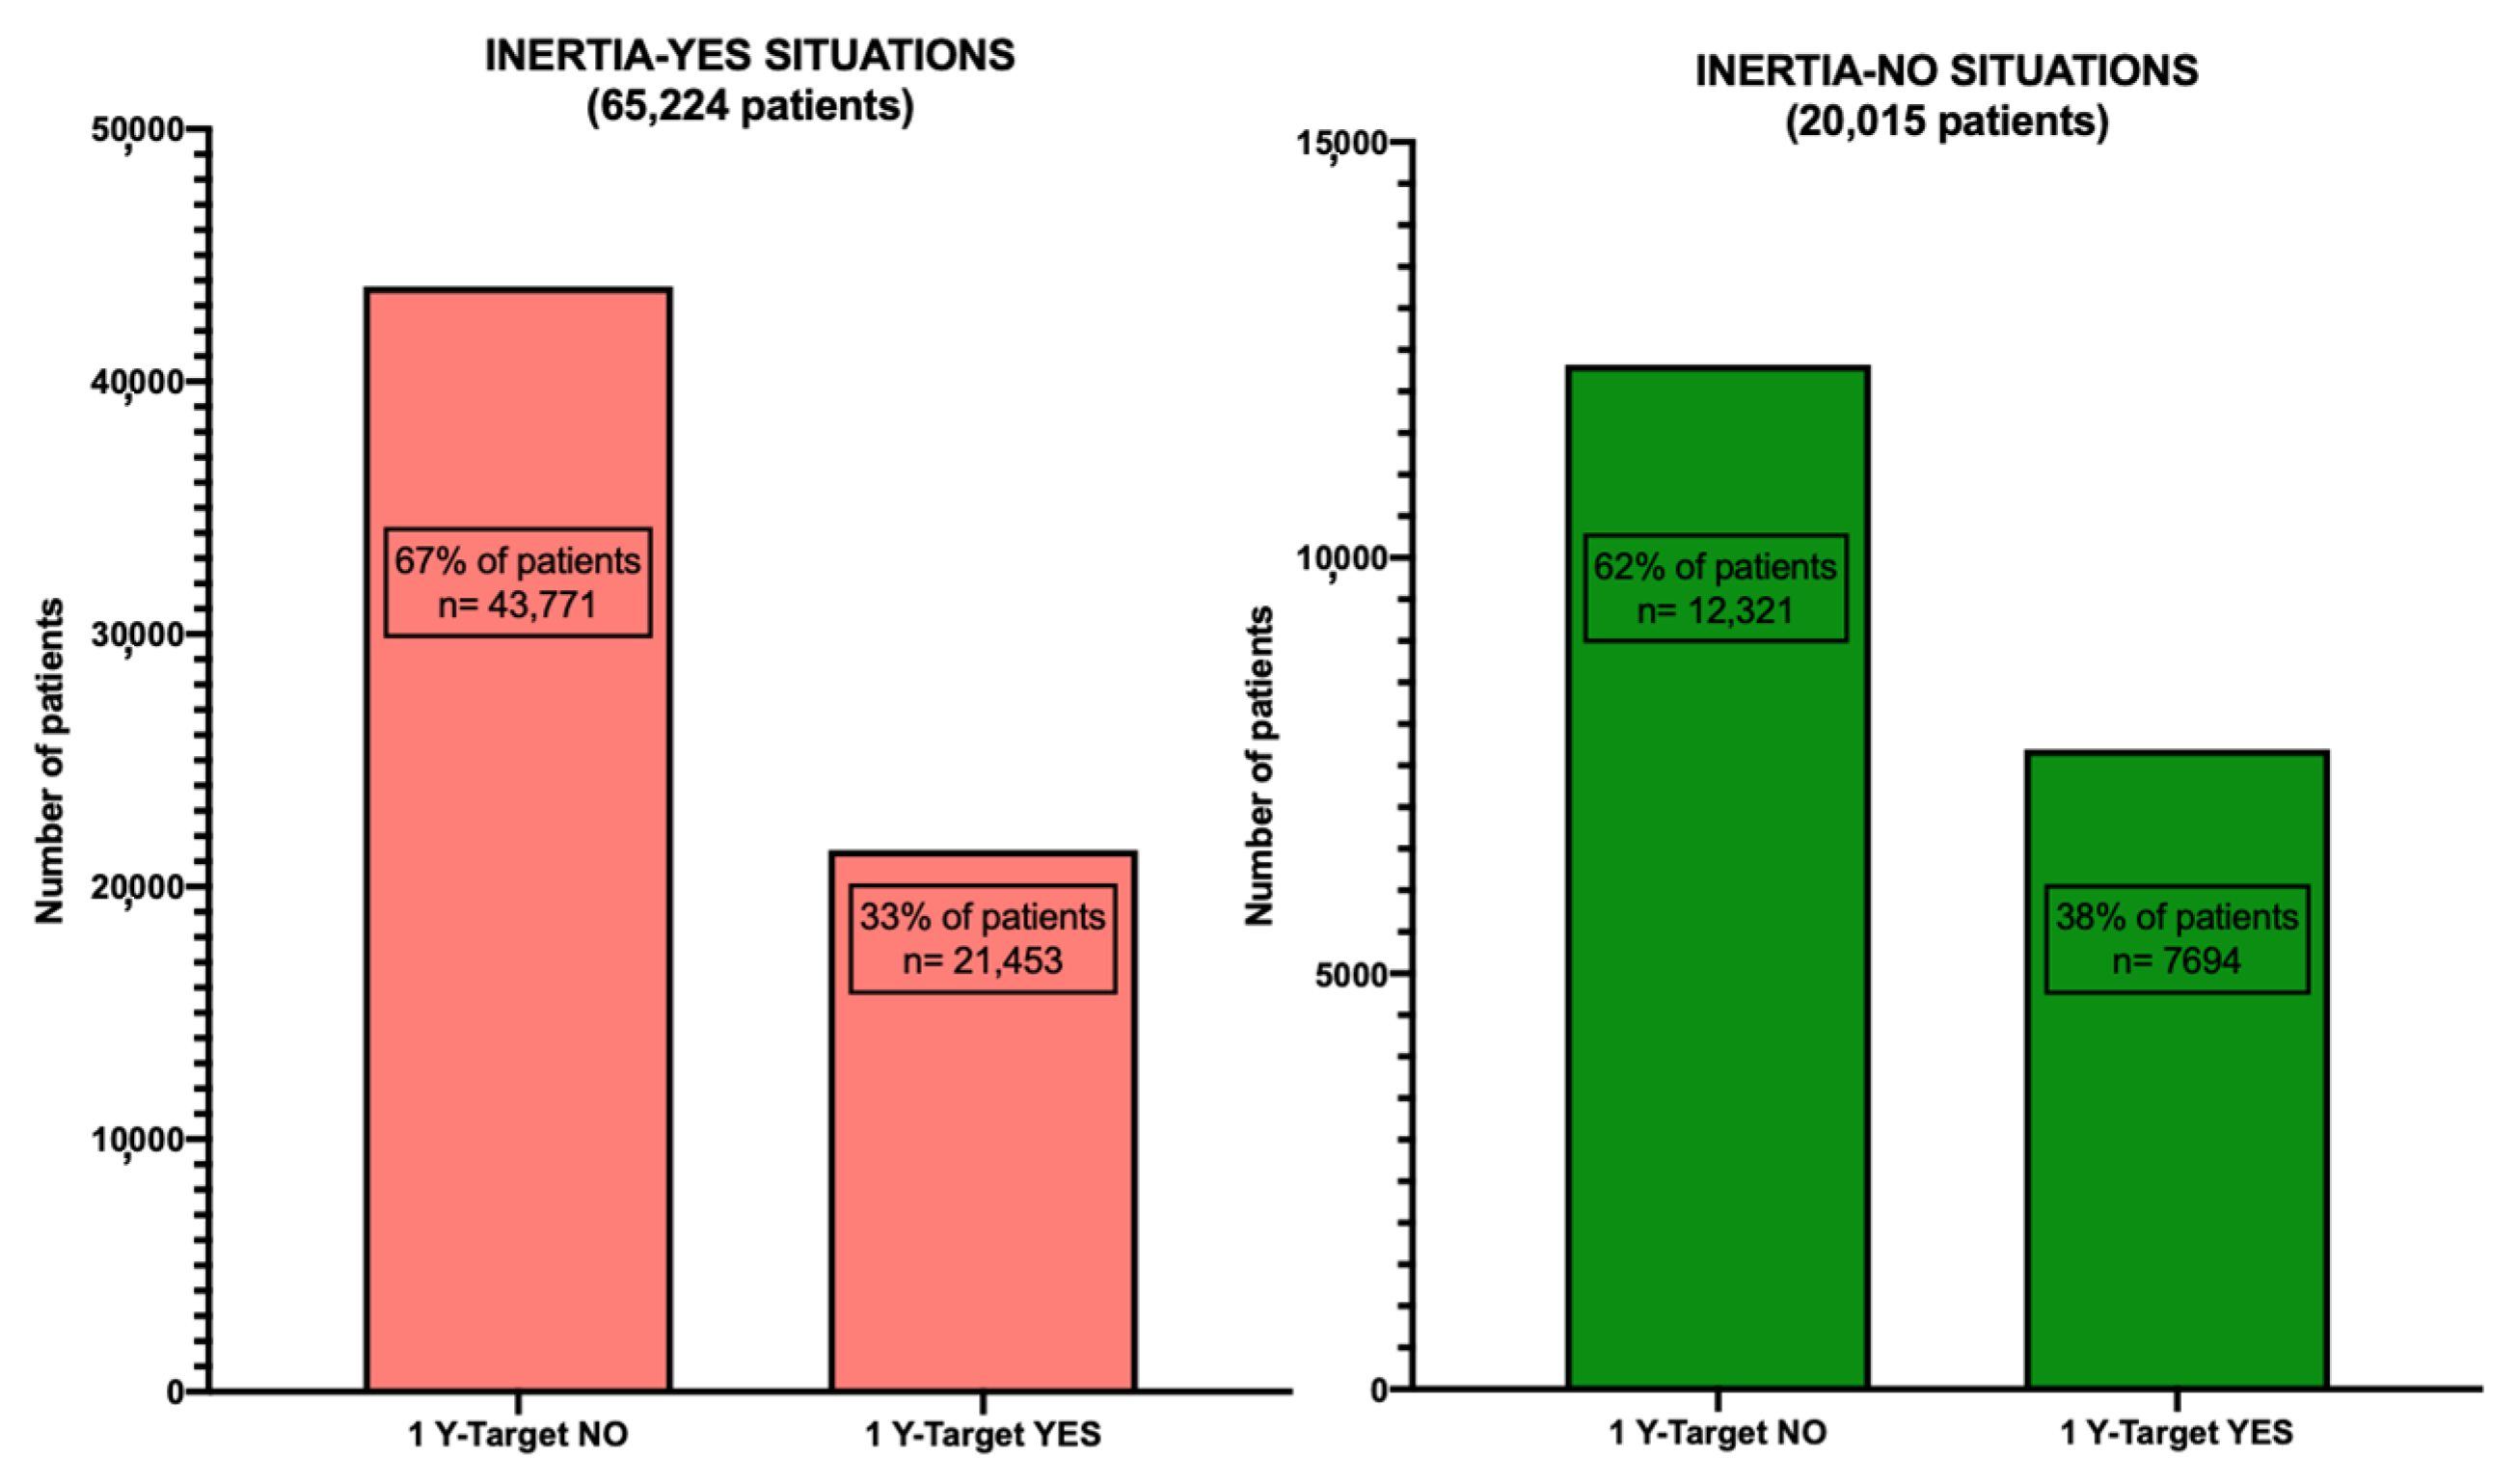
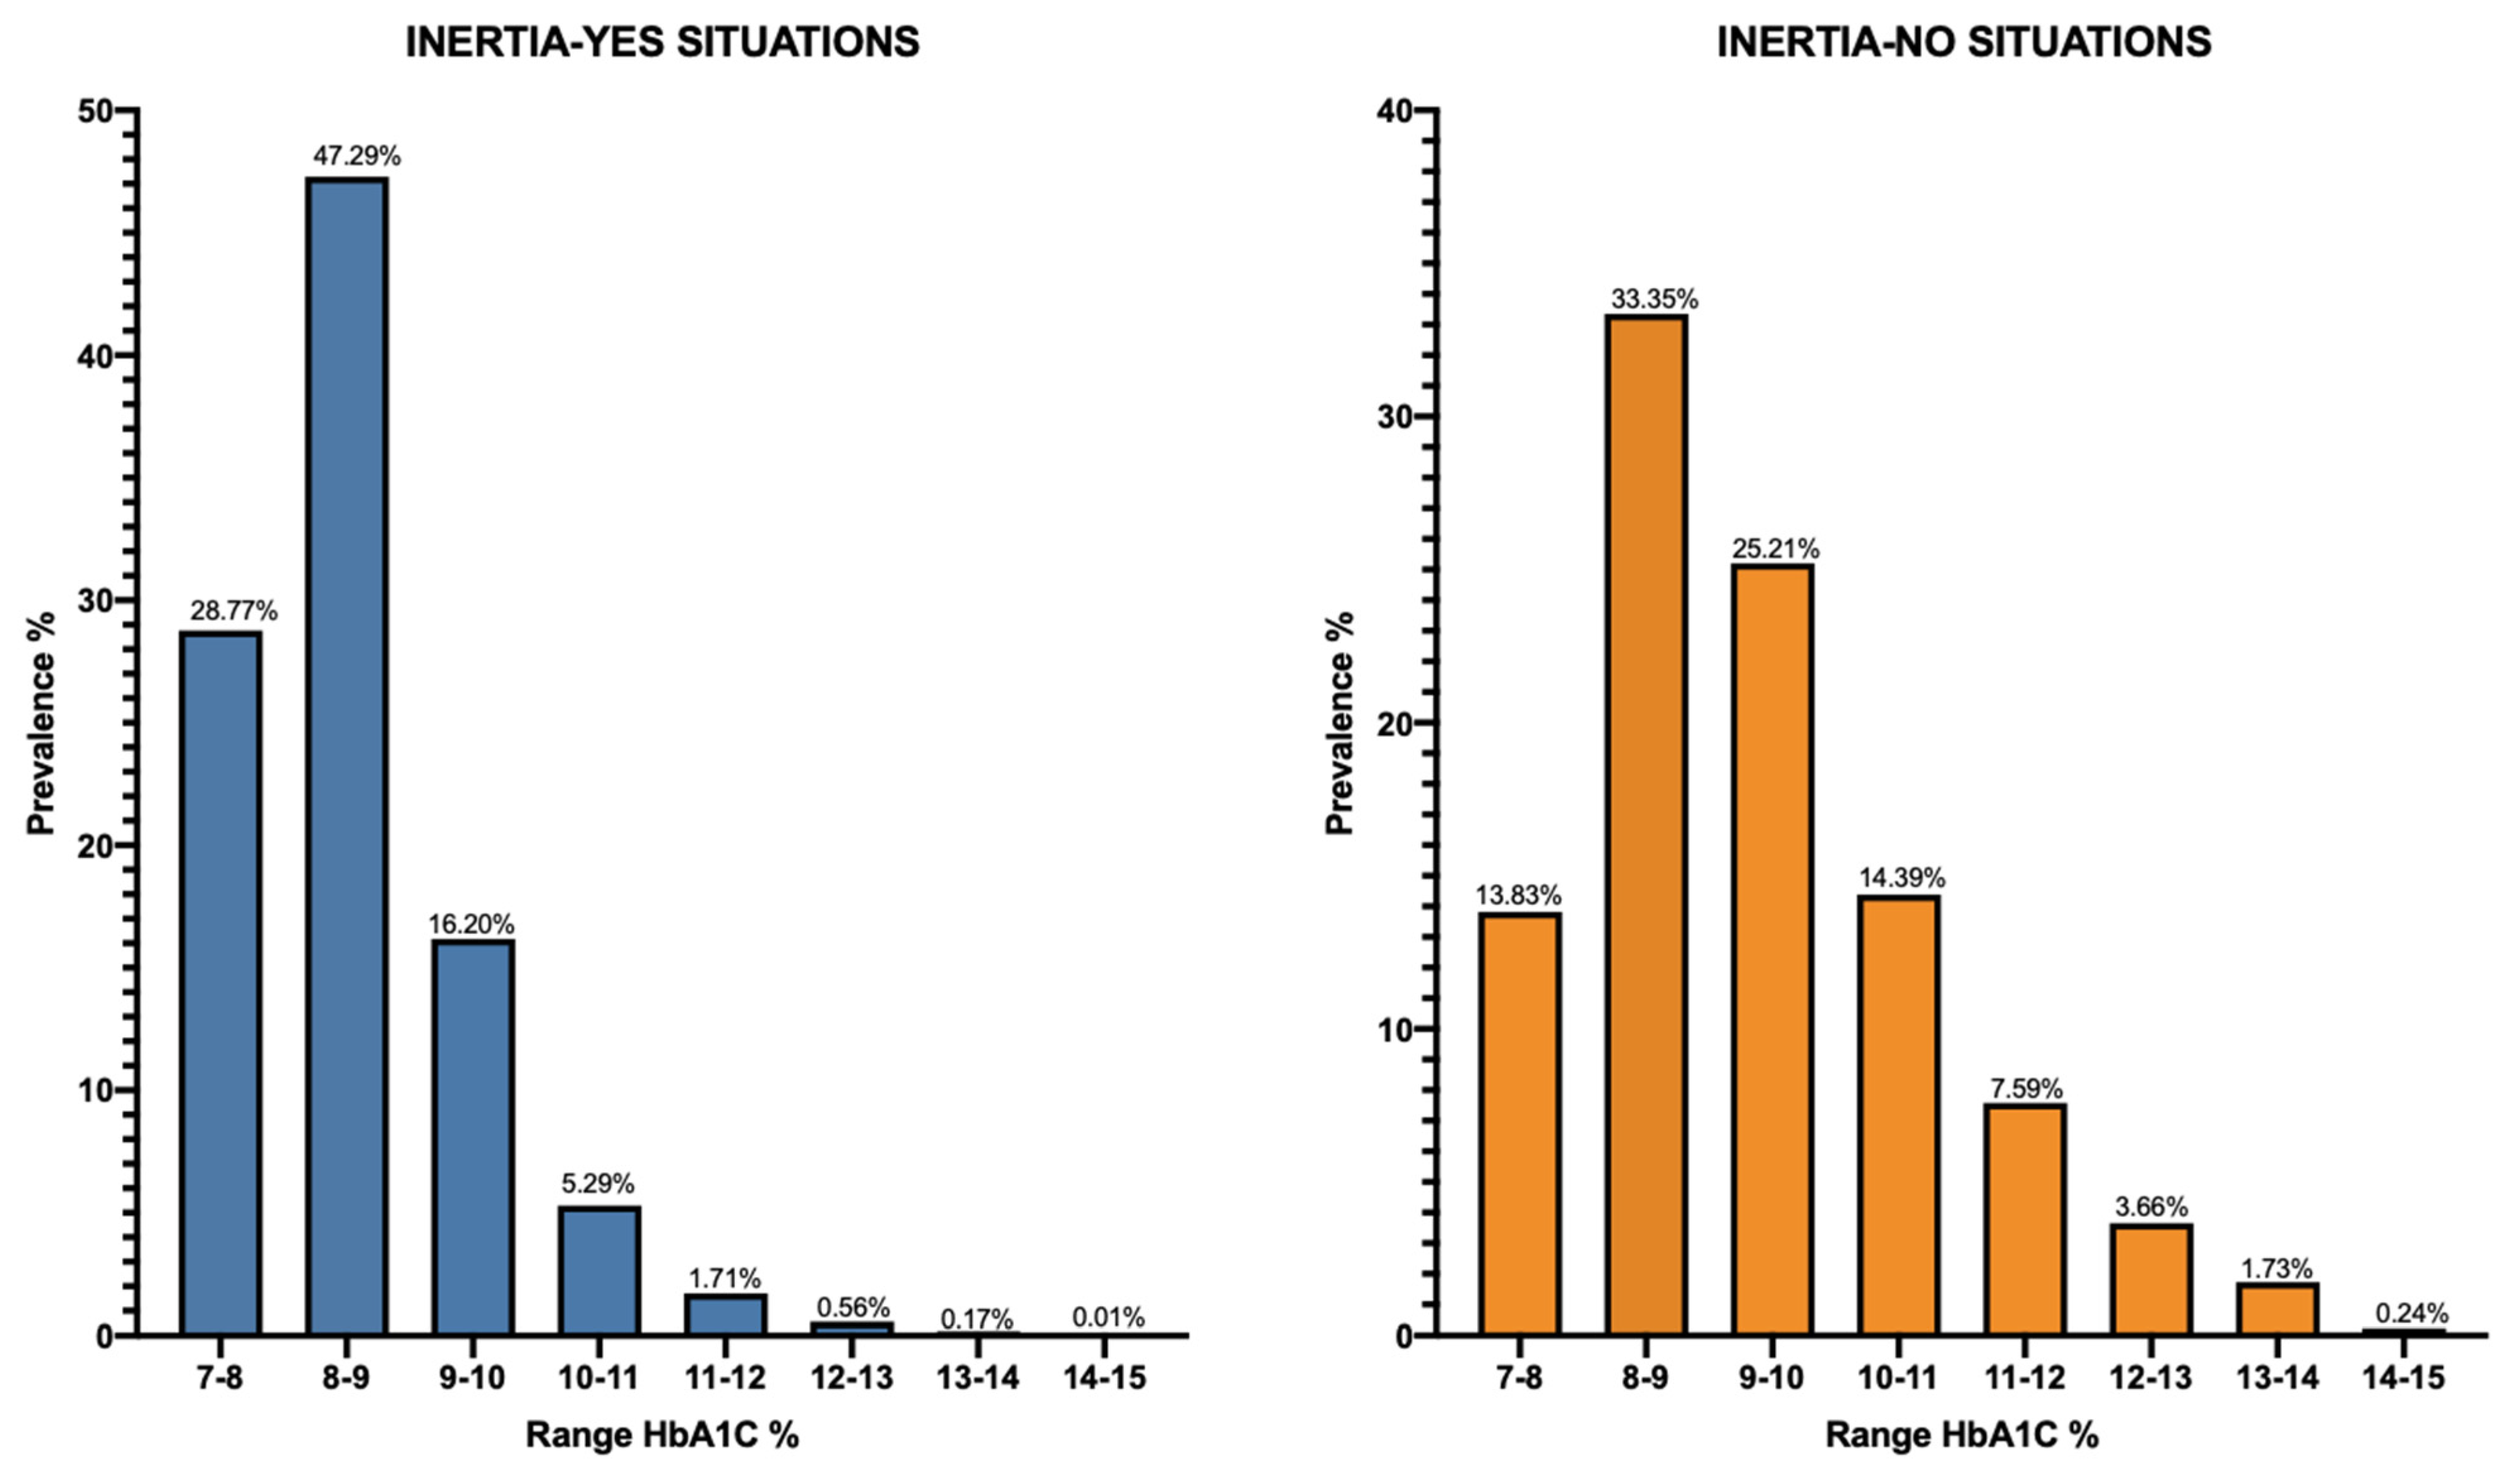
3.1. General Characteristics of the Patients

The LLM modeling focused on the “Inertia-NO” subgroup, aiming to allow the algorithm to discern the factors’ combinations that heightened the probability of achieving the glycemic outcome during insulin prescription. Therefore, we compared the baseline values for pivotal parameters after stratifying patients according to the achievement of the outcome (1Y-Target).
Table 1 illustrates that patients experiencing early insulinization (Inertia-NO cases) but failing to achieve the 12-month glycemic target exhibit a more severe clinical profile at baseline. Specifically, patients who do not reach the target have significantly higher non-HDL cholesterol, HbA1c, and BMI levels compared to those who reach the target.

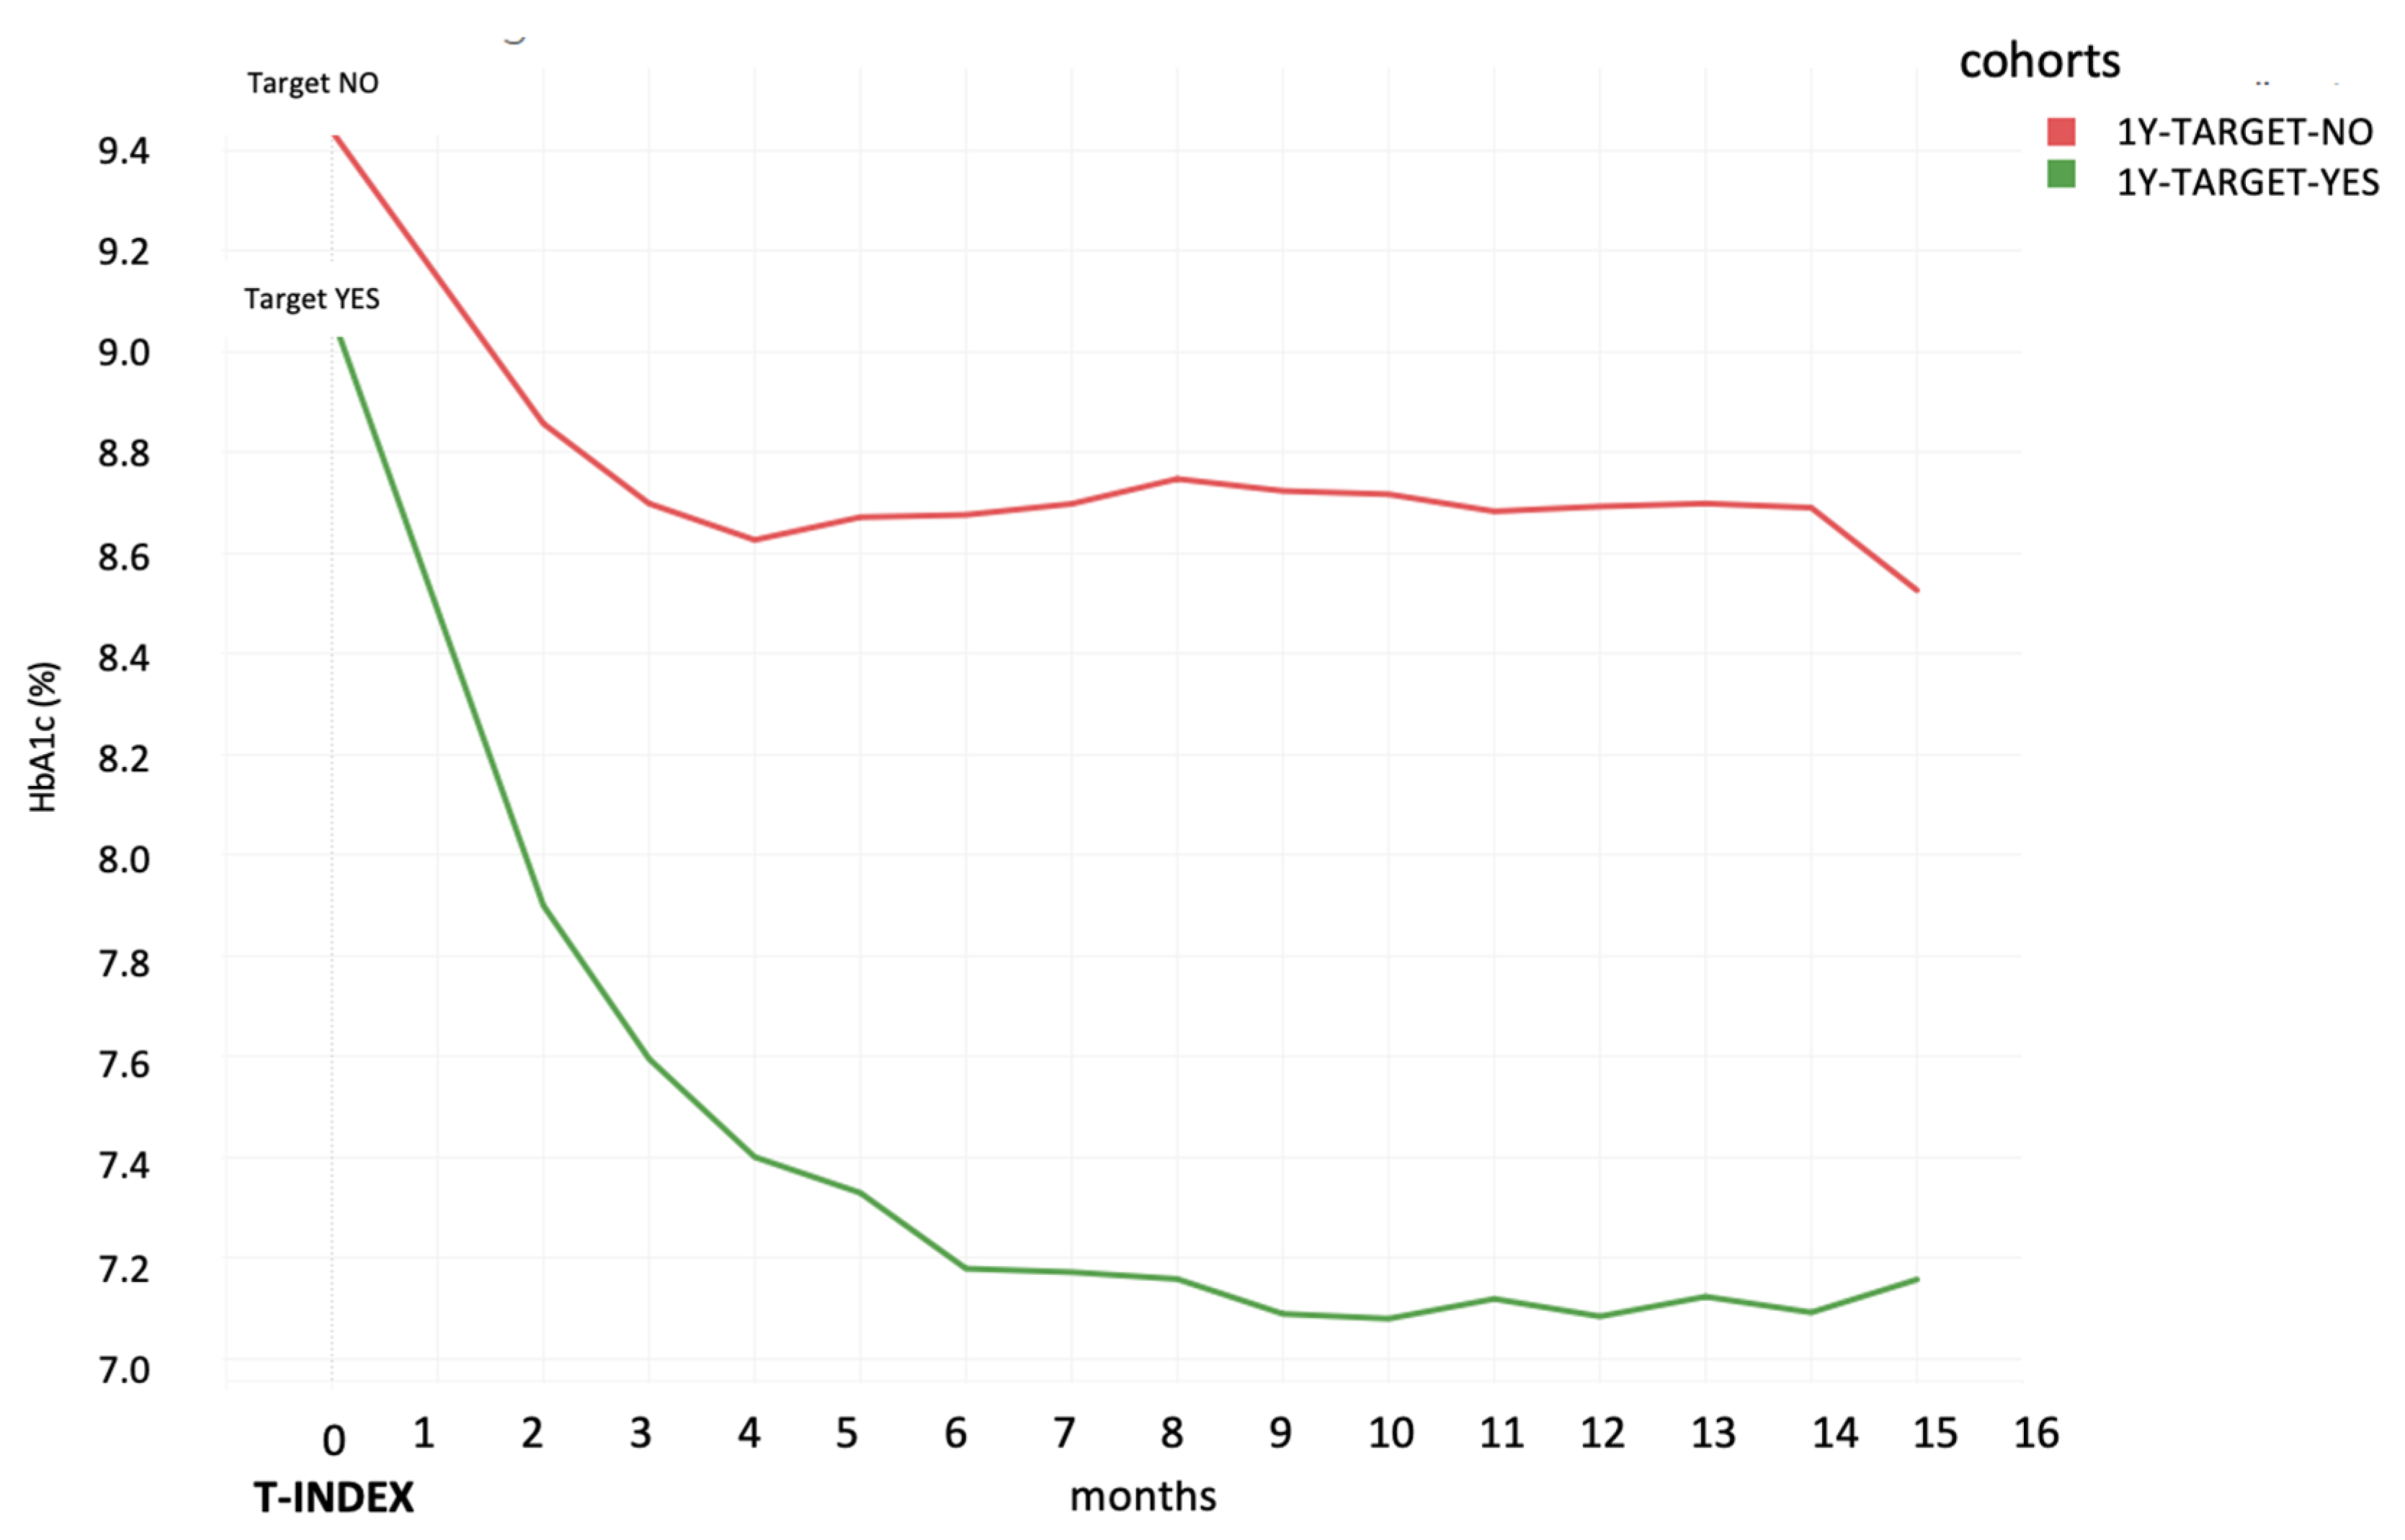
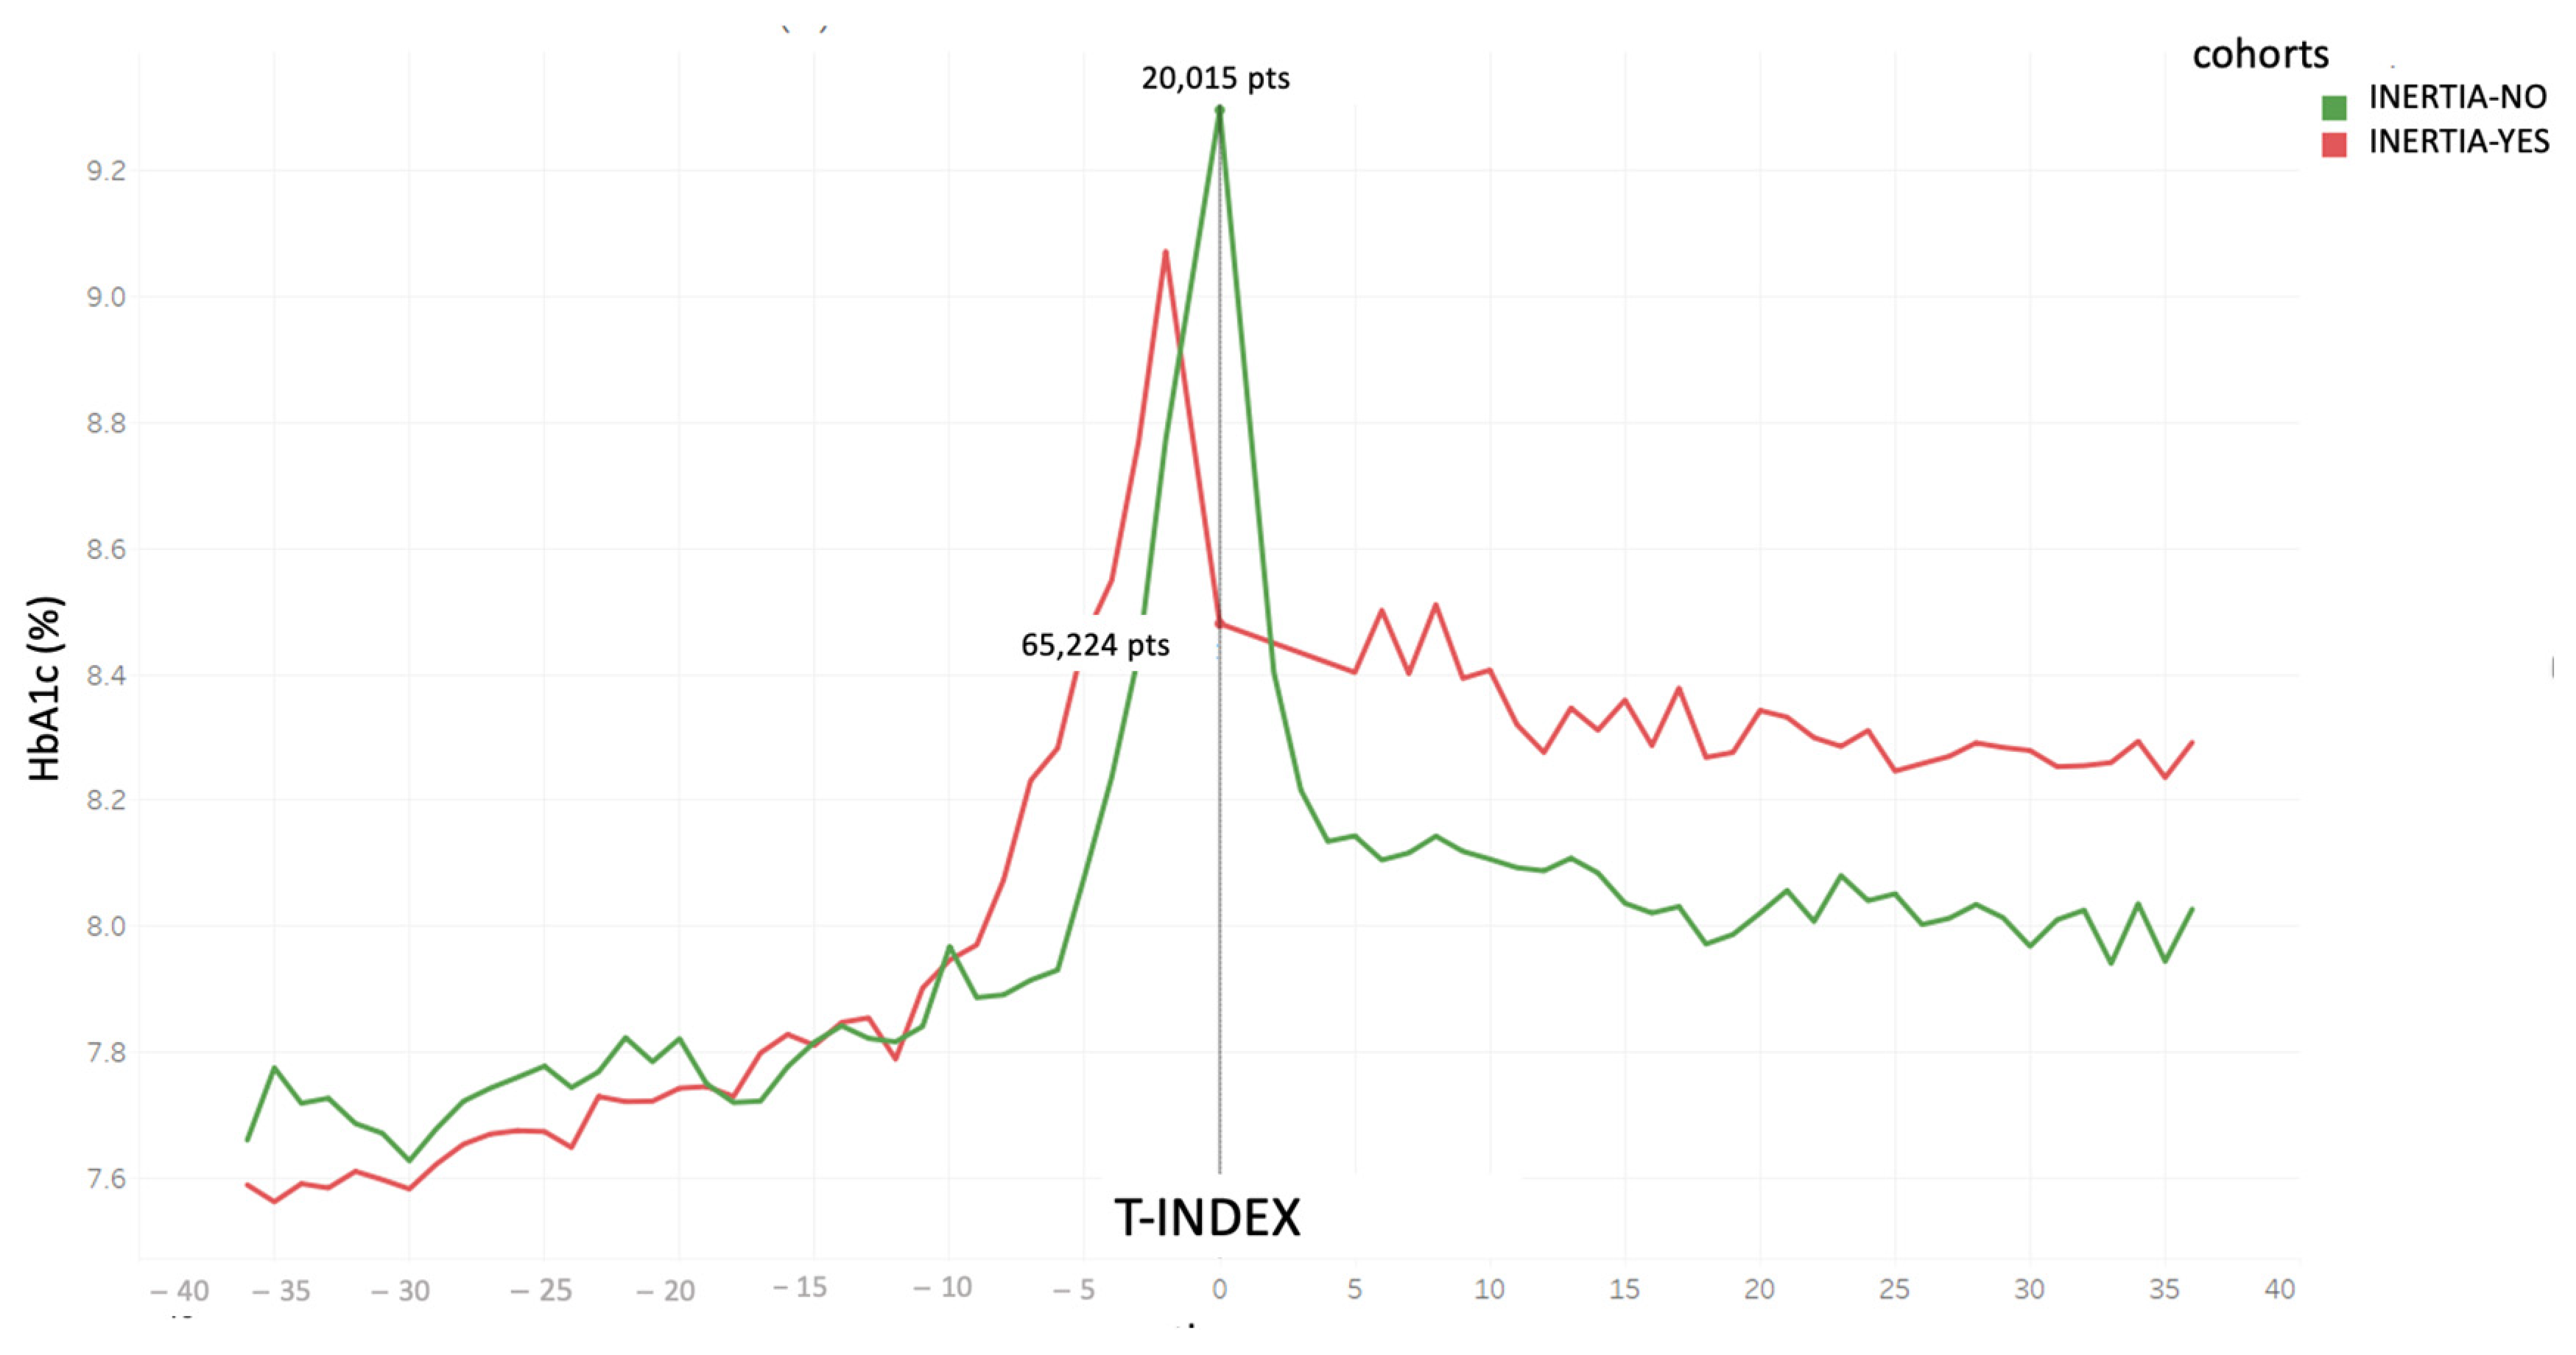
3.2. Comparison of HbA1c Average Levels among the Different Cohorts and Subgroups of Patients

Figure 3 displays the HbA1c trend for both the “Inertia-YES” and “Inertia-NO” cohorts, aligning the T-Index for all patients and delineating the HbA1c curve before and after T-Index. Of note, at the T-index, HbA1c levels were significantly higher in the “Inertia-No” group. Moreover, as expected, these patients also presented consistently lower HbA1c levels in the follow-up visits. Furthermore, we stratified the “Inertia-NO” cohort according to the achievement of the “1Y-target”. As outlined in Table 1, 62% of patients did not achieve the desired outcome despite insulin therapy.
Figure 4 separately illustrates the HbA1c trend in “Inertia-NO” patients, according to the attainment of glycemic goal at the 1-year follow-up.
Figure 5 shows a graphical representation of the two “Inertia-YES” and “Inertia-NO” cohorts at T-index and the percentage of patients reaching the glycemic target at 12 months from T-index (T1-Target) in each of them. It is worth noting that, despite a substantial number of individuals exhibiting inert behavior (65,224 versus 20,015), the percentage of patients who, despite receiving timely insulin treatment, do not reach the target at 12 months remains elevated. Specifically, among the 20,015 cases with timely insulin treatment, only 7694 (38%) achieved the desired outcome. In contrast, in the inertia situations, 21,453 patients (33%) achieved the metabolic goal, while 43,771 (67%) did not. Furthermore, it is crucial to note a significant difference in the average HbA1c level at T-Index between the “Inertia-NO” and “Inertia-YES” situations (refer to Figure 6, which illustrates the distribution between the various HbA1c ranges). This HbA1c level at baseline appears to be correlated with the probability of reaching the target by one year.

3.3. LLM Analysis

Among the 92 variables examined in the LLM analysis, six demonstrated notable significance in predicting the likelihood of achieving the HbA1c goal within a year in “Inertia-NO” patients (Table 2). The remaining variables in the database were either considered insignificant or had marginal relevance. The factors of greatest relevance, showing the strongest correlation with the outcome, are presented first. The most significant parameter is the HbA1c level at the time of insulin prescription. The higher it is (with a threshold value of 8.9% (>74 mmol/mol)), the less likely the outcome is achieved. Subsequently, age emerges as a significant factor. Individuals older than 73 are associated with a higher chance of attaining the target, whereas younger individuals have a lower likelihood. Interestingly, patients with a history of more than nine instances of decompensated HbA1c exhibit a reduced probability of reaching the target, while those with less than seven instances above the target in their medical history have a higher likelihood of achieving it. Additionally, the difference in HbA1c from the previous visit, denoted as the HbA1c gap, plays a role: values below the threshold of +1.45% (<+14.6 mmol/mol) are linked to a higher likelihood of reaching the target, while greater values indicate situations with a lower probability of success. A Q-Score < 24 is associated with situations where the target is not attained; however, no precise threshold value is indicated for achieving the target. Finally, BMI also displays threshold values: a BMI < 25 is linked to a higher probability of reaching the 12-month target, while a BMI > 34 is associated with a reduced probability of achieving it.
The model exhibited acceptable performance across a range of evaluation metrics. Specifically, an accuracy of 0.64, a specificity (true negative rate) of 0.65, and a recall (true positive rate) of 0.61 were achieved on metrics assessing the model’s ability to accurately classify test data. Regarding the receiver operating characteristic (ROC) curve analysis for this model, the area under the curve (AUC), a probabilistic measure reflecting the model’s predictive capability, was 0.704 (Figure S2).
The difference in the performances reported by the two types of metrics can be explained by the fact that the analysis was applied to imbalanced data (the analyzed outcomes had both a significantly greater number of cases with situations: “outcome = no”). In cases like these, it appears that the AUC score is more reliable, as it takes into account prediction probabilities, unlike accuracy.

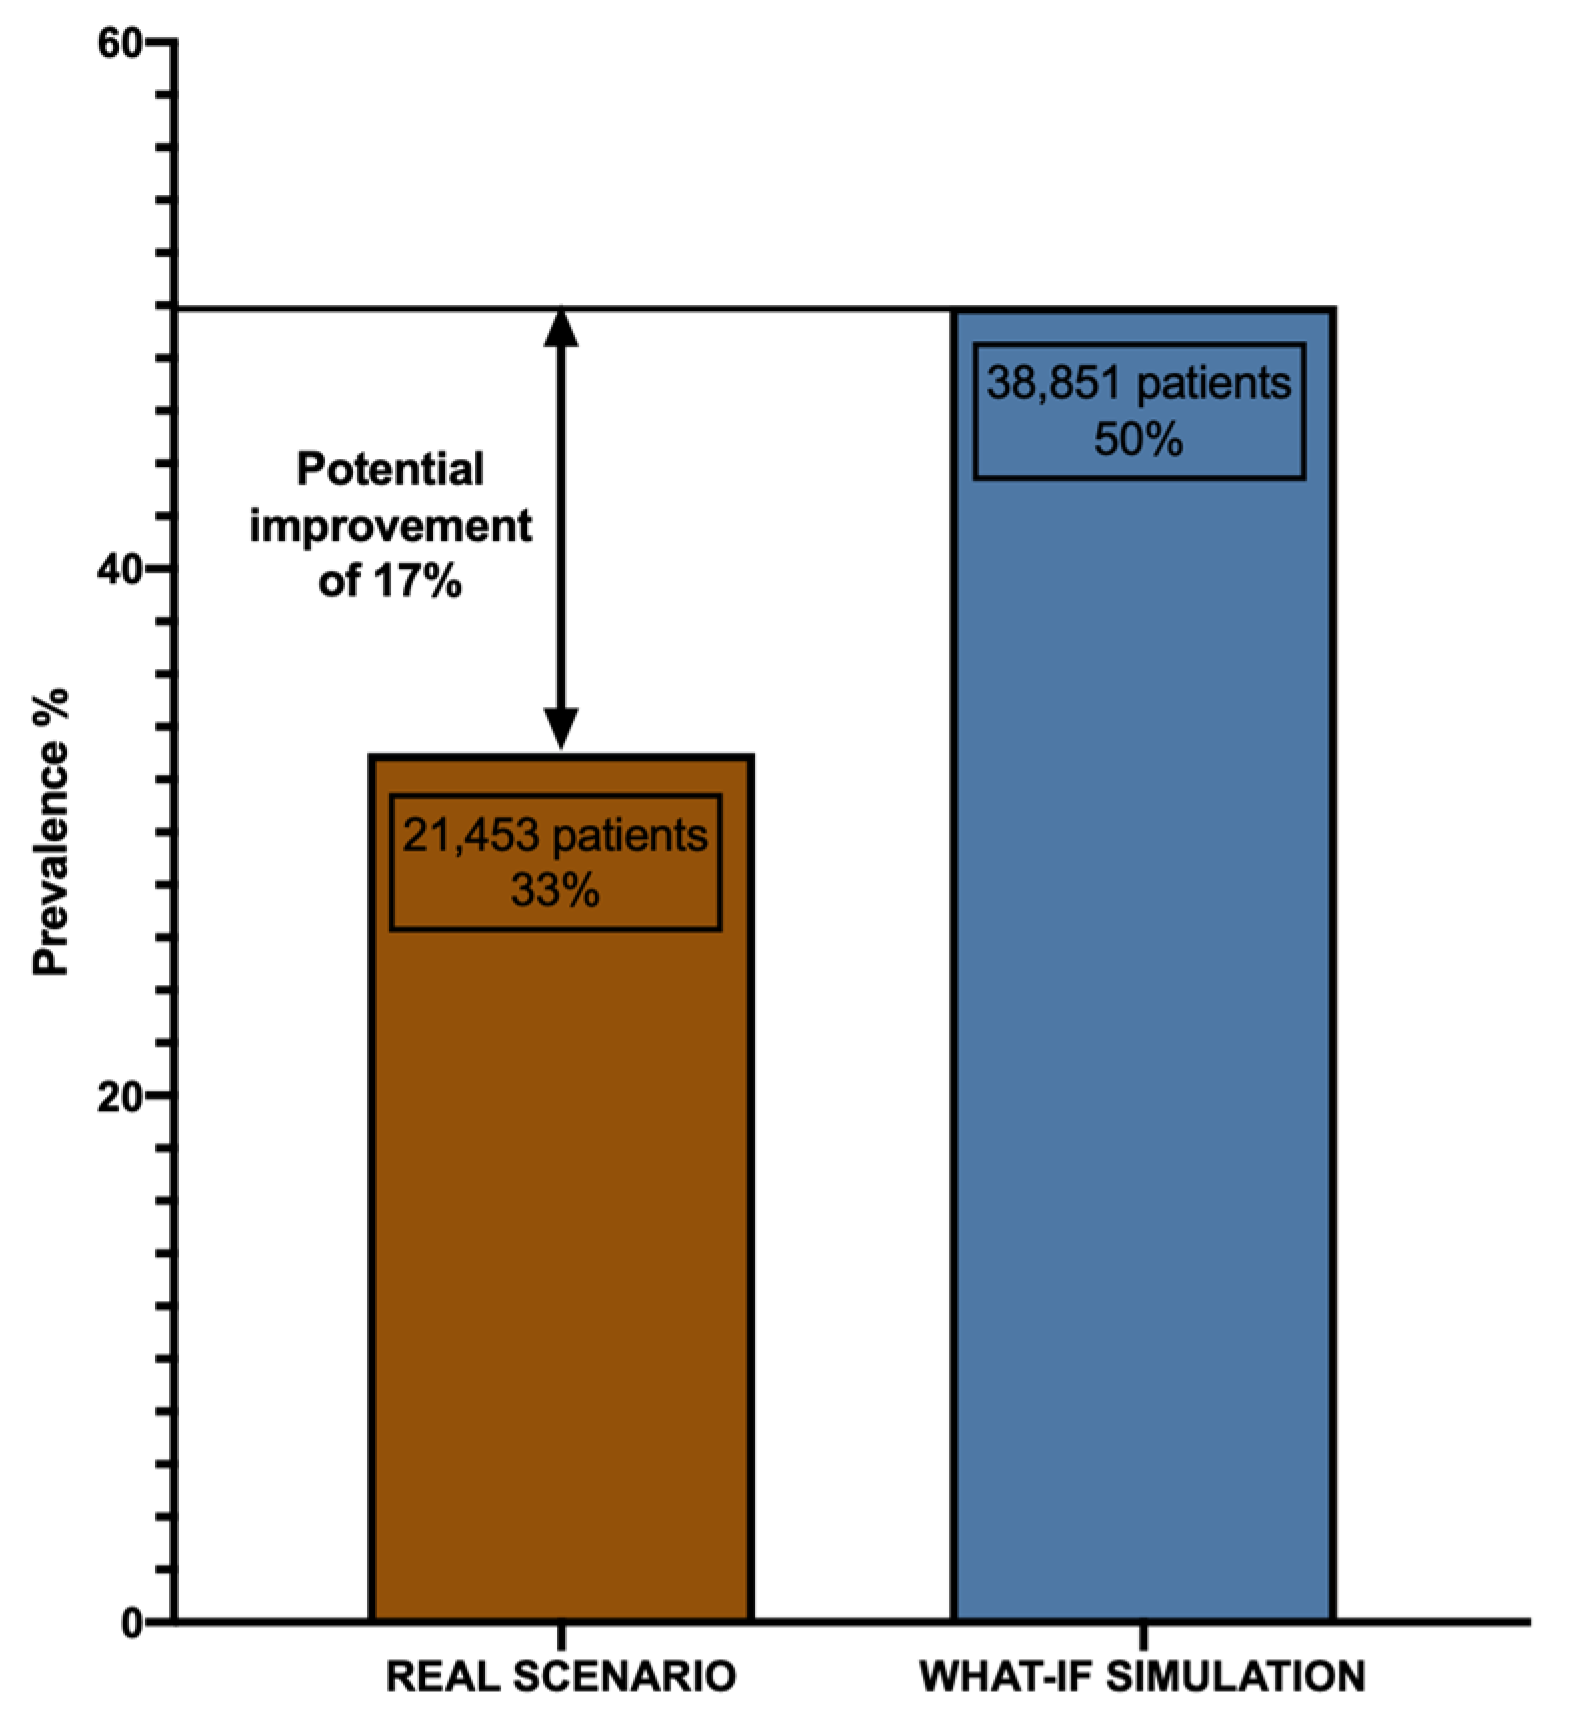
3.4. What-If Scenario Simulation

A “what-if” scenario simulation is a tool used in analyses to project potential outcomes or evaluate hypothetical situations. It allows researchers to explore the potential impact of certain actions or events that have not yet occurred or were not observed in the original dataset. Afterward, by implementing the findings from the LLM model to situations characterized by therapeutic inertia (“inertia-YES” cases), a prospective enhancement of 17% has been identified in the proportion of patients achieving the HbA1c outcome (<7.5%) at the 12-month follow-up (1Y-target). To elaborate, within the cohort of 65,224 individuals where physician inert behavior was noted, an estimated 32.851 patients could potentially attain the target after 12 months, compared to the observed 21,453 patients in the real scenario, as illustrated in Figure 7.

4. Discussion

In the context of T2DM, the term “inertia” refers to the delay or failure to initiate or intensify a treatment when it is clinically indicated. This phenomenon can lead to prolonged periods of uncontrolled hyperglycemia, increasing the risk of diabetes-related complications and reducing life expectancy [27,28]. Clinical inertia is still a significant concern, as it hinders the achievement of glycemic control and the timely adjustment of therapy when treatment goals are not met [29]. This issue is present at all stages of treatment intensification, from the first oral antihyperglycemic drug (OAD) to the initiation of insulin. In this regard, a recent study conducted in a cohort of 28,000 patients with T2DM found that approximately half of the patients displayed therapeutic inertia after 6 months; this percentage rose to more than 60% after 24 months. Patients who were prescribed only one or no OADs exhibited a lower degree of therapeutic inertia (36% or 28%, respectively, at 6 months), while a higher level of inertia was observed among those utilizing multiple OADs or basal insulin [9]. In previous work by the AMD-AI group, we used a transparent LLM to uncover potential drivers influencing the decision to commence insulin therapy in individuals with T2DM. HbA1c threshold values were linked with insulin therapeutic inertia with an accuracy of 0.79 [30].
In this study, utilizing patient data such as demographics, medical history, and biomarkers, we trained the same transparent ML algorithm (Rulex®) to pinpoint factors within the “Inertia-NO” group that might predict achieving the glycemic target at a 12-month follow-up.
Interestingly, we found that higher glycated hemoglobin values at insulin initiation correlated with a reduced probability of reaching the target. This finding might be associated with physicians’ concerns about higher insulin titrations and heightened hypoglycemia risk perception, resulting in suboptimal dosages for metabolic control [31].
Nevertheless, emerging continuous glucose monitoring technology holds promise in reducing hypoglycemic events and addressing therapeutic inertia related to insulin therapy [32]. Similarly, our analysis showed that younger patients with a history of consistently high glycemic values and significant glycemic variability had a lower likelihood of achieving the target, suggesting that potential glycemic variability impacts on the outcome more than reduced pancreatic reserve and long-standing diabetic disease. Our findings suggest that patients with a prolonged history of unstable glycemic trends, despite not having consecutive out-of-target HbA1c until T-Index, may retain a compromised metabolic memory [33].
This could lead to increased insulin resistance, posing challenges in achieving optimal metabolic regulation. While our transparent LLM’ performance was suboptimal in certain metrics due to its exclusive reliance on baseline characteristics, the acceptable ROC-AUC underscores the critical role of timing in achieving glycemic compensation in patients requiring insulin therapy. Via a “what-if” scenario simulation, we also evaluated the potential glycemic benefits of timely insulin initiation in T2DM patients. Interestingly, our analysis showed that a timely insulinization in “Inertia-YES” patients would have led to a significant increase in the percentage of subjects achieving glycemic control (50% vs. 33%), further underscoring the need to overcome therapeutic inertia. While various factors influence metabolic target achievement in insulinized patients, addressing timing alone—by avoiding delays in insulin prescription when appropriate—could prevent patient deterioration and significantly increase those reaching metabolic targets.
While our study provides valuable insights, it is important to acknowledge its limitations. Firstly, it lacks a direct comparison with other ML algorithms applied to the same cohort of patients. Additionally, specific information on lifestyle, patients’ preferences, adherence to therapy, as well as insulin formulation, dosage, and titration within the “Inertia-NO” group, was not included in AMD Annals, potentially impacting therapeutic goal attainment. Moreover, it is crucial to consider the potential impact of unaccounted batch effects, which may introduce variability in the data due to factors such as differences in sample processing or variations in data acquisition methods. These batch effects could influence the robustness and generalizability of our findings. Moreover, patients’ obesity status might have influenced the decision not to prescribe insulin therapy in the “Inertia-YES” subgroup, as the ADA 2022 recommendations emphasize the importance of weight control in the management of T2DM [34]. However, it should be noted that our analysis included patients seen in a period between 2005 and 2019 when new antidiabetic drugs with a positive impact on weight, such as GLP1RA and SGLT2i, were not widely adopted, and these patients were already on dual or triple therapy. Consequently, this population represented cases in which insulin was almost the only treatment that could be introduced to improve glycemic compensation. Our objective was to assess how, within the cohort and over the specified period, noninert behavior would affect the percentage of patients achieving glycemic goals.
Furthermore, the model generated did not perform satisfactorily with certain metrics like accuracy, recall, and specificity; this lack of performance stems from the fact that the patient’s characteristics at the baseline alone cannot solely determine optimal glycemic compensation. In emphasizing this point, it is essential to note that despite these limitations, the achievement of a good ROC-AUC indicates the potential significance of timing among the factors contributing to successful glycemic compensation in patients requiring insulin therapy.

5. Conclusions

Therapeutic inertia represents a critical obstacle in improving long-term outcomes for individuals with T2DM. The integration of machine learning (ML) approaches emerges as a promising solution for effectively scrutinizing patient data, thereby identifying those who would benefit from insulin treatment. Our study confirms that early insulinization, when clinically appropriate, significantly improves patients’ metabolic goals at the 12-month follow-up. This technological support has the potential to greatly assist healthcare providers by enabling more timely and personalized interventions, ultimately enhancing glycemic control and overall patient well-being.
Moving forward, overcoming therapeutic inertia via innovative solutions, such as machine learning, is imperative for advancing the management and outcomes of T2DM. The Rulex platform, with its streamlined approach to data collection and aggregation across diverse sources and formats, is poised to play a pivotal role. Immediate efforts focus on enhancing user-friendly environments for efficient data analysis and cleansing. In the context of the Logic Learning Machine (LLM) method, developers recognize the significance of addressing uncertainties in predictions, with ongoing efforts directed toward robust methods for quantifying and communicating such uncertainties.
Furthermore, active pursuits include adaptive learning strategies for LLMs, ensuring continuous model improvement as fresh data becomes available. Simultaneously, exploration into transfer learning techniques is underway, aiming to leverage knowledge acquired in one domain and apply it effectively to related but distinct domains. These strategic initiatives underscore a strong commitment to advancing the LLM methodology, fostering trust, and adapting to the evolving landscape of data analytics.

Supplementary Materials

The following supporting information can be downloaded at https://www.mdpi.com/article/10.3390/make6010021/s1. Table S1. Summary of the AMD Annals variables included in the Logic Learning Machine analysis. Figure S1. Schematization of LLM’s use in the “what-if” analysis process. Figure S2. The ROC-AUC for the “1Y TARGET” outcome model.

Author Contributions

Conceptualization, R.Z. and M.N.; Methodology, D.M. and A.O.; Software, D.V., F.P., M.M. and P.S.; Validation, R.C., G.G., M.N., P.P., A.R., G.D.C., F.B., L.M. and C.B.G.; Formal analysis, P.S., R.Z., M.N., L.M. and A.O.; Investigation, G.G., M.N., P.P., P.S., L.M., A.O. and R.Z.; Resource, C.B.G., P.P., M.M., F.P. and R.C.; Data curation, P.S.; Writing—original draft preparation, R.Z. and D.M.; Writing—review and editing, R.Z., M.N. and D.M.; Supervision, A.R., D.V., R.C., G.G., M.M., M.N., P.P., P.S., A.O., L.M., B.N., G.D.C., F.B., C.B.G. and R.Z.; Project administration, R.Z.; Funding acquisition, M.N. and P.P. All authors have read and agreed to the published version of the manuscript.

Funding

This research was funded by Sanofi SpA, which had no role in the design of the study; in the collection, analyses, or interpretation of data; in the writing of the manuscript; or in the decision to publish the results.

Institutional Review Board Statement

The study was conducted in accordance with the Declaration of Helsinki, and all participating diabetes centers obtained the authorization of local Ethics Committees.

Informed Consent Statement

According to Italian Law 211/2003, no consent is required for epidemiological analysis regarding anonymous data.

Data Availability Statement

Data will be made available upon reasonable request to the corresponding author.

Conflicts of Interest

The authors declare no conflicts of interest.

References

  1. Ng, M.; Fleming, T.; Robinson, M.; Thomson, B.; Graetz, N.; Margono, C.; Mullany, E.C.; Biryukov, S.; Abbafati, C.; Abera, S.F.; et al. Global, Regional, and National Prevalence of Overweight and Obesity in Children and Adults during 1980–2013: A Systematic Analysis for the Global Burden of Disease Study 2013. Lancet 2014, 384, 766–781. [Google Scholar] [CrossRef] [PubMed]
  2. Khan, M.A.B.; Hashim, M.J.; King, J.K.; Govender, R.D.; Mustafa, H.; Al Kaabi, J. Epidemiology of Type 2 Diabetes–Global Burden of Disease and Forecasted Trends. JEGH 2019, 10, 107. [Google Scholar] [CrossRef] [PubMed]
  3. Russo, G.; Di Bartolo, P.; Candido, R.; Lucisano, G.; Manicardi, V.; Giandalia, A.; Nicolucci, A.; Rocca, A.; Rossi, M.C.; Di Cianni, G. The AMD ANNALS: A Continuous Initiative for the Improvement of Type 2 Diabetes Care. Diabetes Res. Clin. Pract. 2023, 199, 110672. [Google Scholar] [CrossRef] [PubMed]
  4. Khunti, K.; Ceriello, A.; Cos, X.; De Block, C. Achievement of Guideline Targets for Blood Pressure, Lipid, and Glycaemic Control in Type 2 Diabetes: A Meta-Analysis. Diabetes Res. Clin. Pract. 2018, 137, 137–148. [Google Scholar] [CrossRef]
  5. Mauricio, D.; Meneghini, L.; Seufert, J.; Liao, L.; Wang, H.; Tong, L.; Cali, A.; Stella, P.; Carita, P.; Khunti, K. Glycaemic Control and Hypoglycaemia Burden in Patients with Type 2 Diabetes Initiating Basal Insulin in E Urope and the USA. Diabetes Obes. Metab. 2017, 19, 1155–1164. [Google Scholar] [CrossRef]
  6. Abdul-Ghani, M.A.; Puckett, C.; Triplitt, C.; Maggs, D.; Adams, J.; Cersosimo, E.; DeFronzo, R.A. Initial Combination Therapy with Metformin, Pioglitazone and Exenatide Is More Effective than Sequential Add-on Therapy in Subjects with New-onset Diabetes. Results from the E Fficacy and D Urability of I Nitial C Ombination T Herapy for T Ype 2 D Iabetes ( EDICT ): A Randomized Trial. Diabetes Obes. Metab. 2015, 17, 268–275. [Google Scholar] [CrossRef]
  7. Hayward, R.A.; Reaven, P.D.; Wiitala, W.L.; Bahn, G.D.; Reda, D.J.; Ge, L.; McCarren, M.; Duckworth, W.C.; Emanuele, N.V. Follow-up of Glycemic Control and Cardiovascular Outcomes in Type 2 Diabetes. N. Engl. J. Med. 2015, 372, 2197–2206. [Google Scholar] [CrossRef]
  8. McCoy, R.G.; O’Connor, P.J. Overcoming Therapeutic Inertia in Type 2 Diabetes Care—Timing, Context, and Appropriateness of Treatment Intensification. JAMA Netw. Open 2021, 4, e2130926. [Google Scholar] [CrossRef]
  9. Rattelman, C.R.; Ciemins, E.L.; Stempniewicz, N.; Mocarski, M.; Ganguly, R.; Cuddeback, J.K. A Retrospective Analysis of Therapeutic Inertia in Type 2 Diabetes Management Across a Diverse Population of Health Care Organizations in the USA. Diabetes Ther. 2021, 12, 581–594. [Google Scholar] [CrossRef] [PubMed]
  10. Khunti, S.; Khunti, K.; Seidu, S. Therapeutic Inertia in Type 2 Diabetes: Prevalence, Causes, Consequences and Methods to Overcome Inertia. Ther. Adv. Endocrinol. 2019, 10, 204201881984469. [Google Scholar] [CrossRef] [PubMed]
  11. Gabbay, R.A.; Kendall, D.; Beebe, C.; Cuddeback, J.; Hobbs, T.; Khan, N.D.; Leal, S.; Miller, E.; Novak, L.M.; Rajpathak, S.N.; et al. Addressing Therapeutic Inertia in 2020 and Beyond: A 3-Year Initiative of the American Diabetes Association. Clin. Diabetes 2020, 38, 371–381. [Google Scholar] [CrossRef]
  12. Powell, R.E.; Zaccardi, F.; Beebe, C.; Chen, X.M.; Crawford, A.; Cuddeback, J.; Gabbay, R.A.; Kissela, L.; Litchman, M.L.; Mehta, R.; et al. Strategies for Overcoming Therapeutic Inertia in Type 2 Diabetes: A Systematic Review and Meta-analysis. Diabetes Obes. Metab. 2021, 23, 2137–2154. [Google Scholar] [CrossRef] [PubMed]
  13. Correa, M.F.; Li, Y.; Kum, H.-C.; Lawley, M.A. Assessing the Effect of Clinical Inertia on Diabetes Outcomes: A Modeling Approach. J. Gen. Intern. Med. 2019, 34, 372–378. [Google Scholar] [CrossRef] [PubMed]
  14. Del Ser, J.; Barredo-Arrieta, A.; Díaz-Rodríguez, N.; Herrera, F.; Saranti, A.; Holzinger, A. On Generating Trustworthy Counterfactual Explanations. Inf. Sci. 2024, 655, 119898. [Google Scholar] [CrossRef]
  15. Doyle-Delgado, K.; Chamberlain, J.J.; Shubrook, J.H.; Skolnik, N.; Trujillo, J. Pharmacologic Approaches to Glycemic Treatment of Type 2 Diabetes: Synopsis of the 2020 American Diabetes Association’s Standards of Medical Care in Diabetes Clinical Guideline. Ann. Intern. Med. 2020, 173, 813–821. [Google Scholar] [CrossRef] [PubMed]
  16. Augstein, P.; Heinke, P.; Vogt, L.; Vogt, R.; Rackow, C.; Kohnert, K.-D.; Salzsieder, E. Q-Score: Development of a New Metric for Continuous Glucose Monitoring That Enables Stratification of Antihyperglycaemic Therapies. BMC Endocr. Disord. 2015, 15, 22. [Google Scholar] [CrossRef] [PubMed]
  17. Ceriello, A.; Rossi, M.C.; De Cosmo, S.; Lucisano, G.; Pontremoli, R.; Fioretto, P.; Giorda, C.; Pacilli, A.; Viazzi, F.; Russo, G.; et al. Overall Quality of Care Predicts the Variability of Key Risk Factors for Complications in Type 2 Diabetes: An Observational, Longitudinal Retrospective Study. Diabetes Care 2019, 42, 514–519. [Google Scholar] [CrossRef] [PubMed]
  18. Abu Hassan, H.; Tohid, H.; Mohd Amin, R.; Long Bidin, M.B.; Muthupalaniappen, L.; Omar, K. Factors Influencing Insulin Acceptance among Type 2 Diabetes Mellitus Patients in a Primary Care Clinic: A Qualitative Exploration. BMC Fam Pr. 2013, 14, 164. [Google Scholar] [CrossRef] [PubMed]
  19. Guerci, B.; Drouin, P.; Grangé, V.; Bougnères, P.; Fontaine, P.; Kerlan, V.; Passa, P.; Thivolet, C.; Vialettes, B.; Charbonnel, B. Self-Monitoring of Blood Glucose Significantly Improves Metabolic Control in Patients with Type 2 Diabetes Mellitus: The Auto-Surveillance Intervention Active (ASIA) Study. Diabetes Metab. 2003, 29, 587–594. [Google Scholar] [CrossRef]
  20. Sastre, J.; Pinés, P.J.; Del Val, F.; Moreno-Fernandez, J.; Gonzalez López, J.; Quiroga, I.; Herranz, S.; López Gallardo, G.; Calderón, D.; López López, J. Metabolic Control and Treatment Regimens in Patients with Type 1 Diabetes in Castilla-La Mancha, 10 Years Later: The 2020 DIACAM1 Study. Endocrinol. Diabetes Y Nutr. 2022, 69, 483–492. [Google Scholar] [CrossRef]
  21. Bott, U.; Jörgens, V.; Grüsser, M.; Bender, R.; Mühlhauser, I.; Berger, M. Predictors of Glycaemic Control in Type 1 Diabetic Patients after Participation in an Intensified Treatment and Teaching Programme. Diabet. Med. 1994, 11, 362–371. [Google Scholar] [CrossRef]
  22. Meneghini, L.F. Early Insulin Treatment in Type 2 Diabetes. Diabetes Care 2009, 32, S266–S269. [Google Scholar] [CrossRef]
  23. McCormick, T.A.; Adams, J.L.; Lee, E.A.; Emptage, N.P.; Palmer-Toy, D.E.; Martin, J.P.; Broder, B.I.; Kanter, M.H.; Davis, A.C.; McGlynn, E.A. Age-Dependent Hemoglobin A1c Therapeutic Targets Reduce Diabetic Medication Changes in the Elderly. eGEMs 2019, 7, 46. [Google Scholar] [CrossRef] [PubMed]
  24. Basu, S.; Shao, H.; Luo, J.; Lipska, K.; Suda, K.J.; Yudkin, J.S. Estimates of Insulin Needs and Dispensation given Wastage, Alternative Glycemic Targets, and Non-Insulin Therapies in US Populations with Type 2 Diabetes Mellitus: A Microsimulation Study. J. Diabetes Its Complicat. 2021, 35, 107839. [Google Scholar] [CrossRef]
  25. Annali_AMD-2018. Available online: https://aemmedi.it/wp-content/uploads/2018/11/Annali_AMD-_2018_prot.pdf (accessed on 2 February 2024).
  26. Verda, D.; Parodi, S.; Ferrari, E.; Muselli, M. Analyzing Gene Expression Data for Pediatric and Adult Cancer Diagnosis Using Logic Learning Machine and Standard Supervised Methods. BMC Bioinform. 2019, 20, 390. [Google Scholar] [CrossRef]
  27. Khunti, K.; Gomes, M.B.; Pocock, S.; Shestakova, M.V.; Pintat, S.; Fenici, P.; Hammar, N.; Medina, J. Therapeutic Inertia in the Treatment of Hyperglycaemia in Patients with Type 2 Diabetes: A Systematic Review. Diabetes Obes. Metab. 2018, 20, 427–437. [Google Scholar] [CrossRef] [PubMed]
  28. Karam, S.L.; Dendy, J.; Polu, S.; Blonde, L. Overview of Therapeutic Inertia in Diabetes: Prevalence, Causes, and Consequences. Diabetes Spectr. 2020, 33, 8–15. [Google Scholar] [CrossRef] [PubMed]
  29. Gavin, J.R.; Abaniel, R.M.; Virdi, N.S. Therapeutic Inertia and Delays in Insulin Intensification in Type 2 Diabetes: A Literature Review. Diabetes Spectr. 2023, 36, 379–384. [Google Scholar] [CrossRef]
  30. Musacchio, N.; Zilich, R.; Ponzani, P.; Guaita, G.; Giorda, C.; Heidbreder, R.; Santin, P.; Di Cianni, G. Transparent Machine Learning Suggests a Key Driver in the Decision to Start Insulin Therapy in Individuals with Type 2 Diabetes. J. Diabetes 2023, 15, 224–236. [Google Scholar] [CrossRef] [PubMed]
  31. Khunti, K.; Wolden, M.L.; Thorsted, B.L.; Andersen, M.; Davies, M.J. Clinical Inertia in People With Type 2 Diabetes. Diabetes Care 2013, 36, 3411–3417. [Google Scholar] [CrossRef]
  32. Martens, T.W.; Parkin, C.G. How Use of Continuous Glucose Monitoring Can Address Therapeutic Inertia in Primary Care. Postgrad. Med. 2022, 134, 576–588. [Google Scholar] [CrossRef] [PubMed]
  33. Lachin, J.M.; Nathan, D.M. Understanding Metabolic Memory: The Prolonged Influence of Glycemia During the Diabetes Control and Complications Trial (DCCT) on Future Risks of Complications During the Study of the Epidemiology of Diabetes Interventions and Complications (EDIC). Diabetes Care 2021, 44, 2216–2224. [Google Scholar] [CrossRef] [PubMed]
  34. American Diabetes Association Professional Practice Committee 8. Obesity and Weight Management for the Prevention and Treatment of Type 2 Diabetes: Standards of Medical Care in Diabetes—2022. Diabetes Care 2022, 45, S113–S124. [Google Scholar] [CrossRef] [PubMed]
Figure 1. Flowcharts illustrating the selection steps operated to create the INERTIA-NO and INERTIA-YES cohorts.
Make 06 00021 g001
Figure 2. Schematic representation of the scenario simulation.
Make 06 00021 g002
Figure 3. HbA1c trend for the 2 cohorts “Inertia-YES” and “Inertia-NO” before and after T-index.
Make 06 00021 g003
Figure 4. HbA1c trend after T-Index for the cohort of patients characterized by Inertia-NO, divided into achievement of “1Y TARGET” Yes/No’.
Make 06 00021 g004
Figure 5. Patient cohorts categorized under Inertia-YES and Inertia-NO scenarios, with the percentage of patients achieving or not achieving the “1Y TARGET” outcome for each respective cohort.
Make 06 00021 g005
Figure 6. Distribution across different HbA1c ranges for the INERTIA-YES and INERTIA-NO cohorts at T-index.
Make 06 00021 g006
Figure 7. Graph displaying the potential improvement in patients achieving the “1Y TARGET” in the what-if simulation.
Make 06 00021 g007
Table 1. Characteristics of patients: baseline (T-INDEX) values for the INERTA-NO cohort, divided into “1Y TARGET” YES/NO subgroups.
T-INDEX
Variable 1Y TARGET MeanMedianSD% Missing Interquartile Rangep-Value
(Alpha = 0.05)
Patients (n.)INERTIA-NO GROUP (20,015)NO (12,321–62%)------
YES (7694–38%)
Age NO66.0876710.4059–73<0.0001
(y) YES69.597110.35063–77
HbA1c NO9.439.21.208.5–10.1<0.0001
(%)YES9.078.81.208.2–9.6
HbA1c gap between visits (%)NO1.0911.46%0.2–1.9<0.0001
YES1.1911.386%0.4–1.8
Cholesterol
(mg/dL)
NO179.07174.2045.9659%148.8–204.1<0.0001
YES174.56170.2044.7574%146.0–175.56
LDL-C
(mg/dL)
NO98.59537.832%73–119<0.0001
YES96.19337.430%72–116
HDL-CNO46.24413.423%37–53<0.0001
(mg/dL)YES47.24514.024%38–55
TGDNO181.814914521%106–216<0.0001
(mg/dL)YES161.6135119.522%96–190
BMINO30.529.75.94%26.4–33.7<0.0001
(Kg/m2)YES29.128.45.54%25.3–32.3
eGFRNO74.677.923.618%56.2–93.4<0.0001
(mL/min/m2)YES71.073.323.416%52.7–71.03
GlucoseNO206.719962.212%165–241<0.0001
(mg/dL)YES200.419262.113%160–232
DBP (diastolic)NO78.9809.815%70–83<0.0001
(mmHg)YES77.8809.815%70–80
SBP (systolic)NO13714019.015%125–1500.146
(mmHg)YES13714019.215%125–150
GOTNO24.52022.644%15–260.886
(mU/mL)YES24.61926.743%15–26
GPTNO30.82428.240%17–350.005
(mU/mL)YES29.22231.239%16–32
Q-ScoreNO25.124.92.520%23.4–26.8<0.0001
YES25.425.22.424%23.8–27.0
Number of out-of-range HbA1c values in the patient’s historyNO5.144.20%2–7<0.0001
YES4.233.50%2–6
Abbreviations: SD, standard deviation; BMI, body mass index; HbA1c, glycated hemoglobin; eGFR, estimated glomerular filtration rate; SBP, systolic blood pressure; DBP, diastolic blood pressure; LDL-C, low-density lipoprotein cholesterol; TGD, triglycerides; HDL-C, high-density lipoprotein cholesterol; 1Y target, achievement of glycated hemoglobin target at the 1-year follow-up.
Table 2. Ranking of most relevant factors for the “1Y TARGET” outcome YES/NO situations.
Relevant Factors“1Y target”
Outcome-NO
“1Y target”
Outcome-YES
Relevance (0–1)
HbA1c at current visit>8.9% (>74 mmol/mol)<8.9% (<74 mmol/mol)0.752
Age at current visit<73 >73 0.601
Number of out-of-range HbA1c values in the patient’s history>9<70.298
HbA1c gap from previous visit>+1.45%
(>+14.6 mmol/mol)
<+1.45%
(<+14.6 mmol/mol)
0.136
Q-Score<24No threshold0.058
BMI>34<250.052
Abbreviations: BMI, body mass index; HbA1c, glycated hemoglobin.
Disclaimer/Publisher’s Note: The statements, opinions and data contained in all publications are solely those of the individual author(s) and contributor(s) and not of MDPI and/or the editor(s). MDPI and/or the editor(s) disclaim responsibility for any injury to people or property resulting from any ideas, methods, instructions or products referred to in the content.

