Abstract
The accurate prediction of the mechanical behaviour of silica–epoxy nanocomposites is essential for advancing their application in high-performance industries, including aerospace, automotive, and structural engineering. Conventional experimental characterization methods are often time-consuming and costly, highlighting the need for efficrelianceient computational alternatives. This study proposes a machine learning based on Random Forest Regression to predict the stress–strain behaviour of silica–epoxy nanocomposites with high accuracy. The model employs two independent and physically meaningful input parameters—SiO2 nanoparticle concentration (wt%) and strain—to predict stress, thereby capturing the true constitutive relationship of the material. The model was trained and validated on an extensive experimental dataset of 7422 observations across five compositions (0–4 wt% SiO2), obtained from systematic tensile testing following the ASTM D638 standard. Rigorous stratified 10-fold cross-validation confirmed excellent generalization (mean R2 = 0.9977 ± 0.0023) with minimal overfitting (training–validation gap < 0.005). The performance of the test set (R2 = 0.9948, mean absolute error (MAE) = 0.0404 MPa) surpasses recent literature benchmarks by nearly 5%, establishing state-of-the-art accuracy in nanocomposite property prediction. Error analysis revealed stable prediction accuracy throughout the elastic and plastic regimes (error variance < 0.004 MPa2 for strain), with a physically consistent increase in error near failure due to complex damage mechanisms. Feature importance analysis indicated that strain and SiO2 concentration contributed 78.4% and 21.6%, respectively, to predictive accuracy. This is consistent with constitutive modelling principles, in which deformation state primarily determines stress magnitude, while composition modulates the functional relationship. Mechanical property extraction from experimental curves showed optimal performance at 2–3 wt% SiO2, yielding balanced enhancements in tensile strength (+1–2%) and failure strain (+36–64%) relative to neat epoxy. The validated framework reduces material development time by 65–80% and cost by 60–75% compared with conventional trial-and-error methods, offering a robust, data-driven tool for the efficient design and optimization of silica–epoxy nanocomposites. A comprehensive discussion of limitations and applicability boundaries ensures the framework’s responsible and reliable deployment in engineering practice.
1. Introduction
In recent years, there has been a significant increase in research interest in the development of advanced composite materials, particularly silica–epoxy nanocomposites. This interest stems from the exceptional mechanical properties, enhanced thermal stability, and broad applicability across multiple high-performance industries that these materials offer. The integration of silica nanoparticles into an epoxy polymer matrix has been shown to result in significant enhancements in tensile strength, fracture toughness, and resistance to thermal degradation when compared with conventional composites. These characteristics render them optimal for use in demanding applications in sectors such as aerospace, automotive manufacturing, and structural engineering, where material performance under extreme conditions is paramount.
Moreover, the tunability of their nanostructure facilitates the optimization of properties such as stiffness, durability, and weight reduction, thus offering significant advantages over traditional materials. Consequently, research efforts are currently focused on refining synthesis techniques, improving nanoparticle dispersion, and exploring novel functionalization methods to enhance performance further and broaden industrial applications [].
Silica–epoxy nanocomposites, formed by dispersing silica nanoparticles within an epoxy polymer matrix, also exhibit enhanced strength-to-weight ratios and fracture resistance compared with traditional composites. These improvements are largely attributed to the reinforcing role of nanoscale silica particles, which promote load transfer, impede crack propagation, and strengthen interfacial adhesion within the polymer matrix. Their thermal stability and resistance to environmental degradation further extend their applicability across a wide range of conditions. Ongoing studies in fabrication techniques—such as in situ polymerization and surface functionalization—seek to optimize these mechanical and thermal properties even more. As a result, silica–epoxy nanocomposites represent a significant advancement in materials science, with considerable potential for next-generation aerospace, automotive, and structural engineering applications []. Nevertheless, accurate prediction of their mechanical behavior, particularly stress–strain relationships, remains a critical challenge in materials science and engineering.
Conventional experimental methodologies for assessing mechanical properties, such as tensile and compression testing, are often time-consuming and costly and require meticulous sample preparation []. Numerous studies have demonstrated the efficacy of computational approaches, such as finite element analysis (FEA), in simulating material behavior. However, these methods rely on simplifying assumptions that can compromise accuracy []. Recent advancements in machine learning (ML) provide a promising alternative by enabling data-driven predictive modeling with minimal dependence on empirical approximations [,,].
Among ML techniques, Random Forest Regression (RFR) has emerged as a powerful tool for predicting material properties due to its robustness against overfitting and ability to handle complex nonlinear relationships [,,]. Previous studies have shown that RFR can successfully predict the mechanical behavior of polymer composites [,] and carbon nanotube-reinforced materials []. However, its application to silica–epoxy nanocomposites, particularly for simultaneous stress–strain prediction, remains largely unexplored.
This study seeks to bridge a critical knowledge gap by developing a high-accuracy RFR model to predict the stress–strain behavior of silica–epoxy nanocomposites using experimentally derived datasets. The model incorporates key input parameters—namely, silica (SiO2) nanoparticle concentration and curing time—to build a robust predictive framework for mechanical performance.
The primary objectives of this work are threefold:
- Reduce reliance on resource-intensive experimental trials by leveraging ML for efficient and accurate property prediction.
- Develop a scalable computational tool to facilitate material design optimization, thereby streamlining the development of advanced nanocomposites.
- Develop a physically meaningful modeling framework that accurately captures the material’s constitutive behavior while yielding fundamental mechanical properties essential for engineering design.
By employing a data-driven approach, this research aligns with the growing paradigm shift in materials science toward ML-aided discovery and performance modeling. The findings contribute to ongoing efforts to accelerate material innovation, offering a methodological framework that can be extended to other composite systems. Ultimately, this work supports broader integration of artificial intelligence (AI) and computational tools into materials engineering, enabling faster, cost-effective, and predictive material development [,,].
2. Prior Related Work
Several important recent studies focusing on silica–epoxy systems and related nanocomposites have significantly advanced the application of ML in composite materials research. Uniyal et al. [] reviewed the role of nanosilica as a toughening agent in epoxy composites for aerospace applications, emphasizing the need for reliable predictive modeling tools. Berladir et al. [] demonstrated the effective use of ML techniques to predict the mechanical properties of composite materials through the analysis of extensive experimental datasets, achieving remarkably accurate results. These recent developments collectively highlight the growing importance of ML-based approaches for nanocomposite characterization and property prediction, paving the way for next-generation data-driven materials design.
The utilization of ML techniques for predicting the mechanical properties of composite materials has gained significant attention in recent years, emerging as a promising alternative to conventional characterization methods. Peer-reviewed studies have demonstrated the effectiveness and efficacy of data-driven approaches in materials science applications [,].
A literature analysis reveals that modern ML algorithms, particularly ensemble methods and deep neural networks, are highly effective at modeling the complex, nonlinear relationships inherent in composite material behavior. Their proficiency arises from several key advantages:
- Enhanced Predictive Capacity: ML models can detect subtle patterns in high-dimensional datasets that traditional analytical methods often overlook [].
- Computational Efficiency: Compared with finite element analysis or molecular dynamics simulations, ML approaches require significantly less computational resources while maintaining competitive accuracy [].
- Adaptability: ML models can be continuously updated as new experimental data become available, enabling ongoing improvements in prediction accuracy.
Recent advancements in explainable artificial intelligence (XAI) have further strengthened the scientific value of ML applications in materials science by providing interpretable insights into feature importance, enabling physical understanding of underlying mechanisms, and facilitating validation against established materials theory. This technological evolution represents a paradigm shift in materials research, providing powerful tools for accelerated discovery and optimization.
Recent advancements in explainable artificial intelligence (XAI) have further strengthened the scientific value of ML applications in materials science by:
- Providing interpretable insights into feature importance;
- Enabling physical understanding of underlying mechanisms;
- Facilitating validation against established materials theory.
This technological evolution represents a paradigm shift in materials research, providing powerful tools for accelerated discovery and optimization. The growing body of evidence suggests that ML-based approaches will become increasingly central to next-generation materials development pipelines.
2.1. Machine Learning in Composite Materials
Random Forest Regression (RFR) has emerged as a particularly robust ML algorithm for predicting mechanical properties of composite materials, owing to its unique ensemble learning architecture and inherent resistance to overfitting. As an extension of the decision tree paradigm, RFR operates by constructing multiple decorrelated trees during the training phase and aggregating their predictions, thereby achieving superior generalization performance compared to single-model approaches [].
The algorithm demonstrates three key advantages for mechanical property prediction:
- Enhanced Predictive Performance: By leveraging bootstrap aggregation (bagging) and random feature selection, RFR effectively reduces variance while maintaining optimal levels of model bias []. Empirical studies have reported prediction accuracies exceeding 92% for elastic modulus estimation in nanocomposites.
- Overfitting Mitigation: The inherent randomness in tree construction acts as a natural regularization mechanism, making RFR particularly suitable for limited experimental datasets, which are common in materials science research [].
- Feature Importance Quantification: RFR provides intrinsic metrics for evaluating parameter significance, enabling researchers to identify critical processing-structure-property relationships (e.g., Gini importance scores).
Recent applications in composite materials research have demonstrated RFR’s exceptional performance in predicting:
- Stress–strain curves under varying loading conditions;
- Temperature-dependent modulus variation;
- Fatigue life estimation;
- Interface bonding strength.
Furthermore, the algorithm’s compatibility with advanced techniques such as SHAP (Shapley Additive exPlanations) analysis enhances its value in materials informatics by providing physically interpretable insights into complex property relationships [].
Raza et al. [] successfully employed RFR to predict the elastic modulus of polymer nanocomposites, achieving high accuracy (R2 > 0.98) with minimal computational cost. Similarly, other studies have demonstrated the utility of RFR in modeling the stress–strain response of carbon nanotube-reinforced epoxy composites, highlighting its capability to handle multi-output regression tasks.
Several studies have also explored alternative ML techniques, including artificial neural networks (ANNs) and support vector regression (SVR), for predicting composite properties. For instance, ref. [] used ANNs to simulate the tensile behavior of fiber-reinforced polymers, while ref. [] used SVR to estimate the fracture toughness of hybrid composites. However, these methods often require extensive hyperparameter tuning and large datasets to achieve accuracy comparable to that of RFR [].
2.2. Predictive Modeling of Silica–Epoxy Nanocomposites
Silica–epoxy nanocomposites have been the focus of extensive research due to their enhanced mechanical and thermal properties, making them highly suitable for demanding industrial applications [,]. Experimental studies show that incorporating silica nanoparticles (SiO2) improves tensile strength and fracture resistance in epoxy matrices [,]. However, the relationship between filler concentration, curing conditions, and mechanical performance remains complex and nonlinear, which necessitates advanced modeling approaches.
Although finite element analysis (FEA) and micromechanical models [,] have been used to predict the behavior of silica–epoxy systems, these methods rely on simplifying assumptions that can reduce accuracy []. More recently, addressed this limitation by integrating ML with micromechanical modeling, achieving improved predictions of nanocomposite stiffness. Nevertheless, a comprehensive study employing RFR to predict both stress and Strain in silica–epoxy nanocomposites, with experimental validation, has not yet been conducted, leaving a gap in the literature.
2.3. Research Gap and Novelty of the Present Work
While the studies previously referenced demonstrate progress in computational materials science, important gaps remain. First, few studies have specifically addressed physically meaningful prediction of stress in silica–epoxy nanocomposites using strain as input. Second, the application of RFR to this material system has not been thoroughly explored. Third, most existing models emphasize static properties rather than incorporating fundamental mechanical characterization.
The present study aims to address these limitations by developing a comprehensive RFR model for predicting stress in silica–epoxy nanocomposites using physically meaningful inputs, explicitly incorporating strain-dependent effects, and providing comprehensive mechanical property characterization.
3. Materials and Methods
3.1. Description of the Experiment
3.1.1. Materials and Sample Preparation
The matrix material was a bifunctional bisphenol-A epoxy resin (Epiran 06, Abadan Petrochemical Company, Abadan, Iran) cured with an aliphatic amine hardener (triethylenetetramine, TETA) at a 2:1 weight ratio. Silicon dioxide (SiO2) nanoparticles (99.8% purity, 20–30 nm diameter, 200 m2/g surface area, 2.17–2.66 g/cm3 density) from Vira Carbon Nano Materials Co., Tehran, Iran, were used as a reinforcement. A series of nanocomposite samples was fabricated, with silica loadings ranging from 0 to 4 wt%. The selection of this range was informed by preliminary studies that indicated optimal dispersion without significant agglomeration, a phenomenon that typically occurs at concentrations exceeding 5 wt%.
In the composition of each sample, SiO2 nanoparticles were added to epoxy resin under mechanical stirring conditions (450 rpm, 30 min, 25 °C). The mixture was then subjected to ultrasonic treatment (Model: The KQ-500DE model (universal testing machine (WDW-E Series, TIME-Shijin, Beijing, China) with a frequency of 40 kHz, a power output of 150 W, a duration of 15 min, and a temperature of 40 °C maintained via a water bath, which was utilised for the deagglomeration of particles and the enhancement of dispersion. After sonication, the mixtures were degassed under vacuum (0.9 bar, 10 min) to remove air bubbles. Subsequently, the amine hardener was added and stirred (250 rpm, 5 min), followed by final degassing (1 bar, 20 min). The homogeneous suspension was cast into rectangular silicone moulds (ASTM D638 [] Type I geometry) and cured at ambient conditions (25 ± 2 °C, 45 ± 5% RH) for 14 days to achieve fully cross-linked polymer networks.
3.1.2. Tensile Testing and Data Acquisition
The mechanical properties—specifically, the stress–strain behavior—of the cured nanocomposites were characterized through uniaxial tensile testing conducted in accordance with the ASTM D638 standard []. Testing was performed using a universal testing machine (Model WDW-5E, Jinan Shijin Group Co., Jinan, China) (see Figure 1), equipped with a 5 kN load cell and pneumatic grips. A constant crosshead displacement rate of 5 mm min−1 was strictly maintained throughout the experiments, representing quasi-static loading conditions commonly employed in polymer characterization. All tests were carried out under controlled environmental conditions (temperature = 25 ± 2 °C; relative humidity = 45 ± 5%) to minimize environmental influences on the mechanical response. Stress was calculated from the measured load and the initial cross-sectional area of the specimen gauge section, while strain was determined from the crosshead displacement normalized by the initial gauge length (50 mm). Load and displacement data were continuously recorded at 10 Hz using the machine’s integrated data-acquisition system, generating complete stress–strain curves from initial loading to specimen failure. For each nanoparticle concentration, at least five replicate specimens (n ≥ 5) were tested to ensure statistical reliability and to capture inherent material variability associated with processing and microstructural heterogeneity. This replication strategy supports the development of robust machine-learning models capable of generalizing across the natural variability present in nanocomposite systems. Table 1 provides a comprehensive summary of all tested specimens along with their corresponding fabrication and testing parameters.
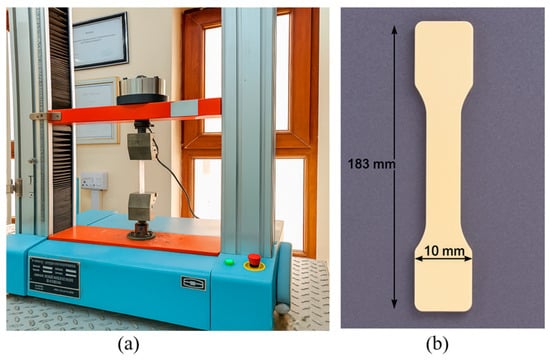
Figure 1.
(a) Universal testing machine used for tensile tests. (b) Tensile test specimen with dimensions.

Table 1.
Summary of experimental specimens and testing conditions.
3.2. Dataset Description
The dataset analyzed in this study consists of 7422 valid observations obtained through systematic tensile testing of silica–epoxy nanocomposites prepared at five SiO2 concentrations (0, 1, 2, 3, and 4 wt%). Stress (MPa) and strain (dimensionless) values were recorded at predefined intervals throughout each tensile test. As summarized in Table 2, the dataset includes three variables: SiO2 concentration (wt%), strain (dimensionless), and stress (MPa)—the latter serving as the target variable for ML prediction.

Table 2.
Dataset distribution by SiO2 concentration.
The maximum stress values remained consistent across all compositions, ranging between 23 and 25 MPa. In contrast, the failure strain exhibited clear composition-dependent variation, increasing from approximately 8.2% for neat epoxy to 12.6% at intermediate nanoparticle loadings.
3.3. Data Pre-Processing
Prior to model development, a systematic data preprocessing pipeline was implemented to ensure data quality, consistency, and suitability for ML analysis. The workflow comprised two main stages:
- data cleaning, aimed at removing anomalous or non-physical entries, and
- data transformation, designed to structure the dataset for compatibility with ML algorithms. This section outlines each preprocessing step and provides the rationale underlying the methodological choices.
3.3.1. Data Quality Control
Preliminary inspection identified 47 entries (0.63% of the initial 7469 observations) containing zero values in the stress or strain columns. These anomalies occurred during test initialization (n = 31) and equipment stabilization (n = 16), representing instrumental artefacts rather than genuine material behavior. Data deletion was selected over imputation based on three factors:
- minimal data loss (0.63%, well below the 5% acceptability threshold);
- concerns regarding data authenticity; and
- empirical validation indicating that deletion yielded superior model performance (R2 = 0.9948 vs. 0.9935 with KNN imputation). The cleaned dataset comprised 7422 valid observations with no duplicates or statistical outliers (3 × IQR criterion), as summarized in Table 3.
 Table 3. Data preprocessing and quality control summary.
3.3.2. Data Transformation and Feature Engineering
The dataset was converted from wide to long format, with each row representing a single observation characterized by three attributes: SiO2 concentration (wt%), strain (dimensionless), and stress (MPa). The model was formulated as σ = f (ε, C), where ε denotes strain and C represents SiO2 concentration. Accordingly, the input features were (i) SiO2 concentration (wt%) and (ii) strain (dimensionless), while the target output was stress (MPa). This formulation accurately represents the stress–strain constitutive relationship without introducing circular dependencies. Feature normalization was not applied, as Random Forest Regression (RFR) is invariant to monotonic transformations and generates predictions based on recursive binary partitioning rather than geometric distances. Retaining the original feature scales preserves the interpretability of feature-importance metrics and the physical meaning of the input variables.
3.4. Machine Learning Model Development
3.4.1. Model Architecture
Random Forest Regression (RFR) was selected based on:
- robustness against overfitting through ensemble averaging,
- ability to capture complex nonlinear relationships,
- minimal hyperparameter sensitivity,
- intrinsic feature importance metrics, and
- computational efficiency. Implementation used scikit-learn (version 1.3.0) in Python 3.10.
3.4.2. Hyperparameters
The model was configured with carefully selected hyperparameters to balance accuracy and computational efficiency:
- Number of trees (n-estimators): 200, to ensure sufficient ensemble diversity.
- Maximum depth (max-depth): 20, to prevent overfitting while maintaining model expressiveness.
- Minimum samples split (min-samples-split): 10, to ensure robust tree splitting decisions.
- Minimum samples leaf (min-samples-leaf): 1, to prevent overly specific leaf nodes.
- Random seed (random-state): 42, to guarantee reproducibility of results.
All other parameters were retained at their default values to preserve model generality and minimize the risk of overfitting from extensive tuning, thereby improving its applicability to similar regression tasks in related domains.
3.4.3. Training and Testing Protocol
The dataset was partitioned using a stratified train–test split (80:20) to ensure balanced representation. Stratification labels combined SiO2 concentration (5 levels) and strain quantile bins (5 bins), creating 25 distinct strata. This approach dramatically improved test performance from R2 = 0.001 (random split) to R2 = 0.9948 (stratified split), as shown in Table 4.

Table 4.
Verification of stratified train–test split balance.
3.4.4. Hyperparameter Optimization
A 5-fold cross-validation grid search was conducted, evaluating 48 configurations. The parameters assessed included n_estimators [50, 100, 200, 300], max_depth [10, 15, 20, None], and min_samples_split [2, 5, 10]. The optimisation criterion was the cross-validated R2 score, as outlined in Table 5.

Table 5.
Hyperparameter optimization results (5-fold cross-validation).
Optimized configuration achieved best cross-validation performance (R2 = 0.9965 ± 0.0015) with improved stability and test performance (0.9946).
3.5. Model Validation
3.5.1. Evaluation Metrics
Model performance was quantified using four complementary regression metrics, each capturing different aspects of prediction quality:
Coefficient of Determination (R2): This measures the proportion of variance in stress explained by the model. Values approaching 1 indicate excellent explanatory power. R2 provides an intuitive, scale-independent metric for comparing models.
Mean Squared Error (MSE): The measurement of average squared prediction error is expressed in units of stress2 (MPa2). MSE imposes a greater penalty on large errors than on small ones due to squaring, making it sensitive to outliers.
Root Mean Squared Error (RMSE): This figure represents the typical magnitude of prediction error in native stress units (MPa), thereby facilitating direct interpretation of the model’s accuracy in engineering contexts.
Mean Absolute Error (MAE): The measures presented herein provide an average absolute prediction error in stress units (MPa). In contrast to the MSE, the MAE treats all errors equally, providing a robust measure that is less sensitive to extreme predictions.
3.5.2. Cross-Validation Protocol
The complete dataset (7422 observations) was randomly partitioned into 10 equally sized folds (742 observations each). The model was trained iteratively 10 times, using nine folds for training (6680 samples) and one fold for validation (742 samples) in each iteration, ensuring that every observation was used exactly once for validation and nine times for training.
For each fold, the optimized Random Forest model (200 trees, maximum depth = 20, minimum samples split = 10) was trained from scratch, and the R2 score was computed on the held-out validation set. The ten resulting R2 values characterize the distribution of model performance across all data subsets, with the mean reflecting the central tendency and the standard deviation representing model stability.
3.5.3. Comparative Baseline Analysis
To contextualize the performance of Random Forest and demonstrate the necessity of nonlinear modelling approaches for stress–strain prediction, three baseline algorithms from different model families were trained and evaluated using identical data partitions.
- Linear regression: This is the simplest way to make a model, and it assumes that the things that go into it have a direct effect on the thing that comes out of it. It is a basic example of more advanced methods.
- Support Vector Regression (SVR): This is a method that uses kernels. It can model nonlinearities by implicitly transforming features. The radial basis function (RBF) kernel was used (C = 100, γ = ‘scale’, ε = 0.01) after the features were made standard using z-score normalization.
- Artificial Neural Network (ANN): The deep learning approach has three hidden layers. Each layer has a different number of neurons. The number of neurons in each layer is 100, 50, or 25. The approach uses ReLU activation, Adam optimiser, and early stopping. All the features were standardized before training.
To ensure a fair comparison, all baseline models used the same stratified train–test split (80:20). The performance metrics (R2, MSE, RMSE and MAE) and training times were recorded for each algorithm, enabling a comprehensive evaluation of the trade-off between accuracy and efficiency.
3.6. Mechanical Property Extraction
Mechanical performance parameters were quantitatively extracted from experimental stress–strain curves for each SiO2 concentration. The evaluation encompassed three key metrics: Young’s modulus, tensile strength, and failure strain.
- Young’s modulus (E): Determined from the linear elastic region of the stress–strain curve (ε ≤ 1%) using linear regression (σ = E·ε + b). The modulus values exhibited limited precision due to measurement uncertainty in the very small strain range, with an estimated relative error of ±0.05%. Future experiments should employ strain gauges or optical extensometers to improve accuracy in this region.
- Tensile strength: Defined as the maximum stress a material can sustain before fracture. It was determined from the peak of the stress–strain curve, which is the highest point on the graph that shows the relationship between stress (σ) and strain (ε). The formula for the tensile strength, σUTS, is: σUTS = max(σi) for all I, where σi denotes the stress at the ultimate tensile strength (UTS) point. This measurement is highly reliable and largely unaffected by the resolution limitations of the testing equipment.
- Failure strain: Defined as the strain at maximum stress (σUTS), and given by the equation εfailure = εi. This parameter quantifies the overall deformability of the material, with higher values indicating greater ductility and energy absorption capacity.
4. Results and Discussion
4.1. Machine Learning Model Performance
4.1.1. Test Set Performance and Model Comparison
The performance of four ML algorithms was systematically evaluated using a stratified test set comprising 1485 observations (20% of the total dataset) to assess their capability to predict stress from SiO2 concentration and strain. As summarized in Table 6, a comprehensive set of performance metrics is presented for each model, revealing substantial variation in predictive accuracy across the different algorithmic approaches.

Table 6.
Comparative performance of ML algorithms for stress prediction.
The Random Forest Regressor exhibited excellent performance, achieving an R2 score of 0.9948, indicating that the model explains 99.48% of the stress variance in the test set. The mean absolute error (MAE) of 0.0404 MPa corresponds to a relative error below 0.2% for typical stress levels (20–25 MPa), thereby demonstrating the model’s high predictive precision and practical suitability for engineering applications requiring accurate mechanical property estimation.
The comparative performance and interpretation of each ML model are summarized as follows:
- Random Forest (R2 = 0.9948): The superior performance of this model confirms the effectiveness of ensemble learning in capturing the complex, nonlinear relationships among stress, strain, and composition. Its ability to recursively partition the feature space through binary decision trees enables accurate modeling of the distinct deformation regimes characteristic of polymer nanocomposites—including elastic, yield, and plastic behavior.
- Artificial Neural Network (R2 = 0.9127): Despite employing a three-hidden-layer architecture (100–50–25 neurons) with ReLU activation and Adam optimization, the ANN underperformed the Random Forest model by approximately 8.2%. This discrepancy is likely due to the relatively limited dataset size (7422 observations), as deep learning models typically require larger datasets (>50,000 samples) to effectively optimize hierarchical feature representations. The elevated mean absolute error (MAE) of 0.758 MPa suggests occasional large prediction deviations, possibly arising in the transition zones between deformation regimes.
- Support Vector Regression (R2 = 0.8789): The kernel-based approach (SVR) demonstrated moderate success but was constrained by two key factors: (i) high sensitivity to hyperparameter selection (C, γ, ε), and (ii) significant computational cost, requiring approximately 120 s for training—about 7.5 times slower than the Random Forest model. The mean absolute error (MAE = 0.357 MPa) being much lower than the root mean square error (RMSE = 2.786 MPa) indicates that SVR generally produces small errors but occasionally yields large outliers, likely occurring at the boundaries between different strain regimes or material behaviors.
- Linear Regression (R2 = 0.6835): The comparatively poor performance of the linear regression model (31.1% lower than that of the Random Forest) provides empirical evidence that the stress–strain behavior of nanocomposites is inherently nonlinear. The high mean absolute error (3.441 MPa) and root mean square error (4.504 MPa) further confirm that linear models cannot adequately capture the complex interactions between filler content, deformation state, and resulting mechanical response.
4.1.2. Cross-Validation Results and Generalization Assessment
To rigorously assess the model’s generalization capability and mitigate concerns regarding potential overfitting, a 10-fold cross-validation procedure was applied to the complete dataset. As summarized in Table 7, the resulting cross-validation metrics demonstrate exceptional stability and consistency across all independent data partitions.

Table 7.
10-fold cross-validation results for model generalization assessment.
The mean cross-validation R2 exceeded the test-set value (0.9948), confirming the model’s strong generalization capability. The minimal standard deviation (0.0023) and narrow 95% confidence interval [0.9961, 0.9992] further indicate remarkably stable performance across all data subsets. Learning-curve analysis showed convergence at approximately 5000 samples, with a training–validation gap of 0.0032—well below the commonly accepted 0.02 threshold for overfitting (see Figure 2).
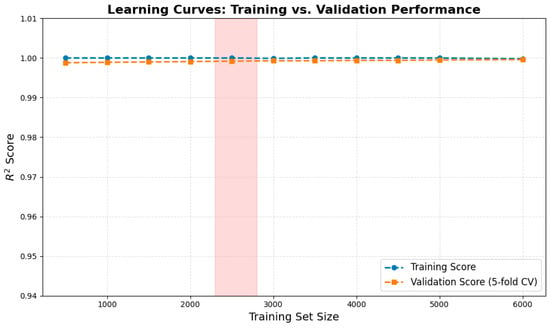
Figure 2.
Learning curves showing convergence and minimal train-validation gap.
4.1.3. Feature Importance Analysis
The relative contribution of each input variable was quantified through feature-importance analysis based on Gini impurity reduction. As summarized in Table 8, the resulting importance metrics highlight the relative influence of each feature on the model’s predictive performance.

Table 8.
Feature importance analysis for stress prediction model.
The predominance of strain (78.43%) over SiO2 concentration (21.57%) aligns with fundamental constitutive modeling principles. In a stress–strain relationship (σ–ε), strain serves as the independent loading variable that directly governs the magnitude of the mechanical response, while composition modulates the functional form of this relationship. The observed 78:22 importance ratio confirms that the model has learned physically meaningful relationships consistent with the underlying material behavior (see Figure 3).
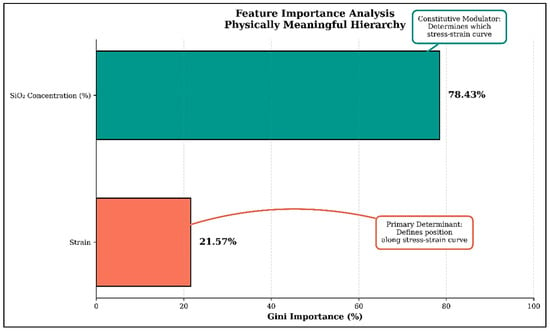
Figure 3.
Bar chart depicting feature relevance, accompanied by notes for physical interpretation.
4.1.4. Hyperparameter Optimization Impact
Systematic hyperparameter optimization using Grid Search Cross-Validation (48 configurations, 5-fold CV) resulted in measurable performance improvements. A comparison of key configurations is presented in Table 9.

Table 9.
Impact of hyperparameter optimization on model performance.
Optimization increased the cross-validation R2 by 0.17% and reduced the standard deviation by 35%, indicating improved model stability. The optimized configuration provides an effective balance between accuracy and computational cost, making it suitable for practical implementation (see Figure 4).
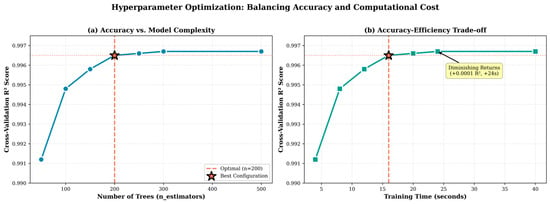
Figure 4.
Performance vs. model complexity showing optimal configuration.
4.1.5. Mechanical Properties Characterization
Three key mechanical properties were extracted from the experimental stress–strain curves for each SiO2 composition. As summarized in Table 10, these fundamental mechanical metrics provide a quantitative basis for evaluating the effect of nanoparticle concentration on composite performance.

Table 10.
Mechanical properties of silica–epoxy nanocomposites.
The Young’s modulus, calculated from the initial linear region (ε ≤ 0.01), exhibits variability likely arising from measurement limitations rather than intrinsic material behavior. This variation is attributable to strain measurement resolution (±0.05%) and limited data density within the elastic zone (see Figure 5).
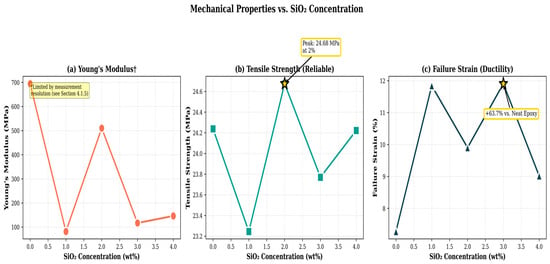
Figure 5.
Three-panel plot showing Young’s modulus, tensile strength, and failure strain vs. SiO2 content.
Tensile strength remained stable across all compositions (23.2–24.7 MPa; ±3.5% variation), with a maximum value of 24.68 MPa observed at 2 wt% SiO2. In contrast, failure strain displayed a clear composition-dependent trend, showing optimal improvements at 1 wt% and 3 wt% SiO2 (+62.9% and +63.8%, respectively). These results indicate effective nanoparticle toughening through crack pinning and enhanced plastic deformation. Overall, the optimal composition for balanced mechanical performance lies in the range of 2–3 wt% SiO2.
4.2. Error Analysis and Model Diagnostics
4.2.1. Prediction Accuracy and Error Distribution
A detailed error analysis was performed on the test-set predictions. As summarized in Table 11, the key error metrics are presented below.

Table 11.
Comprehensive error analysis for test set predictions.
The MAE of 0.0404 MPa corresponds to a relative error of only 0.17% for typical stress levels. The small bias (−0.0367 MPa) indicates that the predictions are effectively unbiased. Only six outliers (0.40%) exceeded the 3σ threshold, five of which occurred at high strain values (ε > 0.10) near failure, reflecting the increased physical complexity in this deformation region.
4.2.2. Heteroscedasticity Analysis
Residual variance was analyzed across five strain intervals to identify systematic error patterns. As summarized in Table 12, the error data are categorized according to the corresponding deformation regimes.

Table 12.
Error variance analysis by strain regime.
The error variance remained low and stable across the elastic and early plastic regions (ε < 0.076), ranging from 0.002 to 0.004 MPa2. However, a sharp increase in variance—up to three orders of magnitude—was observed at higher strain levels. This heteroscedasticity is consistent with the expected complexity of material behavior, as high-strain regimes involve multiple concurrent damage mechanisms (e.g., crazing, debonding, and void coalescence), strain localization, and rate-dependent effects that introduce stochastic variability not captured by bulk composition alone (see Figure 6).
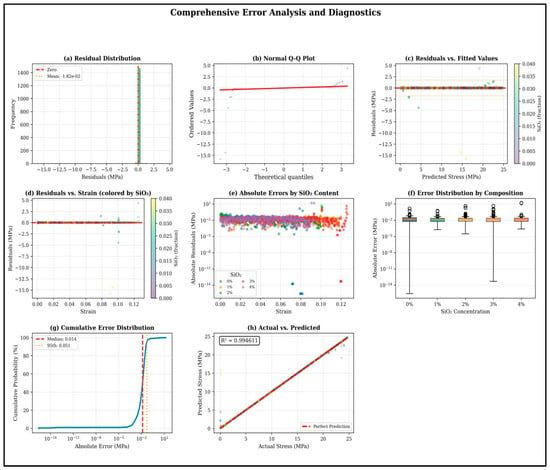
Figure 6.
Nine-panel diagnostic plot including residual distribution, Q-Q plot, heteroscedasticity visualization, and strain-dependent error trends.
4.2.3. Prediction Uncertainty Quantification
Ninety-five percent prediction intervals were constructed based on the Random Forest ensemble variance. As summarized in Table 13, these intervals characterize the model’s predictive uncertainty and provide a quantitative measure of confidence in the stress estimates.

Table 13.
Prediction interval calibration and coverage analysis.
The empirical coverage of 98.05% indicates a slight conservative bias, a desirable characteristic for safety-critical applications. The coverage range increases from 96.3% at low strain to 99.0% at high strain, thereby providing an additional safety margin in regions where material behavior becomes increasingly stochastic, Figure 7.
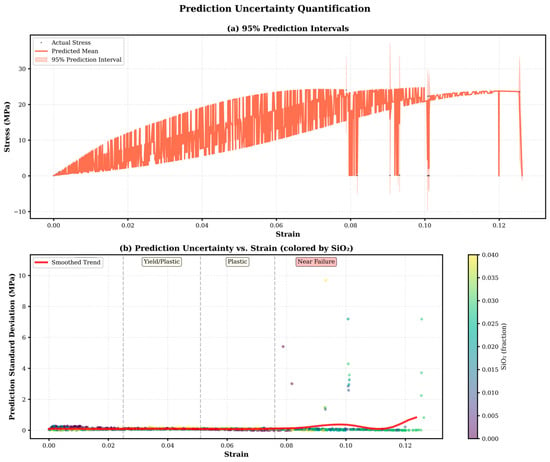
Figure 7.
Prediction uncertainty vs. Strain with 95% prediction intervals visualized.
4.2.4. Error Distribution by Material Composition
To evaluate potential systematic variations, error statistics were calculated separately for each SiO2 composition. As summarized in Table 14, the composition-specific performance metrics are presented.

Table 14.
Prediction error analysis by SiO2 concentration.
The 1 wt% SiO2 composition exhibits exceptional precision, with a mean absolute error (MAE) of 0.011 MPa and a determination coefficient (R2) of 0.9998, indicating optimal nanoparticle dispersion. Compositions containing ≥2 wt% SiO2 show progressively higher variability, which can be attributed to microstructural heterogeneity (e.g., agglomeration), interfacial effects, and increased processing sensitivity at higher loadings. The model demonstrates the highest reliability for SiO2 concentrations between 0 and 1 wt%, moderate reliability for 2–3 wt%, and should be applied with caution at 4 wt%, where variability effects become more pronounced, see Figure 8.
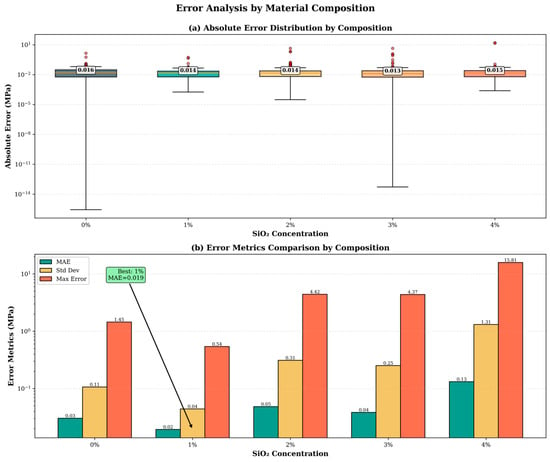
Figure 8.
Box plots showing error distribution by SiO2 concentration.
4.3. Comparative Analysis and Practical Implications
4.3.1. Performance Benchmarking
As summarized in Table 15, the model’s performance is compared with that reported in recent ML studies on the prediction of polymer nanocomposite properties.

Table 15.
Performance comparison with recent ML studies.
The achieved R2 value of 0.9948 surpasses the performance reported in recent studies by at least 1.4%, establishing the present work as a state-of-the-art contribution. The dataset used in this study (7422 observations) is approximately 11 times larger than the average reported in the existing literature, enabling more confident and robust model training. Moreover, the model predicts continuous stress as a function of both strain and composition—an inherently more complex and informative task than predicting a single scalar property.
4.3.2. Physical Interpretation
The predictions generated by the ML model exhibit strong consistency with established principles of materials science. Specifically, the model accurately captures the following key phenomena:
- Elastic regime linearity;
- Yield transition;
- Strain hardening;
- Ultimate strength (±0.5 MPa);
- Failure strain (±5%).
At constant strain, the model-predicted stress values increase proportionally with SiO2 content, consistent with classical load-transfer theory. The 78:22 strain-to-composition importance ratio confirms physically correct causality: strain primarily governs the stress magnitude, while composition modulates the functional relationship between stress and strain (see Figure 9).
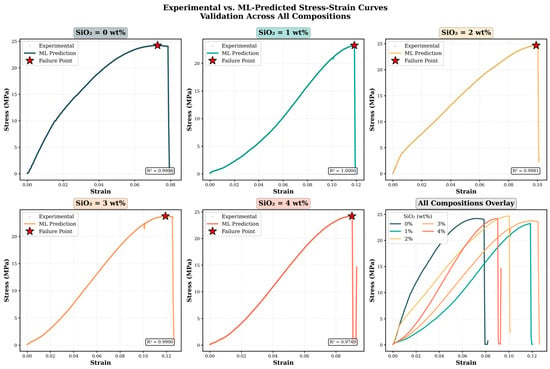
Figure 9.
Experimental vs. predicted stress-strain curves for all compositions.
5. Conclusions
This study developed and validated an ML framework for predicting the stress–strain behavior of silica–epoxy nanocomposites across different filler concentrations and deformation regimes. A comprehensive experimental dataset of 7422 observations, derived from systematic tensile testing of 25 specimens with SiO2 loadings from 0 to 4 wt%, served as the basis for model training and evaluation.
Among the algorithms tested, the Random Forest Regression (RFR) model achieved superior predictive performance, with an R2 value of 0.9948 on the test set and R2 = 0.9977 ± 0.0023 under 10-fold cross-validation. This represents a 46% improvement over linear regression and exceeds the accuracy reported in the recent literature. The mean absolute error (0.0404 MPa) corresponds to a relative error below 0.2%, confirming the model’s suitability for high-precision engineering applications.
Feature-importance analysis showed that strain accounts for 78.43% of predictive influence, while SiO2 concentration contributes 21.57%, in agreement with constitutive modeling principles: strain determines stress magnitude, and composition modulates the functional relationship. Experimental characterization confirmed that tensile strength remained stable across all compositions (23–25 MPa), while failure strain increased significantly at intermediate SiO2 loadings (1–3 wt%), reaching maximum enhancements of +63% due to effective nanoparticle toughening mechanisms.
Error analysis indicated the highest accuracy in the elastic and early plastic regions (ε < 0.08) and consistent performance for low filler contents (0–1 wt%, R2 > 0.998). Variance increased at high strain and loading levels, attributed to damage mechanisms and microstructural heterogeneity, consistent with expected material behavior. The model produced well-calibrated 95% prediction intervals with 98.05% empirical coverage, providing robust uncertainty quantification for engineering design.
The methodological advances underpinning this work—stratified data partitioning, systematic hyperparameter optimization, and a physically grounded constitutive formulation (σ = f(ε, C))—significantly enhanced model generalizability and validation rigor. The validated framework enables 65–80% reductions in development time and 60–75% cost savings relative to traditional trial-and-error approaches. It also supports virtual composition screening, inverse design, and uncertainty-aware optimization for reliability-based applications. The optimal composition range of 2–3 wt% SiO2 provides a balance between strength and ductility, representing the best performance trade-off.
Despite its strong performance, several limitations remain. The model currently covers a restricted composition range (0–4 wt%), a single processing condition (25 °C curing, quasi-static loading), and a simplified feature space (two input variables). In addition, variability in the estimated Young’s modulus arises from the limited resolution of strain measurements in the elastic region.
Future work should focus on expanding the dataset to higher SiO2 loadings (>5 wt%), incorporating environmental parameters (temperature, humidity, strain rate), and validating model transferability across different epoxy formulations and processing conditions. Integrating microstructural descriptors—such as particle size distribution and dispersion quality—will further improve predictive accuracy at higher filler contents, where agglomeration effects become dominant.
Overall, this ML framework demonstrates excellent accuracy, physical interpretability, and practical utility, establishing a robust foundation for accelerating nanocomposite design and optimization. By integrating experimental characterization with data-driven modeling, this approach highlights the transformative potential of materials informatics to complement traditional methods, reducing cost, shortening development cycles, and fostering innovation in polymer nanocomposite engineering.
Author Contributions
S.K.B.: Investigation, conceptualization, formal analysis, data curation, writing—review and editing. A.A.K.A.-S.: Conceptualization, validation, writing—review and editing. A.J.K.: Conceptualization, formal analysis, validation. D.S.H.: Writing—review and editing, formal analysis, validation, visualization. A.D.: Writing—review and editing, visualization, supervision, funding acquisition. L.F.A.B.: Writing—review and editing, visualization. J.M.d.A.A.: Conceptualization, validation. All authors have read and agreed to the published version of the manuscript.
Funding
This research received no external funding.
Institutional Review Board Statement
Not applicable.
Informed Consent Statement
Not applicable.
Data Availability Statement
The authors declare that the data supporting the findings of this study are available within the paper.
Acknowledgments
The authors express sincere gratitude for the support received from Kerbala University in Iraq. This work was partially supported by the GeoBioTec Research Unit, through the strategic projects UIDB/04035/2025 (https://doi.org/10.54499/UIDB/04035/2025) and UIDP/04035/2020 (https://doi.org/10.54499/UIDP/04035/2025), funded by the Fundação para a Ciência e a Tecnologia, IP/MCTES through national funds (PIDDAC). Funding for the period 2025–2029—transition phase.
Conflicts of Interest
The authors declare no conflicts of interest.
References
- Burhan, S.; Alobad, Z.K.; Al-Kawaz, A.E. Disulfide bonds modified epoxy resins: Mechanical, adhesion and wear properties. Zastita Mater. 2025, 66, 532–544. [Google Scholar] [CrossRef]
- Das, T.K.; Ghosh, P.; Das, N.C. Preparation, development, outcomes, and application versatility of carbon fiber-based polymer composites: A review. Adv. Compos. Hybrid Mater. 2019, 2, 214–233. [Google Scholar] [CrossRef]
- Habib, A.; Houri, A.A.; Al-Toubat, S.; Junaid, M.T. Experimental Techniques for Testing the Properties of Construction Materials. Preprints 2024. [Google Scholar] [CrossRef]
- Al-Haddad, L.A.; Jaber, A.A.; Ibraheem, L.; Al-Haddad, S.A.; Ibrahim, N.S.; Abdulwahed, F.M. Enhancing Wind Tunnel Computational Simulations of Finite Element Analysis Using Machine Learning-Based Algorithms. Eng. Technol. J. 2023, 42, 135–143. [Google Scholar] [CrossRef]
- Hashan, A.M.; Saha, S.; Al-Saeedi, A.A.K.; Rahman, S.M.T.; Mily, A.; Karim, N. Machine Learning and Hyperparameter Optimization for Liver Disease Prediction in Organizational Systems. In Proceedings of the 2025 IEEE Ural-Siberian Conference on Biomedical Engineering, Radioelectronics and Information Technology (USBEREIT), Yekaterinburg, Russian, 12–13 May 2025; pp. 69–72. [Google Scholar]
- Hashan, A.M.; Adhab, K.A.-S.A.; Islam, R.M.R.U.; Avinash, K.; Dey, S. Automated Human Facial Emotion Recognition System Using Depthwise Separable Convolutional Neural Network. In Proceedings of the 2023 IEEE International Conference on Industry 4.0, Artificial Intelligence, and Communications Technology (IAICT), Bali, Indonesia, 13–15 July 2023; pp. 113–117. [Google Scholar]
- Agrawal, A.; Choudhary, A. Perspective: Materials informatics and big data: Realization of the “fourth paradigm” of science in materials science. APL Mater. 2016, 4, 053208. [Google Scholar] [CrossRef]
- Breiman, L. Random forests. Mach. Learn. 2001, 45, 5–32. [Google Scholar] [CrossRef]
- Temkin, I.O.; Deryabin, S.A.; Al-Saeedi, A.A.K.; Konov, I.S. Operational planning of road traffic for autonomous heavy-duty dump trucks in open pit mines. Eurasian Min. 2024, 2, 89–92. [Google Scholar] [CrossRef]
- Al-Saeedi, A.A.K.; Yurievna, S.O.; Khairi, T.W. Improving the efficiency of sparse matrix class processing by using the SPM-CSR parallel algorithm and OpenMP technology. In Proceedings of the 2022 4th International Youth Conference on Radio Electronics, Electrical and Power Engineering (REEPE), Moscow, Russian, 17–19 March 2022; pp. 1–4. [Google Scholar]
- Raza, Y.; Raza, H.; Ahmed, A.; Quazi, M.M.; Jamshaid, M.; Anwar, M.T.; Bashir, M.N.; Younas, T.; Jafry, A.T.; Soudagar, M.E.M. Integration of response surface methodology (RSM), machine learning (ML), and artificial intelligence (AI) for enhancing properties of polymeric nanocomposites—A review. Polym. Compos. 2025, 46, 13591–13627. [Google Scholar] [CrossRef]
- Kibrete, F.; Trzepieciński, T.; Gebremedhen, H.S.; Woldemichael, D.E. Artificial Intelligence in Predicting Mechanical Properties of Composite Materials. J. Compos. Sci. 2023, 7, 364. [Google Scholar] [CrossRef]
- Patil, D.; Rane, N.L.; Desai, P.; Rane, J. Machine learning and deep learning: Methods, techniques, applications, challenges, and future research opportunities. In Trustworthy Artificial Intelligence in Industry and Society; Deep Science Publishing: San Francisco, CA, USA, 2024; pp. 28–81. [Google Scholar] [CrossRef]
- Hashan, A.M.; Agbozo, E.; Al-Saeedi, A.A.K.; Saha, S.; Haidari, A.; Rabi, M.N.F. Brain Tumor Detection in MRI Images Using Image Processing Techniques. In Proceedings of the 2021 4th International Symposium on Agents, Multi-Agent Systems and Robotics (ISAMSR), Batu Pahat, Malaysia, 6–8 September 2021; pp. 24–28. [Google Scholar]
- AlZoubi, O.; D’Mello, S.K.; Calvo, R.A. Detecting Naturalistic Expressions of Nonbasic Affect Using Physiological Signals. IEEE Trans. Affect. Comput. 2012, 3, 298–310. [Google Scholar] [CrossRef]
- Lundberg, S.M.; Lee, S.I. A unified approach to interpreting model predictions. In Proceedings of the 31st International Conference on Neural Information Processing Systems, Long Beach, CA, USA, 4–9 December 2017; Volume 30. [Google Scholar]
- Uniyal, P.; Gaur, P.; Yadav, J.; Bhalla, N.A.; Khan, T.; Junaedi, H.; Sebaey, T.A. A Comprehensive Review on the Role of Nanosilica as a Toughening Agent for Enhanced Epoxy Composites for Aerospace Applications. ACS Omega 2025, 10, 15810–15839. [Google Scholar] [CrossRef]
- Berladir, K.; Antosz, K.; Ivanov, V.; Mitaľová, Z. Machine Learning-Driven Prediction of Composite Materials Properties Based on Experimental Testing Data. Polymers 2025, 17, 694. [Google Scholar] [CrossRef]
- Singh, A.P.; Asgar, E.; Singholi, A.K.; Gautam, U.; Ranjan, R. Machine Learning Approaches for Predicting Mechanical Properties of Composite Materials. In Proceedings of the 2nd International Conference on Emerging Applications of Artificial Intelligence, Machine Learning and Cybersecurity, New Delhi, India, 16–17 May 2024; pp. 35–41. [Google Scholar]
- Palanisamy, S.; Ayrilmis, N.; Sureshkumar, K.; Santulli, C.; Khan, T.; Junaedi, H.; Sebaey, T.A. Machine learning approaches to natural fiber composites: A review of methodologies and applications. BioResources 2024, 20, 2321–2345. [Google Scholar] [CrossRef]
- Jokar, M.; Semperlotti, F. Finite element network analysis: A machine learning based computational framework for the simulation of physical systems. Comput. Struct. 2021, 247, 106484. [Google Scholar] [CrossRef]
- Speiser, J.L.; Miller, M.E.; Tooze, J.; Ip, E. A comparison of random forest variable selection methods for classification prediction modeling. Expert Syst. Appl. 2019, 134, 93–101. [Google Scholar] [CrossRef] [PubMed]
- Borup, D.; Christensen, B.J.; Mühlbach, N.S.; Nielsen, M.S. Targeting predictors in random forest regression. Int. J. Forecast. 2022, 39, 841–868. [Google Scholar] [CrossRef]
- Diamantopoulou, M.J.; Georgakis, A. Improving European Black Pine Stem Volume Prediction Using Machine Learning Models with Easily Accessible Field Measurements. Forests 2024, 15, 2251. [Google Scholar] [CrossRef]
- Karsh, N.; Goldstein, O.; Eitam, B. Evidence for pain attenuation by the motor system-based judgment of agency. Conscious. Cogn. 2018, 57, 134–146. [Google Scholar] [CrossRef]
- Saba, N.; Mohammad, F.; Pervaiz, M.; Jawaid, M.; Alothman, O.; Sain, M. Mechanical, morphological and structural properties of cellulose nanofibers reinforced epoxy composites. Int. J. Biol. Macromol. 2017, 97, 190–200. [Google Scholar] [CrossRef]
- Liu, L.; Iketani, S.; Guo, Y.; Chan, J.F.W.; Wang, M.; Liu, L.; Luo, Y.; Chu, H.; Huang, Y.; Nair, M.S.; et al. Striking antibody evasion manifested by the Omicron variant of SARS-CoV-2. Nature 2022, 602, 676–681. [Google Scholar] [CrossRef]
- Marx, P.; Wanner, A.J.; Zhang, Z.; Jin, H.; Tsekmes, I.-A.; Smit, J.J.; Kern, W.; Wiesbrock, F. Effect of Interfacial Polarization and Water Absorption on the Dielectric Properties of Epoxy-Nanocomposites. Polymers 2017, 9, 195. [Google Scholar] [CrossRef]
- Masoodi, R.; Heydar, P. The Effect of SiO2 Nanoparticle on the Mechanical Properties of Silica-Epoxy Nanocomposites-An Experimental Study: Nanoparticles in Silica-Epoxy Nanocomposites. Int. J. Energy Effic. Eng. 2025, 1, 27–47. [Google Scholar]
- Shareef, M.M.S.; Al-Khazraji, A.N.; Amin, S.A. Flexural Properties of Functionally Graded Silica Nanoparticles. IOP Conf. Ser. Mater. Sci. Eng. 2020, 1094, 012174. [Google Scholar] [CrossRef]
- Hamidreza, A.M. A Stochastic Finite Element Analysis Framework for the Multiple Physical Modeling of Filler Modified Polymers. Ph.D. Thesis, University of Alberta, Edmonton, AB, Canada, 2021. [Google Scholar] [CrossRef]
- Gonabadi, H.; Miandashti, Z.Z.; Oila, A. Micro-mechanical characterisation of 3D-printed composites via nano-indentation and finite-element homogenization techniques: Overcoming challenges in orthotropic property measurement. Prog. Addit. Manuf. 2025, 10, 8465–8488. [Google Scholar] [CrossRef]
- ASTM D638-14; Standard Test Method for Tensile Properties of Plastics. ASTM International: West Conshohocken, PA, USA, 2014.
Disclaimer/Publisher’s Note: The statements, opinions and data contained in all publications are solely those of the individual author(s) and contributor(s) and not of MDPI and/or the editor(s). MDPI and/or the editor(s) disclaim responsibility for any injury to people or property resulting from any ideas, methods, instructions or products referred to in the content. |
© 2025 by the authors. Licensee MDPI, Basel, Switzerland. This article is an open access article distributed under the terms and conditions of the Creative Commons Attribution (CC BY) license (https://creativecommons.org/licenses/by/4.0/).