Article

Characterization of Interlaminar Friction during the Forming Processes of High-Performance Thermoplastic Composites

1
AMADE-UdG Research Group, University of Girona, 17003 Girona, Spain
2
Applus+ Laboratories, 08193 Bellaterra, Spain
*
Authors to whom correspondence should be addressed.
J. Compos. Sci. 2024, 8(2), 38; https://doi.org/10.3390/jcs8020038
Submission received: 5 December 2023 / Revised: 28 December 2023 / Accepted: 15 January 2024 / Published: 23 January 2024
(This article belongs to the Special Issue Characterization and Modelling of Composites, Volume III)

Abstract

:
Friction is a pivotal factor influencing wrinkle formation in composite material shaping processes, particularly in novel thermoplastic composites like polyetheretherketone (PEEK) and low-melting polyaryletherketone (LM-PAEK) matrices reinforced with unidirectional carbon fibers. The aerospace sector lacks comprehensive data on the behavior of these materials under forming conditions, motivating this study’s objective to characterize the interlaminar friction of such high-performance thermoplastic composites across diverse temperatures and forming parameters. Differential scanning calorimetry (DSC) and dynamic mechanical analysis (DMA) were employed to analyze the thermomechanical behaviors of PEEK and LM-PAEK. These data guided friction tests covering room-to-forming temperatures. Horizontal pull-out fixed-plies tests were conducted to determine the friction coefficient and shear stress dependency concerning temperature, pressure, and pulling rate. Below the melting point, both materials adhered to Coulomb’s law for friction behavior. However, above the melting temperature, PEEK’s friction decreased while LM-PAEK’s friction increased with rising temperatures. These findings highlight the distinct responses of these materials to temperature variations, pulling rates, and pressures, emphasizing the need for further research on friction characterization around glass transition and melting temperatures to enhance our understanding of this phenomenon.

1. Introduction

Interlaminar slippage is an essential condition that must be promoted while manufacturing a composite part using any full-thickness production process. The sliding between plies is key to allowing the fibers of each layer to adapt to the geometry, whether it has a single or double curvature [1]. If this sliding is blocked, a compression zone is created in the geometry’s inner radius due to the incompressibility and non-extensibility of the fibers, which may induce wrinkles depending on the difference in length caused by the variation in radius across the thickness (See Figure 1).
Despite the importance of this phenomenon during the forming process, there is no standardized method for characterizing interlaminar slippage in composite materials to help simulate the forming processes. This has led several researchers [1,2,3,4,5,6,7,8,9] to develop alternative methods for this purpose. These methods usually consist of pulling a sample of composite located between two other material plies, which can be of the same material or not, depending on the type of friction to be characterized. The configuration of the systems varies depending on the study’s authors; the most commonly used are the pull-through and the pull-out tests. Experiments generally focus on characterizing friction as a function of process variables. In the case of composites, temperature, pressure, pulling rate, and orientation of the fibers are the most notable parameters, according to Murtagh et al. [2,3].
One of the most relevant aspects to study is the effect of temperature due to its relationship with viscosity and the polymer structure. Usually, research around these topics focuses on the characterization of the materials once the matrix has melted, in other words, above melting temperatures in all of the samples. The main reason is that in the majority of processes (i.e., press-forming), the material is formed when the matrix is molten, thus the interlaminar slippages occur under such conditions. Scherer et al. [4] showed that due to the fluidity of the material, a layer of resin is formed between the different plies of the stack, implying a viscous-driven friction behavior. They also observed that the shear stress increases with increasing pulling rate while increasing the temperature reduces the slip resistance due to the thermoplastic viscosity reduction. It was also observed that the resistance was proportional to the pressure and that it depended on the orientation of the relative fibers.
The A+ Glide Forming production technology [10,11,12,13] is a continuous and dynamic process, with low pressures and high production rates compared to the more commonly employed technologies [14,15,16]. Thus, to understand the friction behavior in every phase of the material and define a forming strategy that could minimize the friction of the current processes to avoid wrinkle formation, the material needs to be characterized for the entire temperature range. For this reason, a study of friction using a wider temperature range has been proposed that aims to identify which phenomena predominate in each of the phases of the matrix. Consequently, in this paper, an experiment of horizontal pull-out tests inspired by Scherer et al. [4] is proposed and carried out on two of the most common thermoplastic composite materials in the aeronautical industry today: UD-CF/PEEK and UD-CF/LM-PAEK.
This paper describes the methodology and experimental design, followed by the results from the previous characterization tests (DSC and DMA), and the results and discussions from the friction experiments for both materials. Next, the results of the pulling rate and pressure dependencies are discussed and, finally, the last section contains some brief conclusions and proposals to continue researching the subject.

2. Materials and Methods

Differential scanning calorimetry (DSC) and dynamic mechanical analysis (DMA) were performed to characterize the thermal-dependent properties of both materials. From these standardized tests, the target temperatures were defined. Thus, the pull-out test was designed following these results, aiming to characterize the full spectrum of temperatures.

2.1. Materials

Two thermoplastic materials were compared in this experiment: the UD LM-PAEK/CF composite from Toray (Toray Cetex TC1225, T700, 134 gsm FAW, 34 wt% RC) and the UD PEEK/CF composite from Cytec (Cytec APC2 PEEK, AS4, 145 gsm FAW, 34 wt% RC). Table 1 and Table 2 show the main properties and temperatures of both materials.

2.2. Pull-Out Test Description

The experimental methodology proposed to obtain the friction coefficient and the shear stress is a horizontal pull-out fixed-plies test. Figure 2 describes the experimental setup. A composite specimen (free laminate) lies in between two fixed composite laminates (fix laminate) and is pulled out at a constant speed while applying a normal load under different temperatures, speeds, and normal force conditions.
The three laminates are placed between two heated aluminum plates that cover the overlapping surface and are used to homogenize the specimens’ temperature. These plates are heated with heating blankets and their temperatures are measured with two thermocouples embedded inside the plates near the contact surface. Above the rig is a plate used to homogenize the pressure over the overlapping surface. A guided load cell is placed at the end of the free-moving ply to measure the friction force of the experiment. The idea behind the guided load cell is to avoid interferences resulting from bending moments during the measurements.
The experiment starts by heating the whole system. Once the target temperature is reached, a settling time of two minutes is used to homogenize the temperature of the specimen. After, the pulling device pulls the middle specimen at a constant speed U, while the outer laminates are clamped to the bench. The guided load cell measures the pull-out force which represents two times the friction force.

2.3. Samples

For the current study, only the 0° ply direction was considered. According to Murtagh [2,3], the friction coefficient is maximum when the orientation of the plies in contact is 0°–0° when the material is melted. As he explained, during consolidation, the fibers that are parallel can intermingle and combine with fibers from other plies, leading to no apparent resin-rich layer between plies.
Each laminate of the specimen (two fixed and one free according to Figure 2) consists of three 140 mm × 30 mm rectangular individual plies. The overlapping area had a length of 50 mm. The other 90 mm were used to clamp the plies to the rig.

2.4. Test Conditions

Table 3 summarizes the test conditions for both materials. As has been stated, the selected temperatures were focused on the study of the overall temperature range and were determined from the results shown in Figure 3 and Figure 4. Normal force and pulling rates were selected to be representative of existing production processes. Each of the test conditions was replicated three times to ensure the repeatability of the results.

3. Results and Discussions

3.1. Differential Scanning Calorimetry

Three DSCs were carried out for each material using a DSC Q2000 testing machine, following the procedures described in the standard AITM3-0027/UNE–EN ISO 11357. The heating rate of the test was 20 °C/min while the cooling rate was 10 °C/min.
Figure 3 shows the results of the DSC performed on an APC2/AS4 sample and a TC1225/T700 sample. Two heating/cooling cycles were carried out on each of the samples to erase any defects in the processing of the material and ensure that the results are under what is expected for a semi-crystalline material.
As can be seen in the TC1225/T700 plot, during the first (green) and second (gray) cycles, there is a slight variation in the heating flow—around 150 °C. At this temperature, there is an endothermic kink in the heat flow that can be related to the glass transition temperature (T_g). In semi-crystalline polymers, when this temperature is reached, enough kinetic energy is provided to break the entanglement and mechanical bonds between the molecular chains that form the amorphous phase. This causes an increase in molecular mobility, giving the material a more rubbery and ductile behavior; from this point on, the heat capacity of the material is higher.
However, in the APC2/AS4 plot, this peak cannot be seen. The absence of the glass transition peak could be easily explained due to the low concentration of the amorphous phase of the polymer in the composite sample. Because PEEK is a high-crystallinity polymer and the amount of matrix in the APC2/AS4 material is relatively low (34%), the chances of detecting this amorphous part in a DSC are quite low. However, using other techniques, such as the DMA, this transition can be detected, as seen in Figure 4.
The presence and absence of the glass transition temperature highlight the first difference between both materials: the TC1225/T700 material has a matrix with a higher concentration of amorphous phase.
The TC1225/T700 sample also presents an exothermic peak around 195 °C. This peak indicates that there is a cold crystallization process happening. These results agree with the presence of the glass transition kink.
TC1225/T700 and APC2/AS4 materials should have similar results at DSCs since they are similar materials (in both, the resin content is 34% and they have a similar degree of crystallinity). However, the differences between them seem to indicate that the TC1225/T700 material is amorph and not crystalline. The lack of a crystalline phase could be explained because of the manufacturing process of the raw material, i.e., the cooling rate may be faster than the crystallization kinetics of the matrix.
During the second cycle of the TC1225/T700, the glass transition peak disappears and the results are more similar to the ones observed in the APC/AS4 figure. This aspect related to the matrix polymeric structure may also have incidences if the processing of the material requires various stages or is continuous (i.e., A+ glide forming [10,11,12,13], continuous compressing molding [17]). During fabrication with these methods, the full laminate is laid on a heated tool (200–250 °C) while the part is formed from one side to the other using a mobile heating zone. If the time that the laminate is on the tool is long enough, the crystallization process will start, leading to a case where the material being formed is an amorphous thermoplastic at the start of the part but a semi-crystalline thermoplastic at the end, without any machine setting being changed. Thus, part quality may be affected.
The next observable phenomenon is the endothermic dip corresponding to the melting temperature. At this point, all the energy that is being introduced into the system is used to break molecular interactions and not to raise the temperature of the material. In this way, the polymer chains are free to move around without any ordered arrangements. Once all the material is melted, the energy added to the sample starts increasing the temperature again. Above this point, the materials flow with a liquid-like behavior. The TC1225/T700 graph shows how this dip takes place around 303 °C, while the peak range is between 280 °C and 315 °C. In the APC2/AS4 sample, the melting temperature is 341 °C and its peak range is between 290 °C to 355 °C. Finally, during the cooling cycle, the re-arrangement of the molecular chain occurs at around 250 °C for TC1225/T700 and 291 °C for APC2/AS4. At this temperature (T_c), part of the polymer chains order themselves thanks to their high mobility if there is enough time.

3.2. Dynamic Mechanical Analysis

A DMA test was carried out for each material to understand better the behavior of the material under similar forming conditions [10]. During the forming process, the material undergoes a sequence of phase transitions that intrinsically affect its mechanical properties. It is imperative to understand how these properties change in order to take advantage of them when developing new forming processes. For this reason, a dual cantilever test was performed adapting the processes described in the ASTM D4065. A heating rate of 20 °C/min and a frequency of 10 Hz were used to reassemble the glide-forming process. Each sample consisted of 13 plies of consolidated laminate of 17.5 mm in length, 10.16 mm in width, and thicknesses of 1.747 mm (TC1225/T700) and 1.723 mm (APC2/AS4).
DMA results observed in Figure 4 confirm the relevant temperatures obtained in the DSC test. Both plots have the same tendencies as a generic semi-crystalline polymer. There are three differentiated regions according to the three differentiated states of the polymer. Around the glass transition temperature, there is a peak in the loss modulus and the damping (tan(δ)). At this transition zone (known as the leathery region), the samples become less hard and lose storage modulus, while the damping continues to increase for a while. The specimen is tough but flexible thanks to an increase in chain mobility. After this zone, there is the second region known as the rubbery plateau. At this stage, the material is less springy, thus it better maintains the deformations. However, the damping has not increased enough to be significant compared to the previous region. Large-scale chain movements are the cause of this behavior. A second transition region is seen around the melting temperature (Tm). At this moment, there is a dip in the storage modulus, with a corresponding increase in the damping. This region, called the viscous region, is characterized by the sample starting to flow as the temperature is increased and the crystals are melted. Finally, above the melting temperature, there is the fluid region, where the matrices can flow. Chain slippage is present. Above melting temperature, the polymer chains have free mobility. However, due to the complexity of the molecular chains of this semi-crystalline, the viscosity in this region is not expected to decrease too much concerning the previous transition area if it is compared to any amorphous polymer.
As was expected, the APC2/AS4 response is akin to the TC1225/T700. However, the difference between both materials is noticeable. The decrease in the storage modulus of the APC2/AS4 between the glassy plateau and the rubbery plateau is less abrupt than in the TC1225/T700 plot. The same takes place after the melting temperature, where the variation falls in the storage modulus of the APC2/AS4; although relevant, this is of less magnitude than that for the TC1225/T700. These tendencies are also reflected in the loss storage modulus and damping plots. For the APC2/AS4 sample, the peak near the glass transition temperature that indicates the changes in the microstructure material is near invaluable, whereas the peaks corresponding to the melting point are similar in form and value.

3.3. Pull-Out Test Results

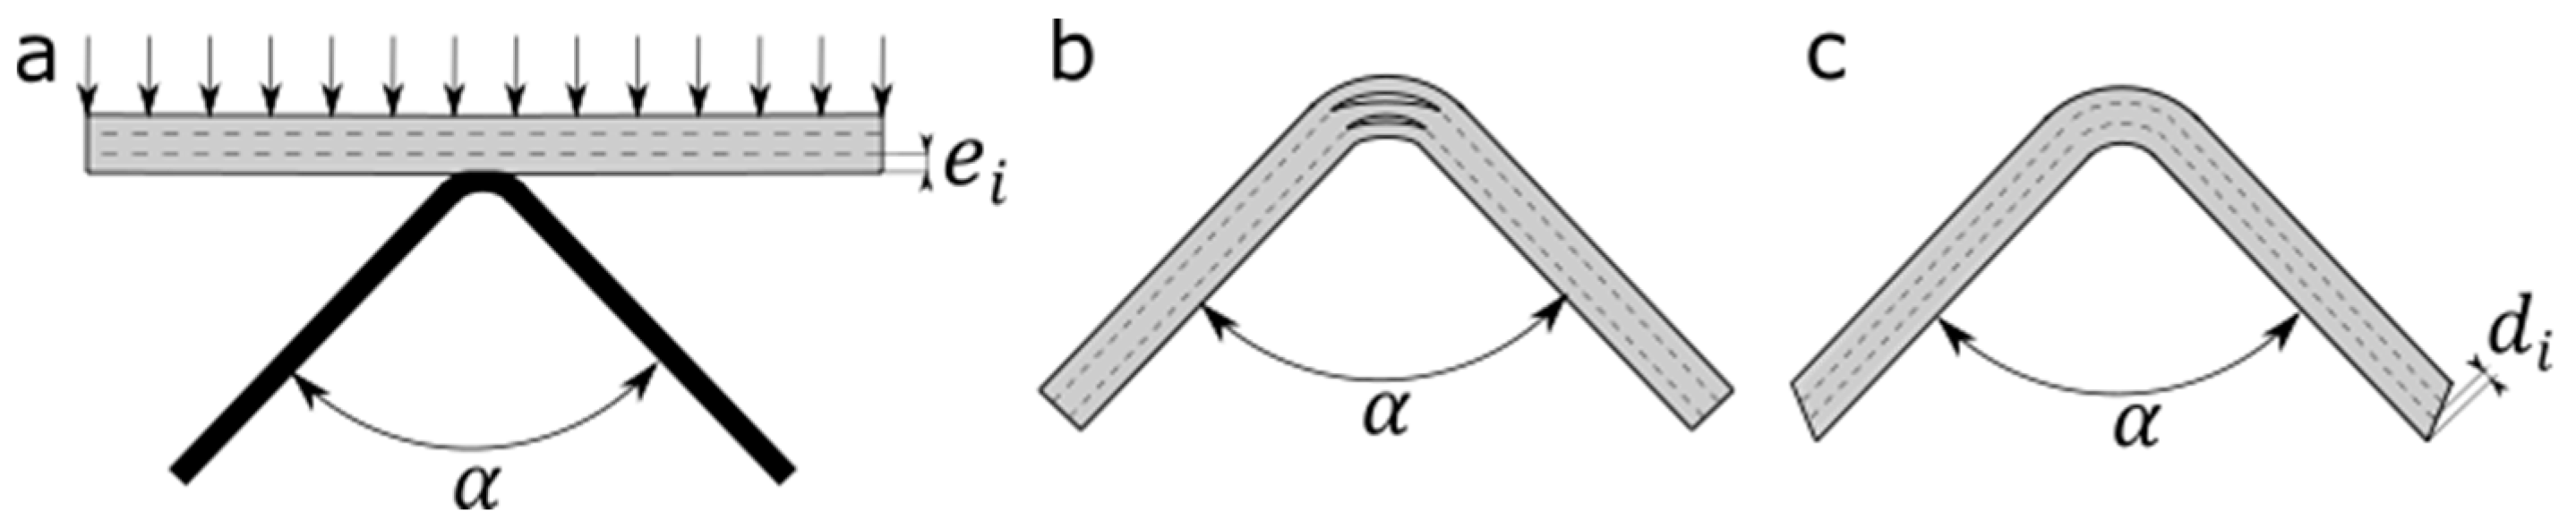
In this section, the results of the pull-out test for the APC2/AS4 and TC1225/T700 samples are shown. It should be noted that the authors considered the results to be valid until the samples reached a displacement of 30 mm. Within this range, the effects of temperature, pressure, and pulling rate on the friction coefficient and shield stress have been analyzed.
To calculate the shear stress and friction coefficient, an effective area (Equation (1)) consisting of the area that is overlapped at each instant of time and considering the elasticity of the system, was defined:
Ae = A0 − W · (Δx − F/K),
where Ae is the effective area, A0 is the initial area, W is the width sample, ∆x is the displacement, F is the measured friction force, and K is the elastic constant measured for each plot.
At the same time, the effective pressure (Equation (2)), the shear stress (Equation (3)), and the friction coefficient (Equation (4)) were calculated:
Pe = N/Ae
τ = F/(2 · Ae)
µ = τ/Pe,
where Pe is the effective pressure, N is the vertical force, Ae is the effective area, τ is the shear stress, F is the measured friction force, and μ is the friction coefficient.

3.3.1. Influence of Temperature

Figure 5 and Figure 6 show the friction force versus the displacement and the shear stress and the friction coefficient versus the effective pressure for both materials. To compare both materials, Figure 7 displays the static and dynamic friction coefficients. The presented measurement represents the average reading of the three samples tested for each test condition. The collected values correspond to the friction coefficients when the total displacement was 20 mm, which was equivalent to the plies displacement during the forming of components associated with this experiment.
Analyzing the results against temperature, different friction behaviors can be observed in the same material. In addition, different behavior between both materials within the same temperature range is also observable. Focusing on samples A01, A02, B01, and B02, corresponding to the room temperature and Tg−50 °C samples, it can be seen that there are no significant differences in the results. In both materials, the coefficient of friction is independent of the applied pressure, while shear stress has a linear dependence on it (refer to Figure 5 and Figure 6). Thus, as expected, the friction of both materials when the temperature is below the glass transition is driven by Coulomb’s law, and its value depends mainly on the material’s roughness. For both, this coefficient is around 0.26.
When the temperature range is between the glass transition and melting temperatures, substantial changes are observed in the behavior of both materials. Specimens A03 and B03 friction show slight pressure dependence that stabilizes along the test around 0.27 in terms of dynamic friction. Regarding the static friction, both materials have similar peak mean values but the standard deviation calculated shows that there is more variance in the measurement for the TC1225/T700 material.
Above the glass transition temperature, the mobility of molecular changes increases, resulting in the material becoming more ductile and capable of greater plastic deformation (as observed in Figure 4). This molecular mobility, combined with intimate ply-to-ply contact, could lead to increased interaction and entanglement among the crystalline phases of different plies. These mechanical interactions could cause an adhesive effect between layers that have to be overcome to initiate the sliding, thus explaining the observed peaks in static friction. Additionally, the variability in the results may be attributed to the degree of crystallinity in the sample, as at the temperature of the samples A03 and B03, the matrix was undergoing a phase transition, making it challenging to predict its molecular structure. Once this peak is overcome and the crystals have been aligned, the interlaminar friction decreases, as seen in the figures.
When the temperature reaches the melting onset, the bonds within the crystalline part of the matrix begin to break, causing the material to melt. As illustrated in Figure 5 and Figure 6 the friction behavior of both materials exhibits typical characteristics of dry friction and viscosity. On one hand, for values below 0.06 N/mm2 in the case of PEEK and 0.075 N/mm2 in the case of LMPAEK, the friction coefficient decreases as pressure increases, clearly indicating that viscosity is the dominant factor in friction. Conversely, for pressures exceeding these specified values, friction remains constant with pressure, indicating a clear dominance of dry friction. Therefore, it could be defined that friction around this temperature could be explained as a mixture of both types of interlaminar friction. Once again, the results display significant variability, possibly attributed to variations in the crystallinity percentage within each sample, which may favor one type of friction over the other depending on that percentage.
For temperatures above the melting peak temperatures, both materials exhibit a friction behavior driven by viscosity. As observed in Figure 5c and Figure 6c, the friction coefficient decreases with pressure. However, until the test temperature matches the processing temperature (400 °C for PEEK and 380 °C for LMPAEK)—and thus the material is completely melted—small signs of interaction between unmolten matrix parts can still be observed, manifesting as slight oscillations in the measurements. These oscillations indicate the presence of interaction between crystals that would lead to some adhesion between the plies, which must be overcome. When the matrix is fully melted, these oscillations disappear in both materials. This is also reflected in terms of variability in the readings. As shown in Figure 7, the measurements at temperatures within the melting range exhibit a much higher standard deviation than the results obtained at working temperatures.
Regarding the obtained values, the behaviors of PEEK and LMPAEK appear to be opposite. In the case of PEEK, friction decreases as temperature increases. However, for LMPAEK, the friction coefficient continues to rise with temperature. This phenomenon may be attributed to the fact that the viscosity of LMPAEK is lower than the viscosity of PEEK (see Pierik et al. [18]), thus allowing a thinner matrix film between plies that eventually could lead to a contact and/or entanglement between the fibers of the plies, increasing the friction.

3.3.2. Influence of Pulling Rate

To study the effects of the pulling rate on the thermoplastic materials, different speeds were tested for the temperatures of interest in this study, i.e., room temperature and processing temperature. The material for this study was the APC2/AS4.
The results obtained were to be expected following the results observed in the previous analysis. In Figure 8, shear stresses are presented. At room temperature, the shear stress is dependent on the pressure, thus dry friction is the predominant phenomenon. This result could be extrapolated until temperature before the glass transition. As there are no changes in the microstructure, the dominant friction remains the dry friction.
At the processing temperature, it is remarkable how there is a certain dependency of the friction coefficient and shear stress on the pulling rate. This behavior is like the typical pseudoplastic fluid model, which follows a power law similar to Equation (5). As represented in Figure 8, the shear stresses increase with the pulling rate with a best-fitting power-law index of K = 0.02 MPas of n = 0.6. Thus, APC2/AS4 at forming temperature behaves like a pseudoplastic material:
τ = KUn,
where U is the pulling rate, K is the first parameter of the power law, and n is the power-law index of the typical fluid power-law model, where if n < 1, the fluid is a pseudoplastic; if n = 1, the fluid is a Newtonian fluid; and if n > 1, the fluid is a dilatant.

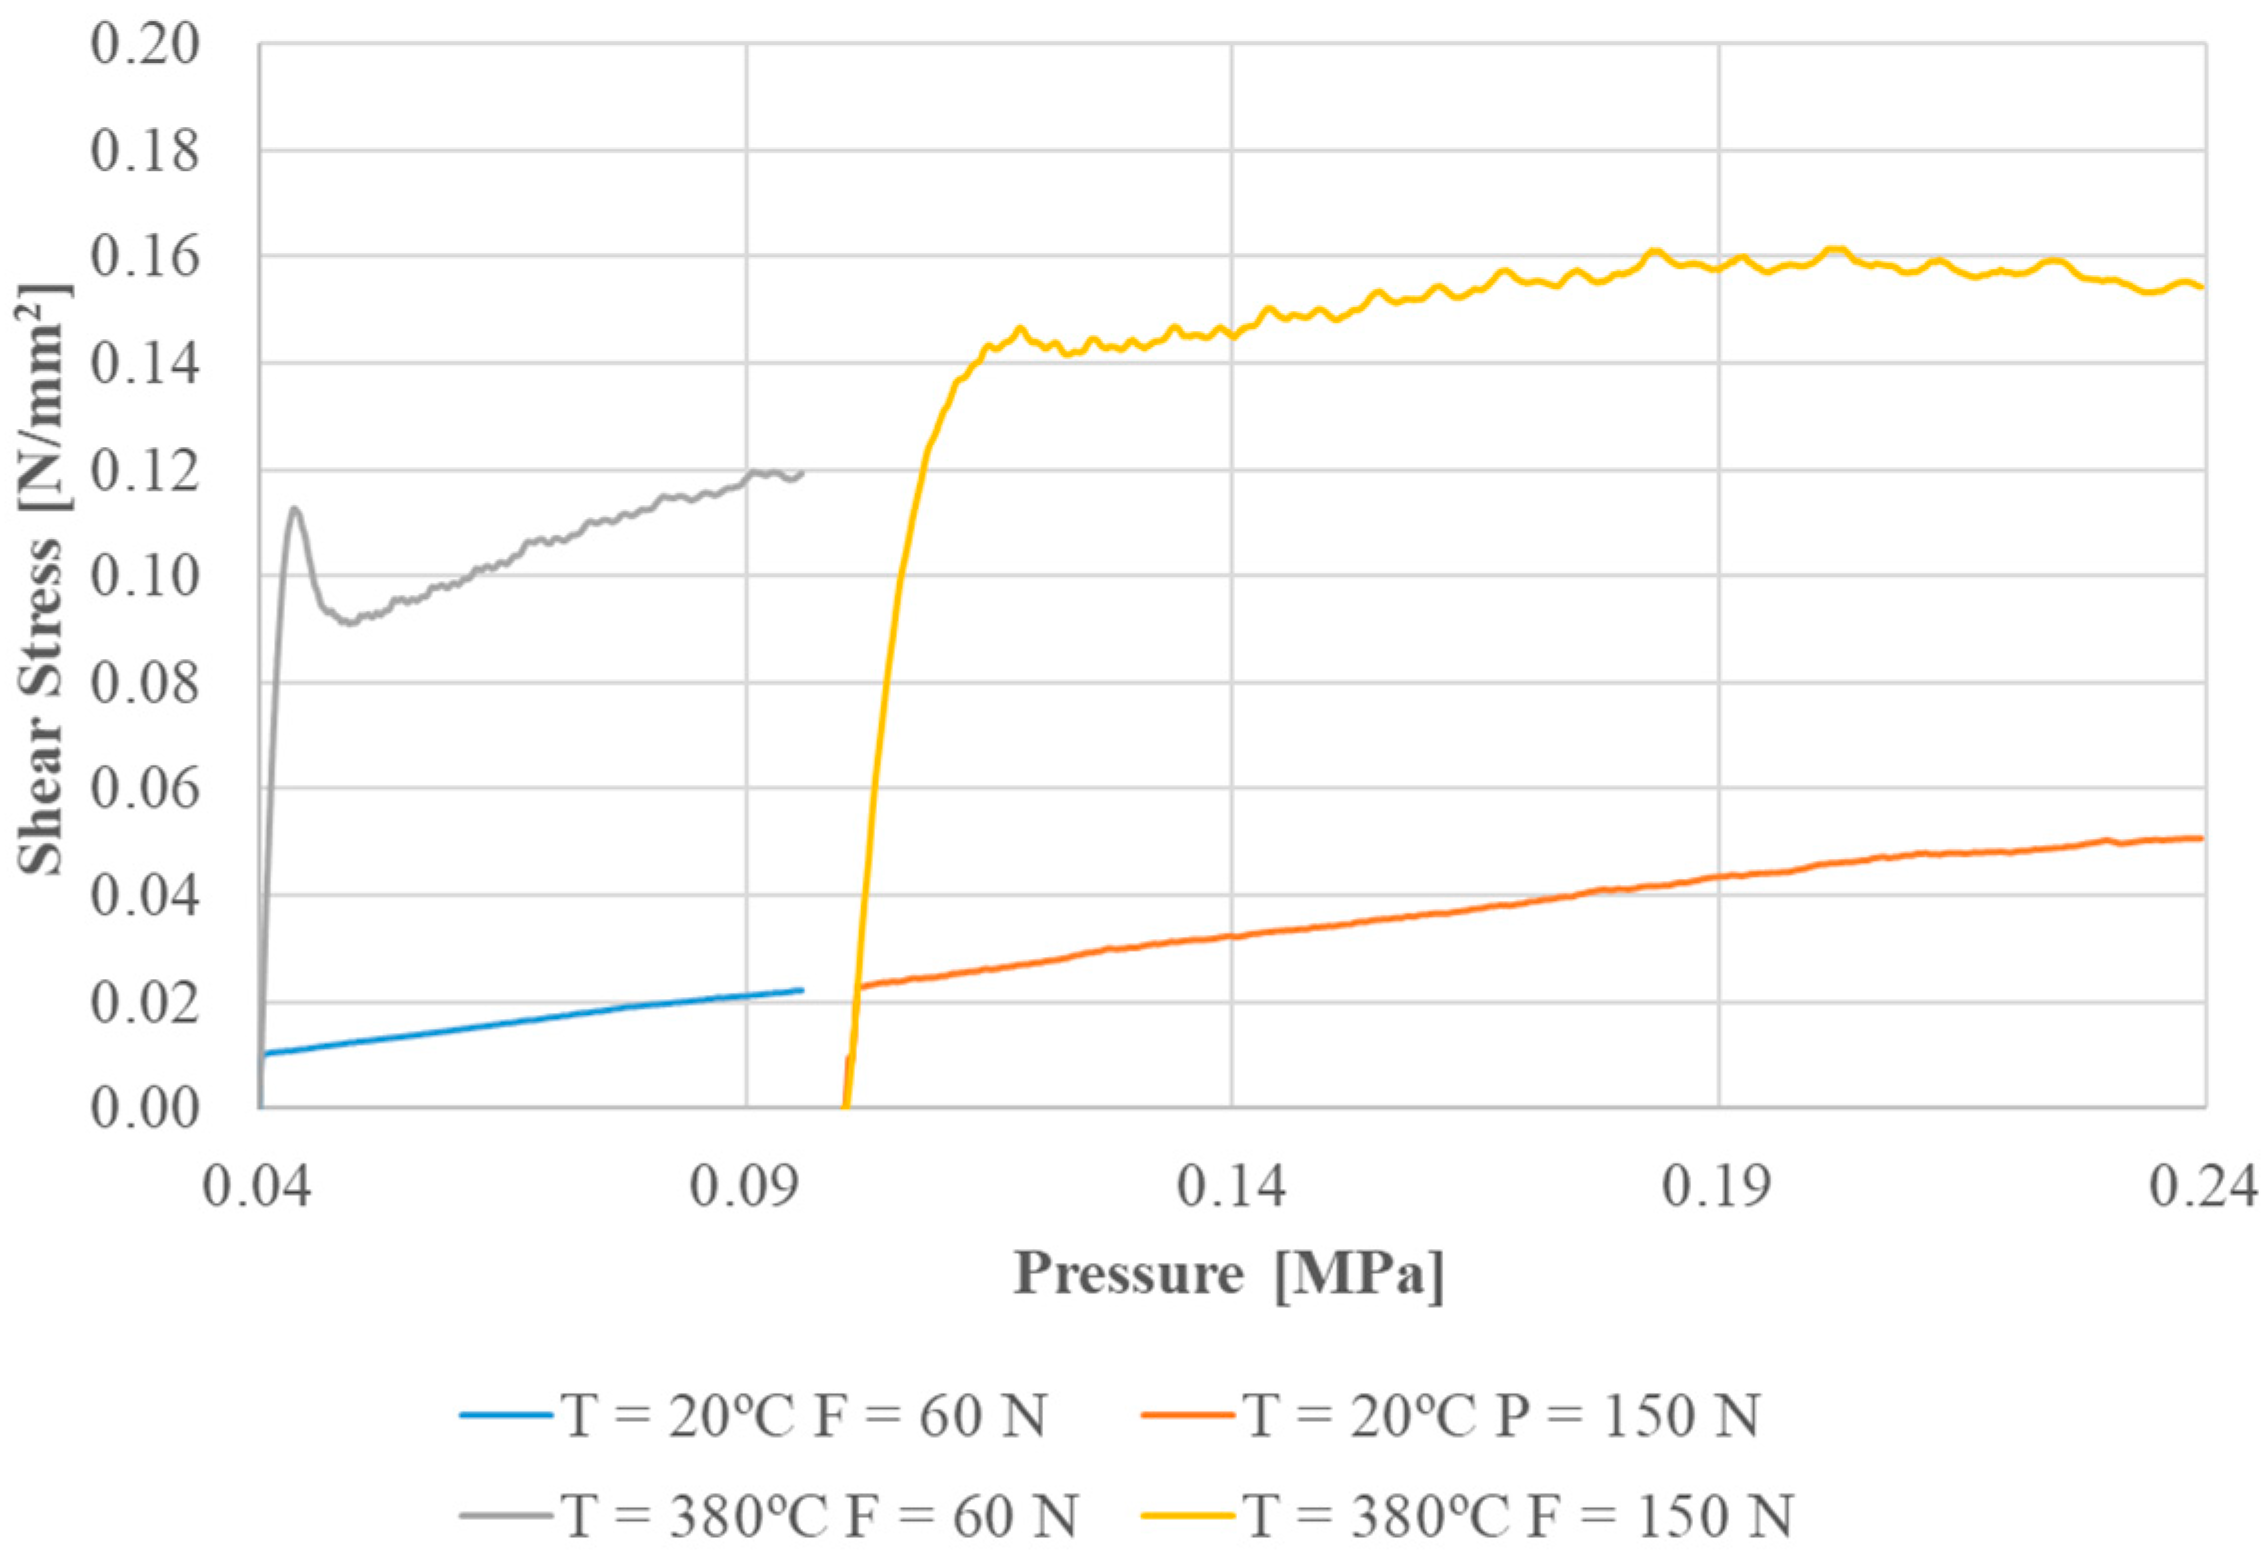
3.3.3. Influence of Pressure

The results in Figure 9 demonstrate that shear stress depends on pressure. These findings were expected when the test temperature is 20 °C but not when the test temperature is 380 °C. As mentioned earlier, a possible explanation for these results is the low viscosity of LMPAEK. In this scenario, high pressure can induce material flow, resulting in an extremely thin film between layers to the extent that fiber contact may occur, leading to friction behavior resembling dry friction.

4. Conclusions

Pull-out tests were conducted on APC2/AS4 and TC1225/T700 composite materials under varied conditions to compare their friction coefficients and shear stress, assessing how forming parameters impacted them. DSC and DMA results confirmed key temperatures but revealed disparities: TC1225/T700 initially displayed an amorphous nature, later revealing its semi-crystalline state.
Below the melting point, both materials behaved similarly, but above it, stark differences emerged. APC2/AS4 exhibited decreasing friction and shear stress with rising temperature, whereas TC1225/T700 showed the opposite trend within the experimental temperature range. This discrepancy was linked to LMPAEK’s higher flowability, potentially causing thinner matrix films and increased fiber contact, elevating friction.
Further research is needed to better grasp interlaminar friction in thermoplastics, especially around transition temperatures. Understanding these friction mechanisms, reliant on factors like temperature, pressure, and pulling rate, can fuel advancements in manufacturing technologies. This study’s findings contribute to this pursuit.

Author Contributions

Conceptualization, D.C. and A.M.; methodology, D.C. and A.M.; software, D.C.; validation, D.C., A.M. and P.M.; formal analysis, D.C.; investigation, D.C.; writing—original draft preparation, D.C.; writing—review and editing, D.C., A.M. and P.M.; visualization, D.C.; supervision, P.M.; project administration, D.C. All authors have read and agreed to the published version of the manuscript.

Funding

This research was supported by the Industrial Doctorate Program of Generalitat de Catalunya, AMADE Research Center, and Applus+ Laboratories. Grant: 2019 DI 058.

Data Availability Statement

Data are only available upon reasonable request.

Conflicts of Interest

The authors declare no conflicts of interest.

References

  1. Gazo Hanna, E.; Poitou, A.; Casari, P. Modeling. The interplay slip during forming of thermoplastic laminates. Mater. Phys. Mech. 2018, 40, 22–36. [Google Scholar]
  2. Murtagh, A.M.; Monaghan, M.R.; Mallon, P.J. Development of a shear deformation apparatus to characterize the interplay slip mechanism of advanced thermoplastic composites. Key Eng. Mater. 1993, 86–87, 123–130. [Google Scholar] [CrossRef]
  3. Murtagh, A.M.; Lennon, J.J.; Mallon, P.J. Surface friction effects related to press-forming of continuous fiber thermoplastic composites. Compos. Manuf. 1995, 6, 169–175. [Google Scholar] [CrossRef]
  4. Scherer, R.; Friedrich, K. Inter-and intraply-slip flow processes during thermoforming of CF/PP-laminates. Compos. Manuf. 1991, 2, 92–96. [Google Scholar] [CrossRef]
  5. Ten Thije, R.H.W.; Akkerman, R.; Ubbink, M.; Van der Meer, L. A lubrification approach to friction in thermoplastic composites forming processes. Compos. Part A Appl. Sci. Manuf. 2011, 42, 950–960. [Google Scholar] [CrossRef]
  6. Vanclooster, K.; Lomov, S.; Verpoest, I. Investigation of interplay shear in composite forming. Int. J. Mater. Form. 2008, 1, 957–960. [Google Scholar] [CrossRef]
  7. Morris, S.R.; Sun, C.T. An investigation of Interply Slip Behaviour in AS4/PEEK at Forming Temperatures. Compos. Manuf. 1994, 5, 217–224. [Google Scholar] [CrossRef]
  8. Sachs, U. Friction and Bending in Thermoplastic Composites Forming Processes. Ph.D. Thesis, University of Twente, Enschede, The Netherlands, 2014. [Google Scholar]
  9. Laresser, D. Investigation of the forming behaviour of a thermoplastic unidirectional tape laminate: Forming experiment, modeling, simulation. J. Thermoplast. Compos. Mater. 2020. [Google Scholar]
  10. Campos, D.; Brufau, J.; Biurrun, M.; Gomez, J.; Martín, A. A review of the A+ Glide Forming manufacturing technology and its adaptation to CFRP thermoplastic composite materials. In Proceedings of the 5th International Conference & Exhibition on Thermoplastic Composites, Bremen, Germany, 13–14 October 2020. [Google Scholar]
  11. Redondo, J.B.; Lorente, A.S. System for Forming Stacks of Composite Materials. U.S. Patent 2014/0290866A1, 21 September 2012. [Google Scholar]
  12. Redondo, J.B. System for Forming Stacks of Composite Materials. U.S. Patent 2016/0082675A1, 8 May 2013. [Google Scholar]
  13. Robins, B.G.; Berrios, I.; Redondo, J.B.; Rueda, M.C.C. Heat Blankets Assembly for Forming a Composite Charge. U.S. Patent 2019/0016040A1, 14 July 2017. [Google Scholar]
  14. Tatsuno, D.; Yoneyyama, T.; Okamoto, M. Hot press forming of thermoplastic CFRP sheets. In Proceedings of the 17th International Conference on Metal Forming, Toyohashi, Japan, 16–19 September 2018. [Google Scholar]
  15. Yanagimoto, J.; Ikeuchi, K. Sheet forming process of carbon fiber reinforced plastics for lightweight parts. CIRP Ann. Manuf. Tech. 2012, 61, 247–250. [Google Scholar] [CrossRef]
  16. McCool, R.; Murphy, A.; Wilson, R.; Jiang, Z.; Price, M.; Butterfield, J.; Hornsby, P. Thermoforming carbon fiber-reinforced thermoplastic composites. Proc. Inst. Mech. Eng. Part L J. Mater. Des. Appl. 2012, 226, 91–102. [Google Scholar]
  17. Enoki, S.; Kojima, K.; Mizuno, S.; Katayama, K.; Tanaka, K. High-speed compression molding of continuous carbon fiber reinforced polypropylene. WIT Trans. Built Environ. 2014, 137, 311–315. [Google Scholar]
  18. Pierik, E.R.; Grouve, W.J.B.; Wijskamp, S.; Akkerman, R. Prediction of the peak and stead-state ply-ply friction response for UD C/PAEK tapes. Compos. Part A Appl. Sci. Manuf. 2022, 163, 107185. [Google Scholar] [CrossRef]
Figure 1. (a) Laminate over tool. (b) Upper radio wrinkles due to a wrong plies’ displacement. (c) Bookend effect due to a proper displacement of the plies.
Jcs 08 00038 g001
Figure 2. Scheme of the experimental rig devised to measure the friction coefficient.
Jcs 08 00038 g002
Figure 3. (a) DSC results of TC1225/T700 LM-PAEK. (b) DSC results of APC2/AS4 PEEK. In green first heating cycle. In gray second heating cycle.
Jcs 08 00038 g003
Figure 4. DMA results. The APC2/AS4 demonstrates higher energy storage while exhibiting lower depletion during phase transitions compared to the TC1225/T700.
Jcs 08 00038 g004
Figure 5. APC-2/AS4 friction test vs. temperature results (pulling rate 2 mm/s. normal force 60N). (a) Friction force vs. displacement. (b) Shear stress vs. pressure. (c) Friction coefficient vs. pressure.
Jcs 08 00038 g005
Figure 6. TC1225/T700 friction test vs. temperature results (pulling rate 2 mm/s. normal force 60N). (a) Friction force vs. displacement. (b) Shear stress vs. pressure. (c) Friction coefficient vs. pressure.
Jcs 08 00038 g006
Figure 7. Influence of temperature. T0: room temperature, Tg−50: glass transition temperature −50 °C, Tg+50: glass transition temperature +50 °C, TM, ONSET: temperature at the onset of the melting peak, TM, PEAK: temperature at the melting peak, TM, OFFSET: temperature at the melting peak offset, TP: processing temperature. Note: The dynamic friction of the coefficient corresponds to the measure at 20 mm of displacement.
Jcs 08 00038 g007
Figure 8. APC2/AS4 pulling rate dependency. (a) Shear stress vs. pressure for T = 20 °C and T = 400 °C. (b) Shear stress vs. pulling rate for T = 400 °C.
Jcs 08 00038 g008
Figure 9. TC1225/T700 pressure dependency.
Jcs 08 00038 g009
Table 1. Properties of both thermoplastic composites used in this research.
PropertyTC1225/T700 1APC2/AS4 2
Type of compositeUD PrepregUD Prepreg
Type of reinforcementT700AS4
Fiber areal weight (FAW)134 g/m2145 g/m2
Resin content by weight (RC)34%34%
Consolidated ply thickness (CPT)0.128 mm0.140 mm
1 From TC1225 Toray Datasheet. 2 From APC-2 Solvay Datasheet.
Table 2. Relevant temperatures of both thermoplastic composites obtained from their DSCs.
PropertyTC1225/T700 1APC2/AS4 2
Tg Glass Transition148 °C143 °C
Tm Melting303 °C341 °C
Tc Crystallization250 °C291 °C
Tp Processing range340–385 °C385–400 °C
1 From TC1225 Toray Datasheet. 2 From APC-2 Solvay Datasheet.
Table 3. Test conditions.
Sample IDMaterialTemperature [°C]Normal Force [N]Pulling Rate [mm/s]
A01TC1225/T700T0 (20)602
A02TC1225/T700Tg-50 (100)602
A03TC1225/T700Tg+50 (200)602
A04TC1225/T700TM,ONSET (280)602
A05TC1225/T700TM,PEAK (305)602
A06TC1225/T700TM,OFFSET (315)602
A07TC1225/T700TP (380)602
A08TC1225/T700T0 (20)1502
A09TC1225/T700TP (380)1502
B01APC2/AS4T0 (20)602
B02APC2/AS4Tg-50 (100)602
B03APC2/AS4Tg+50 (200)602
B04APC2/AS4TM,ONSET (290)602
B05APC2/AS4TM,PEAK (343)602
B06APC2/AS4TM,OFFSET (355)602
B07APC2/AS4TP (400)602
B08APC2/AS4T0 (20)600.2
B09APC2/AS4T0 (20)606
B10APC2/AS4T0 (20)6010
B11APC2/AS4TP (400)600.2
B12APC2/AS4TP (400)606
B13APC2/AS4TP (400)6010
Disclaimer/Publisher’s Note: The statements, opinions and data contained in all publications are solely those of the individual author(s) and contributor(s) and not of MDPI and/or the editor(s). MDPI and/or the editor(s) disclaim responsibility for any injury to people or property resulting from any ideas, methods, instructions or products referred to in the content.

