Article

Highly Selective Polyene-Polyyne Resistive Gas Sensors: Response Tuning by Low-Energy Ion Irradiation

by
Ilya A. Zavidovskiy
1,2,*,
Oleg A. Streletskiy
1,
Islam F. Nuriahmetov
1,
Olesya Yu. Nishchak
1,
Natalya F. Savchenko
1,
Andrey A. Tatarintsev
1 and
Alexander V. Pavlikov
1,*
1
Faculty of Physics, M.V. Lomonosov Moscow State University, Moscow 119991, Russia
2
Center for Photonics and 2D Materials, Moscow Institute of Physics and Technology, Dolgoprudny 141700, Russia
*
Authors to whom correspondence should be addressed.
J. Compos. Sci. 2023, 7(4), 156; https://doi.org/10.3390/jcs7040156
Submission received: 23 February 2023 / Revised: 20 March 2023 / Accepted: 7 April 2023 / Published: 11 April 2023
(This article belongs to the Special Issue Radiation Effects in Polymer Hybrids)

Abstract

:
The formation of polyene-polyyne-based nanocomposites by dehydrohalogenation of the drop-cast-deposited polyvinylidene fluoride, assessment and ion-induced tailoring of their gas sensing properties are reported. The investigated structure was analyzed by scanning electron microscopy (SEM), energy-dispersive X-ray spectroscopy, transmission electron microscopy and Fourier-transform infrared spectroscopy, revealing the thickness-dependent incomplete dehydrofluorination of the structure and its porosity induced by KOH treatment. The polyene-polyyne structures modified by low-energy Ar+ were studied by SEM and Raman spectroscopy, which showed the morphology variation, the shortening of chains and the graphitization of samples. The resistive gas sensing properties of the samples were analyzed at room temperature, revealing selective sensing of ammonia vapor by non-irradiated sample and the enhancement of the sensing properties for ethanol and water vapor after ion irradiation. With the ion dose enlargement, the change in the sensing response from electrical conductivity increase to decrease was observed for ammonia and ethanol, allowing us to discuss the origin and tunability of the sensing mechanism of the samples.

Graphical Abstract

1. Introduction

The use of nanostructured materials as gas sensor components is being actively analyzed today [1,2,3]. The interest in gas sensors arises from the plethora of their applications. For example, gas sensors can be applied for monitoring gas leaks and accidental ignitions, as well as for analytics, quality control and marketing research in the food and fragrance industries [4,5]. Gas detection can be based on the variation of properties of the materials interacting with the gasses. Most commonly, these properties are electrochemical and piezoelectrical activity, electrical resistance, heat conductivity and infrared (IR) absorption. Resistive gas sensors are of particular interest, due to their high sensitivity, stability, low power consumption, low operating cost and simple integration into wearable electronics. However, typical disadvantages of resistive gas sensors include a high working temperature and low selectivity; i.e., low variation of the electrical resistivity shift when a sensor responds to various gasses [1]. A potential solution for these issues is using nanostructured carbon materials, polymer-polymer or carbon polymer composites as sensing elements [6,7,8,9]. In carbon-based sensing structures, the carbon component is usually sp2-hybridized: for example, it can be comprised of multiwalled nanotubes [6], graphene [7] and graphitic nanohorns [8]. The studies [6,7,8,9] not only reported on the selective sensitivity of carbon nanomaterials to various gasses, but also thoroughly analyzed their sensing mechanism.
An important and significantly less studied area of research is the analysis of the possibility to detect gasses by means of structures containing sp-hybridized carbon (sp-containing structures). Only the initial stages of the development of the sensors based on sp-containing materials have been reported, yet they have revealed promising results. For example, in [10], density functional theory analysis showed the potential possibility of detecting biomolecules in the biomolecule/sp-chain system by measuring the voltammetry of the sp-chain. In [11], the selective adsorption of the CO2 molecule (compared to N2 adsorption) in the vicinity of the C≡C-bond of the graphyne-like structure was observed. In [12], the resistive sensing of the biochemical compounds via graphydine was reported, while in [13], the authors showed that CH4 molecules are preferentially adsorbed on C(sp)-C(sp2)-bonds during methane interaction with γ-graphydine. In [14], sensing properties of sp-carbon/copper oxide composite were reported and their ability to detect water, methanol and ethanol vapors was analyzed. However, to our knowledge, resistive sensing of ammonia by sp-containing structures has not been previously analyzed in detail. The formation of the structures capable of selective NH3 sensing is of particular interest, as its detection is required for plant growth monitoring [15]. In turn, polymers are a promising basis for the formation of the sensing materials, as their piezoelectric and triboelectric properties can ensure the self-powering of the sensor [16], self-healing can improve the sensor wearability [17] and various polymer-based composites may have enhanced mechanical properties [18] and adsorption capacity [19]. Therefore, the development of the facile and scalable method, allowing for the formation of the NH3-sensing sp-containing structures from the polymeric precursor, is of interest.
As dehydrohalogenation of polymers is known to enhance the porosity of the structure and to induce the formation of sp-hybridized carbon, we suggested that structures based on dehydrofluorinated polyvinylidene fluoride (PVDF) will be promising candidates as the bases of resistive gas sensors. The carbon-based materials obtained by polymer carbonization are widely studied today: for example, piezoelectric-sensing properties of dehydrofluorinated PVDF fibers have been recently reported [20], as well as their mechanical-energy-harvesting properties [21]. To produce the chemically treated material with the desired dimensions and sufficient adhesion to the substrate, we developed the scalable method of the drop casting of dissolved polymeric material and its subsequent chemical dehydrohalogenation. To our knowledge, the resistive sensing properties of the structures prepared by the dehydrofluorination of PVDF have not been previously reported. In this paper, we analyzed the structure and sensing properties of polyene-polyyne-based (PPB) porous structures and investigated the variation of the structure and selectivity of NH3 sensing via carbonized PVDF irradiated by low-energy Ar+ ions.

2. Materials and Methods

2.1. Sample Preparation

The studied samples and analyzed devices were manufactured in several stages. The process is shown in Figure 1. PVDF powder (LCC «CHIMMED», Moscow, Russia) was used as a precursor. To obtain the films, in the first stage, 40 mg of the PVDF powder was dissolved in 10 mL of the mixture of N,N-dimethylformamide (DMF, produced by LLC “Rushim.ru”, Moscow, Russia) and acetone (LCC «CHIMMED», Moscow, Russia) in a proportion of 7:3 at 70 °C. Then, the solution was poured into a 9-cm diameter glass Petri dish (LCC “MLC-KLIN”, Klin, Russia) and was dried until the evaporation of the solution, thus applying the conventional drop casting technique to obtain a polymer material of desired morphology. As a result, thin translucent 1-μm thick PVDF films were formed.
In the second stage, a room temperature dehydrofluorination of the PVDF films was carried out. First, the solution of potassium hydroxide (Labtech LLC, Moscow, Russia) and methanol (RCI LabScan Group, Bangkok, Thailand) was prepared: KOH crystals placed in methanol were dissolved until the formation of the supersaturated solution. Then, the KOH/CH3OH solution was diluted by acetone, with careful stirring, to a proportion of 1:9. Subsequently, the obtained solution was poured into the PVDF films containing Petri dishes ensuring the films were entirely submerged.
During the interaction of KOH and PVDF, the reaction of the dehydrohalogenation took place (reaction adopted from [22], the polyene-polyyne (PP) structure is analyzed in Section 3.1, Section 3.2, Section 3.3, Section 3.4, Section 3.5, Section 3.6):
(n + m)(–CH2–CF2–) + 2(n + m)KOH → (–CH=CF–)n…(–C≡C–)m + 2(n + m)H2O + 2(n + m)KF
The reaction proceeded for 24 h at room temperature. As a result of the reaction, the appearance of the film changed from translucent to opaque black, and the film separated from the surface of the Petri dish.
Then, the residual products were removed from the synthesized material by cleaning in a ultrasonic cleaner (Wahluen electronic tools, Shantou, China) filled with distilled water for 15 min. Distilled water was purified on site via an electric medical water distiller DE-4-02 (“EMO”, Saint-Petersburg, Russia). The thickness of the obtained material was 1 μm. After the treatment, the film was dried in ambient conditions and cut into 5 mm × 5 mm pieces, which were deposited on a stainless-steel plate for subsequent studies.
In the third stage, the films were placed in a high-vacuum chamber and were irradiated by an ion beam. Prior to the irradiation, the chamber was evacuated to the residual pressure of 1.3 × 10⁻³ Pa. Then, the gas chamber was filled with argon of 1 × 10⁻² Pa. Argon ions were generated by a KLAN-53M ion source (Platar Corp., Moscow, Russia) with a cold hollow cathode. The ion energy was 500 eV, the ion current was 40 mA. Films were irradiated within different periods, which resulted in irradiation with ion doses of 1 × 10¹⁶, 3 × 10¹⁶, 3 × 10¹⁷, 6 × 10¹⁷ and 1 × 10¹⁸ ion/cm2. The range of 1016–1018 ion/cm2 is typically selected for the low- and middle-energy ion irradiation of polymeric structures [23,24,25].
In the fourth stage, metallic contacts were deposited on the surface of the irradiated and non-irradiated films to obtain the base of the resistive gas sensor. Custom stainless-steel masks were fixed on the surface of the samples prior to their placement in the vacuum chamber. After the samples were attached to the substrate holder, the vacuum chamber was evacuated to a residual pressure of 1.3 × 10⁻³ Pa. The argon pressure during the deposition was 1 × 10⁻² Pa. The contacts were deposited by radiofrequency (RF) magnetron sputtering of an aluminum target (Applied Science Corp., Paju, Republic of Korea). The discharge frequency was 13.56 MHz. The discharge power was 100 W, and the distance between the target and the substrate was 12 cm. The thickness of the contact was controlled by the detector based on a quartz oscillator (Inficon Corp., Moscow, Russia). As a result, the bases of the resistive sensors containing the dehydrohalogenated PVDF irradiated with various ion doses were formed (see Figure 2a).

2.2. Sample Characterization

The transmission electron microscopy (TEM) studies were carried out using an LEO 912 AB electron microscope (Carl Zeiss, Jena, Germany). The operating acceleration voltage was 120 keV. The used electron microscopy grids consisted of copper frames with 40 μm cells and thin (~5 nm) polymer film deposited on the upper side of the frame. To transfer the structure to these grids, the samples were mechanically pressed to the polymer-coated side of the grids and removed after 5–10 s of grid-sample interaction. This method was previously reported and tested in [26]. For TEM studies, we used the set of non-irradiated films produced from the ~100-nm thick PVDF film. The dehydrohalogenation conditions were the same as the ones of other samples.
Scanning electron microscopy (SEM) studies were carried out using a LEO 1455 VP microscope (Carl Zeiss, Jena, Germany). The accelerating voltage was 10 kV. Detection of secondary electrons was carried out using a Everhart–Thornley detector. The setup was equipped with a detector, allowing us to perform energy-dispersive X-ray spectroscopy (EDX) studies.
Raman spectra were obtained using a Sunshine GE-Raman spectrometer (Changchun New Industries Optoelectronics Tech. Co., Ltd. (CNI), Changchun, China) coupled to a Leitz Wetzlar microscope (Ernst Leitz GmbH, Wetzlar, Germany). The excitation wavelength was 532 nm, and the power was 1 mW. A ×50 objective lens (N.A. = 0.85) was used for the spectra acquisition. For each sample, spectra from 3–5 regions were analyzed, and the most typical spectra were chosen for the subsequent procession.
Fourier-transform infrared spectroscopy (FTIR) studies were carried out using a Brucker IFS-66v/S FTIR spectrometer (Bruker Optics, Karlsruhe, Germany). The resolution of the FTIR spectrometer was 0.5 cm−1.

2.3. Sensing Response Measurements

Measurement of the sensing properties was carried out via the custom setup located in the glove box (Plas Labs, Lansing, MI, USA). For the investigation, samples were placed inside the glove box and their contacts were connected to the nanoammeter (Tektronix 4050, Beaverton, OR, USA). During the measurements, the samples were kept at room temperature. The results of the real-time electrical conductivity measurements were immediately saved on a computer for storage. Subsequent evaluation of the relative sensing response Δσ/σ0 was carried out via Equation (2); where σ is the maximum/minimum conductivity of the sample interacting with the detectable gas, σ0 is the conductivity of the sample in the ambient conditions, Δσ is a sensing response of the structure; i.e., the difference of the conductivities in the sensing and non-sensing states.
Δσ/σ0 = (σ − σ0)/σ0
The lengths of the response periods were estimated as times required for the conductivity to change from σ0 to σ0 ± 0.9Δσ (“+” for the negative response, “−” for the positive response). The lengths of the relaxation periods were estimated as times required for the conductivity to change from σ to σ ± 0.9Δσ (“+” for positive response, “−” for negative response).

3. Results

3.1. Microscopy

3.1.1. TEM

Figure 2b shows the image of the PPB structure. It shows the ~20-µm-sized pores located on the surface of the sample. KOH-induced activation is known to initiate the pore formation in carbon-polymer structures; however, the typical range of pore sizes observed after dehydrohalogenation of various polymers is 1–100 nm [27,28]. In our case, the presence of large pores is apparently associated with the condensation of the KOH from its supersaturated solution. Figure 3 indicates that not only micro-sized but also nano-sized pores exist in the sample, although they are not prominent in the TEM image.

3.1.2. SEM

SEM images of the samples are shown in Figure 4. The image of the non-irradiated sample shows prominent morphological features of 0.1–1 µm size. Low-energy ion irradiation of the sample with (3–6) × 1017 ion/cm2 doses leads to a significant smoothing of the sample and a reduction of the morphological feature size to 50–100 nm, which is a common effect resulting from the resputtering and the activation of the surface diffusion of the resputtered material [26]. With the increase of the irradiation dose to 1018 ion/cm2, the roughness stays at about 50–100 nm. However, it also induces the formation of sparse 0.1–1-µm-sized features, the formation of which is apparently induced by the ion-induced structural rearrangement. Graphitization and cross-linking of the top layer of the polymers take place at 1016–1017 ion/cm2 doses of low-energy Ar+ irradiation [23,24]. For the 1017–1018 ion/cm2 Ar+ irradiation of polymers, an increase in the roughness and clustering was revealed [25]. This indicates that, in the studied case, 0.1–1-µm-sized features observed for the 1018-ion/cm2-irradiated sample are sp2-hybridized clusters originating from the ion-induced polyene-polyyne cross-linking.

3.2. EDX

Table 1 shows the elemental composition of the precursor PVDF, dehydrohalogenated sample (PPB structure) and carbonized samples irradiated with various ion doses. For pristine PVDF, the ratio of C:F~1 and the impurity concentration is low, which proves the pristinity of the precursor polymer. Overall, samples contain less than 3% of impurities (Cu, K, Al, Cl), the presence of which can be attributed to the incomplete removal of the KOH reagent or impurities. Notably, nitrogen is not present in the sample, which distinguishes our result from the previously reported nitrogen doping during PVDF carbonization associated with the presence of DMF [29]. Apparently, the extraction of nitrogen atoms from DMF into the carbon structure is more prominent when dehydrohalogenation in dimethylformamide-containing solvent takes place at elevated temperatures [30]. Therefore, the technique employed in our work involving separated processes of dissolving the polymer in dimethylacetamide and room-temperature dehydrohalogenation makes it possible to synthesize undoped structures.
Fluorine fraction in the PP structure unsurprisingly decreases after dehydrofluorination. Additionally, chemically treated samples show significant oxidation. These findings are coherent with the ones of [31], which indicate that the formation of -O, -OH, and ethoxy-groups (-OC2H5) takes place during the dehydrohalogenation and aging of the sp-containing samples in the ambient air. After the irradiation of the PPB samples with a low Ar+ dose of 3 × 10¹⁷ ion/cm2, their elemental composition slightly varies. The increase in the irradiation dose leads to the increase in fluorine concentration. Such a process is different from the structure rearrangement observed during the ion irradiation of PVDF. In the case of pristine PVDF treated by Ar+, a prominent increase in the C:F ratio is observed [32], which is apparently caused by the preferential sputtering of fluorine.
Such discrepancy is attributed to low modification depth induced by an ion beam. In the case of low ion energies of ~1 keV, such a depth is ~2 nm [32]. It allows us to assume that, in our case, the fluorine concentration enlargement with ion dose is attributed to the sputtering of a carbon-rich dehydrofluorinated subsurface layer. In their turn, deep layers of the structure are significantly less carbonized, and apparently contain PVDF and C-F/C-F2-based fragments; thus, carbon-rich layer removal enhances fluorine contribution to the EDX signal with the ion dose increase. The discussion of the thickness-dependent incomplete dehydrofluorination of the samples is relevant for the analysis of the sensing performance of the samples and will be continued in Section 3.3.

3.3. FTIR

Figure 5 shows the typical FTIR spectrum of the dehydrofluorinated sample. The spectra of the annealed PPB samples slightly varied from the presented curve. The absorbance bands at 410 and 480 cm−1 are common for PVDF [33,34], although they are not typically assigned to a particular bonding type. In turn, the 520 and 620-cm−1-centered peaks are attributed to the excitation of the bending vibrations of C-F2 bonds [34]. The 780 and 800 cm−1 bands are typical for rocking vibrations of C-H2 groups [34].
Lines observed in the 850–1550 cm−1 range are typical for various carbon, polymer and polymer-like structures. Most of them are significantly wider than the PVDF-related lines observed in the 400–800 cm−1 range, which allows to ascribe them to the disordered component of the material. The results presented in [35,36] show that the lines positioned at 870 and 970 cm−1 correspond to C-H bending. The 1060 and 1210 cm−1 lines are related to C-C, C-O and C-O-C bonds [35,37]. The 1390 cm−1 position is typical both for bending vibrations of C-H bonds and for the stretching vibrations of C-C, which makes these lines indistinguishable in the spectra [38].
The line located at 1600 cm−1 is assigned to C=C stretching vibrations. Its presence indicates that the PVDF material was not completely dehydrofluorinated during the chemical treatment (for example, they can represent the (–CH=CF–)n component shown in Equation (1)). As a result of incomplete carbonization, the formation of polyenic component (i.e., the formation of polymeric fragments of chains having not less than three conjugated C=C bonds) takes place. The 2170 cm−1 absorption band is related to the stretching vibration of C≡C bonds of sp-carbon. Its emergence is related to the violation of the mutual-exclusion principle between FTIR and Raman spectroscopy, which is typical for long bended chains [39]. However, as shown in [40], a 2170 cm−1 peak position is typical for structures with a single C≡C bond. Apparently, it indicates that polyenic and polyynic fragments comprise an aggregate carbon chain in dehydrohalogenated PVDF [41]. The set of linear chains comprised of multiple sp2- and sp3-hybridized fragments regions determines a PP structure analyzed in the current paper.
The peaks located in the 2700–3200 cm−1 region are attributed to C-H stretching vibrations. The bands located in 2840 and 2950 cm−1 positions are typical for aliphatic compounds [42,43]. The line at 3090 cm−1 is related to asymmetric stretching vibrations of CH2 [44]. As the aliphatic-related line at 2950 cm−1 demonstrates prevailing intensity, we conclude that the majority of the structure is comprised of chains, which confirms the discussion presented in the previous paragraph. In turn, the wide absorption band at 3390 cm−1 is related to the vibration of OH bonds, the presence of which can be related both to oxidation and hydrogenation after PP interaction with the ambient air [35] and the absorption of water vapor [35,45].
In summary, in the studied spectra, we observed both PVDF-related lines, i.e., narrow absorbance bands at 410, 520, 620, 780 and 800 cm−1, as well as the lines related to polymeric (C-H), polyenic (C=C) and sp-containing (C≡C) fragments. This result and EDX studies show that the process of PVDF carbonization in KOH takes place in various ways in different regions of the sample. A similar result was observed in [46], where the authors reported on the PVDF 6-h dehydrohalogenation in KOH solution. It was shown that such a process led to the formation of “moderately dehydrofluorinated” PVDF, the subsurface layers of which were carbonized, but the “cores” of the grains were not modified. Notably, no formation of C≡C bonds was observed in [46], and the position of the C=C-related FTIR line was characterized by a wavenumber value of 1681 cm−1, which apparently indicated a low length of sp2-hybridized fragments [47]. For the material studied in the present paper, a prolonged dehydrohalogenation reaction initiated the formation of both sp2- and sp-hybridized chain fragments. The FTIR spectra of the PVDF-PP combination similar to those discussed in the current section were observed in [48] and were ascribed to ~40% PVDF→carbon conversion. Apparently, similar to the results reported in [46], the incomplete dehydrohalogenation of the studied material is related to the thickness-dependent dehydrohalogenation of the material; i.e., low carbonization efficiency for the deep layers of the structure.

3.4. Raman Spectroscopy

Figure 6a shows Raman spectra of dehydrohalogenated PVDF irradiated with various ion doses. Raman spectra of the materials irradiated with (1–3) × 1016-ion/cm2 doses insignificantly varied from the spectra of the non-irradiated sample. The ion influence on sp-containing materials leads to the disordering of materials and the formation of the amorphous-carbon-based phase in the material structure [45]. Therefore, the region of 1520–1560 cm−1 corresponding to C=C vibrations was fitted with separate sets of polyene-related and amorphous-carbon related lines (Figure 6b–e).
The Raman spectra show intensive and relatively narrow lines at 1130–1170 cm−1, attributed to C-C bonds of polyenic structures (this mode hereinafter is referred to as ν1), the plateau in the 1200–1400 cm−1 region corresponding to the sum of the peaks related to the sum of amorphous-carbon related D-line [49] and cis-polyacetylene-related C-C vibrations line (cis-ν1) [50]; peaks at 1520–1560 cm−1 corresponding to the G-line of amorphous carbon [51] and C=C vibrations of polyenes [52]. The cis-ν1 was chosen as an additional component, as the position of the line fitting at the 1200–1400 cm−1 plateau did not always match the 1320–1360 cm−1 range typical for D-line [53], thus cis-polyacetylene was suggested as a structure representing cis-isomeric polyenes. As for the maximums ascribed to amorphous carbon, the D-line is attributed to the breathing mode of graphitic hexagons, while the G-line is assigned to the stretching vibrations of graphitic C=C [51]. In addition to the fundamental lines, the overtones of ν1 + ν2 and 2ν2 were observed in the vicinity of 2650 and 3030 cm−1.
Notably, a major polyyne-related line was attributed to the stretching vibrations of C≡C bonds, peaking at 2000–2300 cm−1 [54], which was not observed for the non-irradiated sample. It can be related to the luminescence peak observed in a similar range for the studied samples. For the polyene-polyynic materials obtained by paraffine dehydrohalogenation in KOH, the intensity of the 2170 cm−1 line was also quite weak [55]. The low length of sp-hybridized chain fragments can additionally decrease the intensity of chain-related Raman lines [39]. For the studied sample, the short lengths of polyynic fragments is consistent with the results of FTIR (Section 3.3). However, irradiated samples reveal a low-intensive peak at 2100–2200 cm−1, which can be observed after the background subtraction and spectrum smoothing (see Figure 6g). The ion-irradiation-induced restructuring of carbon materials into sp-containing structures was previously observed [56]. However, in the studied case, the emergence of the C≡C-related line may be attributed to the shift of the peak of the luminescence background (see Figure 6a) rather than to the ion modification. Subsequent investigation of ion-induced rearrangement of the polyyne component is a subject of further studies.
To analyze the variation of the material structure with ion dose, the parameters of Raman spectra fitting, as shown in Figure 6b–e, were assessed. They are presented in Table 2. The fitting was carried out for Raman lines, the backgrounds of which were subtracted by OriginPro software package using a “user-defined B-spline” instrument.
The most prominent changes in the spectra include the tendencies of the HWHM increase of the ν1, ν2 and G-peak with the dose enlargement, showing ion-induced disordering. The ν1 position shifts to higher wavenumbers with the prolonged irradiation (Figure 6f, left axis), which indicates the shortening of polyenic fragments of the chains [57]. In its turn, the ratio of the intensities of the ν2 and G-line diminishes (Figure 6f, right axis), which indicates the rise of the amorphous carbon fraction accompanied by the polyenic component decrease, which also indicates the disordering of the samples.

3.5. Structural Investigations Summary

The FTIR and Raman spectroscopy studies presented in Section 3.3 and Section 3.4 reveal a low intensity of the lines related to the C≡C-bonds compared to the ones related to C=C-bonds. This result shows that the sp-hybridized chain components (polyyne) are significantly prevailed by sp2-hybridized fragments (polyenes). In the current work, we refer to the obtained structure as “polyene-polyyne-based material”, to distinguish the structure from “polyyne-polyene” naming reported in [58] and the “polyyne-ene” of [59].
In Figure 7, the illustration of the ion-induced structural rearrangements of the PPB structure is presented, summarizing the results discussed in Section 3.1, Section 3.2, Section 3.3, Section 3.4. SEM, EDX, TEM, FTIR and Raman spectroscopy revealed that KOH treatment induced the incomplete dehydrohalogenation of the PVDF structure. Particularly, the dehydrofluorination induced the formation of pores, also resulting in the formation of polyene-polyyne structure in the surface layers, while deeper, less dehydrohalogenated layers retained a PVDF-like structure. In turn, ion irradiation smoothed the surface and induced the graphitization of the subsurface layers. The sputtering of the carbon-rich surface also led to the decrease of the overall C:F ratio.
The obtained results show the features of the suggested method of the PPB structure formation via PVDF drop casting and subsequent room-temperature KOH-induced dehydrohalogenation. Recent studies have reported on PVDF dehydrohalogenation in the solution at elevated temperatures, leading to the formation of dehydrofluorinated powder [60]. Therefore, KOH treatment of PVDF dissolved in DMF is apparently less suitable for the preparation of the continuous coatings and can cause the nitrogen doping of the resulting material even at room temperature [29], which is not always desirable for such structures. As the formation of partially dehydrohalogenated PVDF materials is of recent interest [46,61], we think that the proposed method will be promising for various applications. In the current study, we analyze the sensing performance of the films.

3.6. Sensing Properties

Figure 8 shows the Δσ/σ0 dependence on the dose of ion irradiation, while the concentrations of the interacting gasses were constant. For ammonium hydroxide, the concentration was 50 ppb, for ethanol—80 ppb and for water—135 ppb. Both sp2-carbon-based and polymer-based samples are known to have significant sensing responses to NH3 [62], therefore ammonium hydroxide was chosen as a “source” of NH3, allowing us to estimate samples’ sensing response to ammonium. In the ammonium hydroxide, only a small amount of the particles form HN4++OH ions, while in liquid form, most of the substance consists of HN3+H2O solution, thus providing ammonium-containing vapor for the studies.
The conductivity of all non-irradiated samples increases during the interaction with gasses. Such an effect is typically caused by the charge transfer between adsorbed gas and the highest occupied molecular orbital (HOMO) or the lowest unoccupied molecular orbital (LUMO) of the molecules of the sample. Ammonium, ammonium hydroxide, ethanol and water molecules are known to be prominent electron donors when interacting with polymers [63,64] and carbon materials such as nanotubes [65], graphene [66] and porous carbon [67]. Therefore, the positive sensing response to NH3-containing vapor and C2H5OH shows that the non-irradiated structure is an n-type semiconductor, as its conductivity increases after electron transfer from adsorbed gas HOMO to the LUMO of the structure.
In the case of ethanol and water, irradiation by low (1016 ion/cm2) ion dose led to a significant increase in the Δσ/σ0 response (see Figure 8a,c). Apparently, this effect can be achieved by the ion-induced removal of the contamination from the sample surface [68]. However, FTIR and Raman data did not reveal any prominent difference between the non-irradiated and (1–3) × 1016-ion/cm2-irradiated samples. Notably, a significant margin of error was observed for Δσ/σ0, which shows that sensing enhancement by low-dose modification is inconsistent to some extent. Additionally, as shown in Figure 8b, for the HN3+H2O, low-dose irradiation induced the decrease in the sensing response; therefore, low-dose tuning requires additional analysis and further study.
For ammonium hydroxide and ethanol (Figure 8a,b), the increase in the irradiation dose to >3 × 10¹⁷ ion/cm2 leads to the change of a positive sensing response to a negative one; i.e., for large doses, the resistivity of the samples increased during their interaction with gasses. Therefore, ion-induced graphitization and defect formation of the samples’ subsurface layers changed the predominant type of sample conductivity from n-type by creating new energy levels, resulting in the p-type doping. Defected graphitized carbon typically has p-type conductivity, as the electron-accepting trap states are typical for sp2-based materials, such as graphene [69,70] and carbon nanotubes [71,72].
For the most prominent electron donor of the analyzed gasses (NH3-containing vapor), a gradual decrease in the Δσ/σ0 response was observed, which confirmed that the two components of the material contribute to the sensing response. Less graphitized areas (i.e., areas which are modified by the ion beam to a lesser extent) accept electrons from NH3, which positively contribute to the sensing response; however, NH3-originated electrons get trapped into ion-modified defect-rich graphitized areas, decreasing the conductivity of these regions. For the samples irradiated by a dose larger than 3 × 10¹⁷ ion/cm2, graphitized subsurface areas apparently prevail, which leads to the overall negative sensing response during the structure interaction with NH3.
The response of the structures interacting with water has an increasing trend with the rise in the irradiation dose (apart from the 1 × 10¹⁶-ion/cm2-irradiated sample, which was previously discussed), as shown in Figure 8c. Two factors should be taken into account when describing this effect. Firstly, H2O is not only an electron donor, but also has relatively good sticking ability, and the capacity of its sorption is comparatively large [73], which apparently means a relatively high amount of adsorbed water vapor in comparison to other analytes. Secondly, water dissociates more easily than ethanol [74], resulting in the formation of conductive H++OH ions. Although the energy of NH3 dissociation is even smaller [75], this process results in the formation of neutral species [76], therefore, it does not contribute to the conductivity. Therefore, in the case of water sensing, the graphitization of the surface layer may contribute to the H2O dissociation in the areas where voltage is applied, thus resulting in the Δσ increase induced by ionic conduction. The effect of dissociation-induced ionic conductivity of sensors has been reported for carbon nanotubes [77]. However, the influence of this effect on the sensitivity of the investigated structures requires further study.
Figure 9 shows the relative sensing response variation with the change of gas concentration. The decrease in the slope of the related curves at large concentrations of gasses is typical for the Langmuir adsorption isotherm [78]. A prominent saturation was observed for water and ethanol, while for ammonium hydroxide saturation, it is apparently observed at concentrations prevailing the ones used in the reported experiments. Notably, saturation is observed for both positively- and negatively-responding sensing structures, confirming that a similar mechanism of electron transfer between molecules and structure determines the sensing properties of all the samples.
Figure 10 shows the dynamics of the sensing response Δσ = σ − σ0 of the samples irradiated by various ion doses. The concentration of ammonium hydroxide was 50 ppb, of ethanol—80 ppb and of water—135 ppb. For each sample, the sensing response was independently measured, but its time variation is gradually shown for comparison. The beginning of each line indicates the introduction of vapor, while the arrows indicate its termination. For positively-responding samples, the time of the response to NH3+H2O is 2.8 min, and the relaxation time is 1 min. The response value is higher than the one measured for nanotubes. The relaxation speed of the studied structure is relatively high compared to the NH3-sensing nanotubes [79,80,81]. Apparently, it indicates that the bonding between the detected molecules and the PP structure is weaker than the one of ammonia and nanotubes. Notably, after the shift from positive to negative Δσ, the response time to ammonium hydroxide was approximately 3.1 min, and the relaxation time was 7.4 min, which indicates relatively strong gas adsorption on graphitic and defect-rich regions.
In the case of the positive Δσ during ethanol sensing, the response and the relaxation periods are approximately equal (3.6–4.2 min). After switching to the negative response, both of the periods decrease to 2 min. During water vapor sensing, the response and the relaxation periods are 3.3 min.
The selectivities of structures to particular kinds of vapors are shown in Figure 11. The concentration of ammonium hydroxide was 50 ppb, of ethanol—80 ppb and of water—135 ppb. For the non-irradiated sample, the ratios of the responses to various vapors are ΔσNH₃+H₂OC₂H₅OH = 325 and ΔσNH₃+H₂O/ΔσH₂O = 158. Irradiation by 1 × 10¹⁶ ion/cm2 dose negates the selectivity of the samples. After the ion irradiation by 3 × 10¹⁶ ion/cm2 dose, the selectivity is also slight (ΔσNH₃+H₂O/ΔσC₂H₅OH = 3 and ΔσNH₃+H₂O/ΔσH₂O = 30), for 3 × 10¹⁷ ion/cm2 irradiation dose, ΔσNH₃+H₂O/ΔσC₂H₅OH = 8 and ΔσNH₃+H₂O/ΔσH₂O = −10, for 1 × 10¹⁸ ion/cm2 irradiation dose ΔσNH₃+H₂O/ΔσC₂H₅OH = 2 and ΔσNH₃+H₂O/ΔσH₂O = −0.5. Negative values correspond to the ratios of positive and negative responses. A variable sensing response to different gasses was previously observed in [82,83].
Notably, the values of the relative responses observed for the non-irradiated sample are relatively higher than the ones reported for graphene [84,85], SnO2 [86] and polyaniline-based sensors [87], and are comparable to the selectivity reported in [88], which shows prominent selectivity of the PP materials. The ability of selective sensing of ammonia at room temperature is a prominent result, as current metal-oxide-based ammonia sensors have been operating at high temperatures, which deteriorates their properties and decreases their performance [88].
The result reported in the current section shows that the mechanism of the resistive sensing of variously graphitized PP structures is described by the conductivity variation induced by electron transfer from the adsorbed molecules to the polyenic and graphitic fragments. This conclusion reveals that the presence of sp-hybridized carbon fragments does not play a significant role in resistive sensing. The insignificant contribution of sp-carbon may be caused by the sp-carbon instability upon air exposure [89], inducing the oxidation and crosslinking of sp-chains interacting with air molecules, thus diminishing the content of sp-carbon in the surface layers and suppressing sp-carbon impact on the sensing. For the resistive sensing of polyene-polyynic structures, the impact of the sp-fragments should not be prominent, as the levels related to the π-electrons of sp-carbon insignificantly perturb the electronic properties of polyenes [90].
Tuning of the resistive sensors’ response by ion irradiation is not uncommon. However, the related studies have mostly been aimed at the formation of the defects in metal oxide structures, specifically oxygen vacancies acting as adsorption sites [91]. There have only been several studies dedicated to the ion-beam treatment of polymer-based sensors. For example, for polyvinyl chloride–polyaniline composites irradated by low-dose high-energy silicon, it was shown that their response to NH3 increased with the ion dose due to the improved efficiency of ammonia gas diffusion [92]. A similar concept was investigated in [93], where 250 MeV 106–109 ion/cm2 Kr+ flux was used to create tracks in polymer foils, thus providing a pathway and adsorption sites facilitating urease sensing. However, for WO3-poly(3,4-ethylenedioxythiophene) polystyrene sulfonate nanocomposite irradiated by 700 keV Ar4+, a 1015 ion/cm2 dose of irradiation resulted in better sensing performance than 1016 ion/cm2 irradiation due to more prominent amorphization of the material and chain scission at higher doses [94,95]. These conclusions obtained for higher ion doses are more relevant to the results discussed in the current paper.
In summary, two reported stategies of the tailoring of the polymers sensing response are high-energy (>100 keV) low-dose (<109 ion/cm2) formation of ion-track pathways for analyte transfer and sorption, and low- to middle-energy (≤100 keV) high-dose (>1014 ion/cm2) irradiation, which induces the changes of the surface chemistry. Although studies and [94] have indicated that ion-induced cross-linking, graphitization and disordering of polymers are unavoidable at high doses, further results may be obtained in the irradiation modes, ensuring that surface etching and modification takes place without prominent damage and graphitization of the structure.

4. Key Findings

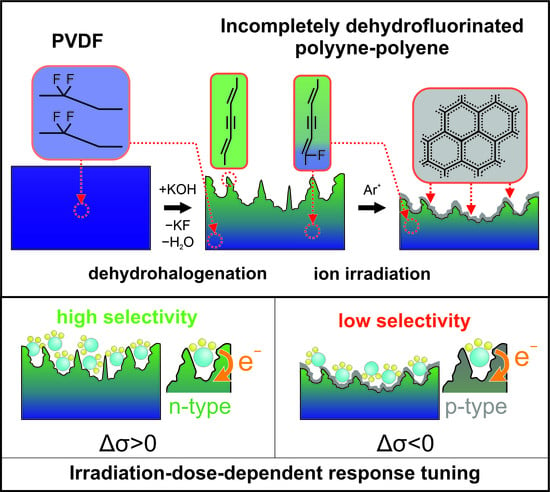
  • Drop-casting of the dissolved PVDF and its subsequent room-temperature dehydrohalogenation in KOH allows for the formation of the polyene-polyyne-based film with selected dimensions.
  • Subsurface polyene-polyyne layers of the structure have resistive sensing properties.
  • Selective highly-selective room-temperature sensing of ammonium hydroxide was observed.
  • Polyene-polyyne graphitization induced by ion irradiation varied the type of sensing response, but reduced its selectivity to the ammonia-containing vapor.
The reported facile and scalable method for the formation of ammonia sensors is of interest for safety monitoring in the chemical industry and for breath monitoring, as NH3 is also a biomarker [96]. Further studies should be aimed at increasing the availability of the pores in the polyene-polyyne material and at the formation of field-effect-transistor-based polyene-polyyne sensors, allowing us to tune the carrier concentration, thus improving the detection threshold.

5. Conclusions

Polyene-polyyne-based structures, i.e., structures based on chains with major polyenic (sp2-carbon polymer) and minor polyynic (sp-carbon) fragments, were investigated. The studied material was synthesized by PVDF film drop-casting and subsequent KOH treatment at room temperature. The variation of the film composition with ion irradiation revealed that the structure was partially dehydrohalogenated, with a remaining-fluorine-rich structure in the deeper layers. KOH-treatment-induced pore formation was observed. Irradiation of the structure by 150 eV Ar+ induced the graphitization and disordering of the subsurface layers.
The non-irradiated polyene-polyyne structure showed a comparatively selective resistive sensing response to NH3+H2O vapor compared to the C2H5OH and H2O vapors at room temperature (ΔσNH₃+H₂O/ΔσC₂H₅OH = 325, ΔσNH₃+H₂O/ΔσH₂O = 158). Ion irradiation decreased the selectivity of the sensing response. For the prominent electron donors (NH3-containing vapor and C2H5OH), irradiation doses exceeding 3 × 10¹⁷ ion/cm2 induced the change in the sensing response from conductivity increase to decrease. This effect is attributed to the change in the subsurface layers’ conductivity from n-type to p-type.

Author Contributions

Conceptualization: O.A.S.; methodology, O.A.S. and O.Y.N.; software, I.A.Z. and I.F.N.; validation, I.A.Z. and N.F.S.; formal analysis, I.A.Z., O.A.S. and I.F.N.; investigation, O.A.S., I.F.N., O.Y.N., A.A.T. and A.V.P.; resources, O.A.S. and O.Y.N.; data curation, I.A.Z. and O.A.S.; writing—original draft preparation, I.A.Z., O.A.S. and I.F.N.; writing—review and editing, N.F.S., O.Y.N. and A.V.P.; visualization, I.A.Z. and O.A.S.; supervision, O.A.S. and A.V.P.; project administration, O.A.S. and A.V.P.; funding acquisition, I.A.Z. All authors have read and agreed to the published version of the manuscript.

Funding

I. Zavidovskiy acknowledges the support of the Basis Foundation fellowship program, grant 20-2-2-7-1. This work was supported by the Ministry of Science and Higher Education of the Russian Federation (Agreement No. 075-15-2022-1150).

Data Availability Statement

Not applicable.

Acknowledgments

The authors greatly acknowledge the Laser Complex for Precision Cutting MikroSET-M acquired as part of the development program of Moscow State University.

Conflicts of Interest

The authors declare no conflict of interest. The funders had no role in the design of the study; in the collection, analyses, or interpretation of data; in the writing of the manuscript; or in the decision to publish the results.

References

  1. Wang, Z.; Zhu, L.; Sun, S.; Wang, J.; Yan, W. One-Dimensional Nanomaterials in Resistive Gas Sensor: From Material Design to Application. Chemosensors 2021, 9, 198. [Google Scholar] [CrossRef]
  2. Zhou, T.; Zhang, T. Recent Progress of Nanostructured Sensing Materials from 0D to 3D: Overview of Structure–Property-Application Relationship for Gas Sensors. Small Methods 2021, 5, 2100515. [Google Scholar] [CrossRef] [PubMed]
  3. Yang, B.; Myung, N.V.; Tran, T.-T. 1D Metal Oxide Semiconductor Materials for Chemiresistive Gas Sensors: A Review. Adv. Electron. Mater. 2021, 7, 2100271. [Google Scholar] [CrossRef]
  4. Xiao, Z.; Kong, L.B.; Ruan, S.; Li, X.; Yu, S.; Li, X.; Jiang, Y.; Yao, Z.; Ye, S.; Wang, C.; et al. Recent Development in Nanocarbon Materials for Gas Sensor Applications. Sens. Actuators B Chem. 2018, 274, 235–267. [Google Scholar] [CrossRef]
  5. Nikolic, M.V.; Milovanovic, V.; Vasiljevic, Z.Z.; Stamenkovic, Z. Semiconductor Gas Sensors: Materials, Technology, Design, and Application. Sensors 2020, 20, 6694. [Google Scholar] [CrossRef]
  6. Roy, A.; Ray, A.; Sadhukhan, P.; Naskar, K.; Lal, G.; Bhar, R.; Sinha, C.; Das, S. Polyaniline-Multiwalled Carbon Nanotube (PANI-MWCNT): Room Temperature Resistive Carbon Monoxide (CO) Sensor. Synth. Met. 2018, 245, 182–189. [Google Scholar] [CrossRef]
  7. Seekaew, Y.; Pon-On, W.; Wongchoosuk, C. Ultrahigh Selective Room-Temperature Ammonia Gas Sensor Based on Tin–Titanium Dioxide/Reduced Graphene/Carbon Nanotube Nanocomposites by the Solvothermal Method. ACS Omega 2019, 4, 16916–16924. [Google Scholar] [CrossRef] [Green Version]
  8. Serban, B.C.; Buiu, O.; Dumbravescu, N.; Cobianu, C.; Avramescu, V.; Brezeanu, M.; Bumbac, M.; Pachiu, C.; Nicolescu, C.M. Oxidized Carbon Nanohorn-Hydrophilic Polymer Nanocomposite as the Resistive Sensing Layer for Relative Humidity. Anal. Lett. 2021, 54, 527–540. [Google Scholar] [CrossRef]
  9. Yang, M.; Zhang, X.; Guo, C.; Cheng, X.; Zhu, C.; Xu, Y.; Major, Z.; Huo, L. Resistive Room Temperature DMA Gas Sensor Based on the Forest-like Unusual n-Type PANI/TiO2 Nanocomposites. Sens. Actuators B Chem. 2021, 342, 130067. [Google Scholar] [CrossRef]
  10. Salman, Z.; Nair, A.; Tung, S. One-Dimensional Carbon Chains as Electrical Sensors for Single-Stranded DNA. In Proceedings of the 2017 IEEE 12th International Conference on Nano/Micro Engineered and Molecular Systems (NEMS), Los Angeles, CA, USA, 9–12 April 2017; IEEE: Los Angeles, CA, USA, 2017; pp. 677–681. [Google Scholar]
  11. Wu, B.; Li, M.; Xiao, S.; Qu, Y.; Qiu, X.; Liu, T.; Tian, F.; Li, H.; Xiao, S. A Graphyne-like Porous Carbon-Rich Network Synthesized via Alkyne Metathesis. Nanoscale 2017, 9, 11939–11943. [Google Scholar] [CrossRef]
  12. Li, J.; Wan, C.; Wang, C.; Zhang, H.; Chen, X. 2D Material Chemistry: Graphdiyne-Based Biochemical Sensing. Chem. Res. Chin. Univ. 2020, 36, 622–630. [Google Scholar] [CrossRef]
  13. Nikmanesh, S.; Safaiee, R.; Sheikhi, M.H. A Novel High-Performance Methane Sensor Based on Ti-Decorated 2D γ-Graphyne: A Dispersion-Corrected DFT Insight. Mater. Chem. Phys. 2021, 257, 123808. [Google Scholar] [CrossRef]
  14. Smirnov, A.V.; Kazakov, V.A.; Platonov, P.S.; Tyunterov, E.S. Synthesis and Study of the Gas Sensitive Properties of Composite Thin Films of Copper Oxide and Linear Chain Carbon. J. Phys. Conf. Ser. 2020, 1697, 012133. [Google Scholar] [CrossRef]
  15. Hsu, H.H.; Zhang, X.; Xu, K.; Wang, Y.; Wang, Q.; Luo, G.; Xing, M.; Zhong, W. Self-Powered and Plant-Wearable Hydrogel as LED Power Supply and Sensor for Promoting and Monitoring Plant Growth in Smart Farming. Chem. Eng. J. 2021, 422, 129499. [Google Scholar] [CrossRef]
  16. Zhu, M.; Zhang, J.; Xu, W.; Xiong, R.; Huang, C. Cellulose-Based Fibrous Materials for Self-Powered Wearable Pressure Sensor: A Mini Review. Cellulose 2023, 30, 1981–1998. [Google Scholar] [CrossRef]
  17. Zhu, M.; Yu, J.; Li, Z.; Ding, B. Self-Healing Fibrous Membranes. Angew. Chem. 2022, 134, e202208949. [Google Scholar] [CrossRef]
  18. Aziz, T.; Mehmood, S.; Haq, F.; Ullah, R.; Khan, F.U.; Ullah, B.; Raheel, M.; Iqbal, M.; Ullah, A. Synthesis and Modification of Silica-based Epoxy Nanocomposites with Different Sol–Gel Process Enhanced Thermal and Mechanical Properties. J. Appl. Polym. Sci. 2021, 138, 51191. [Google Scholar] [CrossRef]
  19. Aziz, T.; Farid, A.; Haq, F.; Kiran, M.; Ullah, N.; Faisal, S.; Ali, A.; Khan, F.U.; You, S.; Bokhari, A.; et al. Role of Silica-Based Porous Cellulose Nanocrystals in Improving Water Absorption and Mechanical Properties. Environ. Res. 2023, 222, 115253. [Google Scholar] [CrossRef]
  20. Wang, Y.; Wang, H.; Liu, K.; Wang, T.; Yuan, C.; Yang, H. Effect of Dehydrofluorination Reaction on Structure and Properties of PVDF Electrospun Fibers. RSC Adv. 2021, 11, 30734–30743. [Google Scholar] [CrossRef]
  21. Krishnamoorthy, K.; Mariappan, V.K.; Pazhamalai, P.; Sahoo, S.; Kim, S.-J. Mechanical Energy Harvesting Properties of Free-Standing Carbyne Enriched Carbon Film Derived from Dehydrohalogenation of Polyvinylidene Fluoride. Nano Energy 2019, 59, 453–463. [Google Scholar] [CrossRef]
  22. Dias, A.J.; McCarthy, T.J. Dehydrofluorination of Poly(Vinylidene Fluoride) in Dimethylformamide Solution: Synthesis of an Operationally Soluble Semiconducting Polymer. J. Polym. Sci. Polym. Chem. Ed. 1985, 23, 1057–1061. [Google Scholar] [CrossRef]
  23. Yoshimura, S.; Tsukazaki, Y.; Kiuchi, M.; Sugimoto, S.; Hamaguchi, S. Sputtering Yields and Surface Modification of Poly(Methyl Methacrylate) (PMMA) by Low-Energy Ar + / Ion Bombardment with Vacuum Ultraviolet (VUV) Photon Irradiation. J. Phys. D Appl. Phys. 2012, 45, 505201. [Google Scholar] [CrossRef]
  24. Koval, Y.; Geworski, A.; Gieb, K.; Lazareva, I.; Müller, P. Fabrication and Characterization of Glassy Carbon Membranes. J. Vac. Sci. Technol. B Nanotechnol. Microelectron. Mater. Process. Meas. Phenom. 2014, 32, 042001. [Google Scholar] [CrossRef]
  25. El-Saftawy, A.A.; Abd El Aal, S.A.; Badawy, Z.M.; Soliman, B.A. Investigating Wettability and Optical Properties of PADC Polymer Irradiated by Low Energy Ar Ions. Surf. Coat. Technol. 2014, 253, 249–254. [Google Scholar] [CrossRef]
  26. Streletskiy, O.; Zavidovskiy, I.; Yakubovsky, D.; Doroshina, N.; Syuy, A.; Lebedinskij, Y.; Markeev, A.; Arsenin, A.; Volkov, V.; Novikov, S. Tailoring of the Distribution of SERS-Active Silver Nanoparticles by Post-Deposition Low-Energy Ion Beam Irradiation. Materials 2022, 15, 7721. [Google Scholar] [CrossRef]
  27. Chang, Y.; Pang, Y.; Dang, Q.; Kumar, A.; Zhang, G.; Chang, Z.; Sun, X. Converting Polyvinyl Chloride Plastic Wastes to Carbonaceous Materials via Room-Temperature Dehalogenation for High-Performance Supercapacitor. ACS Appl. Energy Mater. 2018, 1, 5685–5693. [Google Scholar] [CrossRef]
  28. Chang, Y.; Zhang, G.; Han, B.; Li, H.; Hu, C.; Pang, Y.; Chang, Z.; Sun, X. Polymer Dehalogenation-Enabled Fast Fabrication of N,S-Codoped Carbon Materials for Superior Supercapacitor and Deionization Applications. ACS Appl. Mater. Interfaces 2017, 9, 29753–29759. [Google Scholar] [CrossRef]
  29. Zhang, G.; Wang, L.; Hao, Y.; Jin, X.; Xu, Y.; Kuang, Y.; Dai, L.; Sun, X. Unconventional Carbon: Alkaline Dehalogenation of Polymers Yields N-Doped Carbon Electrode for High-Performance Capacitive Energy Storage. Adv. Funct. Mater. 2016, 26, 3340–3348. [Google Scholar] [CrossRef]
  30. Zhang, G.; Jin, X.; Li, H.; Wang, L.; Hu, C.; Sun, X. N-Doped Crumpled Graphene: Bottom-up Synthesis and Its Superior Oxygen Reduction Performance. Sci. China Mater. 2016, 59, 337–347. [Google Scholar] [CrossRef] [Green Version]
  31. Zhivulin, V.E.; Pesin, L.A.; Belenkov, E.A.; Greshnyakov, V.A.; Zlobina, N.; Brzhezinskaya, M. Ageing of Chemically Modified Poly(Vinylidene Fluoride) Film: Evolution of Triple Carbon-Carbon Bonds Infrared Absorption. Polym. Degrad. Stab. 2020, 172, 109059. [Google Scholar] [CrossRef]
  32. Wäsche, M.; Lippitz, A.; Pinnow, M.; Kunze, R. An XPS Study of Poly(Vinylidene Fluoride) Surfaces Irradiated by Low Energy Argon Ions. Acta Polym. 1988, 39, 403–405. [Google Scholar] [CrossRef]
  33. Cai, X.; Lei, T.; Sun, D.; Lin, L. A Critical Analysis of the α, β and γ Phases in Poly(Vinylidene Fluoride) Using FTIR. RSC Adv. 2017, 7, 15382–15389. [Google Scholar] [CrossRef] [Green Version]
  34. Bormashenko, Y.; Pogreb, R.; Stanevsky, O.; Bormashenko, E. Vibrational Spectrum of PVDF and Its Interpretation. Polym. Test. 2004, 23, 791–796. [Google Scholar] [CrossRef]
  35. Ţucureanu, V.; Matei, A.; Avram, A.M. FTIR Spectroscopy for Carbon Family Study. Crit. Rev. Anal. Chem. 2016, 46, 502–520. [Google Scholar] [CrossRef]
  36. Prabakaran, K.; Mohanty, S.; Nayak, S.K. Solid State Metal-Free Eosin-Y Dye Sensitized Solar Cell Based on PVdF-HFP Electrolytes: Combined Effect of Surface Modified TiO2 and Plasticizer on Electrochemical and Photovoltaic Properties. J. Solid State Electrochem. 2015, 19, 2465–2479. [Google Scholar] [CrossRef]
  37. Pamuła, E.; Błażewicz, M.; Paluszkiewicz, C.; Dobrzyński, P. FTIR Study of Degradation Products of Aliphatic Polyesters–Carbon Fibres Composites. J. Mol. Struct. 2001, 596, 69–75. [Google Scholar] [CrossRef]
  38. Dahmouchène, N.; Coppée, S.; Voué, M.; De Coninck, J. Silver Nanoparticles Embedded in Polymer Matrices—A FTIR-SE Study. Phys. Status Solidi C 2008, 5, 1210–1214. [Google Scholar] [CrossRef]
  39. Lucotti, A.; Tommasini, M.; Fazzi, D.; Del Zoppo, M.; Chalifoux, W.A.; Ferguson, M.J.; Zerbi, G.; Tykwinski, R.R. Evidence for Solution-State Nonlinearity of Sp-Carbon Chains Based on IR and Raman Spectroscopy: Violation of Mutual Exclusion. J. Am. Chem. Soc. 2009, 131, 4239–4244. [Google Scholar] [CrossRef]
  40. Leong, T.X.; Collins, B.K.; Dey Baksi, S.; Mackin, R.T.; Sribnyi, A.; Burin, A.L.; Gladysz, J.A.; Rubtsov, I.V. Tracking Energy Transfer across a Platinum Center. J. Phys. Chem. A 2022, 126, 4915–4930. [Google Scholar] [CrossRef]
  41. Zhivulin, V.E.; Chernov, V.M.; Osipov, A.A.; Shtenberg, M.V.; Evsyukov, S.E.; Pesin, L.A. Analysis of the Change in the Concentration of Fluorine and Hydrogen as a Result of Chemical Dehydrofluorination of Polyvinylidene Fluoride. Phys. Solid State 2017, 59, 1414–1419. [Google Scholar] [CrossRef]
  42. Ehrendorfer, C.; Neugebauer, H.; Neckel, A.; Bäuerle, P. An FTIR Spectroscopic Study on End-Capped Oligothiophenes as Model Compounds for Polythiophene. Synth. Met. 1993, 55, 493–498. [Google Scholar] [CrossRef]
  43. Guo, L.; Wu, S.; Zeng, F.; Zhao, J. Synthesis and Fluorescence Property of Terbium Complex with Novel Schiff-Base Macromolecular Ligand. Eur. Polym. J. 2006, 42, 1670–1675. [Google Scholar] [CrossRef]
  44. Alghunaim, N.S. Optimization and Spectroscopic Studies on Carbon Nanotubes/PVA Nanocomposites. Results Phys. 2016, 6, 456–460. [Google Scholar] [CrossRef] [Green Version]
  45. Streletskiy, O.A.; Nishchak, O.Y.; Zavidovskiy, I.A.; Maslakov, K.I.; Pavlikov, A.V. Sp-Based Thin Films Synthesized by Magnetron Sputtering of Dehydrohalogenated Polyvinylidenchloride. Thin Solid Film. 2021, 739, 138993. [Google Scholar] [CrossRef]
  46. Qu, P.; Liu, X.; Wang, S.; Xiao, C.; Liu, S. Moderate Dehydrofluorinated PVDF with High Energy Density. Mater. Lett. 2018, 221, 275–278. [Google Scholar] [CrossRef]
  47. Kuznetsov, S.M.; Sagitova, E.A.; Prokhorov, K.A.; Nikolaeva, G.Y.; Mendeleev, D.I.; Donfack, P.; Materny, A. Raman Spectroscopic Detection of Polyene-Length Distribution for High-Sensitivity Monitoring of Photo- and Thermal Degradation of Polyvinylchloride. Spectrochim. Acta Part A Mol. Biomol. Spectrosc. 2021, 252, 119494. [Google Scholar] [CrossRef]
  48. Kise, H.; Ogata, H. Phase Transfer Catalysis in Dehydrofluorination of Poly(Vinylidene Fluoride) by Aqueous Sodium Hydroxide Solutions. J. Polym. Sci. Polym. Chem. Ed. 1983, 21, 3443–3451. [Google Scholar] [CrossRef]
  49. Suslova, E.; Viktorova, A.; Osipov, N.; Maslakov, K.; Kuznetsova, N. The Influence of Heterosubstitution on Carbon Foams Characteristics as Electrode Materials for Lithium-Ion Batteries. Funct. Mater. Lett. 2020, 13, 2040003. [Google Scholar] [CrossRef]
  50. Palomo, L.; Rodríguez, R.; Medina, S.; Quiñoá, E.; Casado, J.; Freire, F.; Ramírez, F.J. Raman Optical Activity (ROA) as a New Tool to Elucidate the Helical Structure of Poly(Phenylacetylene)s. Angew. Chem. 2020, 132, 9165–9172. [Google Scholar] [CrossRef]
  51. Streletskiy, O.A.; Zavidovskiy, I.A.; Balabanyan, V.Y.; Tsiskarashvili, A.V. Antibacterial Properties of Modified A-C and Ta-C Coatings: The Effects of the Sp2/Sp3 Ratio, Oxidation, Nitridation, and Silver Incorporation. Appl. Phys. A 2022, 128, 929. [Google Scholar] [CrossRef]
  52. Maia, L.F.; De Oliveira, V.E.; Edwards, H.G.M.; De Oliveira, L.F.C. The Diversity of Linear Conjugated Polyenes and Colours in Nature: Raman Spectroscopy as a Diagnostic Tool. ChemPhysChem 2021, 22, 231–249. [Google Scholar] [CrossRef] [PubMed]
  53. Streletskiy, O.; Perevedentseva, E.; Zavidovskiy, I.; Karmenyan, A.; Sychev, V.; Sadykova, V.; Kuvarina, A.; Cheng, C.-L. Amorphous Carbon Films with Embedded Well-Dispersed Nanodiamonds: Plasmon-Enhanced Analysis and Possible Antimicrobial Applications. Magnetochemistry 2022, 8, 171. [Google Scholar] [CrossRef]
  54. Streletskiy, O.A.; Zavidovskiy, I.A.; Nischak, O.Y.; Pavlikov, A.V. Multiphonon Replicas in Raman Spectra and Conductivity Properties of Carbon Films with Different Concentrations of Sp1-Bonds. Thin Solid Films 2019, 671, 31–35. [Google Scholar] [CrossRef]
  55. Cataldo, F. Raman spectra and thermal analysis on polyyne and polyene-yne chain segments. J. Macromol. Sci. Part A 2000, 37, 881–892. [Google Scholar] [CrossRef]
  56. Tyagi, C.; Khan, S.A.; Sulania, I.; Meena, R.; Avasthi, D.K.; Tripathi, A. Evidence of Ion-Beam-Induced Annealing in Graphene Oxide Films Using in Situ X-Ray Diffraction and Spectroscopy Techniques. J. Phys. Chem. C 2018, 122, 9632–9640. [Google Scholar] [CrossRef]
  57. Schaffer, H.E.; Chance, R.R.; Silbey, R.J.; Knoll, K.; Schrock, R.R. Conjugation Length Dependence of Raman Scattering in a Series of Linear Polyenes: Implications for Polyacetylene. J. Chem. Phys. 1991, 94, 4161–4170. [Google Scholar] [CrossRef] [Green Version]
  58. Heimann, R.B. Diamond Synthesis from Carbyne. In Carbyne and Carbynoid Structures; Heimann, R.B., Evsyukov, S.E., Kavan, L., Eds.; Physics and Chemistry of Materials with Low-Dimensional Structures; Springer: Dordrecht, The Netherlands, 1999; pp. 409–425. ISBN 978-94-011-4742-2. [Google Scholar]
  59. Cataldo, F. Synthesis of Polyynes (and Ene-Ynes) Segments by Dechlorination Reactions of Chlorinated Polyethylene Wax and Chlorinated Docosane. J. Mater. Sci. 2000, 35, 2413–2419. [Google Scholar] [CrossRef]
  60. Lu, H.; Du, J.; Zhang, H.; Guo, X.; Du, J.; Zhang, Y.; Li, C.; Dong, L.; Chen, Y. High Energy Storage Capacitance of Defluorinated Polyvinylidene Fluoride and Polyvinylidene Fluoride Blend Alloy for Capacitor Applications. J. Appl. Polym. Sci. 2020, 137, 49055. [Google Scholar] [CrossRef]
  61. Zhivulin, V.E.; Evsyukov, S.E.; Chalov, D.A.; Morilova, V.M.; Andreychuk, V.P.; Khairanov, R.K.; Margamov, I.G.; Pesin, L.A. Evolution of the Molecular Structure of Partially Dehydrofluorinated Poly(Vinylidene Fluoride) Films upon Storage in Air. J. Surf. Investig. 2022, 16, 673–681. [Google Scholar] [CrossRef]
  62. Chakraborthy, A.; Nuthalapati, S.; Nag, A.; Afsarimanesh, N.; Alahi, M.E.E.; Altinsoy, M.E. A Critical Review of the Use of Graphene-Based Gas Sensors. Chemosensors 2022, 10, 355. [Google Scholar] [CrossRef]
  63. Namsheer, K.; Rout, C.S. Conducting Polymers: A Comprehensive Review on Recent Advances in Synthesis, Properties and Applications. RSC Adv. 2021, 11, 5659–5697. [Google Scholar] [CrossRef]
  64. Kwak, D.; Lei, Y.; Maric, R. Ammonia Gas Sensors: A Comprehensive Review. Talanta 2019, 204, 713–730. [Google Scholar] [CrossRef]
  65. Muangrat, W.; Obata, M.; Hashimoto, Y. Enhancement Sensitivity and Selectivity of Ammonium Hydroxide Using Nitrogen-Doped Double-Walled Carbon Nanotubes. Trends Sci. 2022, 19, 2891. [Google Scholar] [CrossRef]
  66. Ahmadi, S.; Afzalzadeh, R. Few-Layer Graphene Doped with Boron to Enhance Ammonium Hydroxide Vapour Detection at Low Temperature. Micro Nano Lett. 2018, 13, 363–368. [Google Scholar] [CrossRef]
  67. Liu, K.; Yang, P.; Li, S.; Li, J.; Ding, T.; Xue, G.; Chen, Q.; Feng, G.; Zhou, J. Induced Potential in Porous Carbon Films through Water Vapor Absorption. Angew. Chem. Int. Ed. 2016, 55, 8003–8007. [Google Scholar] [CrossRef] [PubMed]
  68. Kumar, R.; Goel, N.; Kumar, M. UV-Activated MoS 2 Based Fast and Reversible NO 2 Sensor at Room Temperature. ACS Sens. 2017, 2, 1744–1752. [Google Scholar] [CrossRef] [PubMed]
  69. Piazza, A.; Giannazzo, F.; Buscarino, G.; Fisichella, G.; La Magna, A.; Roccaforte, F.; Cannas, M.; Gelardi, F.M.; Agnello, S. Effect of Air on Oxygen P-Doped Graphene on SiO2. Phys. Status Solidi A 2016, 213, 2341–2344. [Google Scholar] [CrossRef]
  70. Yuan, W.; Huang, L.; Zhou, Q.; Shi, G. Ultrasensitive and Selective Nitrogen Dioxide Sensor Based on Self-Assembled Graphene/Polymer Composite Nanofibers. ACS Appl. Mater. Interfaces 2014, 6, 17003–17008. [Google Scholar] [CrossRef] [PubMed]
  71. Schroeder, V.; Savagatrup, S.; He, M.; Lin, S.; Swager, T.M. Carbon Nanotube Chemical Sensors. Chem. Rev. 2019, 119, 599–663. [Google Scholar] [CrossRef] [PubMed]
  72. Zhao, J.; Buldum, A.; Han, J.; Lu, J.P. Gas Molecule Adsorption in Carbon Nanotubes and Nanotube Bundles. Nanotechnology 2002, 13, 195. [Google Scholar] [CrossRef]
  73. Harra, D.J. Review of Sticking Coefficients and Sorption Capacities of Gases on Titanium Films. J. Vac. Sci. Technol. 1998, 13, 471. [Google Scholar] [CrossRef]
  74. Levko, D.S.; Tsymbalyuk, A.N. Analysis of Possibilities for the Development of Ultraviolet Emitters Based on Ethanol Molecules. Tech. Phys. Lett. 2013, 39, 271–273. [Google Scholar] [CrossRef]
  75. Su, K.; Hu, X.; Li, X.; Wang, Y.; Web, Z. High-Level Ab Initio Calculation and Assessment of the Dissociation and Ionization Energies of NH2 and NH3 Neutrals or Cations. Chem. Phys. Lett. 1996, 258, 431–435. [Google Scholar] [CrossRef]
  76. McCarthy, M.I.; Rosmus, P.; Werner, H.-J.; Botschwina, P.; Vaida, V. Dissociation of NH 3 to NH 2 +H. J. Chem. Phys. 1987, 86, 6693–6700. [Google Scholar] [CrossRef]
  77. Han, J.-W.; Kim, B.; Li, J.; Meyyappan, M. Carbon Nanotube Based Humidity Sensor on Cellulose Paper. J. Phys. Chem. C 2012, 116, 22094–22097. [Google Scholar] [CrossRef]
  78. Bartlett, P.N.; Ling-Chung, S.K. Conducting Polymer Gas Sensors Part II: Response of Polypyrrole to Methanol Vapour. Sens. Actuators 1989, 19, 141–150. [Google Scholar] [CrossRef]
  79. Quang, N.H.; Van Trinh, M.; Lee, B.-H.; Huh, J.-S. Effect of NH3 Gas on the Electrical Properties of Single-Walled Carbon Nanotube Bundles. Sens. Actuators B Chem. 2006, 113, 341–346. [Google Scholar] [CrossRef]
  80. Nguyen, H.-Q.; Huh, J.-S. Behavior of Single-Walled Carbon Nanotube-Based Gas Sensors at Various Temperatures of Treatment and Operation. Sens. Actuators B Chem. 2006, 117, 426–430. [Google Scholar] [CrossRef]
  81. Kong, J.; Franklin, N.R.; Zhou, C.; Chapline, M.G.; Peng, S.; Cho, K.; Dai, H. Nanotube Molecular Wires as Chemical Sensors. Science 2000, 287, 622–625. [Google Scholar] [CrossRef]
  82. Camargo Moreira, Ó.L.; Cheng, W.-Y.; Fuh, H.-R.; Chien, W.-C.; Yan, W.; Fei, H.; Xu, H.; Zhang, D.; Chen, Y.; Zhao, Y.; et al. High Selectivity Gas Sensing and Charge Transfer of SnSe2. ACS Sens. 2019, 4, 2546–2552. [Google Scholar] [CrossRef]
  83. Niu, L.; Luo, Y.; Li, Z. A Highly Selective Chemical Gas Sensor Based on Functionalization of Multi-Walled Carbon Nanotubes with Poly(Ethylene Glycol). Sens. Actuators B Chem. 2007, 126, 361–367. [Google Scholar] [CrossRef]
  84. Kumar, R.; Ghosh, R. Selective Determination of Ammonia, Ethanol and Acetone by Reduced Graphene Oxide Based Gas Sensors at Room Temperature. Sens. Bio-Sens. Res. 2020, 28, 100336. [Google Scholar] [CrossRef]
  85. Freddi, S.; Vergari, M.; Pagliara, S.; Sangaletti, L. A Chemiresistor Sensor Array Based on Graphene Nanostructures: From the Detection of Ammonia and Possible Interfering VOCs to Chemometric Analysis. Sensors 2023, 23, 882. [Google Scholar] [CrossRef] [PubMed]
  86. Hijazi, M.; Stambouli, V.; Rieu, M.; Tournier, G.; Pijolat, C.; Viricelle, J.-P. Sensitive and Selective Ammonia Gas Sensor Based on Molecularly Modified SnO2. Proceedings 2017, 1, 399. [Google Scholar] [CrossRef] [Green Version]
  87. Kroutil, J.; Laposa, A.; Povolny, V.; Klimsa, L.; Husak, M. Gas Sensor with Different Morphology of PANI Layer. Sensors 2023, 23, 1106. [Google Scholar] [CrossRef] [PubMed]
  88. Nadekar, B.; Khollam, Y.B.; Shaikh, S.F.; Trimukhe, A.; Deshmukh, R.; More, P.S.; Siddiqui, M.U.H.; Rana, A.u.H.S.; Palaniswami, M. Plasma-Polymerized Thiophene-Reduced Graphene Oxide Composite Film Sensor for Ammonia/Amine Detection at Room Temperature. Chemosensors 2023, 11, 42. [Google Scholar] [CrossRef]
  89. Ravagnan, L.; Siviero, F.; Lenardi, C.; Piseri, P.; Barborini, E.; Milani, P.; Casari, C.S.; Li Bassi, A.; Bottani, C.E. Cluster-Beam Deposition and in Situ Characterization of Carbyne-Rich Carbon Films. Phys. Rev. Lett. 2002, 89, 285506. [Google Scholar] [CrossRef] [Green Version]
  90. Baughman, R.H.; Chance, R.R. Comments on the Optical Properties of Fully Conjugated Polymers: Analogy between Polyenes and Polydiacetylenes. J. Polym. Sci. Polym. Phys. Ed. 1976, 14, 2037–2045. [Google Scholar] [CrossRef]
  91. Majhi, S.M.; Mirzaei, A.; Navale, S.; Kim, H.W.; Kim, S.S. Boosting the Sensing Properties of Resistive-Based Gas Sensors by Irradiation Techniques: A Review. Nanoscale 2021, 13, 4728–4757. [Google Scholar] [CrossRef]
  92. Srivastava, A.; Singh, V.; Dhand, C.; Kaur, M.; Singh, T.; Witte, K.; Scherer, U.W. Study of Swift Heavy Ion Modified Conducting Polymer Composites for Application as Gas Sensor. Sensors 2006, 6, 262–269. [Google Scholar] [CrossRef] [Green Version]
  93. Fink, D.; Muñoz Hernandez, G.; Alfonta, L. Highly Sensitive Urea Sensing with Ion-Irradiated Polymer Foils. Nucl. Instrum. Methods Phys. Res. Sect. B Beam Interact. Mater. At. 2012, 273, 164–170. [Google Scholar] [CrossRef]
  94. Ram, J.; Singh, R.G.; Singh, F.; Chauhan, V.; Gupta, D.; Kumar, V.; Kumar, U.; Yadav, B.C.; Kumar, R. Ion Beam Engineering in WO3-PEDOT: PSS Hybrid Nanocomposite Thin Films for Gas Sensing Measurement at Room Temperature. Inorg. Chem. Commun. 2020, 119, 108000. [Google Scholar] [CrossRef]
  95. Shakeel, A.; Rizwan, K.; Farooq, U.; Iqbal, S.; Altaf, A.A. Advanced Polymeric/Inorganic Nanohybrids: An Integrated Platform for Gas Sensing Applications. Chemosphere 2022, 294, 133772. [Google Scholar] [CrossRef] [PubMed]
  96. Bannov, A.G.; Popov, M.V.; Brester, A.E.; Kurmashov, P.B. Recent Advances in Ammonia Gas Sensors Based on Carbon Nanomaterials. Micromachines 2021, 12, 186. [Google Scholar] [CrossRef] [PubMed]
Figure 1. Schematics of the sensor manufacturing.
Jcs 07 00156 g001
Figure 2. (a) Image of the uncoated track made by aluminum deposition on a masked polyene-polyyne-based structure. (b) Microphotography of the structure obtained by metallographic microscope. The length of the scale bar is 500 μm.
Jcs 07 00156 g002
Figure 3. TEM image of polyene-polyyne-based structure. Characteristic parts of the image are indicated.
Jcs 07 00156 g003
Figure 4. SEM images of the samples irradiated with various ion doses indicated above the sub-figures. The length of the scale bar is 1 µm.
Jcs 07 00156 g004
Figure 5. FTIR of the polyene-polyyne-based sample. The characteristic types of bonds, the vibrations of which result in the absorption band emergence, are indicated. Colors indicate various sets of lines and arrows associated with them.
Jcs 07 00156 g005
Figure 6. (a) Raman spectra of the studied structure. Indicated bonds are attributed to the positions of major peaks. (b,c) The fitting of the background-subtracted Raman spectra of non-irradiated sample (b) and samples irradiated with 3 × 10¹⁷ (c), 6 × 10¹⁷ (d), 1 × 10¹⁸ (e) ion/cm2 doses. (be) show experimental data (black lines), fitting components: ν1 (orange lines), lines comprised of D-peak and cis-ν1 sum (blue lines), ν2 (green lines), G-peak (violet lines), as well as the sum of fitting components (other lines). (f) shows the ν1 position (left axis), the ratio of ν2 and G-line (right axis) and their variation with the change of irradiation dose. (g) Background-subtracted spectrum of the sample irradiated with 3 × 10¹⁷ ion/cm2 in the region corresponding to C≡C vibration, non-smoothed (black line) and smoothed (red line) curves are shown.
Jcs 07 00156 g006
Figure 7. Summary of the structural analysis. The processes of the incomplete thickness-dependent dehydrofluorination and ion-irradation-induced graphitization of the sample surface are shown.
Jcs 07 00156 g007
Figure 8. Normalized resistive sensing response of the polyene-polyyne structure irradiated with various ion doses to (a) NH3, (b) C2H5OH and (c) H2O vapors.
Jcs 07 00156 g008
Figure 9. Normalized resistive sensing response of the polyene-polyyne structure irradiated with various ion doses to various concentrations of (a) NH3, (b) C2H5OH and (c) H2O vapors.
Jcs 07 00156 g009
Figure 10. Dynamics of the normalized resistive sensing response of the polyene-polyyne structure irradiated with various ion doses to (a) NH3+H2O, (b) C2H5OH and (c) H2O vapors. Arrows indicate the termination of the vapor source.
Jcs 07 00156 g010
Figure 11. Comparison of the sensing responses of the samples irradiated by various ion doses to different gasses.
Jcs 07 00156 g011
Table 1. Elemental composition of the precursor PVDF, non-irradiated and irradiated polyene-polyyne samples.
ElementsPVDF PrecursorPolyene-Polyene-Based MaterialMaterial Irradiated by 3 × 10¹⁷ ion/cm2Material Irradiated by 6 × 10¹⁷ ion/cm2Material Irradiated by 1 × 10¹⁸ ion/cm2
C, at. %48.6 ± 2.767.2 ± 1.062.8 ± 1.464.0 ± 0.659.9 ± 1.9
F, at. %50.8 ± 3.418.8 ± 1.719.77 ± 1.124.8 ± 1.325.1 ± 1.6
O, at. %014.0 ± 0.715.5 ± 0.211.1 ± 0.911.9 ± 0.4
Other, at. %0.6 ± 0.6<0.11.6 ± 0.5~0.12.7 ± 0.1
Table 2. The parameters of the fitting of the irradiated and non-irradiated polyene-polyyne-based materials. Line positions (kmax), half widths at half maximum (HWHM) and relative intensities of the lines (Irel) are presented.
Linekmax, cm−1HWHM, cm−1Irel, % Linekmax, cm−1HWHM, cm−1Irel, %
Non-irradiated polyene-polyyne-based materialν111341813Material irradiated by 3 × 10¹⁷ ion/cm2ν11149297
D-peak/cis-ν1136115031D-peak/cis-ν1132313029
ν215242235ν215413425
G-peak15555820G- peak15568239
Material irradiated by 6 × 10¹⁷ ion/cm2ν11156264Material irradiated by 1 × 10¹⁸ ion/cm2ν11164446
D-peak/cis-ν1138216032D-peak/cis-ν112849114
ν215433014ν215553611
G-peak15596450G-peak154012470
Disclaimer/Publisher’s Note: The statements, opinions and data contained in all publications are solely those of the individual author(s) and contributor(s) and not of MDPI and/or the editor(s). MDPI and/or the editor(s) disclaim responsibility for any injury to people or property resulting from any ideas, methods, instructions or products referred to in the content.

