
Degradation and Breakdown of Polymer/Graphene Composites under Strong Electric Field


Abstract
:1. Introduction
2. Experimental Section
2.1. Polymer Blend Preparation
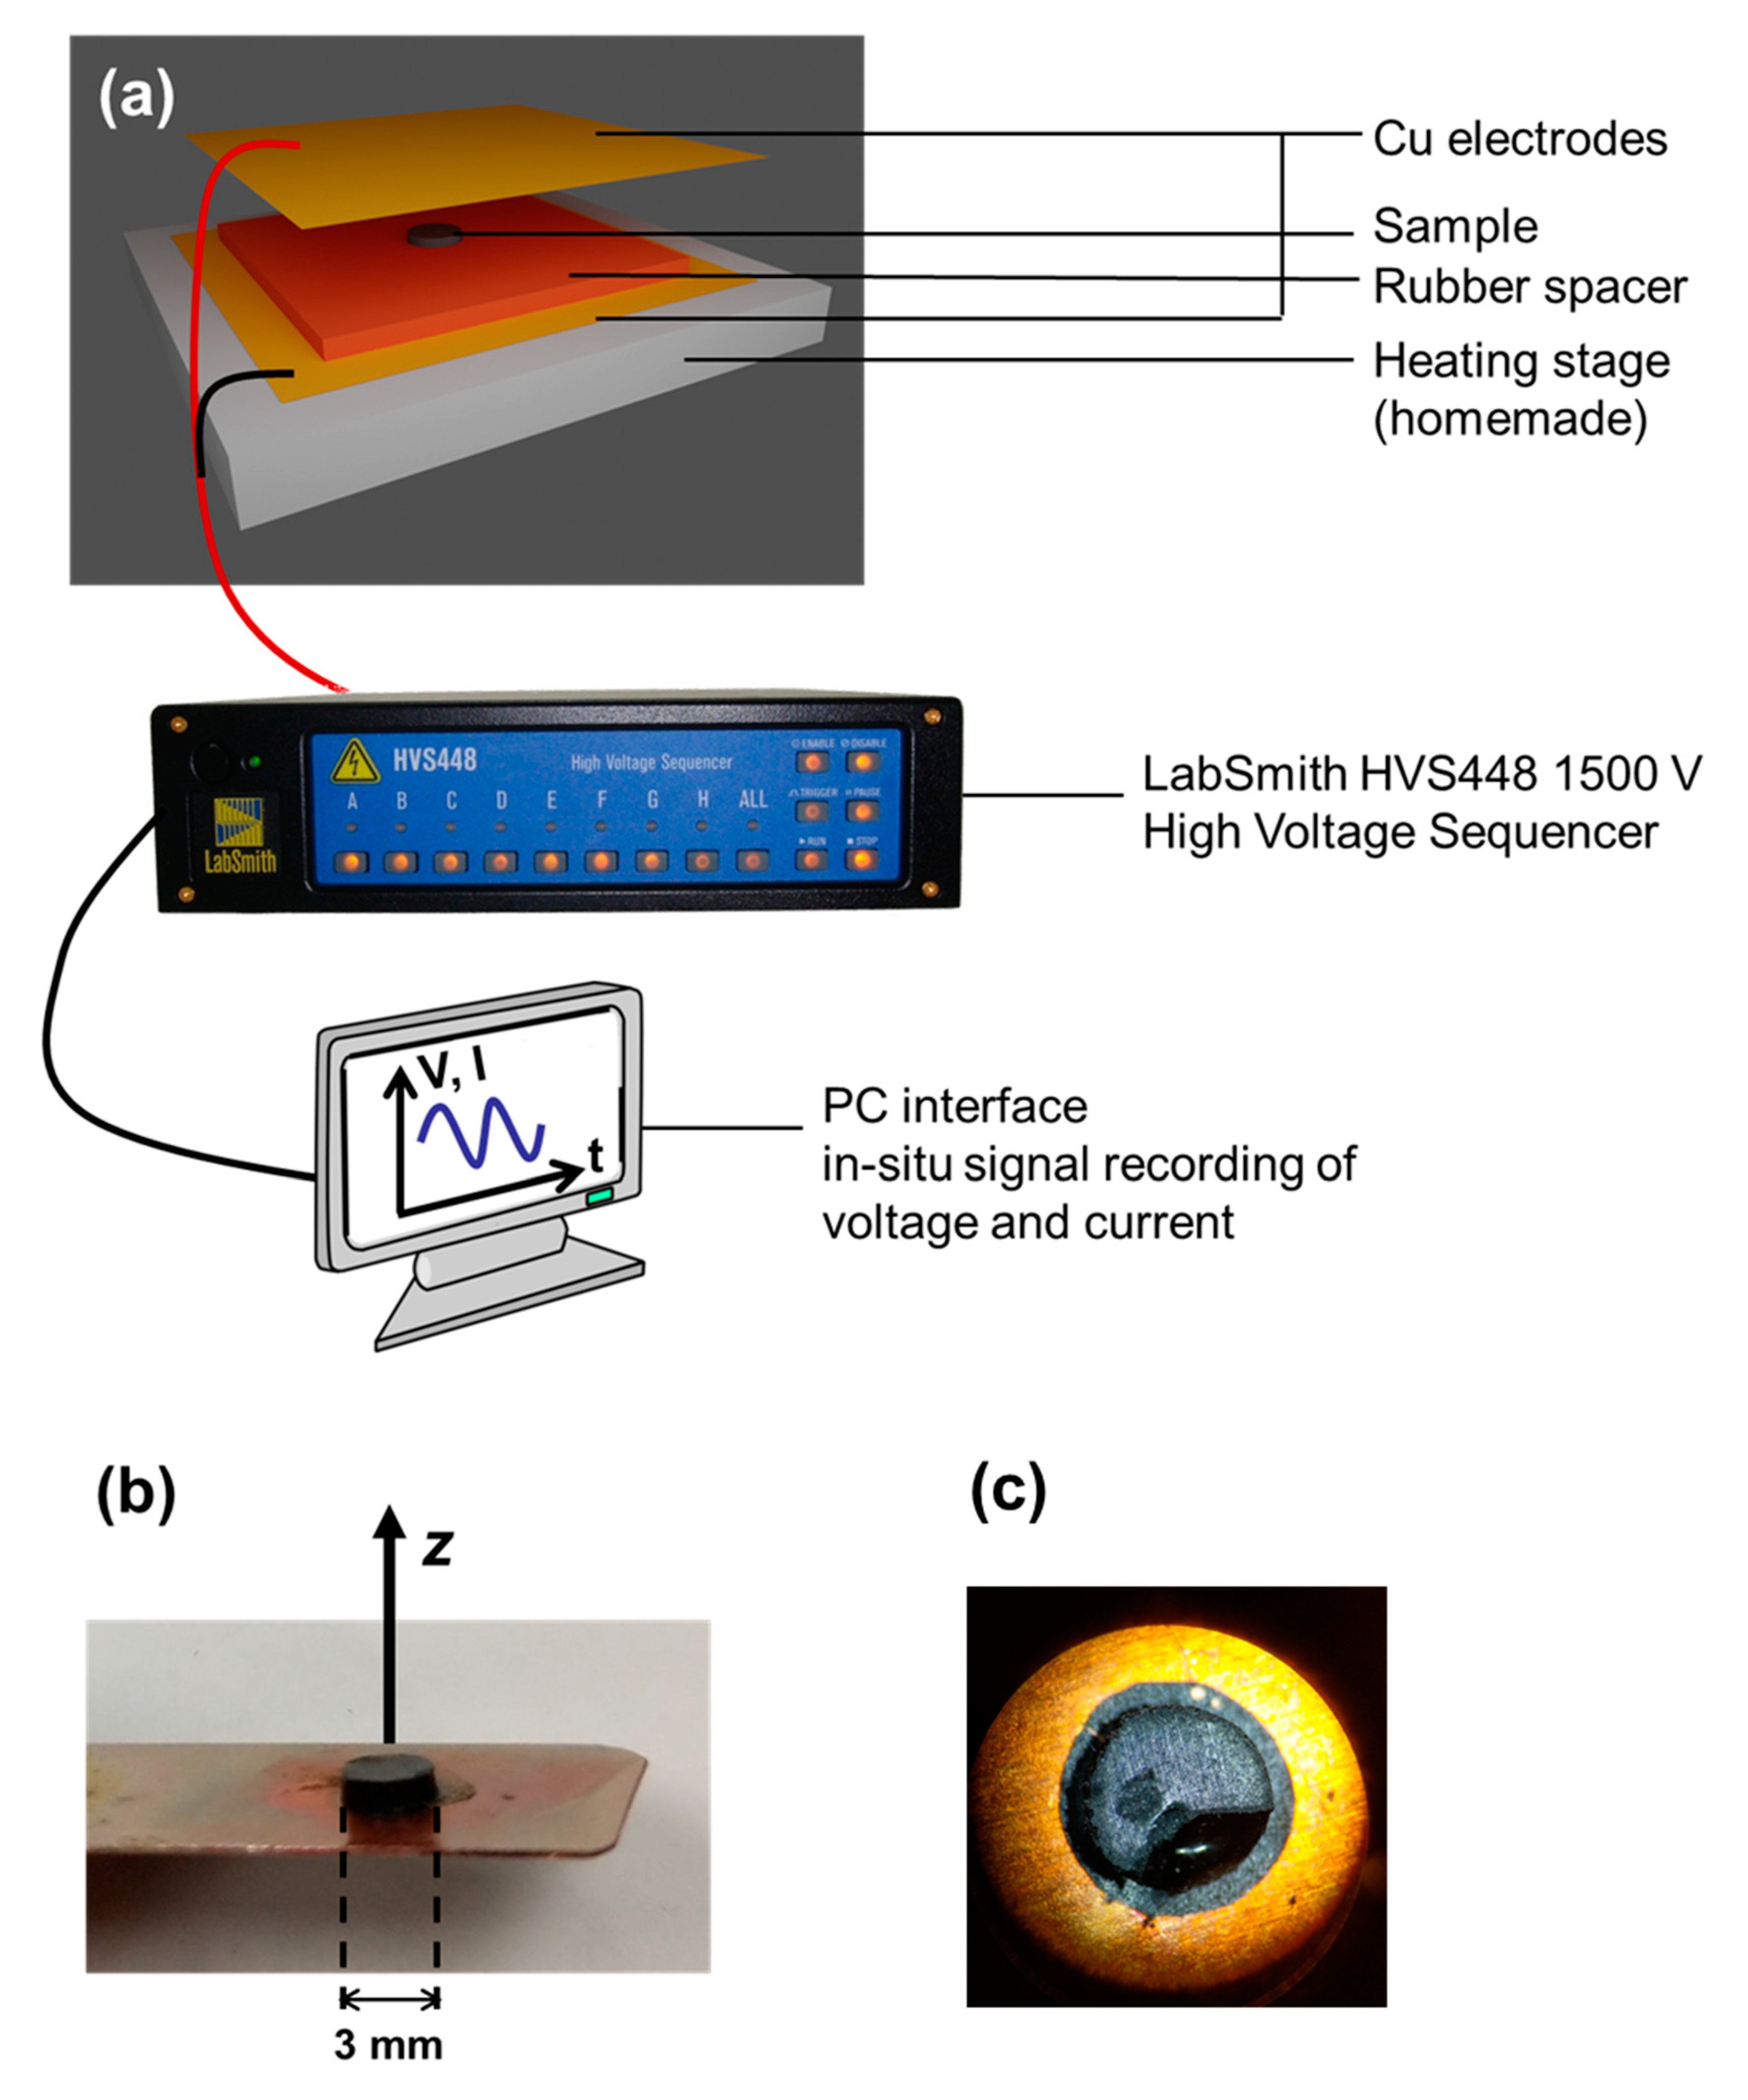
2.2. Electric Field Application with Heating Stage
2.3. Characterization with Transmission Electron Microscopy
3. Results
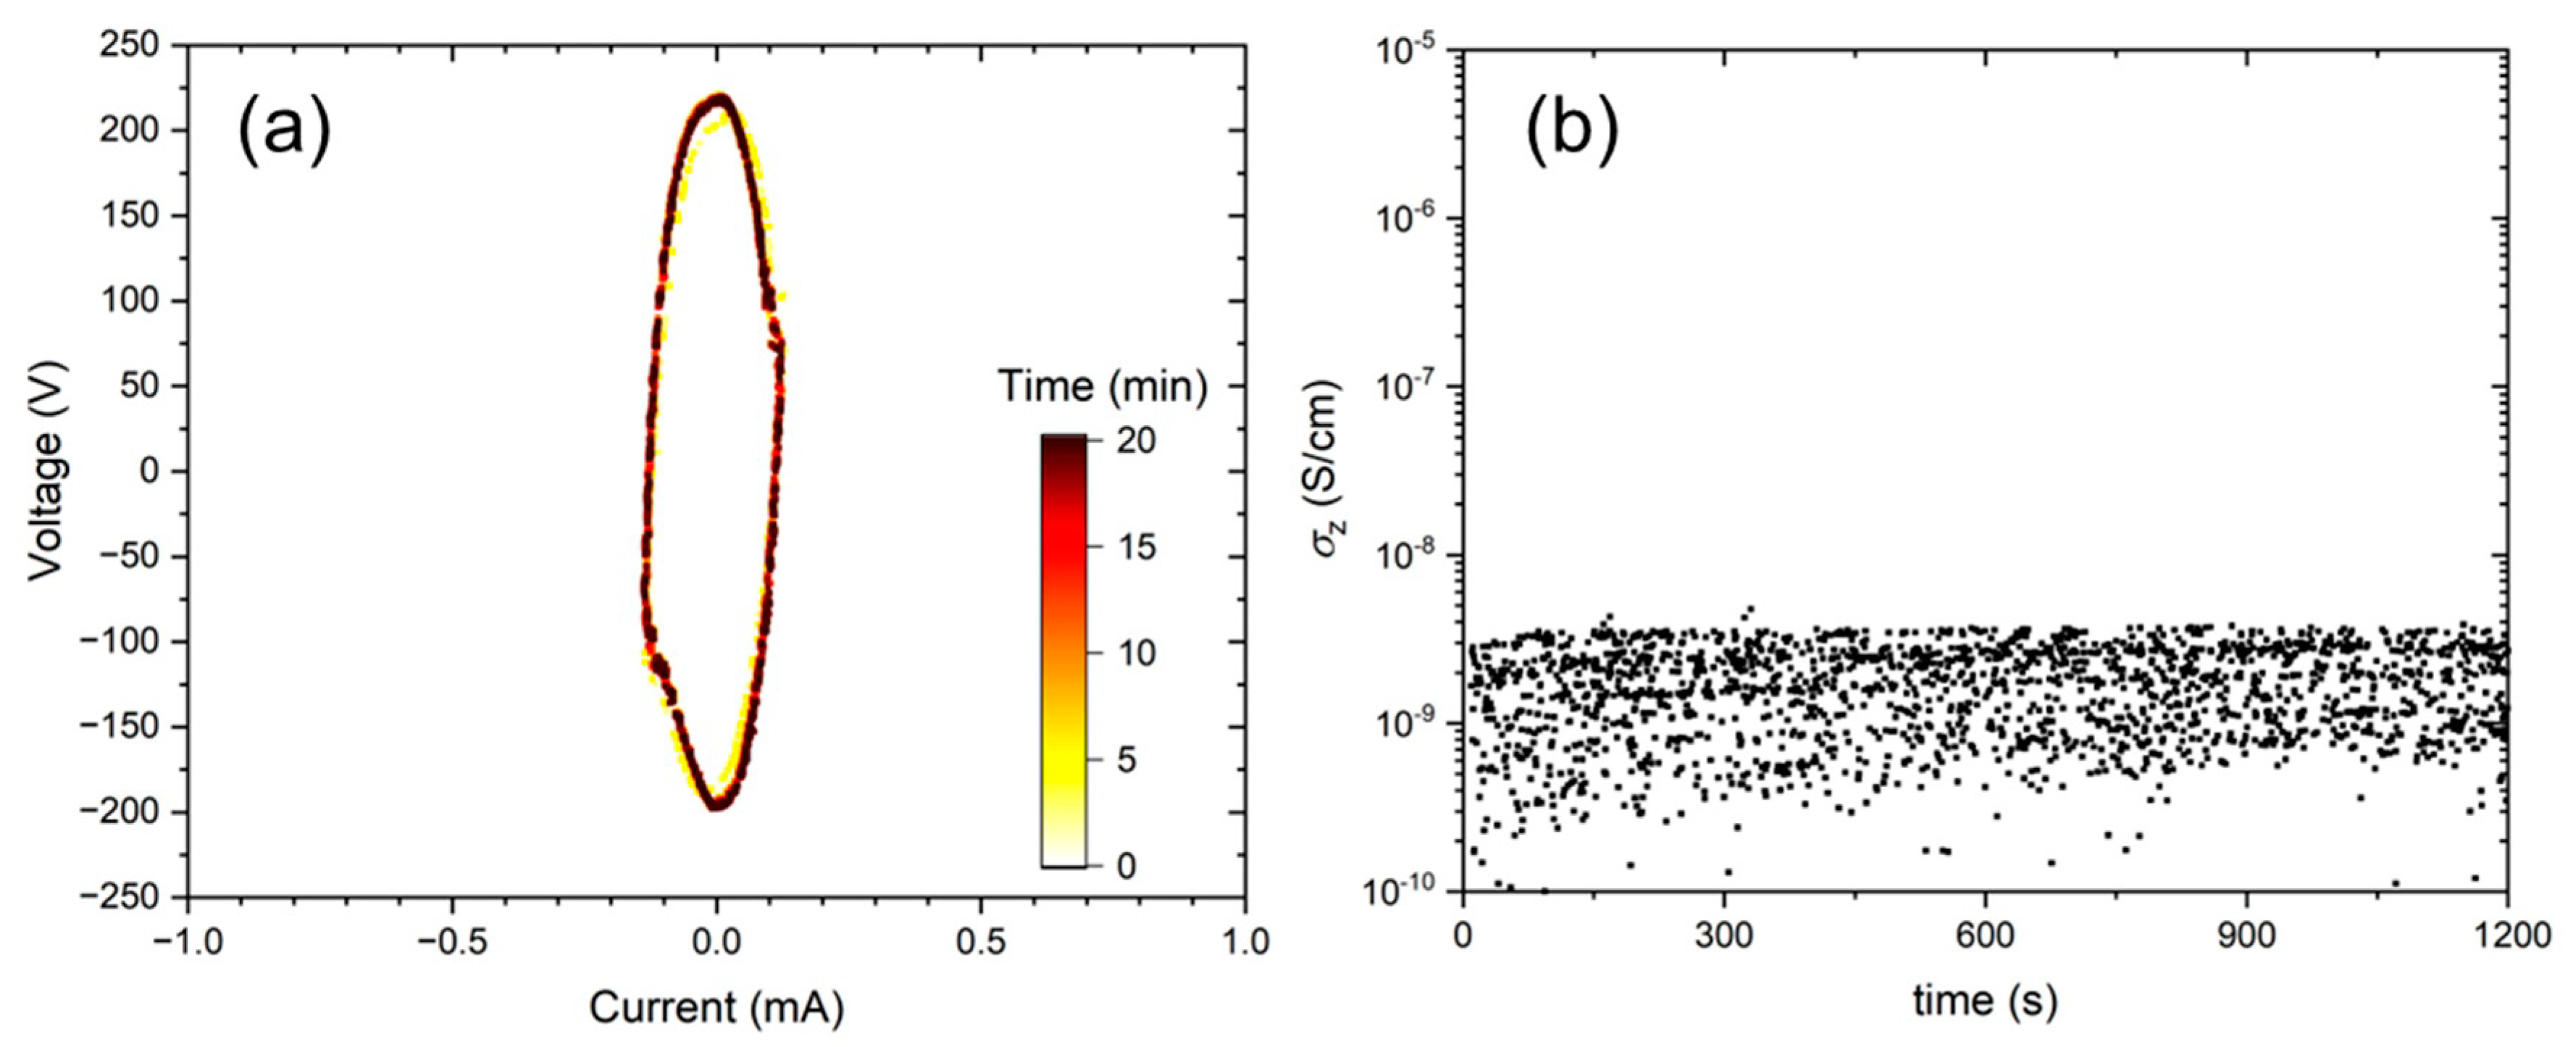
3.1. Direct Electrical Conductivity Measurement during Electric Field Application
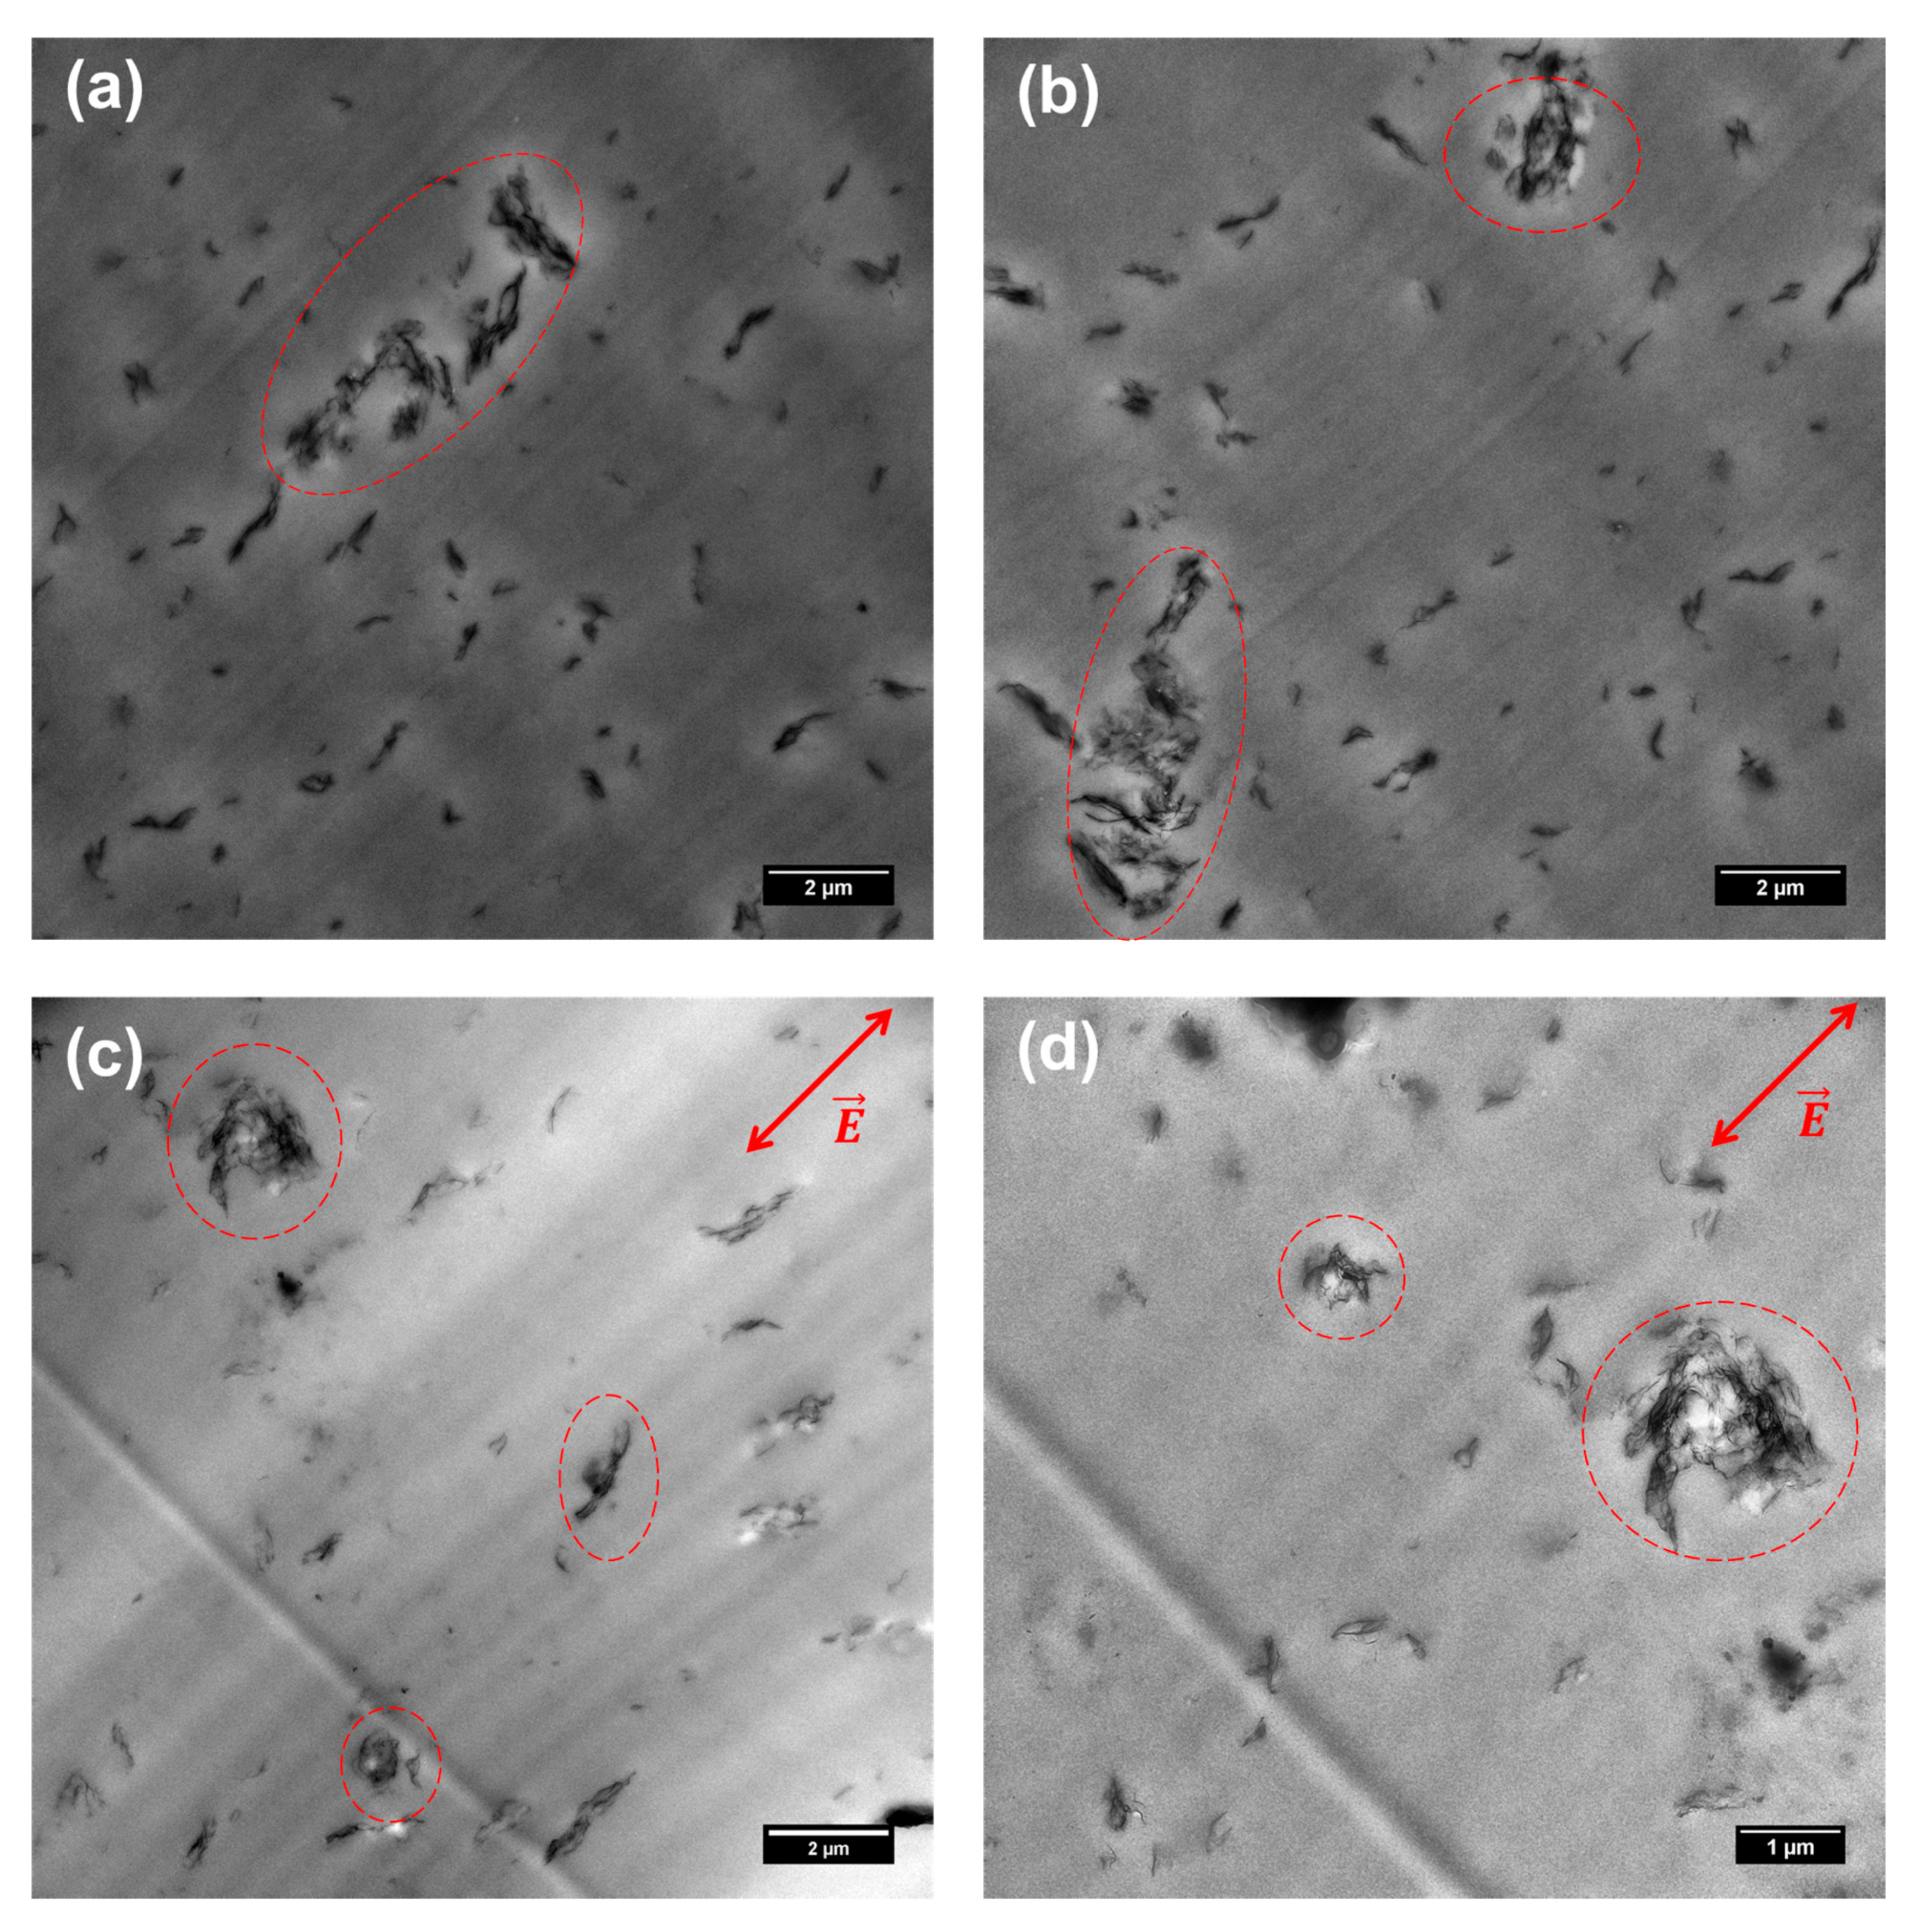
3.2. TEM Imaging of Composites after Electric Field Application
4. Discussion
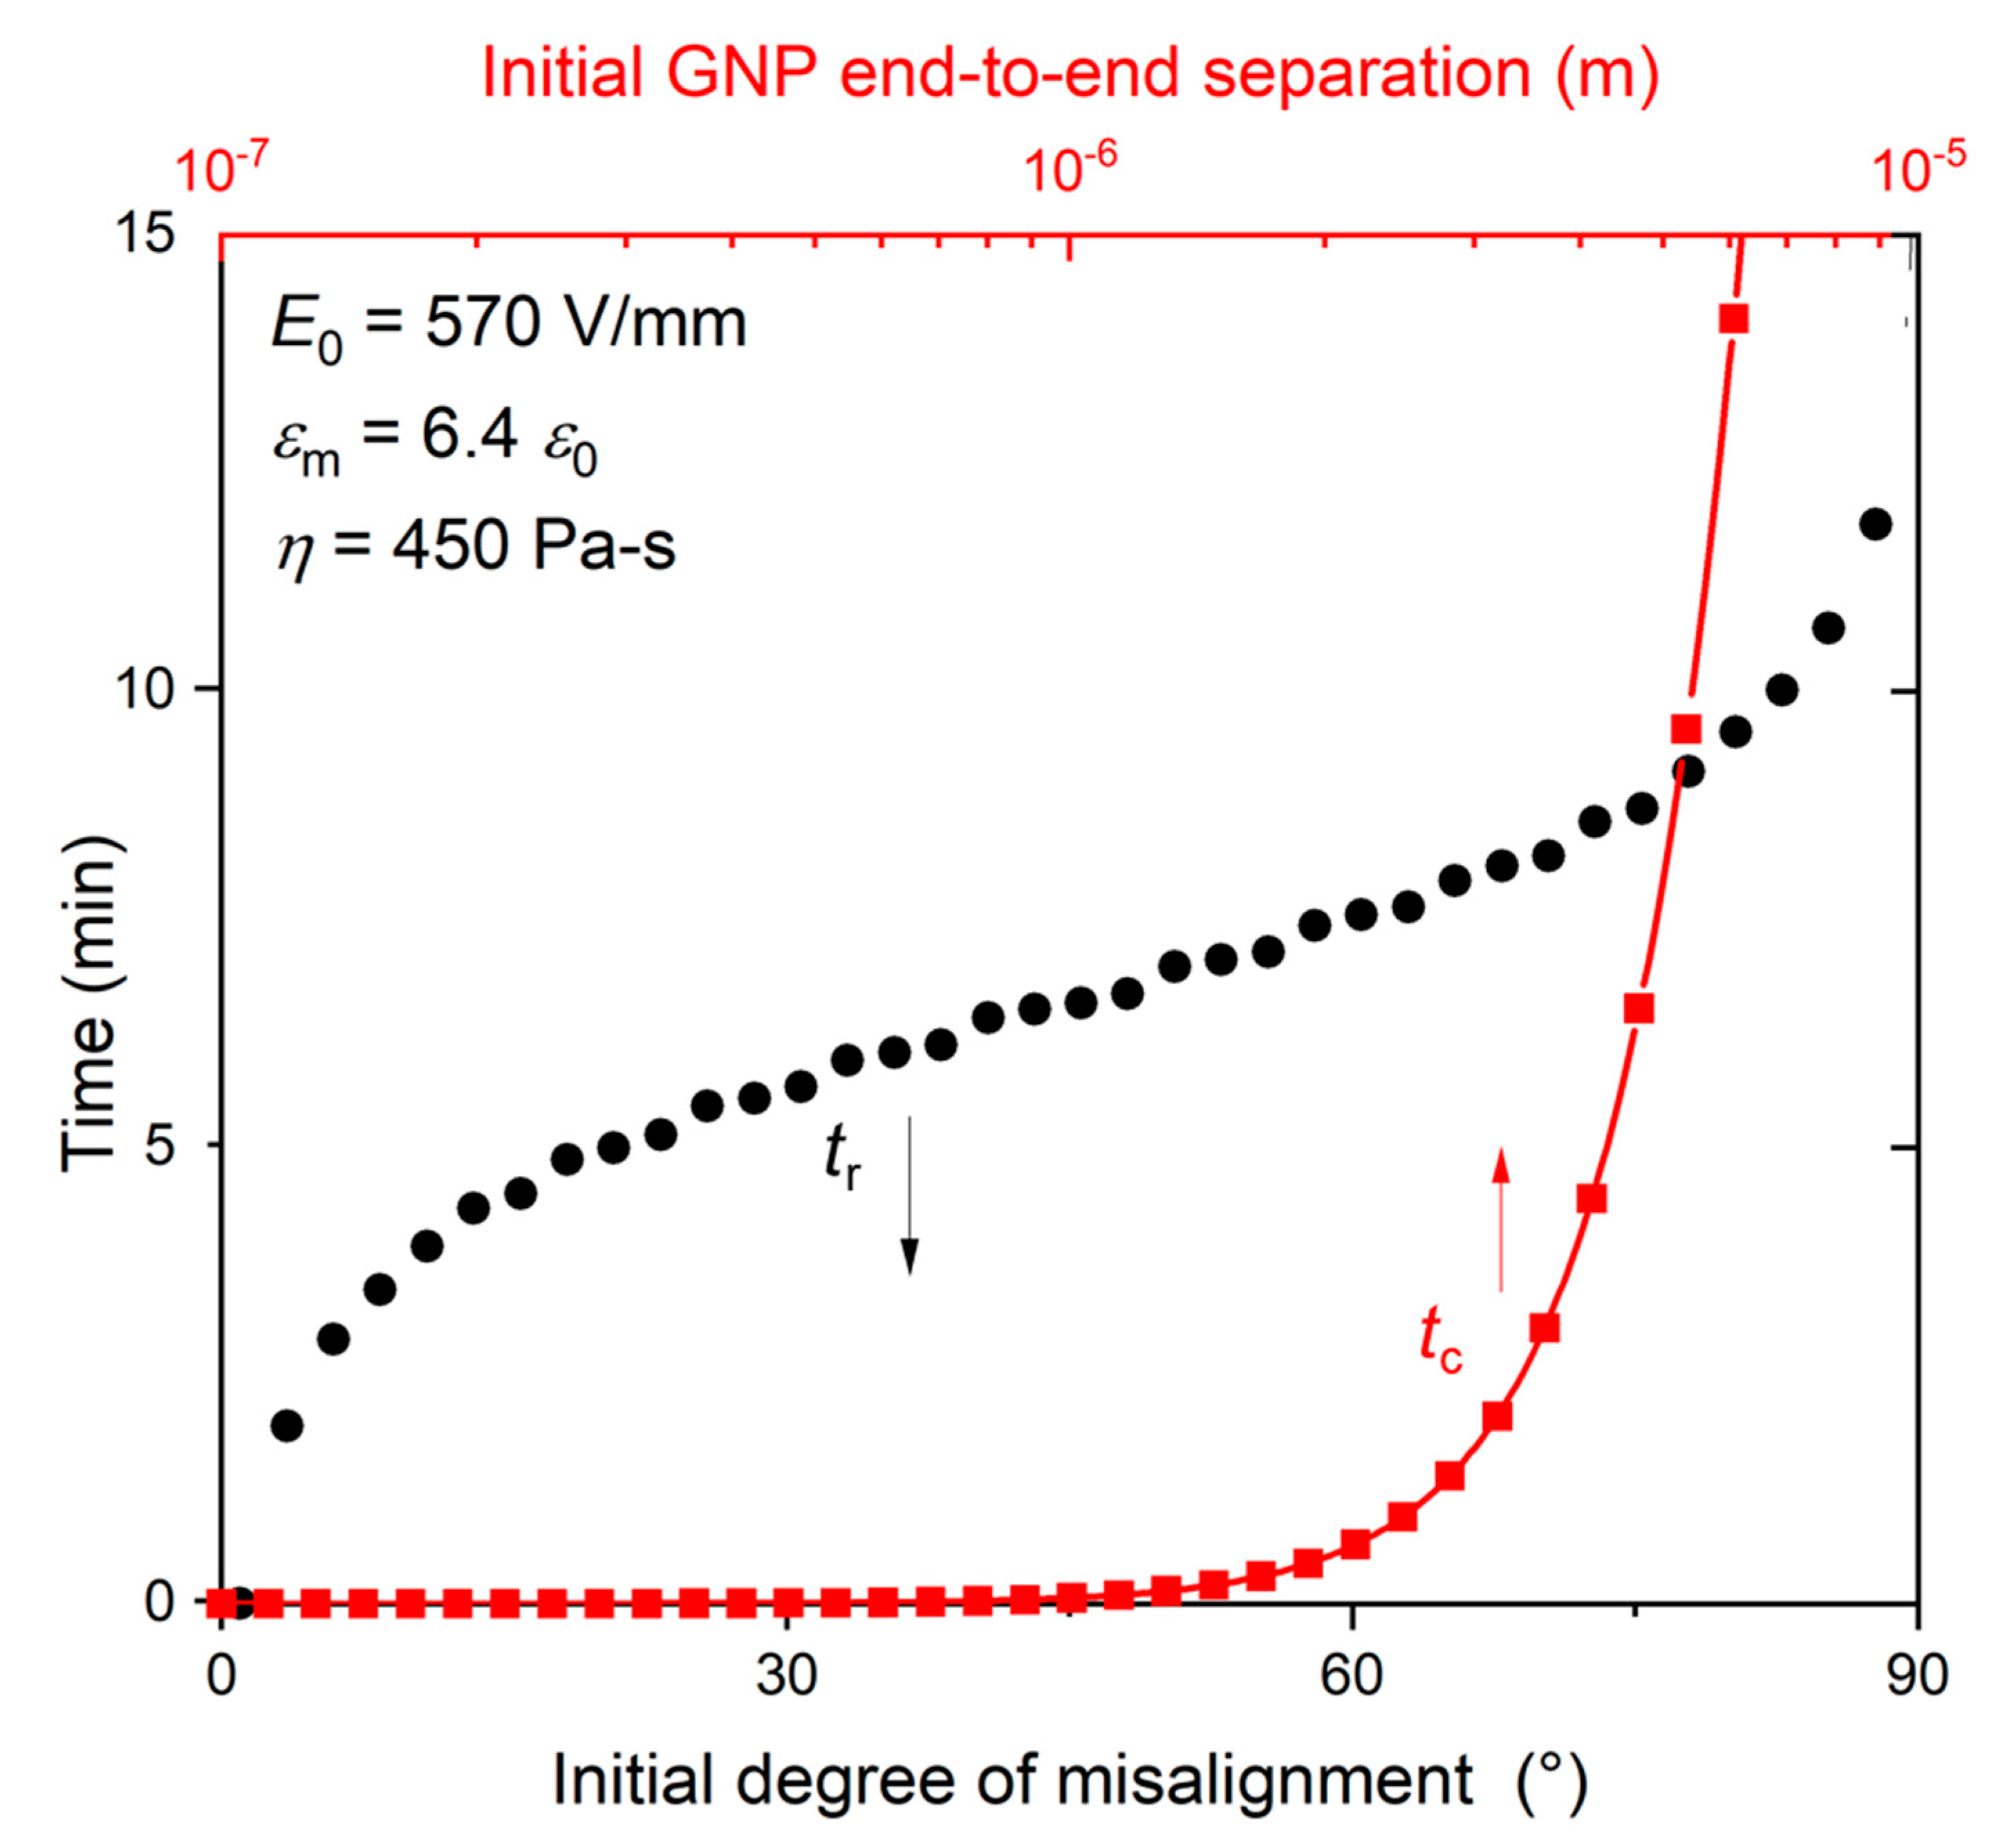
4.1. GNP Alignment-Induced Conductivity Increase
4.2. Dielectric Breakdown Induced Conductivity Increase
4.3. Parameters That Could Influence Dielectric Breakdown under Electric Field
5. Conclusions
Author Contributions
Funding
Institutional Review Board Statement
Informed Consent Statement
Data Availability Statement
Acknowledgments
Conflicts of Interest
Appendix A


References
- Ding, S.; Yu, S.; Zhu, X.; Xie, S.; Sun, R.; Liao, W.-H.; Wong, C.-P. Enhanced Breakdown Strength of Polymer Composites by Low Filler Loading and Its Mechanisms. Appl. Phys. Lett. 2017, 111, 153902. [Google Scholar] [CrossRef]
- Song, Y.; Shen, Y.; Liu, H.; Lin, Y.; Li, M.; Nan, C.-W. Improving the Dielectric Constants and Breakdown Strength of Polymer Composites: Effects of the Shape of the BaTiO3 Nanoinclusions, Surface Modification and Polymer Matrix. J. Mater. Chem. 2012, 22, 16491. [Google Scholar] [CrossRef]
- Danikas, M.G.; Tanaka, T. Nanocomposites-a Review of Electrical Treeing and Breakdown. IEEE Electr. Insul. Mag. 2009, 25, 19–25. [Google Scholar] [CrossRef]
- Tanaka, T.; Iizuka, T. Generic PD Resistance Characteristics of Polymer Nanocomposites. In Proceedings of the 2010 Annual Report Conference on Electrical Insulation and Dielectic Phenomena, West Lafayette, IN, USA, 17–20 October 2010; pp. 1–4. [Google Scholar] [CrossRef]
- Nurmi, S.; Hammi, T.; Demoulin, B. Protection Against Electrostatic and Electromagnetic Phenomena. In Multifunctional Barriers for Flexible Structure; Springer: Berlin/Heidelberg, Germany, 2007; pp. 63–83. [Google Scholar] [CrossRef]
- Schwarz, M.K.; Bauhofer, W.; Schulte, K. Alternating Electric Field Induced Agglomeration of Carbon Black Filled Resins. Polymer 2002, 43, 3079–3082. [Google Scholar] [CrossRef]
- Wang, H.; Zhang, H.; Chen, G. Preparation of Unsaturated Polyester/Graphite Nanosheet Conducting Composite under Electric Field. Compos. Part A Appl. Sci. Manuf. 2007, 38, 2116–2120. [Google Scholar] [CrossRef]
- Wang, H.; Zhang, H.; Zhao, W.; Zhang, W.; Chen, G. Preparation of Polymer/Oriented Graphite Nanosheet Composite by Electric Field-Inducement. Compos. Sci. Technol. 2008, 68, 238–243. [Google Scholar] [CrossRef]
- Chen, G.; Wang, H.; Zhao, W. Fabrication of Highly Ordered Polymer/Graphite Flake Composite with Eminent Anisotropic Electrical Property. Polym. Adv. Technol. 2008, 19, 1113–1117. [Google Scholar] [CrossRef]
- Ma, C.; Zhang, W.; Zhu, Y.; Ji, L.; Zhang, R.; Koratkar, N.; Liang, J. Alignment and Dispersion of Functionalized Carbon Nanotubes in Polymer Composites Induced by an Electric Field. Carbon 2008, 46, 706–710. [Google Scholar] [CrossRef]
- Wu, S.; Ladani, R.B.; Zhang, J.; Bafekrpour, E.; Ghorbani, K.; Mouritz, A.P.; Kinloch, A.J.; Wang, C.H. Aligning Multilayer Graphene Flakes with an External Electric Field to Improve Multifunctional Properties of Epoxy Nanocomposites. Carbon 2015, 94, 607–618. [Google Scholar] [CrossRef] [Green Version]
- Monti, M.; Natali, M.; Torre, L.; Kenny, J.M. The Alignment of Single Walled Carbon Nanotubes in an Epoxy Resin by Applying a DC Electric Field. Carbon 2012, 50, 2453–2464. [Google Scholar] [CrossRef]
- Lim, C.-S.; Rodriguez, A.J.; Guzman, M.E.; Schaefer, J.D.; Minaie, B. Processing and Properties of Polymer Composites Containing Aligned Functionalized Carbon Nanofibers. Carbon 2011, 49, 1873–1883. [Google Scholar] [CrossRef]
- Bai, L.; Sharma, R.; Cheng, X.; Macosko, C.W. Kinetic Control of Graphene Localization in Co-Continuous Polymer Blends via Melt Compounding. Langmuir 2018, 34, 1073–1083. [Google Scholar] [CrossRef] [PubMed]
- Mun, S.C.; Kim, M.J.; Cobos, M.; Gu, L.; Macosko, C.W. Strategies for Interfacial Localization of Graphene/Polyethylene-Based Cocontinuous Blends for Electrical Percolation. AIChE J. 2019, 65, e16579. [Google Scholar] [CrossRef]
- Kou, Y.; Cheng, X.; Macosko, C.W. Polymer/Graphene Composites via Spinodal Decomposition of Miscible Polymer Blends. Macromolecules 2019, 52, 7625–7637. [Google Scholar] [CrossRef]
- Kou, Y.; Cote, A.T.; Liu, J.; Cheng, X.; Macosko, C.W. Robust Networks of Interfacial Localized Graphene in Cocontinuous Polymer Blends. J. Rheol. 2021, 65, 1139–1153. [Google Scholar] [CrossRef]
- Perrin, F. Mouvement Brownien d’un Ellipsoide (II). Rotation Libre et Dépolarisation Des Fluorescences. Translation et Diffusion de Molécules Ellipsoidales. J. Phys. Radium 1936, 7, 1–11. [Google Scholar] [CrossRef]
- Yasin, S.; Hussain, M.; Zheng, Q.; Song, Y. Large amplitude oscillatory rheology of silica and cellulose nanocrystals filled natural rubber compounds. J. Colloid Interface Sci. 2021, 588, 602–610. [Google Scholar] [CrossRef]
- Hussain, M.; Yasin, S.; Akram, M.A.; Xu, H.; Song, Y.; Zheng, Q. Influence of Ionic Liquids on Structure and Rheological Behaviors of Silica-Filled Butadiene Rubber. Ind. Eng. Chem. Res. 2019, 58, 18205–18212. [Google Scholar] [CrossRef]
- Hussain, M.; Yasin, S.; Memon, H.; Li, Z.; Fan, X.; Akram, M.A.; Wang, W.; Song, Y.; Zheng, Q. Rheological and Mechanical Properties of Silica/Nitrile Butadiene Rubber Vulcanizates with Eco-Friendly Ionic Liquid. Polymers 2020, 12, 2763. [Google Scholar] [CrossRef]
- Siddabattuni, S.; Schuman, T.P.; Dogan, F. Dielectric Properties of Polymer−Particle Nanocomposites Influenced by Electronic Nature of Filler Surfaces. ACS Appl. Mater. Interfaces 2013, 5, 1917–1927. [Google Scholar] [CrossRef]
- Prado, G.; Jagoda, J.; Lahaye, J. Smoke Formation by Combustion of Polymeric Materials. Fire Saf. J. 1978, 1, 229–235. [Google Scholar] [CrossRef]
- Vogelsang, R.; Farr, T.; Frohlich, K. The Effect of Barriers on Electrical Tree Propagation in Composite Insulation Materials. IEEE Trans. Dielectr. Electr. Insul. 2006, 13, 373–382. [Google Scholar] [CrossRef]
- Dissado, L.A.; Fothergill, J.C. Electrical Degradation and Breakdown in Polymers; The Institution of Engineering and Technology (IET): Stevenage, UK, 1992. [Google Scholar] [CrossRef] [Green Version]
- Niemeyer, L.; Pietronero, L.; Wiesmann, H.J. Fractal Dimension of Dielectric Breakdown. Phys. Rev. Lett. 1984, 52, 1033–1036. [Google Scholar] [CrossRef]
- Han, T.; Du, B.; Su, J.; Gao, Y.; Xing, Y.; Fang, S.; Li, C.; Lei, Z. Inhibition Effect of Graphene Nanoplatelets on Electrical Degradation in Silicone Rubber. Polymers 2019, 11, 968. [Google Scholar] [CrossRef] [Green Version]
- Miranda, E.; Bandiera, L.; Cester, A.; Paccagnella, A. Logistic Modeling of Progressive Breakdown in Ultrathin Gate Oxides. In Proceedings of the Electrical Performance of Electrical Packaging (IEEE Cat. No. 03TH8710), Estoril, Portugal, 16–18 September 2003; pp. 83–86. [Google Scholar] [CrossRef]


(wt %) | (Vrms/mm) | Number of Samples | (S/cm) | (S/cm) | (s) |
|---|---|---|---|---|---|
| 0.25 | 400 | 3 | 1.7(0.4) × 10−6 | 11.7(2.3) | 48.1(12.7) |
| 0.25 | 250 | 2 | 1.1(0.3) × 10−5 | 31.5(0.4) | 136(24.6) |
| 0.10 | 400 | 5 | 9.2(5.6) × 10−6 | 149(100) | 640(107) |
| 0.05 | 400 | 1 | 2.0 × 10⁻⁷ | 1230 | 6870 |
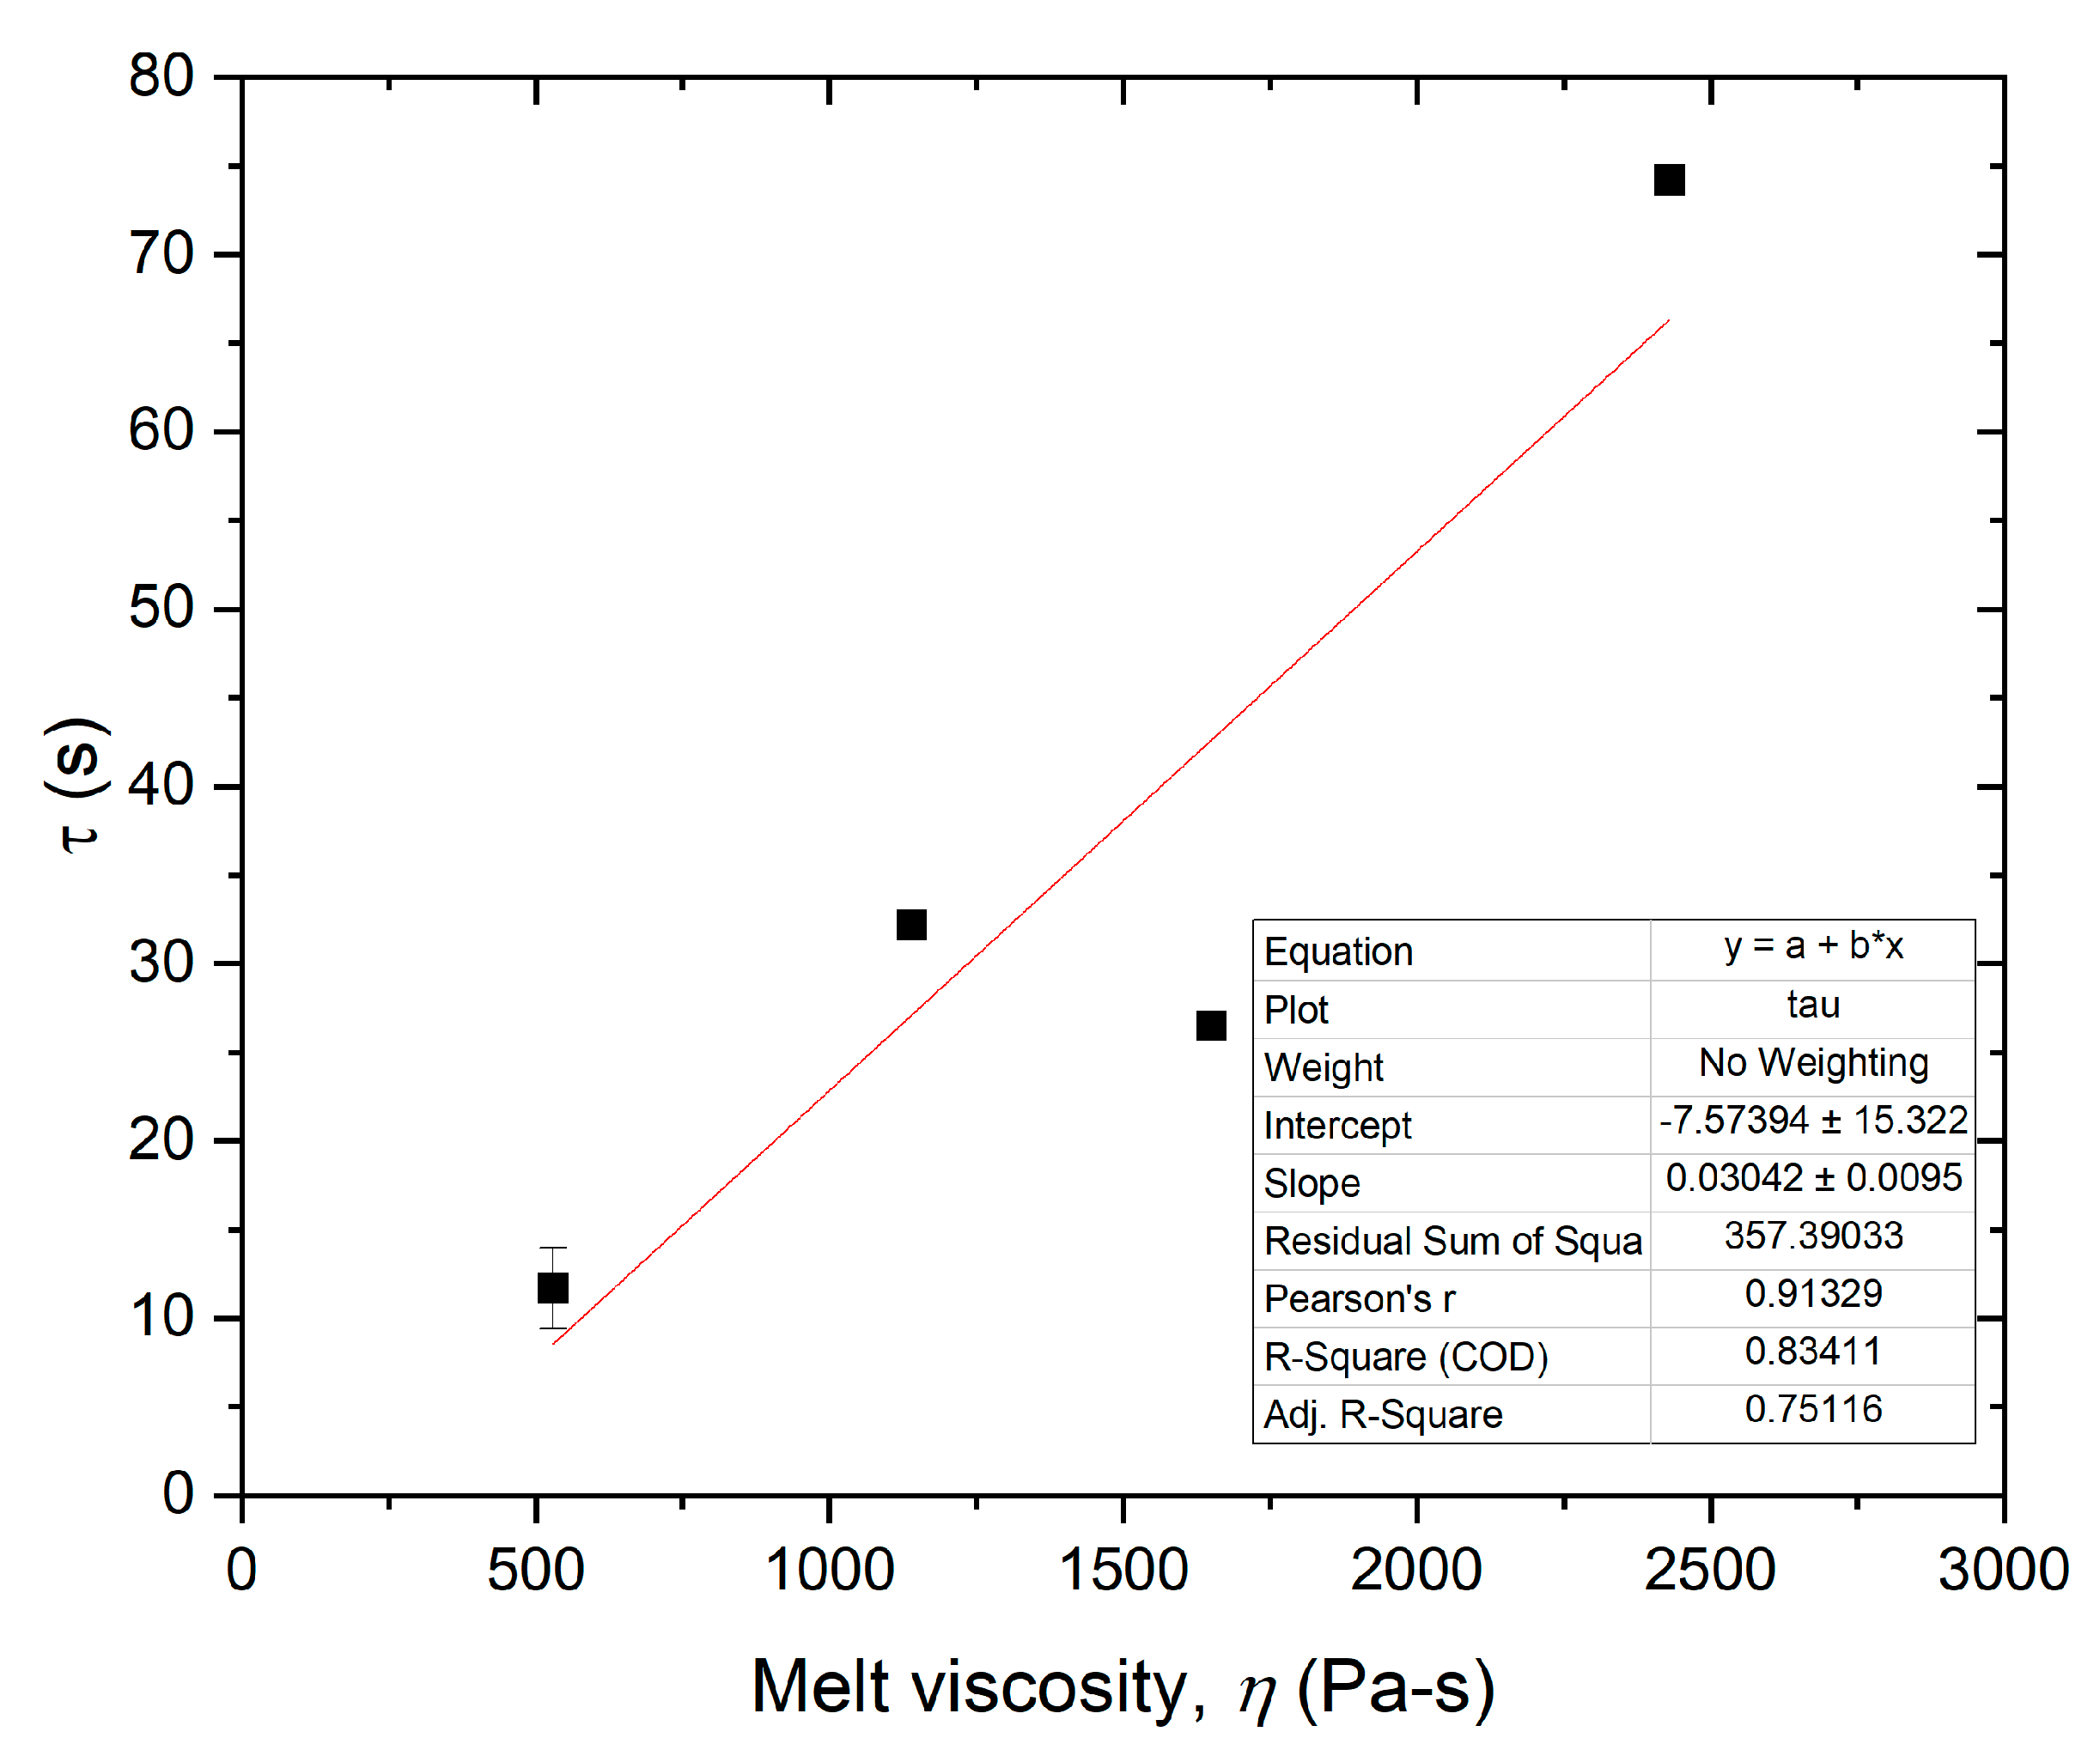
(wt %) | (°C) | (Pa·s) | (>S/cm) | (s) | (s) |
|---|---|---|---|---|---|
| 0.25 | 160 | 530 | 1.7(0.4) × 10−6 | 11.7(2.3) | 48.1(12.7) |
| 0.25 | 140 | 1140 | 8.6 × 10⁻⁶ | 30.7 | 910 |
| 0.25 | 130 | 1650 | 9.7 × 10⁻⁶ | 26.6 | 1060 |
| 0.25 | 120 | 2430 | 7.0 × 10⁻⁶ | 74.2 | 1290 |
Publisher’s Note: MDPI stays neutral with regard to jurisdictional claims in published maps and institutional affiliations. |
© 2022 by the authors. Licensee MDPI, Basel, Switzerland. This article is an open access article distributed under the terms and conditions of the Creative Commons Attribution (CC BY) license (https://creativecommons.org/licenses/by/4.0/).
Share and Cite
Kou, Y.; Cheng, X.; Macosko, C.W. Degradation and Breakdown of Polymer/Graphene Composites under Strong Electric Field. J. Compos. Sci. 2022, 6, 139. https://doi.org/10.3390/jcs6050139
Kou Y, Cheng X, Macosko CW. Degradation and Breakdown of Polymer/Graphene Composites under Strong Electric Field. Journal of Composites Science. 2022; 6(5):139. https://doi.org/10.3390/jcs6050139
Chicago/Turabian StyleKou, Yangming, Xiang Cheng, and Christopher W. Macosko. 2022. "Degradation and Breakdown of Polymer/Graphene Composites under Strong Electric Field" Journal of Composites Science 6, no. 5: 139. https://doi.org/10.3390/jcs6050139
APA StyleKou, Y., Cheng, X., & Macosko, C. W. (2022). Degradation and Breakdown of Polymer/Graphene Composites under Strong Electric Field. Journal of Composites Science, 6(5), 139. https://doi.org/10.3390/jcs6050139