Abstract
Perovskite oxides have been used as sensors, actuators, transducers, for sound generation and detection, and also in optical instruments and microscopes. Perovskite halides are currently considered as optoelectronic devices such as solar cells, photodetectors, and radiation detection, but there are major issues with stability, interfacial recombination, and electron/hole mobility. The following work looks into the fabrication of non-toxic ZnO-based lead-free alternatives to perovskite oxides for use as secondary sensors or electron transport layers along with perovskite halides for application in stacked biomedical wearable devices. Three-phase, lead-free, Zinc Oxide-Graphene-Epoxy electroactive nanocomposite thin films were fabricated. The volume fraction of the Graphene phase was held constant at 10%, while the volume fraction of the ZnO phase was varied from 10–70%. The dielectric constant, capacitance, impedance, resistance, and conductance of the samples were measured using an impedance analyzer, and the results were compared as a function of volume fraction of ZnO to understand the electron transport performance of these thin films. The impedance and dielectric spectra of the nanocomposites were recorded over a frequency range of 20 Hz to 10 MHz. The microstructural properties and cross-section of the thin films were analyzed using a Scanning Electron Microscope. The high sensitivity and electron transport properties of the composite could be potentially utilized in biomedical devices at low- and high-frequency ranges.
1. Introduction
Perovskite materials have been researched over the years in applications of photovoltaics (PV), light-emitting diodes (LEDs), X-ray detectors, memory devices, etc. Initially, perovskite materials denoted metal oxides with perovskite structures. In general, the perovskite structure (Figure 1) has the chemical formula of ABX3, in which X is the anion occupying the face-centered positions, A and B are cation occupying the corner positions, and body-centered position respectively [1,2]. Some of the examples of such perovskite oxides are PbTiO3, BaTiO3, and SrTiO3 [3,4]. Perovskite oxides are used in dielectric, piezoelectric, ferroelectric applications such as sensors, transducers, and actuators, but when it comes to PV applications, they are not suitable as they do not have good semiconducting properties [5].
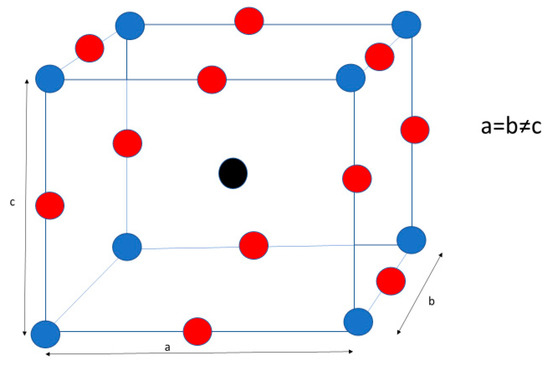
Figure 1.
Tetragonal phase of a perovskite structure.
In contrast to perovskite oxides, a certain class of perovskite halides exhibit good semiconducting properties that can be utilized for PV applications. Perovskite halides have the same chemical formula as perovskite oxides (ABX3), but the difference is that perovskite halides have halide anions instead of oxide anions. Although perovskites exhibit good properties in applications for sensors and electron/hole transport layers, they have stability issues that are related to both intrinsic (structural) and extrinsic (environmental stresses) parameters. Another drawback of the perovskite materials which is a growing concern is the toxicity of lead in lead-based perovskites. Lead-based materials are leaders in solar cell performance among all perovskite materials [6]. Because lead can cause serious health damage, it is considered to be one of the ten most toxic materials for the human body [7]. Thus, the toxicity of lead prevents researchers to further utilize this material in such applications and driving research towards finding lead-free perovskites or other such alternatives.
Several different composites have been studied by researchers to be utilized as biomedical sensors. For example; Takei et al. developed Germanium/Silicon-based nanowire circuit artificial skin. Polyimide was used as the substrate layer while pressure-sensitive rubber was used as the sensing layer. The sensor showed good potential at low voltage operation in addition to high stability [8,9,10]. In another study, Abiri et al. demonstrated the use of silicon nanowire-based biosensors in detecting cancer cells in the lungs due to its good electric signal transduction ability. The change in impedance in these biosensors helped to detect the cancer cells. The electrical impedance for the Silicon nanowire biosensors was ~0–20 kΩ at 100 kHz [11].
Various carbon-based biosensors have also been developed and tested over the last decade. A certain carbon-based biosensor was developed by Yamada et al. It was fabricated using the alignment process of single-walled carbon nanotubes (SWCNTs) on Polydimethylsiloxane (PDMS) substrate. The sensor helped in detecting various motions in knee joints and reported high durability, fast response, and low creep [9,12]. In another project, Wang and coworkers developed a nanocomposite biosensor by grafting an aptamer on graphene, which could be used in thrombin sensing. This sensor provided good sensitivity and selectivity in detecting thrombin because of the graphene speeding the charge transfer [13]. Kurkina et al. developed an impedance biosensor based on carbon nanotube for the detection of DNA. The sensor helped in detecting low quantities of DNA due to its ultra-sensitivity. The sensor measurements were taken in a frequency range of 20 Hz–2 MHz [14]. Additionally, an epoxy–graphite electrode-based impedimetric aptasensor was developed by Ocaña and coworkers in the detection of protein cytochrome c. The sensor showed a good detection range, high sensitivity, and low detection limit for the cytochrome c [15].
In addition, different metal oxide-based biosensors have also been studied by researchers. Ahmad et al. demonstrated the use of ZnO nanofiber amperometric biosensors for the use of glucose detection. The biosensor utilizes a gold electrode which is functionalized by glucose oxidase through physical adsorption. The results showed that the biosensor had high sensitivity, a good response time, and a low detection limit [16]. In another study, SoYoon et al. developed a CuO nanoleaf-ZnO nanorods glucose sensor using a copper substrate. The sensor showed good electrocatalytic activity during glucose oxidation, low working potential, and low detection limit [17]. Wu et al. and coworkers demonstrated the use of ZnO-graphene electrode in glucose sensing. The ZnO-graphene particles were deposited on nickel foam followed by electrodeposition of palladium nanoparticles. The electrode showed good catalytic activity, high sensitivity towards glucose detection, and stability [18]. Selvarajan et al. also developed a ZnO-manganese hexacyanoferrate (MnHCNF) nanocomposite on a glassy carbon electrode using the co-electrodeposition method for sensing of riboflavin (which helps to convert carbohydrates, protein, and fat into energy). The composite showed good electrocatalytic activity, sensitivity, stability when the sensor was used to detect riboflavin [19]. Felix et al. fabricated Ag-CuO nanocomposite towards glucose sensing. The fabricated sensor showed a fast response time, fast electron transfer, good selectivity, and sensitivity, towards glucose oxidation [20]. Another sensor that was developed for glucose monitoring using a nanofiber CuO-ZnO composite was fabricated using electrospinning and thermal treatment. The sensor showed good electrocatalytic activity and fast sensing toward glucose oxidation [21]. Table 1 shows a summary of various materials used/studied for biosensor applications along with the application, and the property that makes it suitable for that application.

Table 1.
Summary of different materials and composites used for biosensor applications.
A nontoxic ZnO-Graphene-Epoxy nanocomposite is discussed in this work as an alternative to the perovskite oxides for use as sensors and electron transport layers in stacked devices. ZnO is a metal oxide which has a wurtzite structure (Figure 2) [22]. Due to its versatile properties, such as chemical stability, good temperature resistance, and low activation energy, and environmentally friendliness, it shows good potential in optoelectronic, biosensing, and antibacterial applications [23,24,25,26,27,28,29]. ZnO nanoparticles can also increase quantum efficiency and decrease the short circuit current of thin-film solar cells [26].
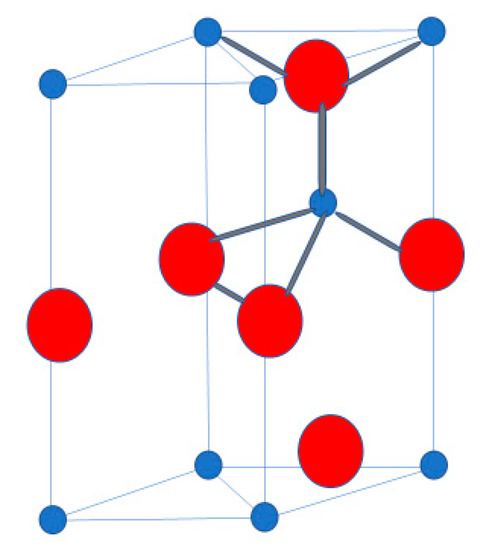
Figure 2.
Wurtzite Structure of Zinc oxide.
The flexibility of the ZnO nanocomposite is added through the epoxy matrix phase [30,31,32]. As a result of incorporating the epoxy phase in the ZnO phase, the electric and dielectric properties of the nanocomposite are negatively affected by the insulative matrix material [33]. The integration of graphene and other carbon-based nanomaterials can enhance the electrical properties [34,35], thermal properties [36], and also add flexibility and strength to the composite [37]. Furthermore, these properties can be tailored for application in biomedical wearable devices based on the composite bulk and microstructural properties and the working frequency ranges [38]. Thus, graphene nanoplatelets are incorporated as the third phase in the composite to enhance the electrical and mechanical properties [39,40,41,42]. Due to its high conductivity, the electron transport properties or the sensing properties of the composite can be enhanced [34,35,36].
The use of zinc oxide-graphene composites in medical applications such as biosensors has not been examined a lot by researchers [43,44]. The possibility of integration of such shape-controlled zinc oxide and graphene composites within an epoxy matrix is a proof-of-concept in obtaining a new generation of flexible thin-film devices towards application as biomedical sensors with tunable electrical properties. These biomedical sensors can either be incorporated in low-frequency devices such as the glucose monitoring devices, or high-frequency devices such as ultrasound imaging and magnetic resonance imaging (MRI) [45,46,47,48]. The frequency for ultrasound imaging for thyroid and breast is around 10 MHz, for gynecology is 5 MHz or greater, and for intracavity probes is 5 MHz or greater [46,48]. MRI on the other hand, can utilize a frequency range of 1 MHz to 300 MHz [45,47]. The following work involves the fabrication of ZnO-Graphene-Epoxy nanocomposite and flexible thin films and their dielectric and electric property spectrum characterization at a frequency range of 20 Hz to 10 MHz. The microstructural properties of the nanocomposites are also analyzed using scanning electron microscopy.
2. Methodology and Procedure
The ZnO particles were purchased from Alfa Aesar, and graphene nanoplatelets were purchased from Cheap Tubes Inc. The ZnO particle size varied from 40 nm to 100 nm, while the graphene nanoplatelets are 2 by 2 µm in a cross-sectional area, with a specific surface area of 500–700 m2/g. The ZnO-Graphene-Epoxy nanocomposites were fabricated with a constant graphene volume fraction (VF) at 10% (or 0.1), while the VF of the ZnO phase was varied from 10–70% (or 0.1–0.7). For each VF, the required quantity of ZnO was measured and added to the required amount of ethanol in a beaker. The beaker was sealed using parafilm, and the ZnO-ethanol mixture was sonicated for 15 min. The Graphene nanoplatelets were sonicated in a separate beaker in ethanol for 15 min. Afterwards, the required quantity of graphene was measured and added to the beaker, and then sonicated for 15 min. After sonication, the required amount of epoxy resin was measured and added to the beaker and then sonicated for 1 h. The required amount of epoxy hardener was measured and added to the beaker and then sonicated for 30 min. The schematic of the fabrication procedure is shown in Figure 3 and the quantities used for each material are presented in Table 2.
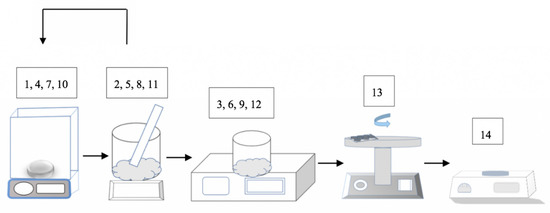
Figure 3.
Fabrication procedure schematic: (1) measurement of ZnO nanoparticles, (2) addition of ZnO nanoparticles and ethanol to a beaker, (3) Sonication for 15 min, (4) measurement of Graphene nanoplatelets, (5) addition of Graphene nanoplatelets to the beaker, (6) Sonication for 15 min, (7) measurement of epoxy resin, (8) addition of epoxy resin to the beaker, (9) Sonication for 1 h, (10) measurement of epoxy hardener, (11) addition of epoxy hardener to the beaker, (12) Sonication for 30 min, (13) spin-coating of the sample on stainless-steel substrate, (14) curing of the sample on a hot plate at 75 °C for 10 h.
Table 2.
Quantities of ZnO, graphene, epoxy resin, and epoxy hardener based on the volume fraction (VF) of ZnO.
After sonication, the solution was poured on a flexible stainless-steel substrate of dimensions 24 mm × 24 mm × 100 µm. The solution was then spin-coated from 200 rpm to 800 rpm increasing the rpm in steps of 200 every 30 s. The sample was spin-coated at 800 rpm for 1 min before gradually decreasing the rpm in the same manner. Then, the sample was cured at 75 °C for 10 h. The electric and dielectric properties of the nanocomposite samples were tested using Keysight E4990A impedance analyzer over a frequency range of 20 Hz to 10 MHz. VEGA3; TESCAN Scanning electron microscope was used to analyze the microstructural properties and cross-section of the thin films.
3. Results and Discussion
The fabricated composite samples are shown in Figure 4. The total average thickness of the samples along with the flexible stainless steel substrate is ~115.38 µm. The nanocomposite thin film is shown in Figure 4a with a copper electrode, and the flexibility of the nanocomposite thin films is shown in Figure 4b. It shows that the samples can withstand a 90° bend without any fracture. The cross-section of the composite sample is shown in Figure 5a. The average thickness of the composite samples shown was measured to be 15.38 µm. Figure 5b shows the ZnO and Graphene nanoplatelets agglomerations, where the larger clusters represent the ZnO particles and the smaller clusters represent the Graphene nanoplatelets.
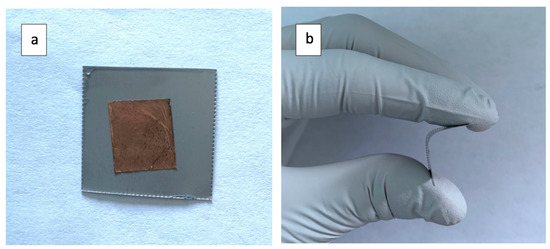
Figure 4.
(a) Final fabricated flexible nanocomposite thin film, (b) 90° bend (showing the flexibility).
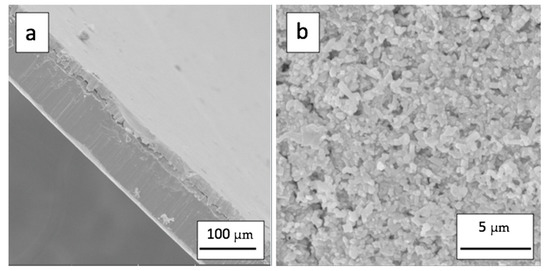
Figure 5.
(a) SEM images of the cross-section of the nanocomposite thin film, (b) SEM micrograph of the fractured surface of ZnO and Graphene nanoplatelets agglomerations appear in SEM image for ZnO VF of 0.6.
The results for the electric and dielectric characterization are shown in Figure 6, Figure 7, Figure 8 and Figure 9. It can be seen that the capacitance, dielectric constant, and impedance decreased as the frequency increased from 20 Hz to 10 MHz, whereas the conductivity increased as the frequency increased. These relationships were consistent for all the VFs of ZnO. This can be attributed to the different regimes of electron transport and polarization at different ranges of frequencies [37]. At the lower frequencies, space charges are the dominant phenomenon for electron transport and Graphene nanoplatelet clusters and agglomerations play a major role in enhancing electron mobility in the nanocomposite [37]. When the frequency reaches the megahertz range, the anisotropic nature of the ZnO wurtzite structure further contributes to the increase in the electron mobility by localized dipoles [33]. This also reduces electron scattering in the insulative epoxy matrix due to additional electron transport regimes. The capacitance, conductance, and the dielectric constant spectrum is presented in Figure 6, Figure 7 and Figure 8. The capacitance and impedance for two-phase, ZnO-Epoxy composites were also measured for comparison with the ZnO-Epoxy-Graphene, three-phase composites. The capacitance varied from 1.5 to 4 pF for a change in ZnO VF range from 0.1–0.7 at a frequency of 1 MHz. The impedance of these composites ranged from 600 kΩ to 100 kΩ for a variation in ZnO VF from 0.1–0.7 at the same frequency.
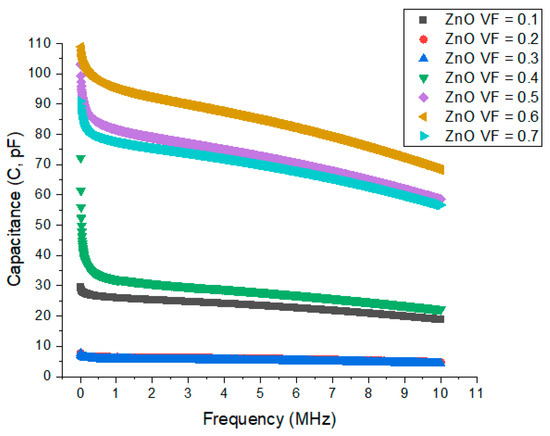
Figure 6.
Variation of the Capacitance spectrum for the nanocomposite samples for different volume fractions of ZnO with a change of frequency from 20 Hz–20 MHz.
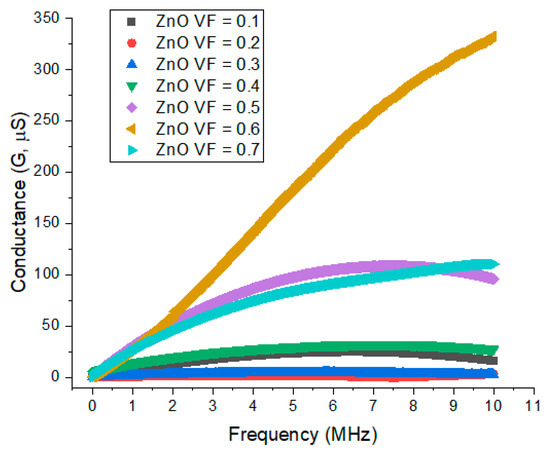
Figure 7.
Variation of the Conductance spectrum for the nanocomposite samples for different volume fractions of ZnO with a change of frequency from 20 Hz–20 MHz.
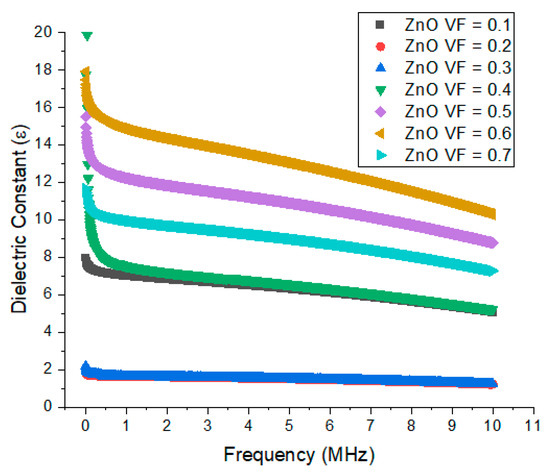
Figure 8.
Variation of the Dielectric Constant spectrum for the nanocomposite samples for different volume fractions of ZnO with a change of frequency from 20 Hz–20 MHz.
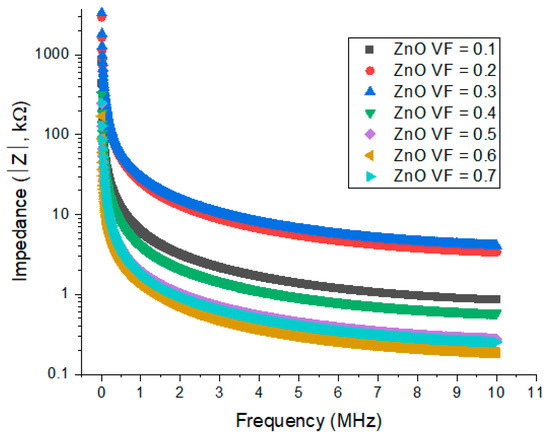
Figure 9.
Variation of the Impedance spectrum for the nanocomposite samples for different volume fractions of ZnO with a change of frequency from 20 Hz–20 MHz.
With an increasing frequency and the activation of multiple electron transport regimes, electron mobility is enhanced, which leads to the lowering of the storage capacity. As a result, it is expected that conductivity increases with the increasing frequency, which is supported by the capacitance, conductance, and the dielectric constant spectrum shown in Figure 6, Figure 7 and Figure 8. Additionally, it is expected that the capacitance and impedance would decrease with the increasing frequency. The dielectric constant can be obtained by Equation (1) [33]:
where ϵ is the dielectric constant, is the relative complex permittivity, is the permittivity of vacuum, is the frequency of oscillation of the electric field, and is the conductivity. Based on this relationship, the dielectric constant is proportional to conductivity (for a constant frequency) and inversely proportional to the frequency of oscillation.
As seen in Figure 8, that dielectric constant decreased with increasing frequency. This is because the frequency of oscillation has a greater effect on the dielectric constant than conductivity. Figure 6 shows that at a frequency of 1 MHz the Capacitance decreased from 26.00 pF to 6.38 pF, and 5.7 pF for a change in the VF of ZnO from 0.1 to 0.2 and 0.3 respectively. For an increase in the VF of ZnO > 0.3, the capacitance increases to 32.05 pF, 81.53 pF, 95.00 pF from ZnO VF of 0.4, 0.5, and 0.6 respectively. The capacitance value for a ZnO VF of 0.7 decreased to 77.64 pF. The trends are similar for other frequencies as well. The dielectric constant values as shown in Figure 8 also follow a similar trend. They decrease from 7.00 to 1.64, and 1.62 for ZnO VFs of 0.1, 0.2, and 0.3 respectively. The dielectric constant increases again to 7.54, 12.22, and 14.81 for ZnO VFs of 0.4, 0.5, and 0.6. Similar to the capacitance trend, the dielectric constant for a ZnO VF of 0.7 drops to 9.95. Similarly, conductance drops from 6.64 µS at a ZnO VF of 0.1 to 0.9 µS, and 1.65 µS for VFs of 0.2 and 0.3 respectively. The conductance then jumps back up 13.75 for a ZnO VF of 0.4 and increases to 30.14 µS for VF of 0.5. The conductance then decreases to 24.76 µS for a VF of 0.7. The general trend for most of the spectrum is a decrease in the conductance from 0.1 to 0.3 ZnO VF, followed by an increase from 0.4 to 0.6, and a drop in the values for a VF of 0.7.
The inclusion of graphene nanoplatelets increased the conductivity of the composite through 2D electron transfer. Additionally, with the increase in ZnO VF from 0.3 to 0.6, the conductance improves as there is more electron hopping and direct-contact electron transport (via graphene nanoplatelets). In addition, the capacitance is also improved, while the impedance of the composite decreases. As seen from Equation (1), dielectric constant and conductivity have a proportional relationship. This trend is followed by the experimental data as seen in Figure 8, the dielectric constant increases as the VF increase from 0.3 to 0.6, matching the trend of conductance. On the other hand, for ZnO VF > 0.6, the increase in the number of contact points reaches a saturation limit. As a result, the conductance decreases, and consequently, the capacitance and dielectric constant decreases, whereas the impedance increases.
Figure 9 shows the impedance spectrum, , over the frequency range of 20 Hz to 10 MHz. Figure 10, shows the Nyquist plot for the real (Z′) and imaginary (Z″) parts of the impedance over the same frequency range. The real and imaginary parts of the impedance spectrum correspond to the change in resistance and reactance of the samples with a change in frequency. At a frequency of 1 MHz, the impedance values increase from 6.17 kΩ at a ZnO VF of 0.1 to 25.24 kΩ and 39.93 kΩ for VFs of 0.2, and 0.3. With an increase in VF to 0.4 and 0.5, the impedance values decrease to 3.97 kΩ, and 1.3 kΩ respectively. The impedance then increases again to 1.85 kΩ for a ZnO VF of 0.7. This trend supports ZnO VF-based variation of the capacitance, conductance, and dielectric constant spectrum.
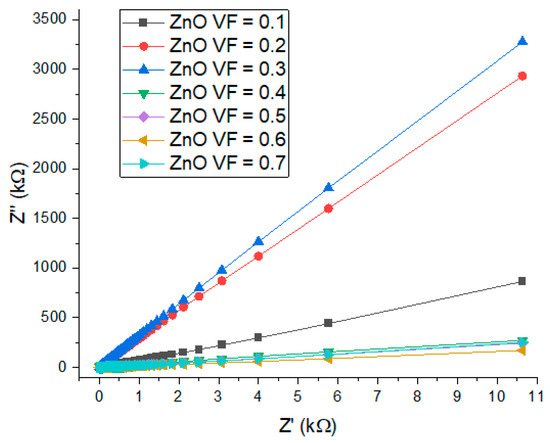
Figure 10.
Nyquist plot for the composite samples for each volume fraction of ZnO with a change of frequency from 20 Hz–20 MHz.
The Nyquist plot in Figure 10 shows that the slope of the plot increases with a VF increase from 0.1 to 0.3. The slope then decreases to the lowest value at a ZnO VF of 0.6 and then jumps back up for a VF of 0.7. The change in Z′ shows that the range of variation of the resistance remains similar for all the ZnO VFs for the same frequency range. The maximum value for Z′ for all the VFs is around 10.6 kΩ. The Z″ values, on the other hand, increase from around 620 kΩ to 2750 kΩ and 3300 kΩ for ZnO VFs of 0.1, 0.2, and 0.3 respectively. The maximum Z″ values then decrease with an increase in ZnO VF from 0.4 to 0.6. The maximum c value at a VF decreases to a minimum value of around 450 kΩ at a VF of 0.6 and then jumps back again to an around 500 kΩ for an increase in ZnO Vf to 0.7. This indicates a change in the effect of the Graphene nanoplatelet agglomerations and the ZnO clusters in the microstructure.
At the lower VFs, the increase in the ZnO VF leads to an increase in Z″ values due to the encapsulation of localized Graphene percolation pathways with the ZnO clusters. Beyond a ZnO VF of 0.3, electron transport is increased through the increased surface area of the ZnO clusters which enhanced the electron mobility through electron hopping and direct-contact electron transport mechanisms [33]. With an increase in the VF to 0.7, an increase the Z″ values and a drop in the conductivity values points to the increased contact resistance between the different ZnO clusters and also the insulative epoxy matrix which leads to a lower dielectric constant and adversely affects the direct-contact electron transport mechanism [33]. Figure 11 shows the SEM images for the surface of the composite with ZnO VF of 0.4, 0.6, and 0.7 respectively. It can be seen from that with increasing ZnO VF, the surface microstructure morphology shows less porosity due to an increase in the number of ZnO clusters and their size.
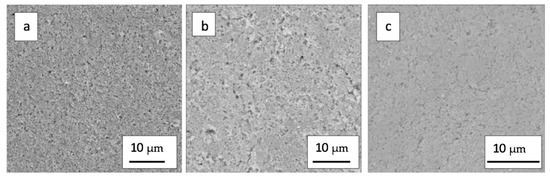
Figure 11.
SEM images of the surface of the nanocomposite thin films with ZnO volume fractions of (a) 0.4, (b) 0.6, and (c) 0.7.
The change in electrical and dielectric properties based on the frequency change represents the electron transport and high sensitivity property of the fabricated composite. These properties were tested over both a low (10 Hz–1 MHz) and a high-frequency (1 MHz–10 MHz) range. As a result of an increase in conductance with an increase in frequency, the signal-to-noise ratio would decrease. Based on these properties, the composite can be potentially utilized for either low- or high-frequency biomedical applications. For low-frequency applications, the composite can be incorporated in monitoring devices for sensing glucose, cancer cells, or cytochrome c. Similarly, in high-frequency applications, the composite can be utilized in ultrasound imaging or MRI. These properties can further be tailored based on the specific application by changing the VF of ZnO.
4. Conclusions
In the present work, three-phase, lead-free, ZnO-Graphene-Epoxy electroactive composite thin films were fabricated for the use of stacked biomedical wearable devices. The sensitivity and electron transport property of the composite could be potentially utilized in biomedical applications such as monitoring devices for glucose, cytochrome c, and cancer cells. It could also be applied in high-frequency applications like ultrasound imaging or MRI. Based on the characterization of these composites, it is indicated that they can help to tailor and reduce the signal-to-noise ratio in biosensors through the modification of the microstructural properties of these nanocomposite thin films. The volume fraction of ZnO was varied from 0.1–0.7, while the volume fraction of graphene was kept constant at 0.1. The results showed that the conductivity of the composite increased as the frequency was increased from 20 Hz to 10 MHz, whereas capacitance, dielectric constant, and impedance decreased with the increasing frequency. The experimental results also showed that for volume fractions 0.3–0.6, the conductance, dielectric constant, and capacitance increased with an increase in the volume fraction of ZnO, while the impedance decreased. SEM images of the surface of the composite also supported this trend. For a volume fraction greater than 0.6, the contact points reached a transition and the electron transport is affected by the increase of contact resistance, and thus the conductance and capacitance decreased, while the impedance increased.
Author Contributions
Conceptualization, M.S., D.S., S.A., S.C., and S.B.; methodology, M.S., S.K., Y.C., and S.B.; software, M.S., and S.B.; validation, M.S., S.K., S.Z., D.S., and S.B.; formal analysis, M.S., S.K., and S.B.; investigation, M.S., S.K., S.Z., Y.C., S.A., and S.B.; resources, S.A., and S.B.; data curation, M.S., S.K., and S.B.; writing—original draft preparation, M.S., and S.B.; writing—review and editing, M.S., S.Z., D.S., S.C., S.A., and S.B.; visualization, M.S., S.Z., and S.B.; supervision, D.S., S.A., S.C., and S.B.; project administration, S.A., and S.B.; funding acquisition, S.B. All authors have read and agreed to the published version of the manuscript.
Funding
This research was funded and supported by the Department of Defense, Southern California Edison, and the Lyles College of Engineering Graduate Sponsorship Program.
Acknowledgments
The authors would like to acknowledge the technical support provided by the Lyles College of Engineering, and the facilities provided by the Jordan Agricultural Research Center at California State University, Fresno.
Conflicts of Interest
The authors declare no conflict of interest.
References
- Jena, A.K.; Kulkarni, A.; Miyasaka, T. Halide Perovskite Photovoltaics: Background, Status, and Future Prospects. Chem. Rev. 2019, 119, 3036–3103. [Google Scholar] [CrossRef] [PubMed]
- Pham, M.; Harris, J.; Shaffer, J.; Daniel, A.; Chowdhury, S.; Ali, A.; Banerjee, S.; Ahmed, S. Bismuth perovskite as a viable alternative to Pb perovskite solar cells: Device simulations to delineate critical efficiency dynamics. J. Mater. Sci. Mater. Electron. 2019, 30, 9438–9443. [Google Scholar] [CrossRef]
- Li, X.; Wang, J. Effect of grain size on the domain structures and electromechanical responses of ferroelectric polycrystal. Smart Mater. Struct. 2016, 26, 015013. [Google Scholar] [CrossRef]
- Mokrý, P.; Psota, P.; Steiger, K.; Václavík, J.; Doleček, R.; Vápenka, D.; Lédl, V. Ferroelectric domain pattern in barium titanate single crystals studied by means of digital holographic microscopy. J. Phys. D Appl. Phys. 2016, 49, 255307. [Google Scholar] [CrossRef]
- Yuan, Y.; Xiao, Z.; Yang, B.; Huang, J. Arising applications of ferroelectric materials in photovoltaic devices. J. Mater. Chem. A 2014, 2, 6027–6041. [Google Scholar] [CrossRef]
- Babayigit, A.; Ethirajan, A.; Muller, M.; Conings, B. Toxicity of organometal halide perovskite solar cells. Nat. Mater. 2016, 15, 247–251. [Google Scholar] [CrossRef]
- Turkevych, I.; Kazaoui, S.; Ito, E.; Urano, T.; Yamada, K.; Tomiyasu, H.; Yamagishi, H.; Kondo, M.; Aramaki, S. Photovoltaic Rudorffites: Lead-Free Silver Bismuth Halides Alternative to Hybrid Lead Halide Perovskites. ChemSusChem 2017, 10, 3754–3759. [Google Scholar] [CrossRef]
- Takei, K.; Takahashi, T.; Ho, J.C.; Ko, H.; Gillies, A.G.; Leu, P.W.; Fearing, R.S.; Javey, A. Nanowire active-matrix circuitry for low-voltage macroscale artificial skin. Nat. Mater. 2010, 9, 821–826. [Google Scholar] [CrossRef]
- Pang, C.; Lee, C.; Suh, K.Y. Recent advances in flexible sensors for wearable and implantable devices. J. Appl. Polym. Sci. 2013, 130, 1429–1441. [Google Scholar] [CrossRef]
- Fan, Z.; Ho, J.C.; Jacobson, Z.A.; Razavi, H.; Javey, A. Large-scale, heterogeneous integration of nanowire arrays for image sensor circuitry. Natl. Acad. Sci. 2008, 105, 11066–11070. [Google Scholar] [CrossRef]
- Abiri, H.; Abdolahad, M.; Gharooni, M.; Ali Hosseini, S.; Janmaleki, M.; Azimi, S.; Hosseini, M.; Mohajerzadeh, S. Monitoring the spreading stage of lung cells by silicon nanowire electrical cell impedance sensor for cancer detection purposes. Biosens. Bioelectron. 2015, 68, 577–585. [Google Scholar] [CrossRef] [PubMed]
- Yamada, T.; Hayamizu, Y.; Yamamoto, Y.; Yomogida, Y.; Izadi-Najafabadi, A.; Futaba, D.N.; Hata, K. A stretchable carbon nanotube strain sensor for human-motion detection. Nat. Nanotechnol. 2011, 6, 296. [Google Scholar] [CrossRef] [PubMed]
- Wang, Y.; Xiao, Y.; Ma, X.; Li, N.; Yang, X. Label-free and sensitive thrombin sensing on a molecularly grafted aptamer on graphene. Chem. Commun. 2012, 48, 738–740. [Google Scholar] [CrossRef]
- Kurkina, T.; Vlandas, A.; Ahmad, A.; Kern, K.; Balasubramanian, K. Label-Free Detection of Few Copies of DNA with Carbon Nanotube Impedance Biosensors. Angew. Chem. Int. Ed. Engl. 2011, 50, 3710–3714. [Google Scholar] [CrossRef] [PubMed]
- Ocaña, C.; Arcay, E.; del Valle, M. Label-free impedimetric aptasensor based on epoxy-graphite electrode for the recognition of cytochrome c. Sens. Actuators B Chem. 2014, 191, 860–865. [Google Scholar] [CrossRef]
- Ahmad, M.; Pan, C.; Luo, Z.; Zhu, J. A Single ZnO Nanofiber-Based Highly Sensitive Amperometric Glucose Biosensor. J. Phys. Chem. C 2010, 114, 9308–9313. [Google Scholar] [CrossRef]
- SoYoon, S.; Ramadoss, A.; Saravanakumar, B.; Kim, S.J. Novel Cu/CuO/ZnO hybrid hierarchical nanostructures for non-enzymatic glucose sensor application. J. Electroanal. Chem. 2014, 717, 90–95. [Google Scholar] [CrossRef]
- Wu, W.; Miao, F.; Tao, B.; Zang, Y.; Zhu, L.; Shi, C.; Chu, P.K. Hybrid ZnO–graphene electrode with palladium nanoparticles on Ni foam and application to self-powered nonenzymatic glucose sensing. RSC Adv. 2019, 9, 12134–12145. [Google Scholar] [CrossRef]
- Selvarajan, S.; Suganthi, A.; Rajarajan, M. A facile synthesis of ZnO/Manganese hexacyanoferrate nanocomposite modified electrode for the electrocatalytic sensing of riboflavin. J. Phys. Chem. Solids 2018, 121, 350–359. [Google Scholar] [CrossRef]
- Felix, S.; Kollu, P.; Grace, A.N. Electrochemical performance of Ag–CuO nanocomposites towards glucose sensing. Mater. Res. Innov. 2019, 23, 27–32. [Google Scholar] [CrossRef]
- Wu, J.; Yin, F. Easy fabrication of a sensitive non-enzymatic glucose sensor based on electrospinning CuO-ZnO nanocomposites. Integr. Ferroelectr. 2013, 147, 47–58. [Google Scholar] [CrossRef]
- Yamabi, S.; Imai, H. Growth conditions for wurtzite zinc oxide films in aqueous solutions. J. Mater. Chem. 2002, 12, 3773–3778. [Google Scholar] [CrossRef]
- Beek, W.J.; Wienk, M.M.; Janssen, R.A. Efficient hybrid solar cells from zinc oxide nanoparticles and a conjugated polymer. Adv. Mater. 2004, 16, 1009–1013. [Google Scholar] [CrossRef]
- Ellmer, K. Resistivity of polycrystalline zinc oxide films: Current status and physical limit. J. Phys. D Appl. Phys. 2001, 34, 3097–3108. [Google Scholar] [CrossRef]
- Hatamie, A.; Khan, A.; Golabi, M.; Turner, A.P.F.; Beni, V.; Mak, W.C.; Sadollahkhani, A.; Alnoor, H.; Zargar, B.; Bano, S.; et al. Zinc Oxide Nanostructure-Modified Textile and Its Application to Biosensing, Photocatalysis, and as Antibacterial Material. Langmuir 2015, 31, 10913–10921. [Google Scholar] [CrossRef]
- Palanchoke, U.; Kurz, H.; Noriega, R.; Arabi, S.; Jovanov, V.; Magnus, P.; Aftab, H.; Salleo, A.; Stiebig, H.; Knipp, D. Tuning the plasmonic absorption of metal reflectors by zinc oxide nano particles: Application in thin film solar cells. Nano Energy 2014, 6, 167–172. [Google Scholar] [CrossRef]
- Saravanan, M.; Dhivakar, S.; Jayanthi, S.S. An eco friendly and solvent free method for the synthesis of Zinc oxide nano particles using glycerol as organic dispersant. Mater. Lett. 2012, 67, 128–130. [Google Scholar] [CrossRef]
- Tuoc, V.N.; Huan, T.D.; Thao, N.T. Computational predictions of zinc oxide hollow structures. Phys. B Condens. Matter 2018, 532, 15–19. [Google Scholar] [CrossRef]
- Znajdek, K.; Sibiński, M.; Lisik, Z.; Apostoluk, A.; Zhu, Y.; Masenelli, B.; Sędzicki, P. Zinc oxide nanoparticles for improvement of thin film photovoltaic structures’ efficiency through down shifting conversion. Opto-Electron. Rev. 2017, 25, 99–102. [Google Scholar] [CrossRef]
- Bowland, C.C.; Malakooti, M.H.; Sodano, H.A. Barium titanate film interfaces for hybrid composite energy harvesters. ACS Appl. Mater. Interfaces 2017, 9, 4057–4065. [Google Scholar] [CrossRef]
- Nunes-Pereira, J.; Sencadas, V.; Correia, V.; Rocha, J.G.; Lanceros-Mendez, S. Energy harvesting performance of piezoelectric electrospun polymer fibers and polymer/ceramic composites. Sens. Actuators A Phys 2013, 196, 55–62. [Google Scholar] [CrossRef]
- Park, J.-I.; Lee, G.-Y.; Yang, J.; Kim, C.-S.; Ahn, S.-H. Flexible ceramic-elastomer composite piezoelectric energy harvester fabricated by additive manufacturing. J. Compos. Mater. 2016, 50, 1573–1579. [Google Scholar] [CrossRef]
- Tuff, W.; Manghera, P.; Tilghman, J.; Fossen, E.; Chowdhury, S.; Ahmed, S.; Banerjee, S. BaTiO 3 –Epoxy–ZnO-Based Multifunctional Composites: Variation in Electron Transport Properties due to the Interaction of ZnO Nanoparticles with the Composite Microstructure. J. Electron. Mater. 2019, 48, 4987–4996. [Google Scholar] [CrossRef]
- Lee, J.; Kim, G. Electronic properties of a graphene/periodic porous graphene heterostructure. Carbon 2017, 122, 281–286. [Google Scholar] [CrossRef]
- Zaminpayma, E.; Razavi, M.E.; Nayebi, P. Electronic properties of graphene with single vacancy and Stone-Wales defects. Appl. Surf. Sci. 2017, 414, 101–106. [Google Scholar] [CrossRef]
- Mukherjee, M.; Mukherjee, S.; Kumar, R.; Shunmugam, R. Improved thermal and mechanical properties of polynorbornene upon covalent attachment with graphene sheets. Polymer 2017, 123, 321–333. [Google Scholar] [CrossRef]
- Papageorgiou, D.G.; Kinloch, I.A.; Young, R.J. Mechanical properties of graphene and graphene-based nanocomposites. Prog. Mater. Sci. 2017, 90, 75–127. [Google Scholar] [CrossRef]
- Ouadil, B.; Cherkaoui, O.; Safi, M.; Zahouily, M. Surface modification of knit polyester fabric for mechanical, electrical and UV protection properties by coating with graphene oxide, graphene and graphene/silver nanocomposites. Appl. Surf. Sci. 2017, 414, 292–302. [Google Scholar] [CrossRef]
- Anirudhan, T.; Deepa, J. Nano-zinc oxide incorporated graphene oxide/nanocellulose composite for the adsorption and photo catalytic degradation of ciprofloxacin hydrochloride from aqueous solutions. J. Colloid Interface Sci. 2017, 490, 343–356. [Google Scholar] [CrossRef]
- Banerjee, S.; Cook-Chennault, K.A. Influence of aluminium inclusions on dielectric properties of three-phase PZT–cement–aluminium composites. Adv. Cem. Res. 2014, 26, 63–76. [Google Scholar] [CrossRef]
- Guo, R.; Cross, L.; Park, S.; Noheda, B.; Cox, D.; Shirane, G. Origin of the high piezoelectric response in PbZr 1− x Ti x O 3. Phys. Rev. Lett. 2000, 84, 5423. [Google Scholar] [CrossRef]
- Qin, W.; Vautard, F.; Drzal, L.T.; Yu, J. Mechanical and electrical properties of carbon fiber composites with incorporation of graphene nanoplatelets at the fiber–matrix interphase. Compos. Part B Eng. 2015, 69, 335–341. [Google Scholar] [CrossRef]
- Kumar, S.; Ahlawat, W.; Kumar, R.; Dilbaghi, N. Graphene, carbon nanotubes, zinc oxide and gold as elite nanomaterials for fabrication of biosensors for healthcare. Biosens. Bioelectron. 2015, 70, 498–503. [Google Scholar] [CrossRef] [PubMed]
- Marlinda, A.R.; Huang, N.M.; Muhamad, M.R.; An’Amt, M.N.; Chang, B.Y.S.; Yusoff, N.; Harrison, I.; Lim, H.N.; Chia, C.H.; Kumar, S.V. Highly efficient preparation of ZnO nanorods decorated reduced graphene oxide nanocomposites. Mater. Lett. 2012, 80, 9–12. [Google Scholar] [CrossRef]
- Hartwig, V.; Giovannetti, G.; Vanello, N.; Lombardi, M.; Landini, L.; Simi, S. Biological effects and safety in magnetic resonance imaging: A review. Int. J. Environ. Res. Public Health 2009, 6, 1778–1798. [Google Scholar] [CrossRef]
- Lieu, D. Ultrasound physics and instrumentation for pathologists. Arch. Pathol. Lab. Med. 2010, 134, 1541–1556. [Google Scholar]
- McRobbie, D.W.; Moore, E.A.; Graves, M.J.; Prince, M.R. MRI from Picture to Proton; Cambridge University Press: Cambridge, UK, 2017. [Google Scholar]
- Szabo, T.L.; Lewin, P.A. Ultrasound transducer selection in clinical imaging practice. J. Ultrasound Med. 2013, 32, 573–582. [Google Scholar] [CrossRef] [PubMed]
© 2020 by the authors. Licensee MDPI, Basel, Switzerland. This article is an open access article distributed under the terms and conditions of the Creative Commons Attribution (CC BY) license (http://creativecommons.org/licenses/by/4.0/).